midterm injection phase results for the mrcsp large...
TRANSCRIPT
Neeraj Gupta
Mark Kelley
Lydia Cumming
Matt Place
Jacqueline Gerst
John Miller
Sanjay Mawalkar
Priya Ravi Ganesh
Midterm Injection Phase Results for the
MRCSP Large-Scale Test
CO2 EOR storage in a pinnacle reef
1Battelle, Columbus, OH; [email protected], 614-424-3820
IEAGHG Monitoring Network Meeting, Lawrence Berkeley, June 10th -12th, 2015
DOE/NETL Cooperative Agreement # DE-FC26-0NT42589
Fourteenth Annual Conference on Carbon Capture, Utilization & Storage
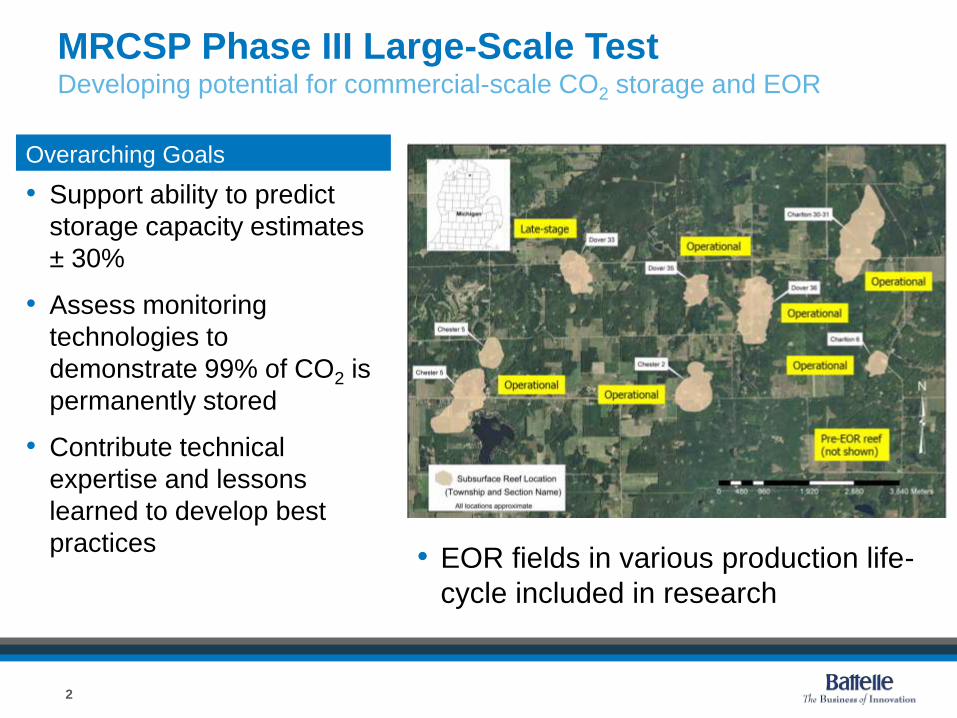
MRCSP Phase III Large-Scale Test Developing potential for commercial-scale CO2 storage and EOR
2
• Support ability to predict
storage capacity estimates
± 30%
• Assess monitoring
technologies to
demonstrate 99% of CO2 is
permanently stored
• Contribute technical
expertise and lessons
learned to develop best
practices
Overarching Goals
• EOR fields in various production life-
cycle included in research
Fourteenth Annual Conference on Carbon Capture, Utilization & Storage
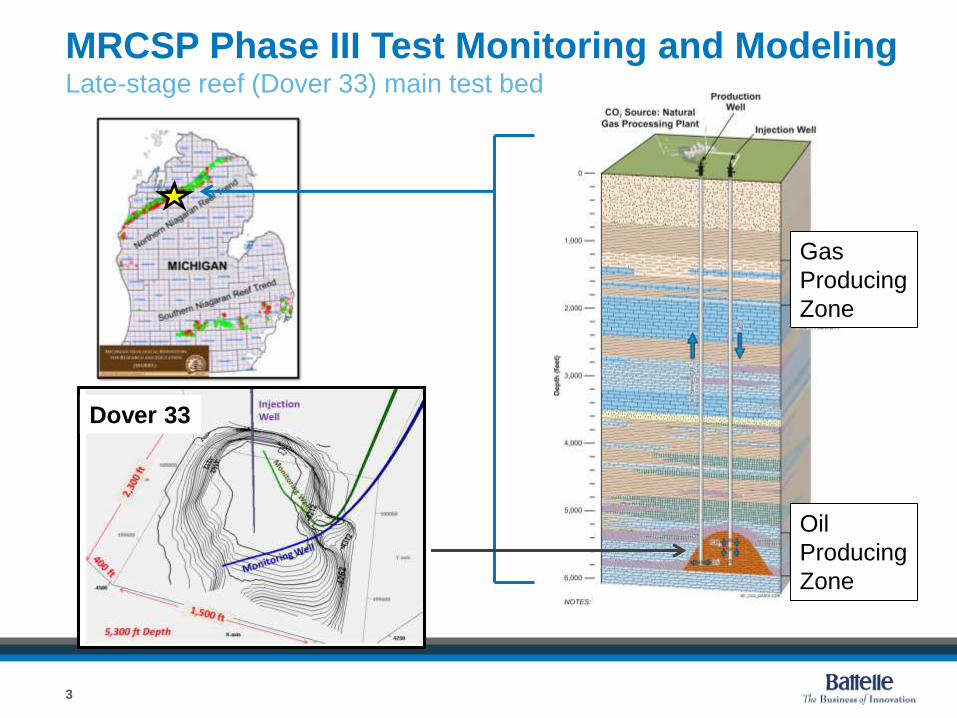
MRCSP Phase III Test Monitoring and Modeling Late-stage reef (Dover 33) main test bed
Gas
Producing
Zone
Oil
Producing
Zone
Dover 33
3
Fourteenth Annual Conference on Carbon Capture, Utilization & Storage
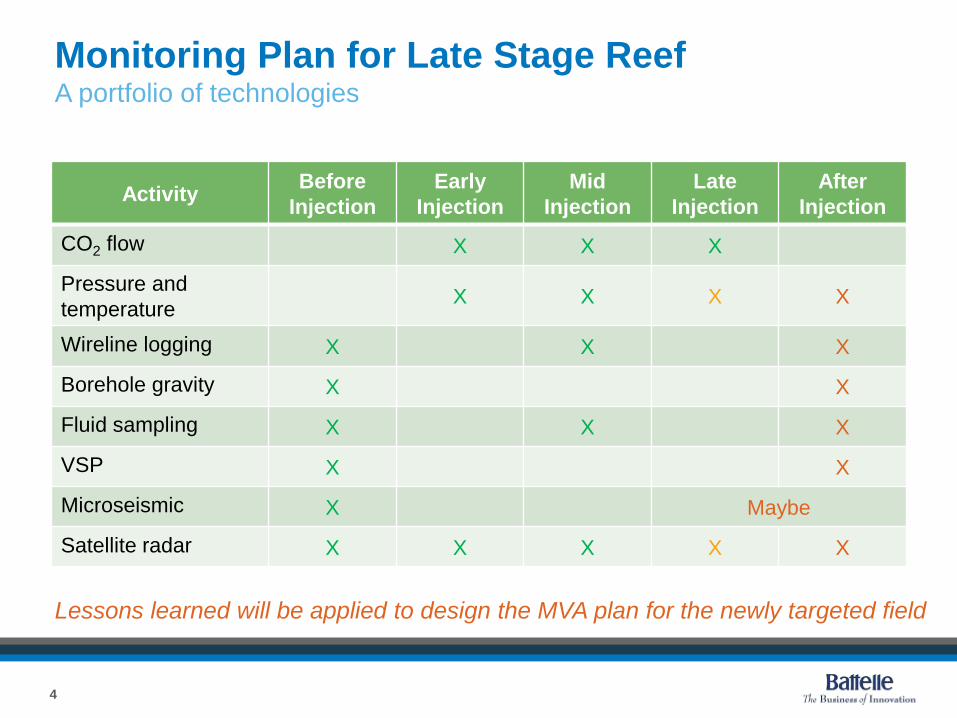
Monitoring Plan for Late Stage ReefA portfolio of technologies
4
Lessons learned will be applied to design the MVA plan for the newly targeted field
ActivityBefore
Injection
Early
Injection
Mid
Injection
Late
Injection
After
Injection
CO2 flow X X X
Pressure and
temperatureX X X X
Wireline logging X X X
Borehole gravity X X
Fluid sampling X X X
VSP X X
Microseismic X Maybe
Satellite radar X X X X X
Fourteenth Annual Conference on Carbon Capture, Utilization & Storage
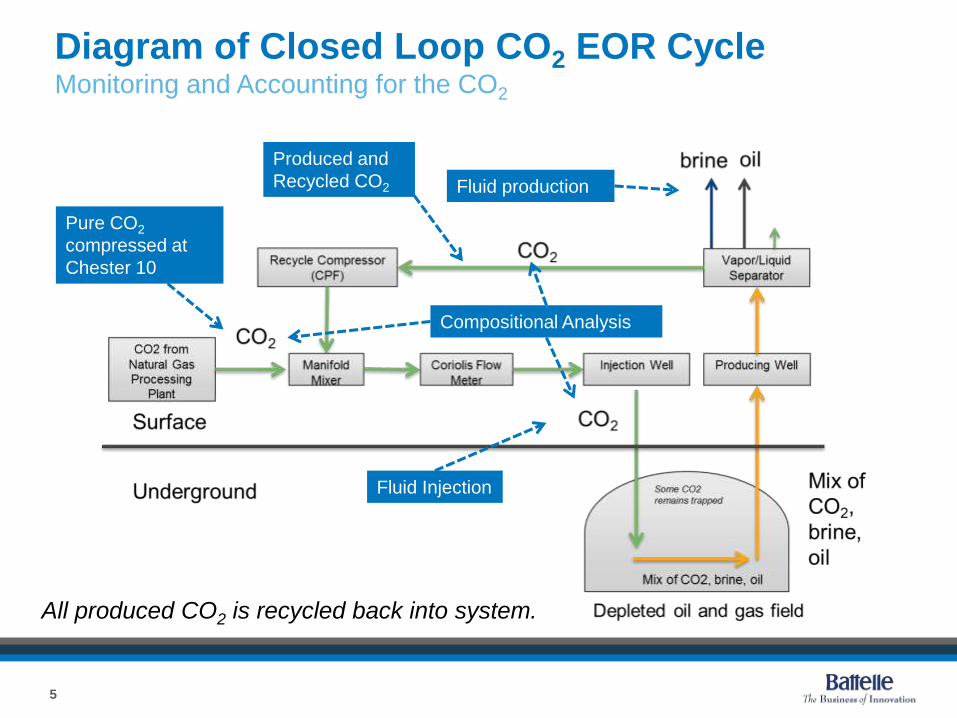
Diagram of Closed Loop CO2 EOR CycleMonitoring and Accounting for the CO2
5
Fluid production
Fluid Injection
Pure CO2
compressed at
Chester 10
Produced and
Recycled CO2
Compositional Analysis
All produced CO2 is recycled back into system.
Fourteenth Annual Conference on Carbon Capture, Utilization & Storage
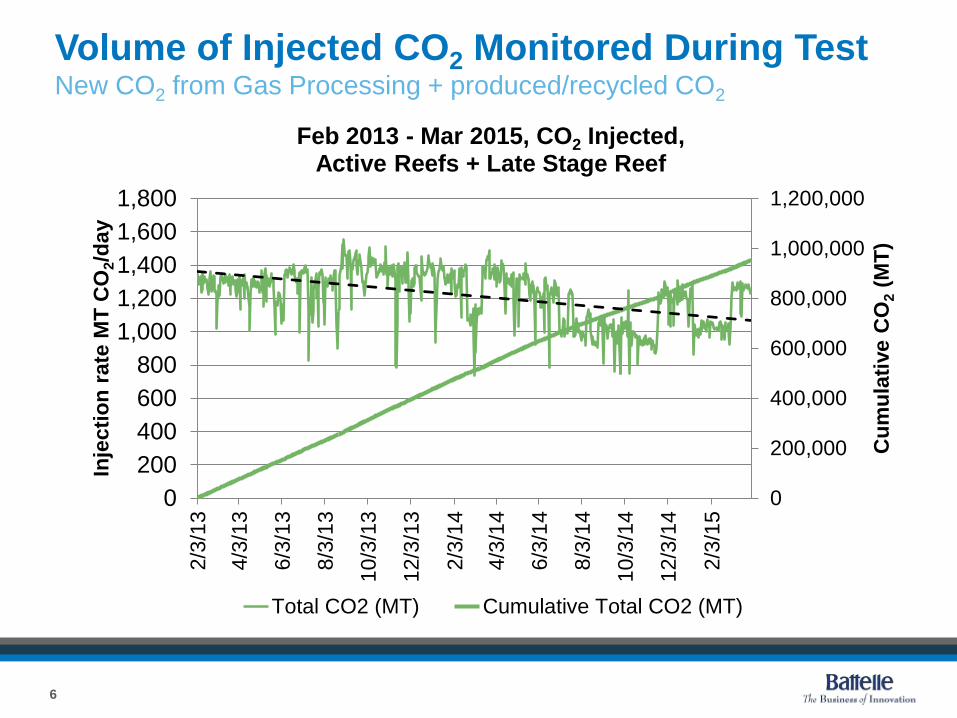
Volume of Injected CO2 Monitored During TestNew CO2 from Gas Processing + produced/recycled CO2
6
0
200,000
400,000
600,000
800,000
1,000,000
1,200,000
0
200
400
600
800
1,000
1,200
1,400
1,600
1,8002/3
/13
4/3
/13
6/3
/13
8/3
/13
10/3
/13
12/3
/13
2/3
/14
4/3
/14
6/3
/14
8/3
/14
10/3
/14
12/3
/14
2/3
/15
Cu
mu
lati
ve C
O2
(MT
)
Inje
cti
on
rate
MT
CO
2/d
ay
Feb 2013 - Mar 2015, CO2 Injected, Active Reefs + Late Stage Reef
Total CO2 (MT) Cumulative Total CO2 (MT)
Fourteenth Annual Conference on Carbon Capture, Utilization & Storage
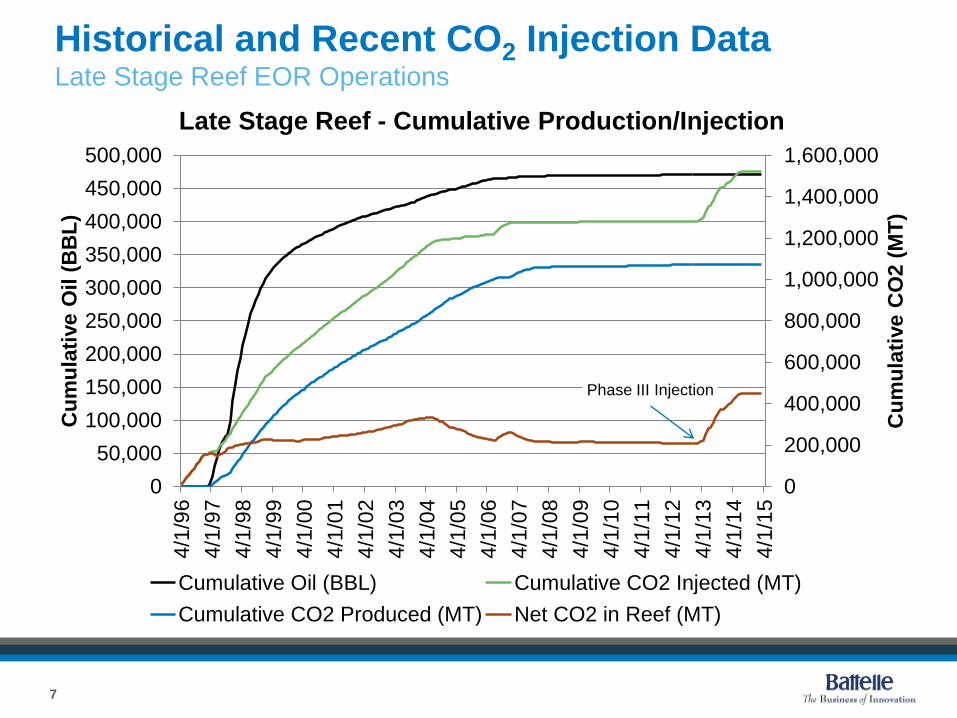
Historical and Recent CO2 Injection DataLate Stage Reef EOR Operations
7
0
200,000
400,000
600,000
800,000
1,000,000
1,200,000
1,400,000
1,600,000
0
50,000
100,000
150,000
200,000
250,000
300,000
350,000
400,000
450,000
500,000
4/1
/96
4/1
/97
4/1
/98
4/1
/99
4/1
/00
4/1
/01
4/1
/02
4/1
/03
4/1
/04
4/1
/05
4/1
/06
4/1
/07
4/1
/08
4/1
/09
4/1
/10
4/1
/11
4/1
/12
4/1
/13
4/1
/14
4/1
/15
Cu
mu
lati
ve C
O2 (
MT
)
Cu
mu
lati
ve O
il (
BB
L)
Late Stage Reef - Cumulative Production/Injection
Cumulative Oil (BBL) Cumulative CO2 Injected (MT)
Cumulative CO2 Produced (MT) Net CO2 in Reef (MT)
Phase III Injection
Fourteenth Annual Conference on Carbon Capture, Utilization & Storage
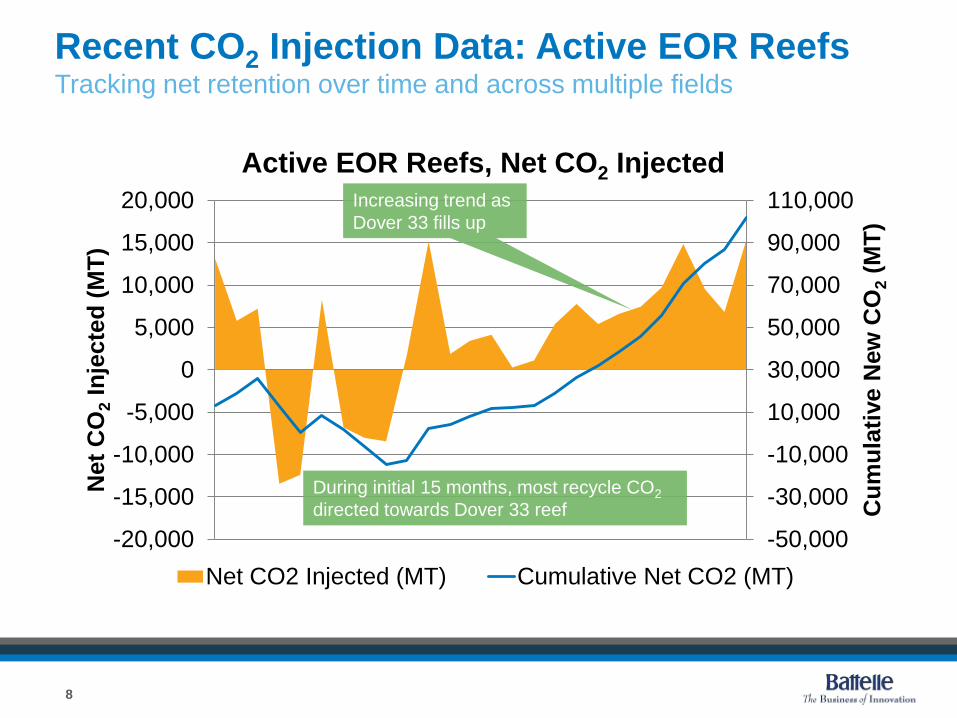
Recent CO2 Injection Data: Active EOR Reefs Tracking net retention over time and across multiple fields
8
-50,000
-30,000
-10,000
10,000
30,000
50,000
70,000
90,000
110,000
-20,000
-15,000
-10,000
-5,000
0
5,000
10,000
15,000
20,000
Cu
mu
lati
ve N
ew
CO
2(M
T)
Net
CO
2In
jecte
d (
MT
)
Active EOR Reefs, Net CO2 Injected
Net CO2 Injected (MT) Cumulative Net CO2 (MT)
During initial 15 months, most recycle CO2
directed towards Dover 33 reef
Increasing trend as
Dover 33 fills up
Fourteenth Annual Conference on Carbon Capture, Utilization & Storage
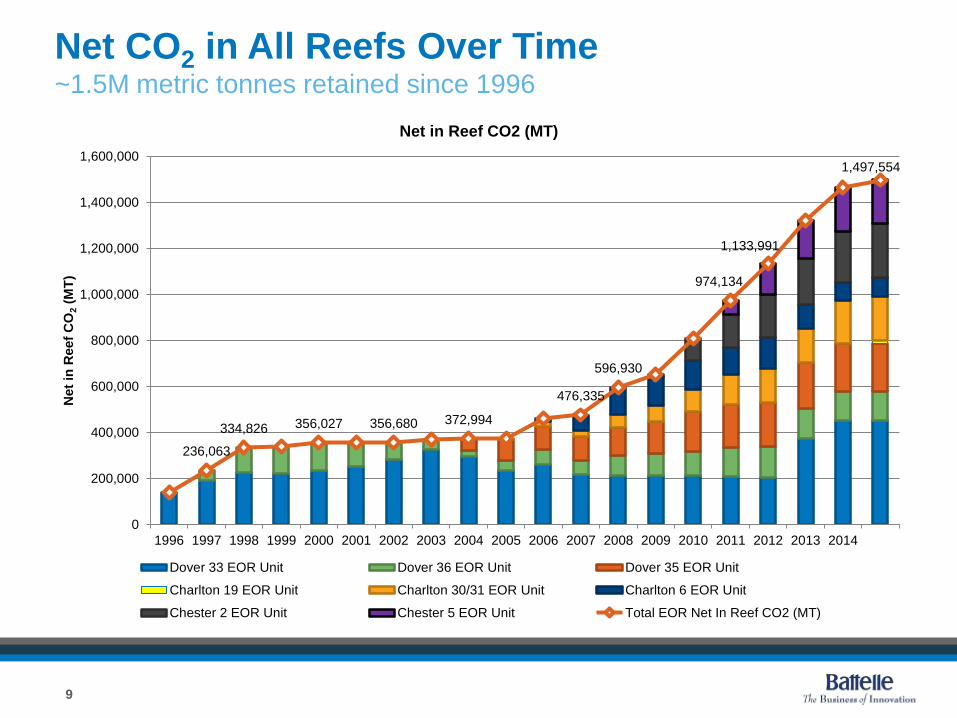
Net CO2 in All Reefs Over Time~1.5M metric tonnes retained since 1996
9
236,063
334,826 356,027 356,680 372,994
476,335
596,930
974,134
1,133,991
1,497,554
0
200,000
400,000
600,000
800,000
1,000,000
1,200,000
1,400,000
1,600,000
1996 1997 1998 1999 2000 2001 2002 2003 2004 2005 2006 2007 2008 2009 2010 2011 2012 2013 2014
Net
in R
eef
CO
2(M
T)
Net in Reef CO2 (MT)
Dover 33 EOR Unit Dover 36 EOR Unit Dover 35 EOR Unit
Charlton 19 EOR Unit Charlton 30/31 EOR Unit Charlton 6 EOR Unit
Chester 2 EOR Unit Chester 5 EOR Unit Total EOR Net In Reef CO2 (MT)
Fourteenth Annual Conference on Carbon Capture, Utilization & Storage
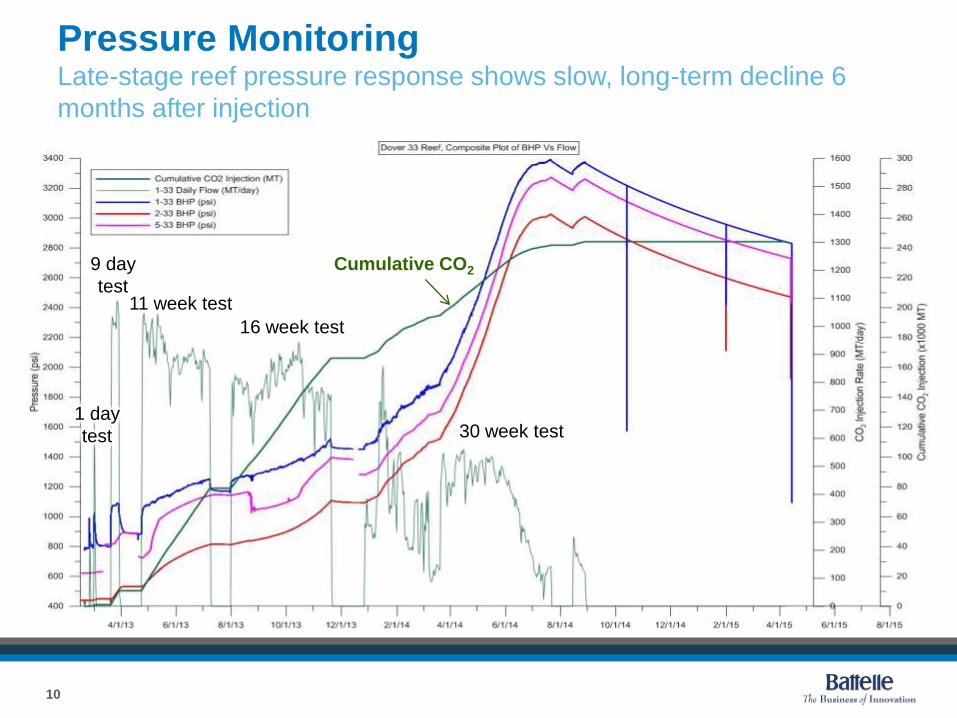
Pressure MonitoringLate-stage reef pressure response shows slow, long-term decline 6
months after injection
10
11 week test
1 day
test
16 week test
30 week test
Cumulative CO29 day
test

Fourteenth Annual Conference on Carbon Capture, Utilization & Storage
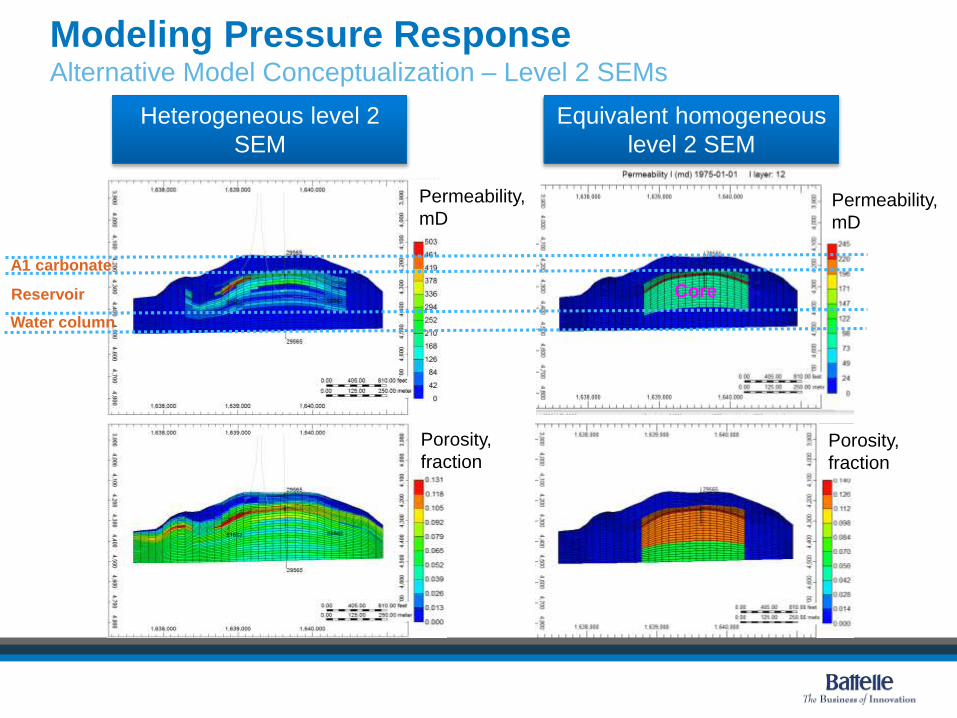
Modeling Pressure ResponseChallenging to match the entire field history
11
• Compositional model setup and
history match (for 1o and 2o
recovery) complete with latest
geologic model formulation
• Challenges with matching post
Jan-2014 pressure observations in
current CO2 injection schedule
• Alternative conceptualization
trials with compositional model to
match injection field observations
Heterogeneous Level 2 SEM
trials
Equivalent Homogeneous Level
2 SEM trials
Computational convenience for sensitivity
trials of history-matched models to match
MRCSP injection field observations
Fourteenth Annual Conference on Carbon Capture, Utilization & Storage
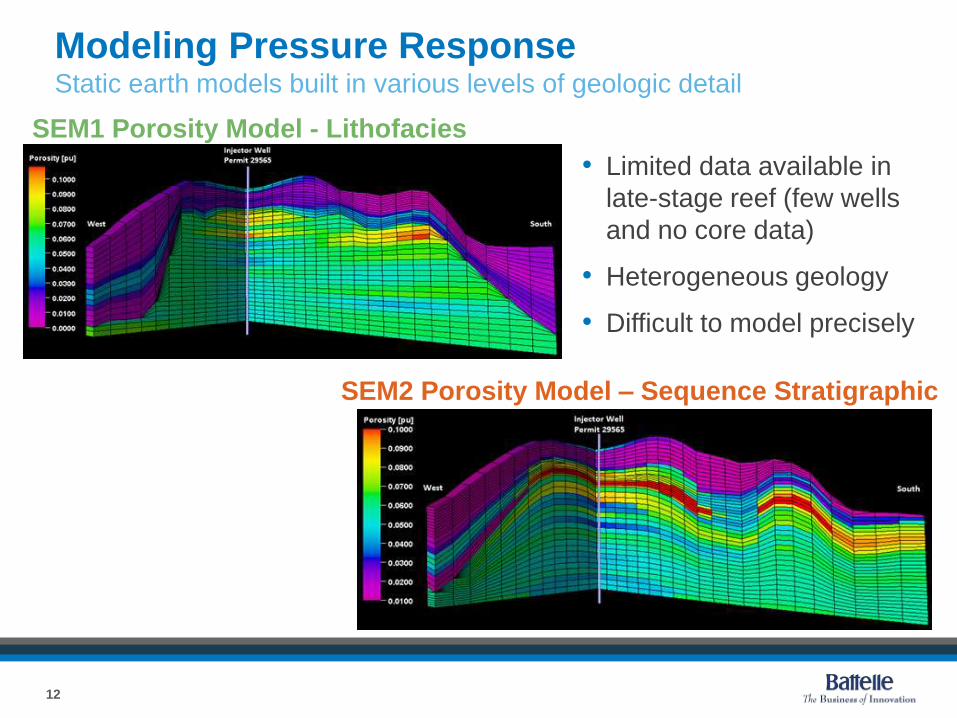
SEM1 Porosity Model - Lithofacies
SEM2 Porosity Model – Sequence Stratigraphic
12
• Limited data available in
late-stage reef (few wells
and no core data)
• Heterogeneous geology
• Difficult to model precisely
Modeling Pressure ResponseStatic earth models built in various levels of geologic detail
Fourteenth Annual Conference on Carbon Capture, Utilization & Storage13
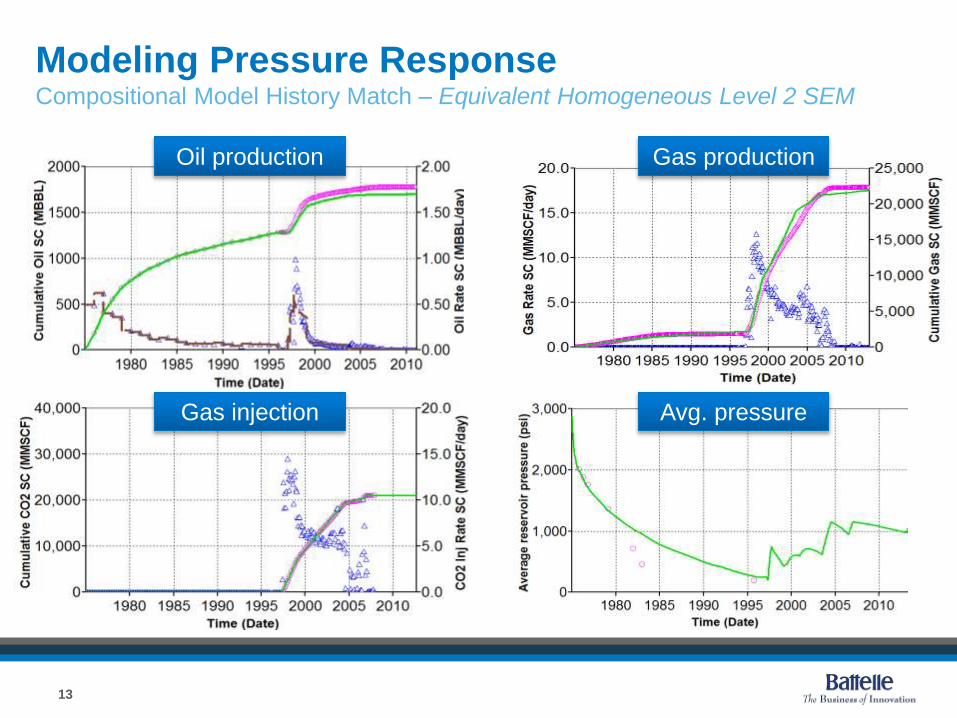
Oil production Gas production
Gas injection Avg. pressure
Modeling Pressure ResponseCompositional Model History Match – Equivalent Homogeneous Level 2 SEM
Fourteenth Annual Conference on Carbon Capture, Utilization & Storage
Permeability,
mD
Heterogeneous level 2
SEM
Equivalent homogeneous
level 2 SEM
Porosity,
fraction
Permeability,
mD
A1 carbonate
Reservoir
Water column
Core
Modeling Pressure ResponseAlternative Model Conceptualization – Level 2 SEMs
Porosity,
fraction

Fourteenth Annual Conference on Carbon Capture, Utilization & Storage15
Modeling Pressure Response (In Progress)Compositional Model MRCSP Injection Response Validation–
Equivalent Homogeneous Level 2 SEM
1-33
55942
51603
Fourteenth Annual Conference on Carbon Capture, Utilization & Storage
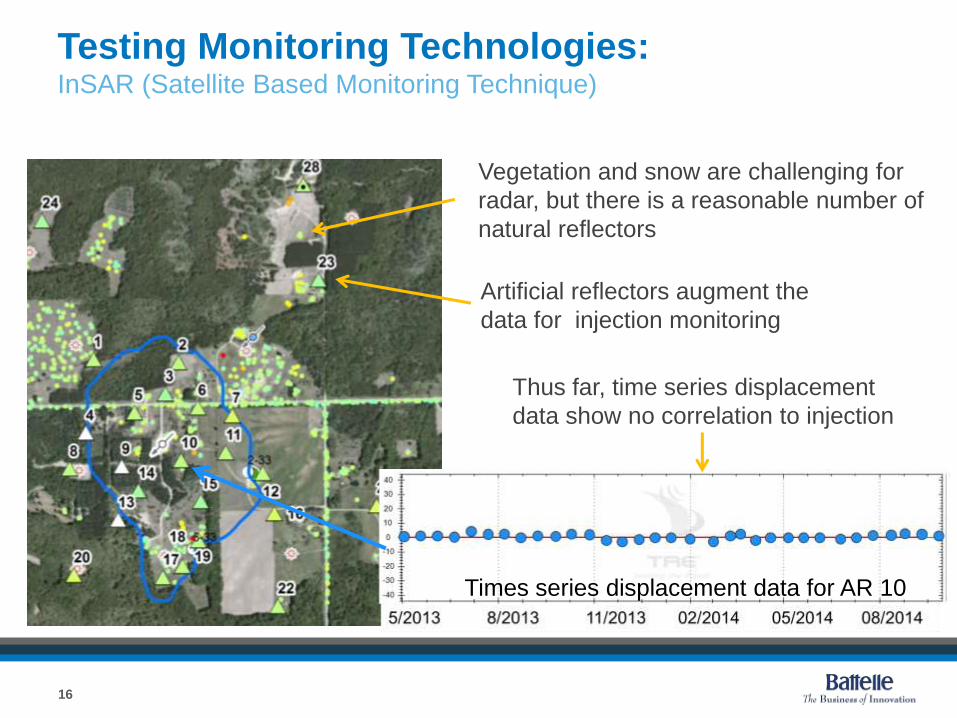
Testing Monitoring Technologies:InSAR (Satellite Based Monitoring Technique)
Vegetation and snow are challenging for
radar, but there is a reasonable number of
natural reflectors
16
Artificial reflectors augment the
data for injection monitoring
Thus far, time series displacement
data show no correlation to injection
Times series displacement data for AR 10
Fourteenth Annual Conference on Carbon Capture, Utilization & Storage
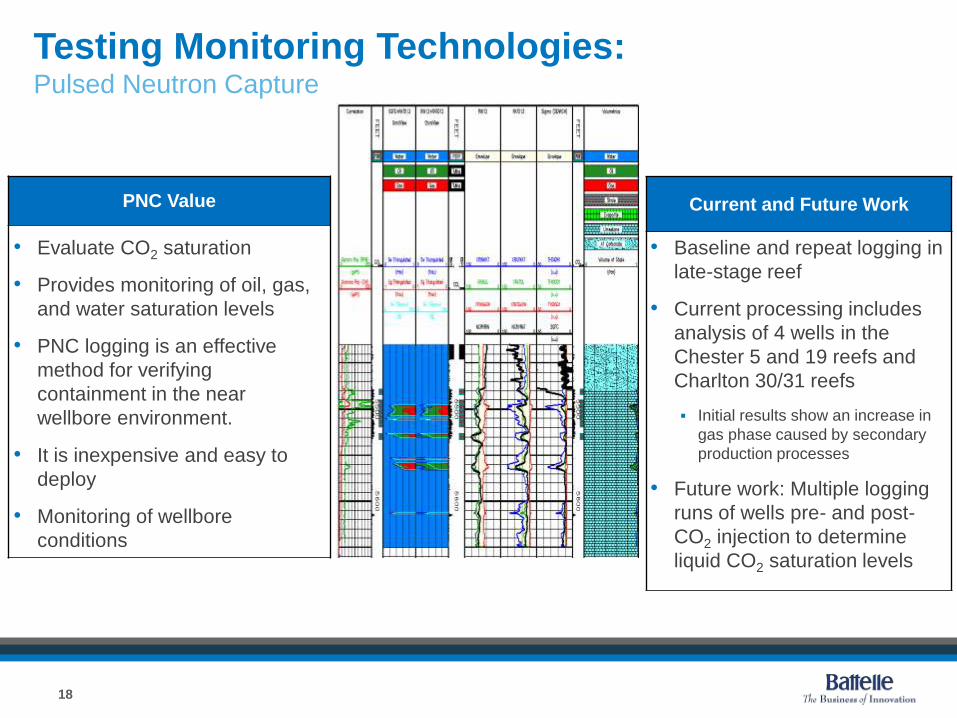
PNC Value
• Evaluate CO2 saturation
• Provides monitoring of oil, gas,
and water saturation levels
• PNC logging is an effective
method for verifying
containment in the near
wellbore environment.
• It is inexpensive and easy to
deploy
• Monitoring of wellbore
conditions
Current and Future Work
• Baseline and repeat logging in
late-stage reef
• Current processing includes
analysis of 4 wells in the
Chester 5 and 19 reefs and
Charlton 30/31 reefs
Initial results show an increase in
gas phase caused by secondary
production processes
• Future work: Multiple logging
runs of wells pre- and post-
CO2 injection to determine
liquid CO2 saturation levels
Testing Monitoring Technologies:Pulsed Neutron Capture
18

Fourteenth Annual Conference on Carbon Capture, Utilization & Storage
Gamma
ray
increase
Salt
plugging
Gas increase
Between
2012 and 2014
Cargas 3-2 PNC Logging Runs in 2012 and 2014 Charlton 2-30 PNC Logging Run
Testing Monitoring Technologies:Pulsed Neutron Capture Monitoring for Well Conditions

Fourteenth Annual Conference on Carbon Capture, Utilization & Storage
Testing Monitoring Technologies:Logging a pressurized well with a lubricator tool for pressure control
20

Fourteenth Annual Conference on Carbon Capture, Utilization & Storage
• Gravity meter takes point
measurements along the
injection wellbore
• Data is then converted to
density
• Repeat surveys indirectly
measure the change in CO2
saturation
21
Testing Monitoring Technologies:Borehole Gravity Meter Survey
Fourteenth Annual Conference on Carbon Capture, Utilization & Storage
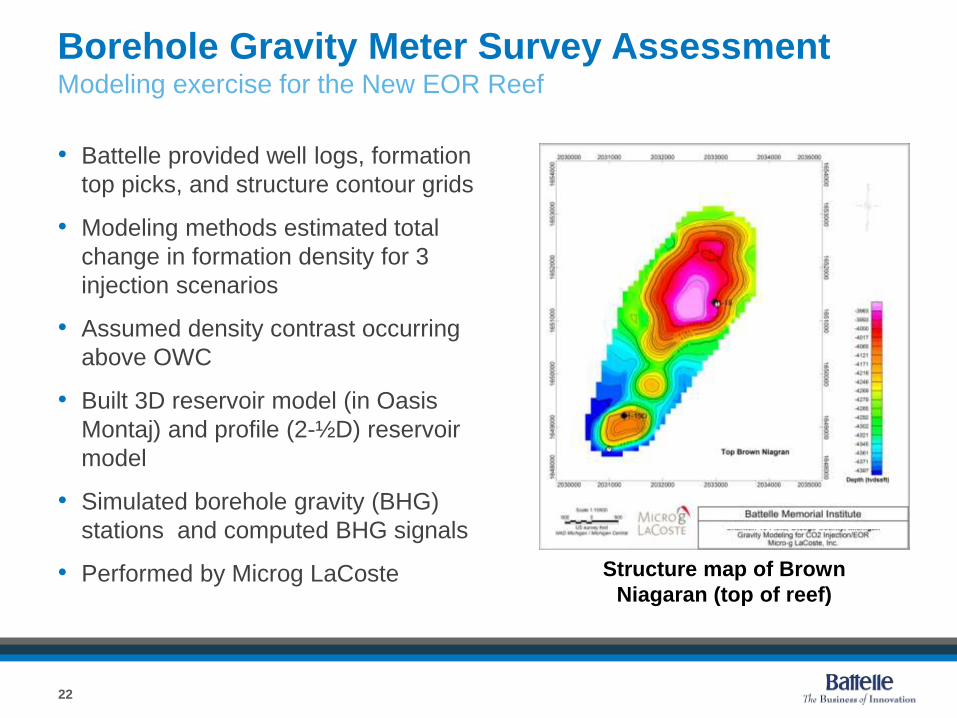
Borehole Gravity Meter Survey AssessmentModeling exercise for the New EOR Reef
• Battelle provided well logs, formation
top picks, and structure contour grids
• Modeling methods estimated total
change in formation density for 3
injection scenarios
• Assumed density contrast occurring
above OWC
• Built 3D reservoir model (in Oasis
Montaj) and profile (2-½D) reservoir
model
• Simulated borehole gravity (BHG)
stations and computed BHG signals
• Performed by Microg LaCoste
22
Structure map of Brown
Niagaran (top of reef)
Fourteenth Annual Conference on Carbon Capture, Utilization & Storage
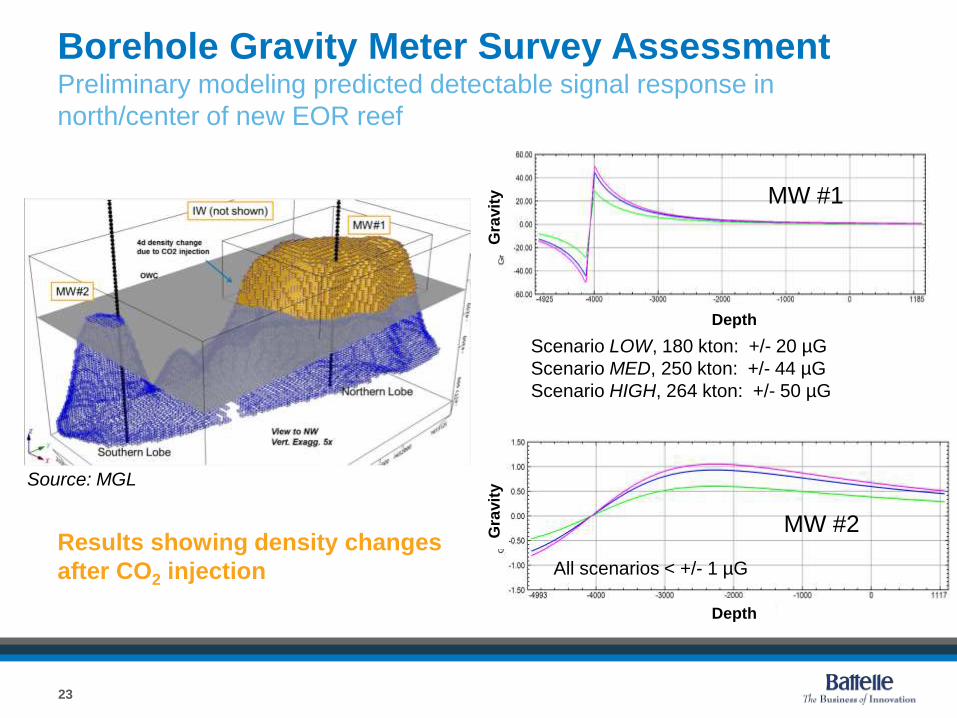
Borehole Gravity Meter Survey AssessmentPreliminary modeling predicted detectable signal response in
north/center of new EOR reef
23
Results showing density changes
after CO2 injection All scenarios < +/- 1 µG
MW #1
MW #2
Source: MGL
Depth
Gra
vit
y
Depth
Gra
vit
y
Scenario LOW, 180 kton: +/- 20 µG
Scenario MED, 250 kton: +/- 44 µG
Scenario HIGH, 264 kton: +/- 50 µG

Fourteenth Annual Conference on Carbon Capture, Utilization & Storage
Geochemical Studies: Late-Stage reef shows impact of CO2 relative to new reef
• Collected gas and brine
samples from the new EOR
reef, which has not received
CO2.
• General brine chemistry is
similar between new EOR reef
and late-stage reef
• Isotopically, the brines are
different. Differences in the
δ13C for dissolved carbonate
suggest the brine chemistry is
altered by the injection of CO2.
• Note: the δ13C value has been
corrected for fractionation
resulting from dissolution and
dissociation.
29.031.2
7.2
INJECTED CO2*
DOVER 33 CHARLTON 19
Ave
rag
e
d1
3C
fo
r D
iss
olv
ed
Carb
on
ate
–‰
24

Fourteenth Annual Conference on Carbon Capture, Utilization & Storage
Summary and Future PlansLate-Stage Reef
• ~244,000 tonnes CO2 injection since 2013
• Complete injection – booster pump utilization?
• Complete post injection monitoring
Pressure, PNC logs, gravity, microseismic, VSP, fluid sampling
• Calibrate, optimize static and dynamic models
• Drill and characterize in a validation well? (subject to
further review and approval)
Logging, coring, fluid analysis, ROZ characterization
Incorporate into models and validate
• Incorporate lessons learned into future reef assessments
25
Fourteenth Annual Conference on Carbon Capture, Utilization & Storage
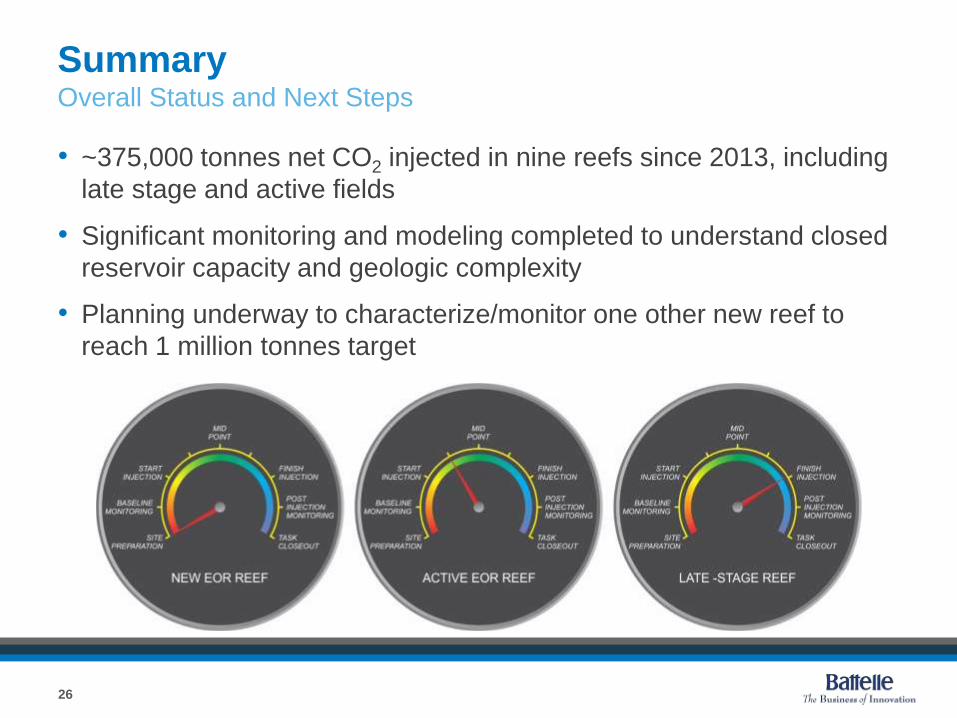
SummaryOverall Status and Next Steps
26
• ~375,000 tonnes net CO2 injected in nine reefs since 2013, including
late stage and active fields
• Significant monitoring and modeling completed to understand closed
reservoir capacity and geologic complexity
• Planning underway to characterize/monitor one other new reef to
reach 1 million tonnes target

Fourteenth Annual Conference on Carbon Capture, Utilization & Storage
Acknowledgements
DOE/NETL has worked with us and our partners to structure a program that
adds to the knowledge base and extends the state-of-the-art.
Core Energy, LLC our host site and CO2 supplier for 10 years of collaboration
under Phase II and Phase III
The Ohio Coal Development Office has provided consistent and significant
cofunding for the regional characterization efforts of the MRCSP
MRCSP’s industrial partners and sponsors
The nine state Geology Surveys and Universities have been essential in
expanding the results into regional implementation plans.
Battelle’s MRCSP team members for work shown here
27