middle eastern sentiment survey - mckinsey & company
TRANSCRIPT

WORKING DRAFTLast Modified 25/04/2018 19:15 Arabian Standard TimePrinted 24/04/2018 11:12 Arabian Standard Time
Middle Eastern Sentiment Survey
CONFIDENTIAL AND PROPRIETARYAny use of this material without specific permission of McKinsey & Company is strictly prohibited
January, 2018
MCKINSEY 2018 GLOBAL SENTIMENT SURVEY – RESULTS FOR THE MIDDLE EAST
McKinsey & Company 2|
▪ Overview of the survey
▪ Saudi results
▪ UAE results
▪ Egypt results
▪ Pakistani results
Content

McKinsey & Company 3|
Survey details
▪ Survey fielded Sep 2015, Mar 2016, Sep 2016, April 2017 and Sep 2017
▪ Online survey thereby skewing to online population (usually younger, urban, and more affluent)
▪ In Pakistan in-person interviews are used
Weighting
▪ Country results weighted to census for age and to panel for income/social economic status
▪ Category insights weighted by purchase incidence
▪ Regional and country weighting in line with MGI procedures– Sentiment questions weighted by size of the consuming class– Behavioral questions weighted by size of the consuming class and per
capita consumption of the consuming class

McKinsey & Company 4|
▪ Overview of the survey
▪ Saudi results
▪ UAE results
▪ Egypt results
▪ Pakistani results
Content
McKinsey & Company 5|
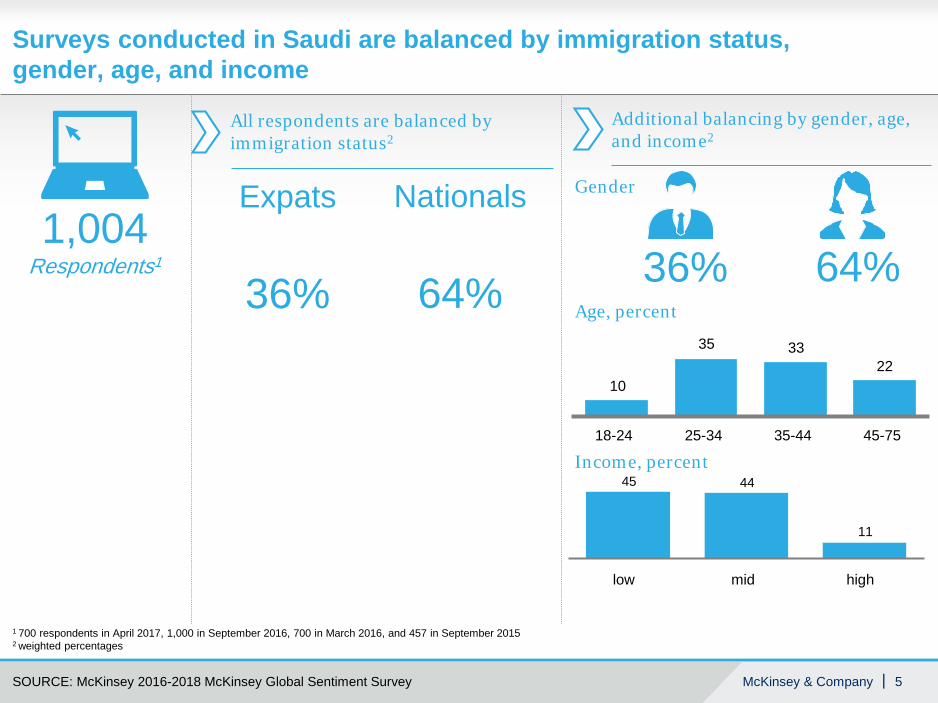
Surveys conducted in Saudi are balanced by immigration status, gender, age, and income
1,004Respondents1
1 700 respondents in April 2017, 1,000 in September 2016, 700 in March 2016, and 457 in September 20152 weighted percentages
10
35 3322
18-24 25-34 35-44 45-75
highmidlow
All respondents are balanced by immigration status2
36% 64%
Expats Nationals
36% 64%
Additional balancing by gender, age, and income2
Age, percent
Income, percent
SOURCE: McKinsey 2016-2018 McKinsey Global Sentiment Survey
Gender
11
4445

McKinsey & Company 6|
KSA consumers are more financially secure yet also increasingly worried about their economy and their ability to maintain a job
SOURCE: McKinsey 2016-2018 McKinsey Global Sentiment Survey
Consumers sentimentPercent of people agreeing/strongly agreeing with each statement
Gen
eral
sen
timen
tFi
nanc
ial
secu
rity
I am optimistic about my country's economy
I am optimistic about my household's economy
I am somewhat or very worried about losing my job
I am finding it harder to make ends meet now than 12 months ago
I am living paycheck to paycheck 4046403646453746413836
09/201704/1709/1709/16 09/1604/17 04/1709/1709/1603/1609/2015
4344403542413843403428
8481827364657771777162
3543353146283345323938
3438344146333843333737
KSA
Nationals Expats

McKinsey & Company 7|
Consumers are more bullish about their ability to spend; especially Nationals are generous spendersConsumers sentimentPercent of people agreeing/strongly agreeing with each statement
SOURCE: McKinsey 2016-2018 McKinsey Global Sentiment Survey
Given my economic situation, I am delaying purchases
I cut back on spending
I would spend more money now if I was confident about the economy
Uncertainty about the economy is preventing me from making purchases
46444426
34293338383325
09/1609/1704/1709/16 09/201709/16 04/1709/1704/1703/1609/2015
4541423336
263737363533
494836444041464540
3050
57585541
51474753524642
KSA
Nationals Expats

McKinsey & Company 8|
Even if incomes increase, KSA consumers would not spend more than 33%
Top 5 priorities for consumers wishing to allocate additional spending1
Percent of consumers likely or very likely
33 34 30 32 33
34 3633 30 32
33 2936 37 35
Spending
Savings
09/201704/201709/2016
Paying off debt
03/201609/2015
1,004
If I earned 10% more next year, I would put it towards Percent
1 Other categories not listed in the top 5 for KSA (9/2017) are Electronics (40), Home/Housing/Real Estate (40), Vacations (39), Restaurants (Take Out) (38), Major Appliances (36), Gifts (34), Vehicles (32), Entertainment (28), High-End Designer/Luxury Products (27), Pet Care (15)
KSA
SOURCE: McKinsey 2016-2018 McKinsey Global Sentiment Survey
7375765661
Extra money allocated toward spending
Everyday necessities
Education
Clothing
Restaurants (Sit Down)
Home Goods
6262626159
5561585455
4742353641
4045413943
09/201704/201709/201603/201609/2015

McKinsey & Company 9|
All consumers find creative ways to spend less and save money: 52% of consumers are increasingly looking for savings in KSA today (down from 56% in April 2017)
~34% of consumers look to buy their preferred brands at stores with lower prices (in April 2017, this number was 42%
Consumers continue going up and down the price pyramid: 16% trade down and 11% trade up
45% of trade down leads to happy consumers (vs 41% in Sept 2016) and only 46% of consumers desire to go back to their old brands (44% in Sept 2016)
Consumers in the region believe to have cut spending in all channels Thrifty brand
loyalists
Trade-down converts
Multichannel shoppers
Selective splurgers
Savvy cost-cutters
5 truths about today’s consumers in KSA
SOURCE: McKinsey 2016-2018 McKinsey Global Sentiment Survey

McKinsey & Company 10|
Consumers agreeing/strongly agreeing over the last 12 monthsPercent
KSA consumers are finding creative ways to spend less and save money 1Savvy cost-cutters
SOURCE: McKinsey 2016-2018 McKinsey Global Sentiment Survey
I shop around to get the best deals
I am paying more attention to prices
I buy more in bulk
I am increasingly looking for ways to save money
I wait for products to go on sale
I use coupons and loyalty cards more often
I am delaying purchases
I am looking for sales and promotions
5256525344
4954524340
4753524642
4446464337
4446443935
4040393430
3435272119
2829322623
09/201704/1709/2015 03/16 09/16
KSA

McKinsey & Company 11|
Consumers continue their quest to eat healthy food1Net changes in eating habits in the last 12 monthsDifference between doing more and doing less, Percent
Savvy cost-cutters
SOURCE: McKinsey 2016-2018 McKinsey Global Sentiment Survey
Eating healthy foods
Buying locally sourced products
Buying natural or organic products
Reading nutrition labels in stores
2011
191810
4
-3-3
20
0
-7-4
4
-5
-10-11-12-7-10
KSA
09/201704/1709/2015 03/16 09/16

McKinsey & Company 12|
Changes in buying behavior in the last year among those who changed buying behavior Weighted average for categories in basket, Percent
2Thrifty brand loyalistsKSA consumers are generally brand loyal IF the price is right
1 Multiple answers possible
SOURCE: McKinsey 2016-2018 McKinsey Global Sentiment Survey
I traded down to a less expensive brand or Private Label
I traded up to a more expensive brand
I buy my preferred brand but at stores with lower prices
I buy my preferred brand but only when on sale or with coupon
I buy my preferred brand but in lower quantities
3442394334
2021201721
1716181614
161110910
119101216
09/201704/1709/2015 03/16 09/16
KSA

McKinsey & Company 13|
2Thrifty brand loyalistsConsumers are brand loyal across most categories, and look for ways to buy their preferred brands for less
1 Multiple answers possible
Changes in buying behavior in the last year among those who changed buying behavior Weighted average for categories in basket, Percent
Macro category
SOURCE: McKinsey 2017-2018 McKinsey Global Sentiment Survey
I buy my preferred brand but at stores with lower prices
I buy my preferred brand but in lower quantities
I buy my preferred brand but only when on sale or with coupon
I traded down to a less expensive brand or Private Label
I traded up to a more expensive brand
I made another change
Non alcoholic beverageFood
Personal care
Household products
9
11
7
9
11
9
20
10
10
16181617
20
34
21
3942
77
11
9
9
11
1010
1517
20
36
2118
3842
21
16
9
11
8
8
9
11
16
10
12
10
16
22
16
4146
33
2219
116
11
8
11
14
1210
22
22
21
3837
17
31
16
18
18
85
6
7
7
39
23
26
10
15
45
14
22
17
17
1719
36
04/201709/2016 09/2017
McKinsey & Company 14|
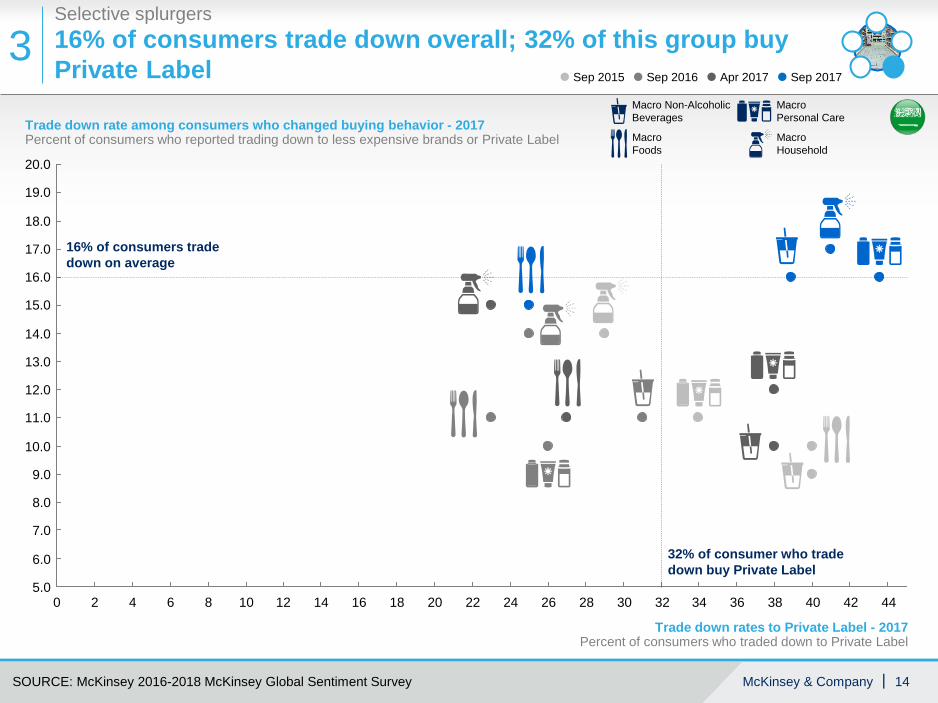
16% of consumers trade down overall; 32% of this group buy Private Label
Selective splurgers
3
SOURCE: McKinsey 2016-2018 McKinsey Global Sentiment Survey
12.0
19.0
20.0
11.0
6.0
16.0
5.0
14.0
7.0
18.0
15.0
8.0
10.0
9.0
17.0
12
13.0
4030 36162 6 8 14 18 22 24 2620 28 32 344 38 42 440 10
Trade down rates to Private Label - 2017Percent of consumers who traded down to Private Label
Trade down rate among consumers who changed buying behavior - 2017Percent of consumers who reported trading down to less expensive brands or Private Label
Macro Non-Alcoholic Beverages
Macro Personal Care
Macro Household
Macro Foods
16% of consumers trade down on average
32% of consumer who trade down buy Private Label
Sep 2016 Apr 2017Sep 2015 Sep 2017

McKinsey & Company 15|
On average, 45% of trade down leads to happy consumersTrade-down converts
4
SOURCE: McKinsey 2016-2018 McKinsey Global Sentiment Survey
16.0
13.0
9.0
15.0
12.0
11.0
19.0
10
20.0
18.0
14.0
10.0
25 505.0
55
17.0
4015 45
8.0
7.0
603520 30
6.0
Trade down rate among consumers who changed buying behavior - 2017Percent of consumers who reported trading down to less expensive brands or Private Label
Experience better than expected- 2017Percent of consumers who traded down reporting an experience better than expected
Macro Non-Alcoholic Beverages
Macro Personal Care
Macro Household
Macro Foods
16% of consumers trade down on average
45% of consumer who trade have an experience that is better than expected
Sep 2016 Apr 2017Sep 2015 Sep 2017
McKinsey & Company 16|
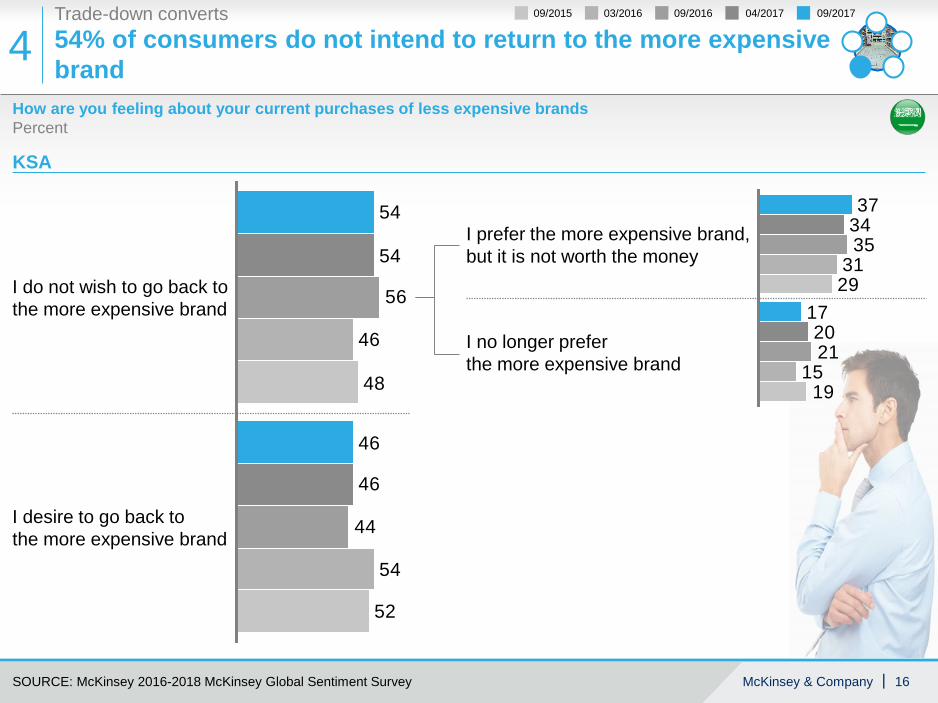
54% of consumers do not intend to return to the more expensive brand4Trade-down converts
How are you feeling about your current purchases of less expensive brandsPercent
SOURCE: McKinsey 2016-2018 McKinsey Global Sentiment Survey
KSA
54
46
54
52
46
46
54
44
56
48
I desire to go back tothe more expensive brand
I do not wish to go back tothe more expensive brand
37
17
34
20
31
15
29
21
35
19
I no longer preferthe more expensive brand
I prefer the more expensive brand,but it is not worth the money
04/201709/2016 09/201703/201609/2015
McKinsey & Company 17|
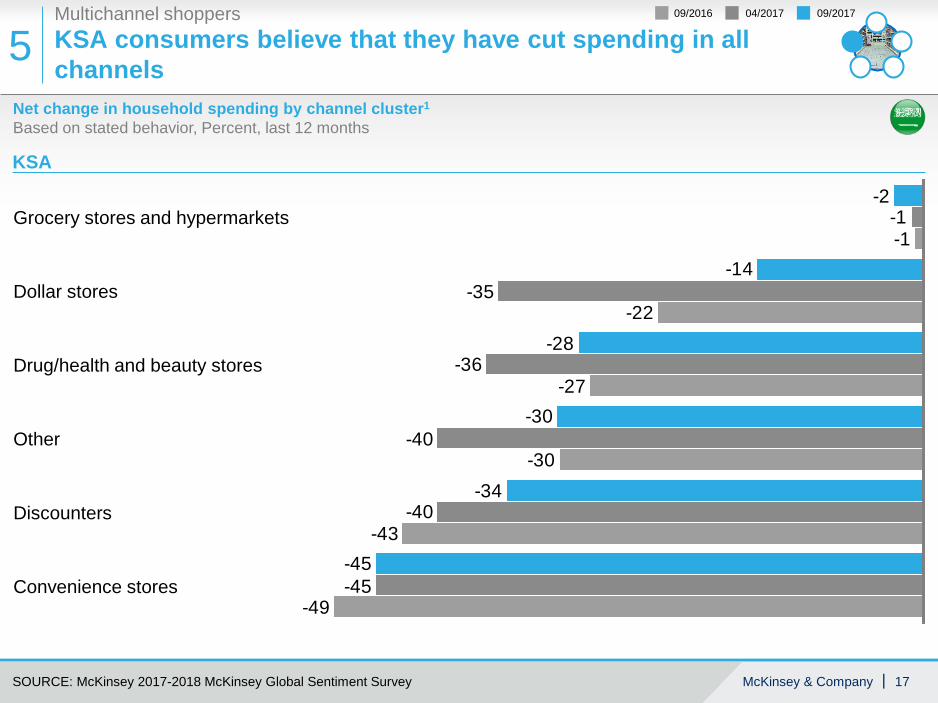
Net change in household spending by channel cluster1
Based on stated behavior, Percent, last 12 months
Multichannel shoppers
5
SOURCE: McKinsey 2017-2018 McKinsey Global Sentiment Survey
KSA
-45
-34
-30
-28
-14
-2
-45
-40
-40
-36
-35
-1-1
-49
-43
-30
-27
-22
Other
Dollar stores
Grocery stores and hypermarkets
Drug/health and beauty stores
Discounters
Convenience stores
KSA consumers believe that they have cut spending in all channels
04/201709/2016 09/2017

McKinsey & Company 18|
▪ Overview of the survey
▪ Saudi results
▪ UAE results
▪ Egypt results
▪ Pakistani results
Content

McKinsey & Company 19|
Surveys conducted in UAE are balanced by gender, age, and income
35-4425-34 45-7518-24
Age, percent
23
4928
mid highlow
817
2847
Sharjah Other Emirates
Abu DhabiDubai
1,003Respondents1
1 700 respondents in April 2017, 1,000 in September 2016, 700 in March 2016, and 358 in September 20152 weighted percentages
All respondents are balanced by gender, age, and income2 Additional split available by region
56% 44%
Income, percent Region, percent
SOURCE: McKinsey 2016-2018 McKinsey Global Sentiment Survey
2431
39
6
McKinsey & Company 20|
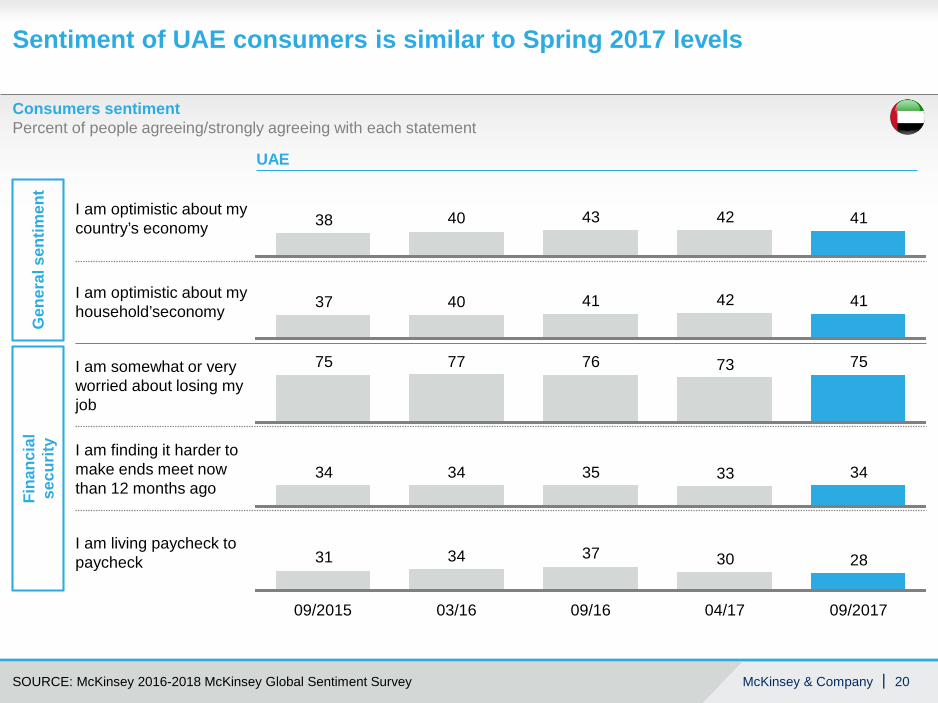
Sentiment of UAE consumers is similar to Spring 2017 levels
Consumers sentimentPercent of people agreeing/strongly agreeing with each statement
SOURCE: McKinsey 2016-2018 McKinsey Global Sentiment Survey
Gen
eral
sen
timen
tFi
nanc
ial
secu
rity
I am optimistic about my country’s economy
I am optimistic about my household’seconomy
I am somewhat or very worried about losing my job
I am finding it harder to make ends meet now than 12 months ago
I am living paycheck to paycheck 2830373431
04/1709/1603/1609/2015 09/2017
3433353434
7573767775
4142414037
4142434038
UAE

McKinsey & Company 21|
UAE consumers are more cautious when making financial decisions today than in April 2017Consumers sentimentPercent of people agreeing/strongly agreeing with each statement
SOURCE: McKinsey 2016-2018 McKinsey Global Sentiment Survey
Given my economic situation, I am delaying purchases
I cut back on spending
Uncertainty about the economy is preventing me from making purchases
I would spend more money now, if I was confident about the economy
3738353536
04/1709/1603/1609/2015 09/2017
4033403933
4240454339
4845484744
UAE

McKinsey & Company 22|
Even if incomes increase, UAE consumers do not plan to spend more than 29% of itIf I earned 10% more next year, I would put it towards Percent
1 Other categories not listed in the top 5 for UAE are Home/Housing/Real Estate (38), Electronics (37), Restaurants (Take Out) (37), Entertainment (37), Gifts (32), Vehicles (30), Major Appliances (30), High-End Designer/Luxury Products (25), Pet Care (13)
SOURCE: McKinsey 2016-2018 McKinsey Global Sentiment Survey
Top 5 priorities for consumers wishing to allocate additional spending1, Percent of consumers likely or very likely
27 28 30 28 29
42 40 39 39 40
31 32 31 33 31
Spending
Savings
Paying off debt
09/201709/201609/2015
457 1,000 1,003
04/2017
700 1,003
03/2016
UAE
6867725660
Extra money allocated toward spending
Everyday necessities
Education
Clothing
Restaurants (Sit Down)
Home Goods
5955595856
5354585457
4642424142
3954495246
03/2016 09/201704/201709/201609/2015

McKinsey & Company 23|
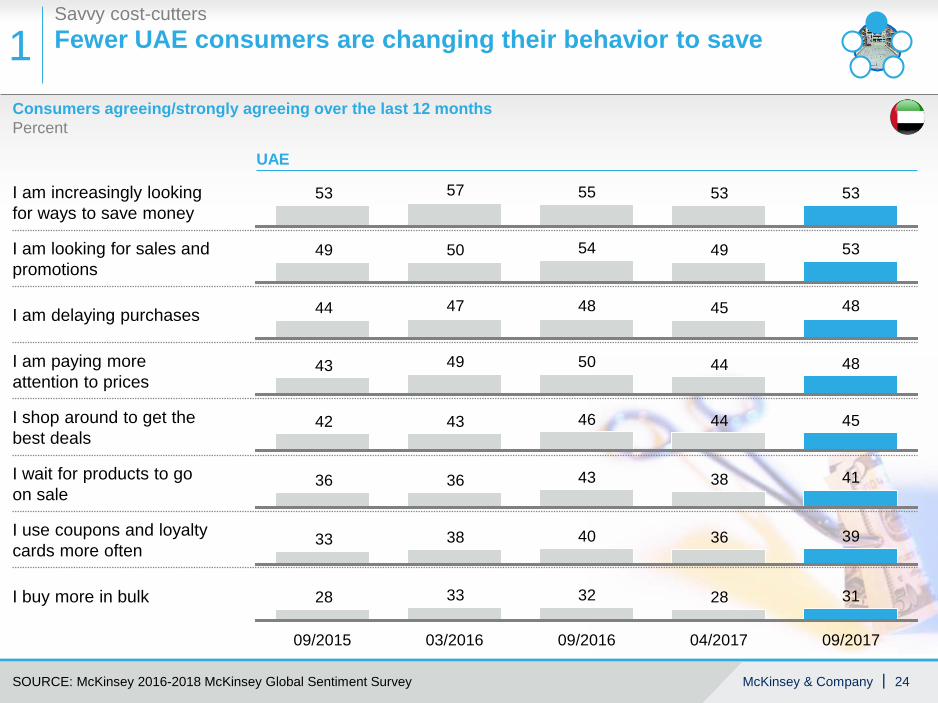
Slightly fewer UAE consumers are changing their behavior to save: 53% of consumers are looking for sales and promotions
78% of consumers in the region changed their consumer buying habits to save: 34% of consumers look to buy their preferred brands at stores with lower prices
Consumers continue going up and down the price pyramid: 14% trade down and 12% trade up
41% of trade down leads to happy consumers and only 46% of consumers desire to go back to their old brands
Consumers in the region increasingly favor discount formats and chain grocery stores
Thrifty brand loyalists
Trade-down converts
Multichannel shoppers
Selective splurgers
Savvy cost-cutters
5 truths about today’s consumers in UAE
SOURCE: McKinsey 2016-2018 McKinsey Global Sentiment Survey
McKinsey & Company 24|
Consumers agreeing/strongly agreeing over the last 12 monthsPercent
Fewer UAE consumers are changing their behavior to save1Savvy cost-cutters
SOURCE: McKinsey 2016-2018 McKinsey Global Sentiment Survey
I am paying more attention to prices
I shop around to get the best deals
I buy more in bulk
I am increasingly looking for ways to save money
I wait for products to go on sale
I use coupons and loyalty cards more often
I am delaying purchases
I am looking for sales and promotions
5353555753
5349545049
4845484744
4844504943
4544464342
4138433636
3936403833
3128323328
09/201704/201709/2015 03/2016 09/2016
UAE

McKinsey & Company 25|
Consumers continue their quest to eat healthy food1Net changes in eating habits in the last 12 monthsDifference between doing more and doing less, Percent
Savvy cost-cutters
SOURCE: McKinsey 2016-2018 McKinsey Global Sentiment Survey
Eating healthy foods
Reading nutrition labels in stores
Buying natural or organic products
Buying locally sourced products
28263227
19
512796
29
29
-4
-5
0
-7-10-9
09/201704/1709/2015 03/16 09/16
UAE
McKinsey & Company 26|
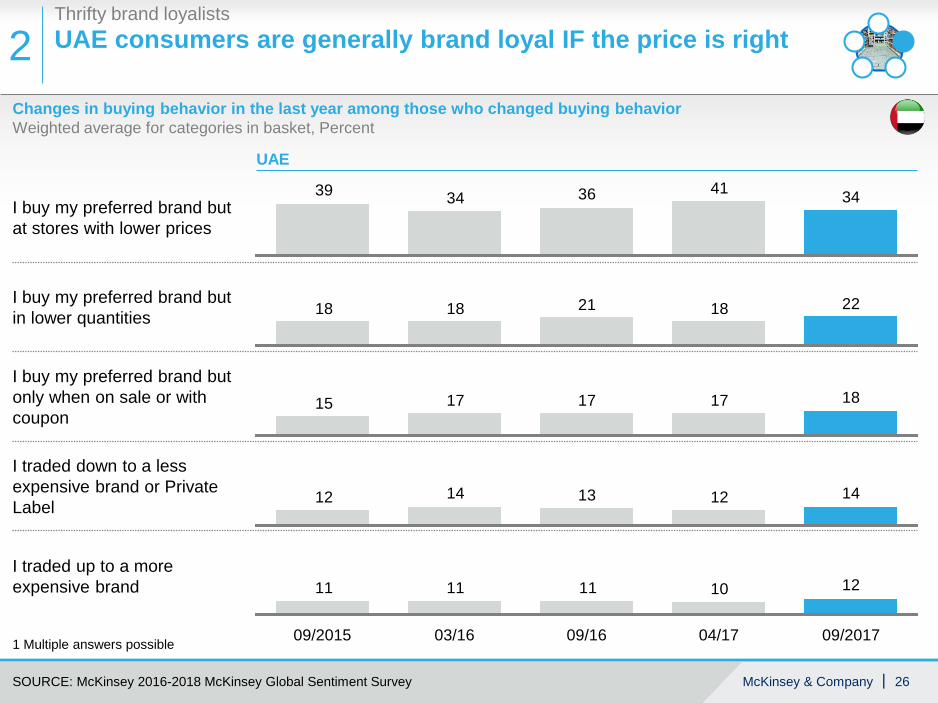
Changes in buying behavior in the last year among those who changed buying behavior Weighted average for categories in basket, Percent
2Thrifty brand loyalistsUAE consumers are generally brand loyal IF the price is right
1 Multiple answers possible
SOURCE: McKinsey 2016-2018 McKinsey Global Sentiment Survey
I traded down to a less expensive brand or Private Label
I traded up to a more expensive brand
I buy my preferred brand but at stores with lower prices
I buy my preferred brand but only when on sale or with coupon
I buy my preferred brand but in lower quantities
3441363439
2218211818
1817171715
1412131412
1210111111
09/201704/1709/2015 03/16 09/16
UAE

McKinsey & Company 27|
2Thrifty brand loyalistsConsumers are brand loyal across most categories, and look for ways to buy their preferred brands for less
1 Multiple answers possible
Changes in buying behavior in the last year among those who changed buying behavior, Weighted average for categories in basket, Percent
SOURCE: McKinsey 2017-2018 McKinsey Global Sentiment Survey
Macro category
I buy my preferred brand but at stores with lower prices
I buy my preferred brand but in lower quantities
I buy my preferred brand but only when on sale or with coupon
I traded down to a less expensive brand or Private Label
I traded up to a more expensive brand
I made another change
Non alcoholic beverageFood
Personal care
Household products
898
11
12
12
10
17
21
22
34
14
1718
18
36
13
41
89
9
9
10
13
38
15
10
1819
13
23
18
2024
35
33
88
8
9
9
12
15
20
1413141413
21
4439
23
36
8
9
8
19
22
14
10
17
12
19
15
12
1836
1218
3343
7
9
7
6
7
7
2322
44
1618
16
36
39
141216
23
04/201709/2016 09/2017

McKinsey & Company 28|
14% of consumers trade down overall; 26% of this group buy Private Label
Selective splurgers
3
SOURCE: McKinsey 2016-2018 McKinsey Global Sentiment Survey
9.0
5.0
14.0
3428
19.0
16.0
13.0
3624
17.0
32
15.0
12.0
38
11.0
8.0
20.0
7.0
10.0
6.0
44
18.0
42403012 208 26160 182 14 224 6 10
Trade down rate among consumers who changed buying behavior - 2017Percent of consumers who reported trading down to less expensive brands or Private Label
Trade down rates to Private Label - 2017Percent of consumers who traded down to Private Label
Macro Non-Alcoholic Beverages
Macro Personal Care
Macro Household
Macro Foods
14% of consumers trade down on average
26% of consumer who trade down buy Private Label
Sep 2016 Apr 2017Sep 2015 Sep 2017
McKinsey & Company 29|
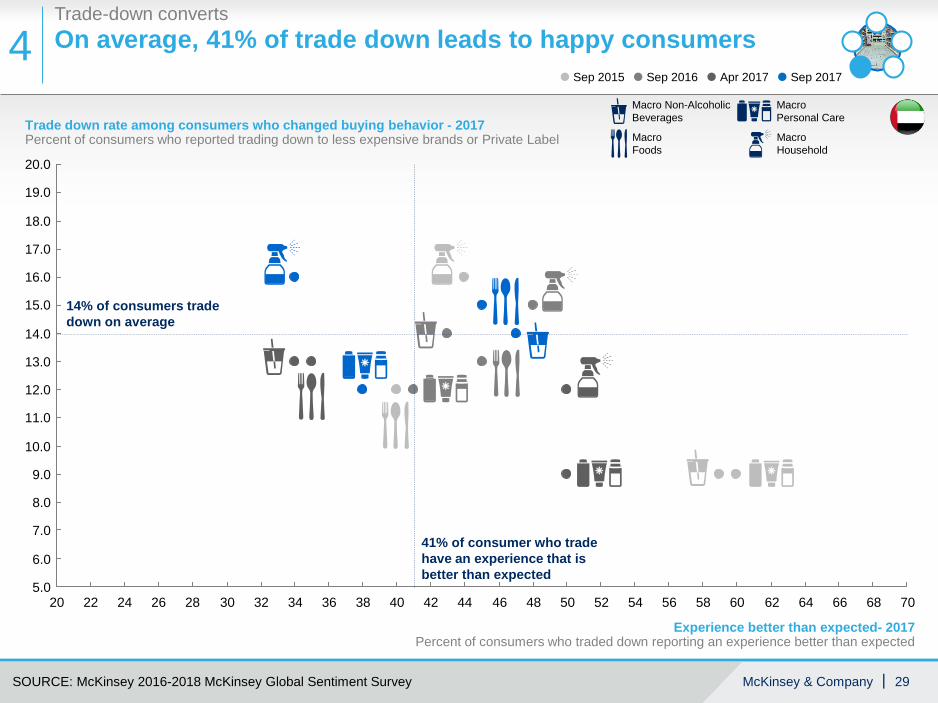
On average, 41% of trade down leads to happy consumersTrade-down converts
4
SOURCE: McKinsey 2016-2018 McKinsey Global Sentiment Survey
26
19.0
9.0
5.0666224
17.0
20.0
14.0
12.0
18.0
16.0
8.0
68
13.0
15.0
6.0
11.0
10.0
7.0
7064504034 46 4820 32 5822 3828 605652 5444423630
Trade down rate among consumers who changed buying behavior - 2017Percent of consumers who reported trading down to less expensive brands or Private Label
Experience better than expected- 2017Percent of consumers who traded down reporting an experience better than expected
Macro Non-Alcoholic Beverages
Macro Personal Care
Macro Household
Macro Foods
14% of consumers trade down on average
Sep 2016 Apr 2017Sep 2015 Sep 2017
41% of consumer who trade have an experience that is better than expected

McKinsey & Company 30|
54% of consumers do not intend to return to the more expensive brand4Trade-down converts
How are you feeling about your current purchases of less expensive brandsPercent
SOURCE: McKinsey 2016-2018 McKinsey Global Sentiment Survey
UAE
54
46
43
57
40
60
41
59
47
53
I desire to go back tothe more expensive brand
I do not wish to go back tothe more expensive brand
34
25
32
27
2022
3535
22
31
I prefer the more expensive brand,but it is not worth the money
I no longer preferthe more expensive brand
04/201709/2016 09/201703/201609/2015
McKinsey & Company 31|
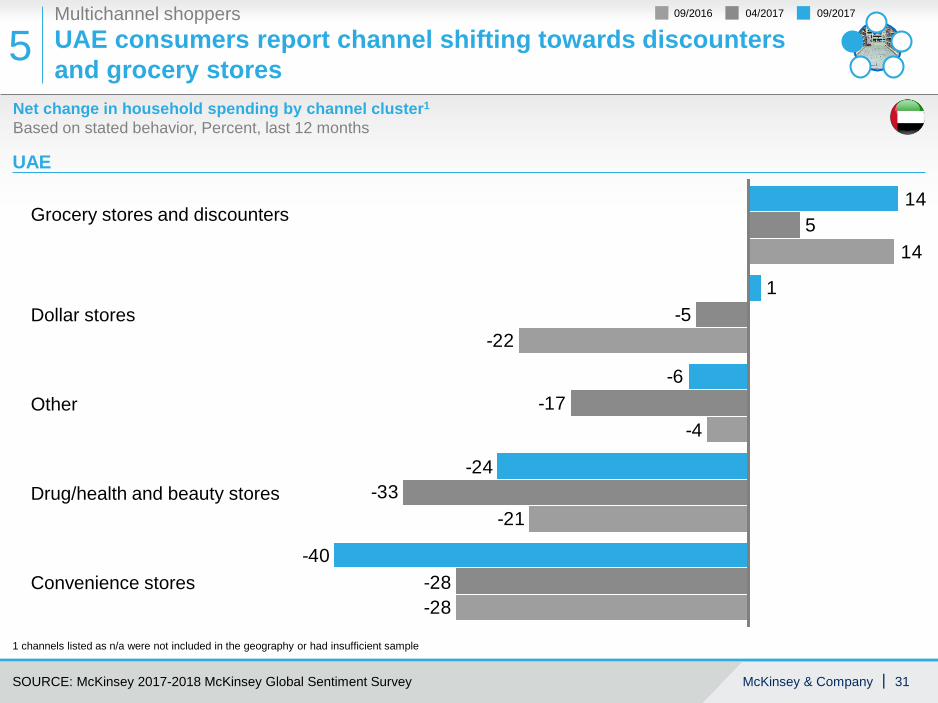
Net change in household spending by channel cluster1
Based on stated behavior, Percent, last 12 months
Multichannel shoppers
5
1 channels listed as n/a were not included in the geography or had insufficient sample
SOURCE: McKinsey 2017-2018 McKinsey Global Sentiment Survey
UAE
-40
-24
-6
1
14
-28
-33
-17
-5
5
-4
-28
-21
-22
14
Drug/health and beauty stores
Dollar stores
Grocery stores and discounters
Other
Convenience stores
UAE consumers report channel shifting towards discounters and grocery stores
04/201709/2016 09/2017
McKinsey & Company 32|
▪ Overview of the survey
▪ Saudi results
▪ UAE results
▪ Egypt results
▪ Pakistani results
Content
McKinsey & Company 33|
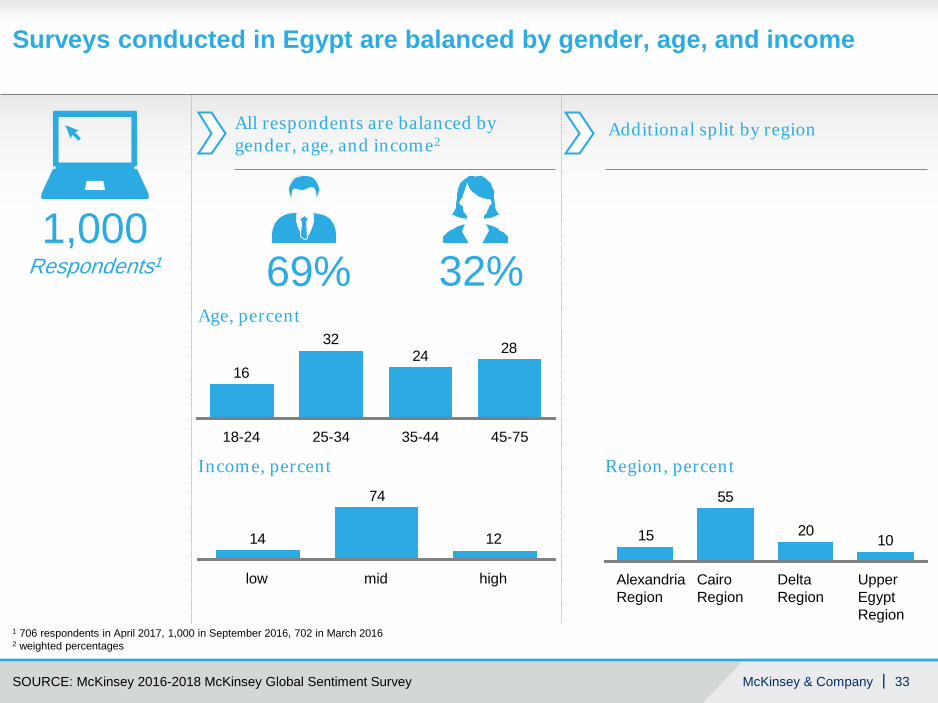
Surveys conducted in Egypt are balanced by gender, age, and income
1 706 respondents in April 2017, 1,000 in September 2016, 702 in March 20162 weighted percentages
282432
16
35-4425-3418-24 45-75
Age, percent
12
74
14
low mid high
Income, percent
1020
55
15
Delta Region
Cairo Region
Alexandria Region
Upper Egypt Region
Region, percent
All respondents are balanced by gender, age, and income2
Additional split by region
69% 32%1,000
Respondents1
SOURCE: McKinsey 2016-2018 McKinsey Global Sentiment Survey

McKinsey & Company 34|
Egyptian consumers feel slightly more financially secure today than in Spring 2017 Consumers sentimentPercent of people agreeing/strongly agreeing with each statement
SOURCE: McKinsey 2017-2018 McKinsey Global Sentiment Survey
Gen
eral
sen
timen
tFi
nanc
ial
secu
rity
I am optimistic about my household’s economy
I am optimistic about my country’s economy
I am somewhat or very worries about losing my job
I am finding it harder to make ends meet now, than 12 months ago
I am living paycheck to paycheck
44434638
09/201704/201709/201603/2016
48555441
69716964
22262125
32292931
Egypt

McKinsey & Company 35|
Fewer consumers are cautious spenders today than in April 2017
Consumers sentimentPercent of people agreeing/strongly agreeing with each statement
SOURCE: McKinsey 2017-2018 McKinsey Global Sentiment Survey
Given my economic situation I am delaying purchases
I cut back on spending
Uncertainty about the economy is preventing me from making purchases
I would spend more money now if I was confident about the economy
43484749
09/201704/201709/201603/2016
44494741
48565139
56575951
Egypt
McKinsey & Company 36|
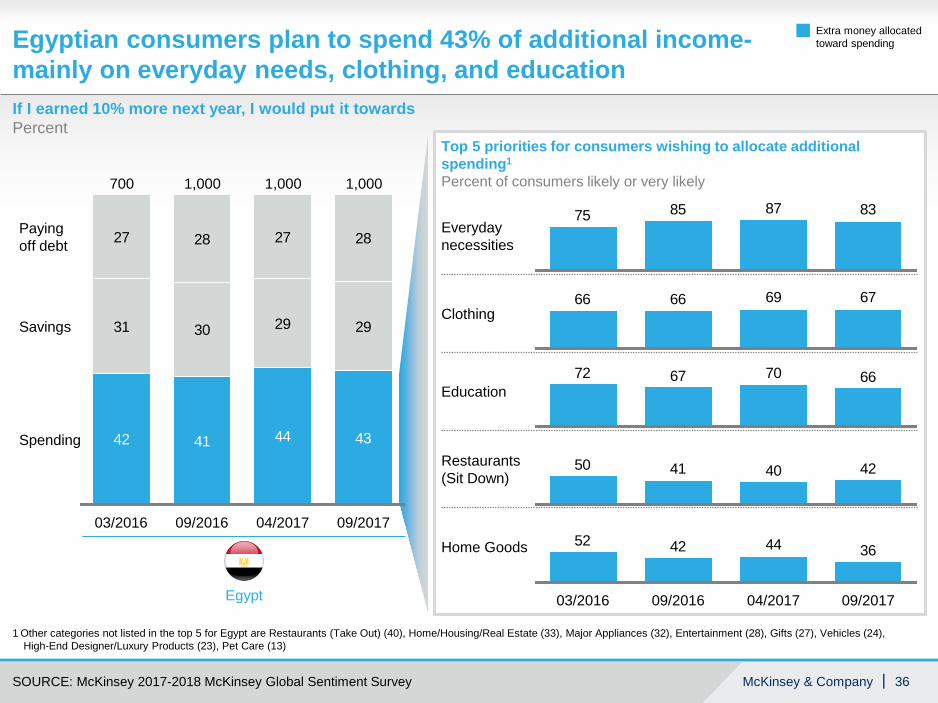
If I earned 10% more next year, I would put it towards Percent
Egyptian consumers plan to spend 43% of additional income-mainly on everyday needs, clothing, and education
1 Other categories not listed in the top 5 for Egypt are Restaurants (Take Out) (40), Home/Housing/Real Estate (33), Major Appliances (32), Entertainment (28), Gifts (27), Vehicles (24), High-End Designer/Luxury Products (23), Pet Care (13)
SOURCE: McKinsey 2017-2018 McKinsey Global Sentiment Survey
Top 5 priorities for consumers wishing to allocate additional spending1
Percent of consumers likely or very likely
42 41 44 43
31 30 29 29
27 28 27 28
Savings
Spending
04/2017 09/201709/2016
Paying off debt
1,000
03/2016
700 1,000 1,000
Egypt
83878575
Extra money allocated toward spending
Everyday necessities
Clothing
Education
Restaurants (Sit Down)
Home Goods
67696666
66706772
42404150
36444252
09/201709/2016 04/201703/2016

McKinsey & Company 37|
All consumers find creative ways to spend less and save money: 56% of consumers are looking for sales and promotions
74% of consumers in Egypt changed their consumer buying habits to save: 36% of consumers look to buy their preferred brands at stores with lower prices
Consumers trade down in large numbers (17%) while 10% trade up
36% of trade down leads to happy consumers and only 47% of consumers desire to go back to their old brands
Consumers in the region shift spending towards discounters and club stores
Thrifty brand loyalists
Trade-down converts
Multichannel shoppers
Selective splurgers
Savvy cost-cutters
5 truths about today’s consumers in Egypt
SOURCE: McKinsey 2017-2018 McKinsey Global Sentiment Survey

McKinsey & Company 38|
Consumers agreeing/strongly agreeing over the last 12 monthsPercent
Egyptian consumers are finding creative ways to spend less and save money 1Savvy cost-cutters
SOURCE: McKinsey 2017-2018 McKinsey Global Sentiment Survey
I am paying more attention to prices
I shop around to get the best deals
I buy more in bulk
I am increasingly looking for ways to save money
I wait for products to go on sale
I use coupons and loyalty cards more often
I am looking for sales and promotion
I am delaying purchases
56606157
56575951
56615649
51515144
49535148
43454139
29272524
28333634
09/201704/1703/2016 09/16
Egypt

McKinsey & Company 39|
Consumers buy locally sourced products and continue their quest to eat healthy food1
Net changes in eating habits in the last 12 monthsDifference between doing more and doing less, Percent
Savvy cost-cutters
SOURCE: McKinsey 2017-2018 McKinsey Global Sentiment Survey
Buying locally sourced products
Eating healthy foods
Buying natural or organic products
Reading nutrition labels in stores
15154
10
10122221
-2-4
158
-10-16
-8-3
09/201704/1703/2016 09/16
Egypt
McKinsey & Company 40|
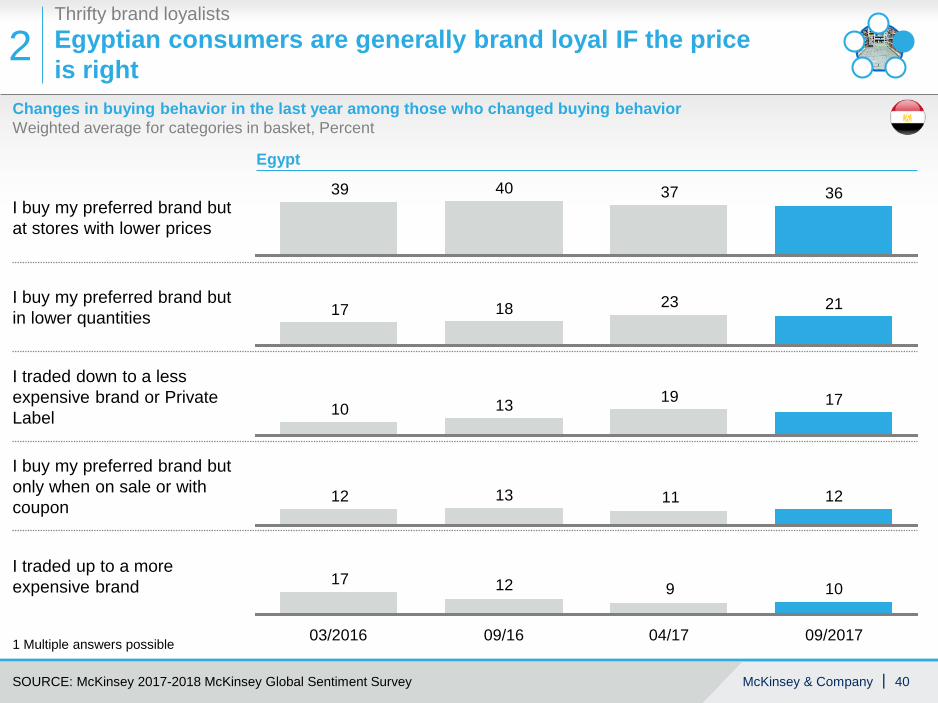
Changes in buying behavior in the last year among those who changed buying behavior Weighted average for categories in basket, Percent
2Thrifty brand loyalistsEgyptian consumers are generally brand loyal IF the price is right
1 Multiple answers possible
SOURCE: McKinsey 2017-2018 McKinsey Global Sentiment Survey
I buy my preferred brand but only when on sale or with coupon
I traded up to a more expensive brand
I buy my preferred brand but at stores with lower prices
I traded down to a less expensive brand or Private Label
I buy my preferred brand but in lower quantities
36374039
21231817
17191310
121312 11
1091217
09/16 09/201704/1703/2016
Egypt

McKinsey & Company 41|
2Thrifty brand loyalistsConsumers look for ways to buy their preferred brands for less and are willing to trade down especially in household products
1 Multiple answers possible
Changes in buying behavior in the last year among those who changed buying behavior, Weighted average for categories in basket, Percent
SOURCE: McKinsey 2017-2018 McKinsey Global Sentiment Survey
Macro category
I buy my preferred brand but at stores with lower prices
I buy my preferred brand but in lower quantities
I traded down to a less expensive brand or Private Label
I buy my preferred brand but only when on sale or with coupon
I traded up to a more expensive brand
I made another change
Non alcoholic beverageFood
Personal care
Household products
97
9
11
8
13
12
1310
12
2123
1917
40
3637
18
97
9
9
10
12
22
35
2420
13
10
20
40
12
10
17
35
8
9
11
7
9
9
8
19
24
12
14
121616
24
39
3939
869
13
21
13
32
16
16
12
14
16
18
20
19
12
3633
7
9
7
8
7
10
15
40
17
23
16
16
18
17
34
28
12
36
04/201709/2016 09/2017

McKinsey & Company 42|
17% of consumers trade down overall; 19% of this group buy Private Label
Selective splurgers
3
SOURCE: McKinsey 2017-2018 McKinsey Global Sentiment Survey
45
29.0
9
26.027.0
11 19 2315 33 37 39 41 4321 2913 2717 3125 35
6.0
20 38 44363026 42343224227 28 4064 10 12 142 163
12.0
1
8.0
85 18
18.0
0
14.0
30.0
9.0
24.0
22.0
5.0
10.0
20.0
28.0
7.0
16.0
11.0
17.0
13.0
19.0
21.0
15.0
23.0
25.0
Trade down rate among consumers who changed buying behavior - 2017Percent of consumers who reported trading down to less expensive brands or Private Label
Macro Household
Trade down rates to Private Label - 2017Percent of consumers who traded down to Private Label
Macro Non-Alcoholic Beverages
Macro Personal Care
Macro Household
Macro Foods
17% of consumers trade down on average
19% of consumer who trade down buy Private Label
Sep 2016 Apr 2017 Sep 2017

McKinsey & Company 43|
On average, 36% of trade down leads to happy consumersTrade-down converts
4
SOURCE: McKinsey 2017-2018 McKinsey Global Sentiment Survey
22.021.0
26.025.0
23.024.0
27.028.0
9.0
29.0
44 46 4927
7.08.0
14.0
31 45
16.0
29 43
17.018.019.0
21 3323 25 37 3935 41 47
6.0
30.0
11.012.013.0
15.0
20.0
10.0
505.0
22 4228 34 4824 26 32 3830 3620 40
Experience better than expected- 2017Percent of consumers who traded down reporting an experience better than expected
Trade down rate among consumers who changed buying behavior - 2017Percent of consumers who reported trading down to less expensive brands or Private Label
Macro Non-Alcoholic Beverages
Macro Personal Care
Macro Household
Macro Foods
36% of consumer who trade have an experience that is better than expected
Sep 2016 Apr 2017 Sep 2017
17% of consumers trade down on average
McKinsey & Company 44|
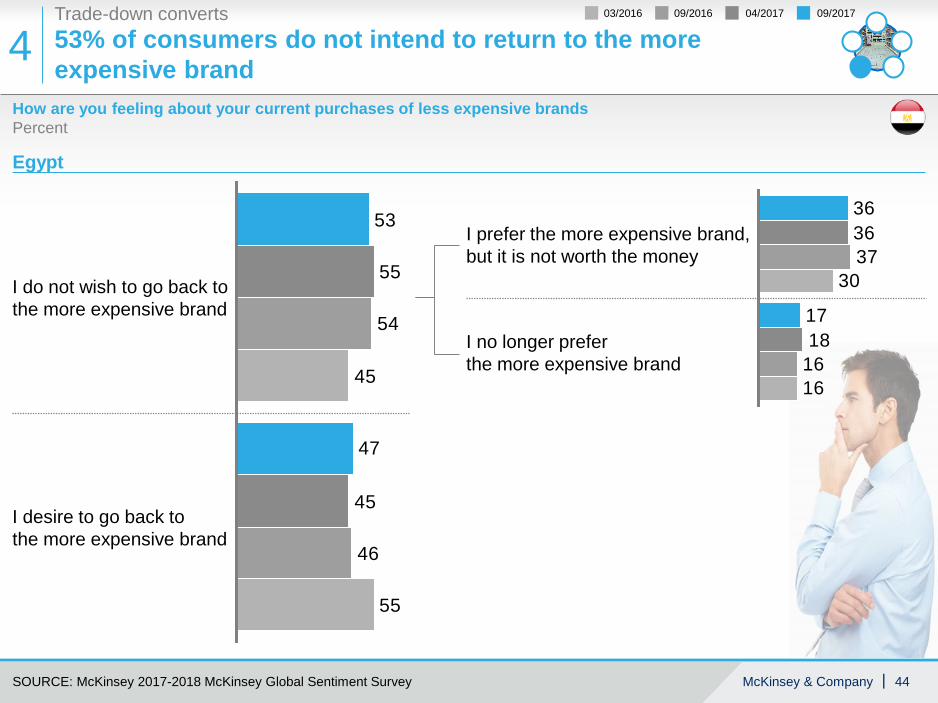
53% of consumers do not intend to return to the more expensive brand4Trade-down converts
How are you feeling about your current purchases of less expensive brandsPercent
SOURCE: McKinsey 2017-2018 McKinsey Global Sentiment Survey
Egypt
55
55
47
53
45
46
54
45
I desire to go back tothe more expensive brand
I do not wish to go back tothe more expensive brand
36
17
36
1618
37
16
30
I no longer preferthe more expensive brand
I prefer the more expensive brand,but it is not worth the money
04/201709/2016 09/201703/2016

McKinsey & Company 45|
Net change in household spending by channel cluster1
Based on stated behavior, Percent, last 12 months
Multichannel shoppers
5
1 other includes fresh food markets and mom & pop stores
SOURCE: McKinsey 2017-2018 McKinsey Global Sentiment Survey
Egypt
24
32
-15
3
1812
13
5
-20
9
28
-9
13
-3
30
Other
Club stores/cash & carry
Discounters
Grocery stores
Convenience stores
Egyptian consumers are shifting their spending towards discounters and club stores
04/201709/2016 09/2017
McKinsey & Company 46|
▪ Overview of the survey
▪ Saudi results
▪ UAE results
▪ Egypt results
▪ Pakistani results
Content

McKinsey & Company 47|
In-person surveys conducted in Pakistan are balanced by gender, age, and income
26232724
35-4425-3418-24 45-75
Age, percent
232849
low mid high
Income, percent
11
3851
IslamabadLahoreKarachi
Region, percent
All respondents are balanced by gender, age, and income1
Additional split by region
40% 60%1,000
Respondents1
SOURCE: McKinsey 2018 McKinsey Global Sentiment Survey
1 weighted percentages

McKinsey & Company 48|
Feelings of financial security in Pakistan is similar to that in the broader regionConsumers sentimentPercent of people agreeing/strongly agreeing with each statement, September 2017
Gen
eral
sen
timen
tFi
nanc
ial
secu
rity
Middle East -incl Pakistan
SOURCE: McKinsey 2018 Global Sentiment Survey
42
39
62
29
34
40
43
68
28
33I am optimistic about my household’s economy
I am optimistic about my country’s economy
I am somewhat or very worried that I or a member of my household will lose a job in the next year
I am living paycheck to paycheck
I am finding it harder to make ends meet now than 12 months ago

McKinsey & Company 49|
Pakistani consumers are more bullish in their spending
Consumers sentimentPercent of people agreeing/strongly agreeing with each statement, September 2017
SOURCE: McKinsey 2018 Global Sentiment Survey
Middle East -incl Pakistan
38
37
33
37
38
39
48
43
I would spend more money now if I was confident about the economy
Uncertainty about the economy is preventing me from making purchases
I cut back on spending
Given my economic situation, I am delaying purchases
McKinsey & Company 50|
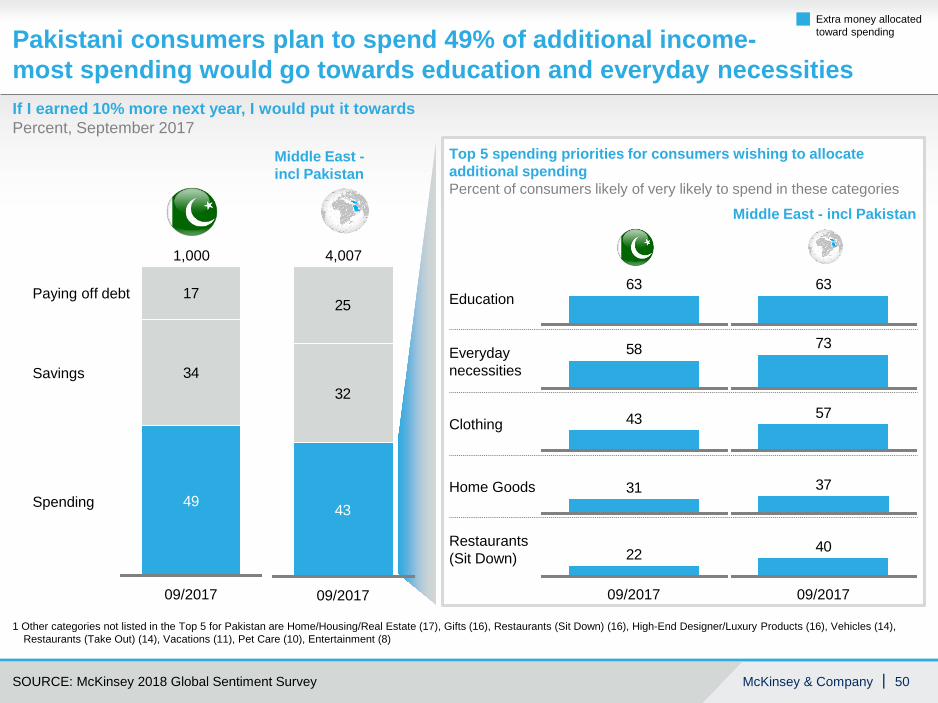
Pakistani consumers plan to spend 49% of additional income-most spending would go towards education and everyday necessities
SOURCE: McKinsey 2018 Global Sentiment Survey
Top 5 spending priorities for consumers wishing to allocate additional spendingPercent of consumers likely of very likely to spend in these categories
49
34
17
Savings
Paying off debt
09/2017
1,000
Spending 43
32
25
09/2017
4,007
If I earned 10% more next year, I would put it towards Percent, September 2017
1 Other categories not listed in the Top 5 for Pakistan are Home/Housing/Real Estate (17), Gifts (16), Restaurants (Sit Down) (16), High-End Designer/Luxury Products (16), Vehicles (14), Restaurants (Take Out) (14), Vacations (11), Pet Care (10), Entertainment (8)
Middle East -incl Pakistan
Middle East - incl Pakistan
Education
Everyday necessities
Clothing
Home Goods
Restaurants (Sit Down) 22
09/2017
40
09/2017
31 37
43 57
58 73
63 63
Extra money allocated toward spending

McKinsey & Company 51|
All consumers find creative ways to spend less and save money: 36% are paying more attention to prices
54% of consumers in Pakistan changed their consumer buying habits to save: 29% of consumers look to buy their preferred brands at stores with lower prices
Few Pakistani trade down (4%) while 10% trade up
Consumers in the region shift spending towards grocery stores Thrifty brand
loyalistsMultichannel
shoppers
Selective splurgers
Savvy cost-cutters
5 truths about today’s consumers in Pakistan
SOURCE: McKinsey 2018 Global Sentiment Survey

McKinsey & Company 52|
Consumers agreeing/strongly agreeing over the last 12 monthsPercent, September 2017
Pakistani consumers are finding creative ways to spend less and save money 1Savvy cost-cutters
SOURCE: McKinsey 2018 McKinsey Global Sentiment Survey
I am looking for sales and promotion
I use coupons and loyalty cards more often
I wait for products to go on sale
I am increasingly looking for ways to save money
I buy more in bulk
I shop around to get the best deals
I am delaying purchases
I am paying more attention to prices
38
Pakistan Middle East - incl Pakistan
51
37 45
37 48
34 49
34 33
34 30I buy more in bulk
32 43
32
09/2017
39
09/2017

McKinsey & Company 53|
Pakistani consumers also explore other eating habits to save money1
Net changes in eating habits in the last 12 monthsDifference between doing more and doing less, Percent, September 2017
Savvy cost-cutters
SOURCE: McKinsey 2018 McKinsey Global Sentiment Survey
Eating out or ordering take out
Preparing frozen meals
Eating in a sit down restaurant
Cooking from scratch
Make easy to prepare meals at home
Picking up fresh pre-prepared meals m
Packing lunches from home
Eating at home
23
Pakistan Middle East - incl Pakistan
15
21 31
1-3
-15 -30
-17 -27
-24
5
-25 -32
-33
09/2017-41
09/2017

McKinsey & Company 54|
Consumers buy locally sourced products and continue their quest to eat healthy food1
Net changes in eating habits in the last 12 monthsDifference between doing more and doing less, Percent, September 2017
Savvy cost-cutters
SOURCE: McKinsey 2018 McKinsey Global Sentiment Survey
Buying Natural or Organic Products
Eating Healthy Foods
Reading Nutrition Labels in Stores
Buying Locally Sourced Products
27
26
16
13
09/2017
Pakistan Middle East - incl Pakistan
-1
19
10
3
09/2017

McKinsey & Company 55|
Changes in buying behavior in the last year among those who changed buying behavior Weighted average for categories in basket, Percent, September 2017
2Thrifty brand loyalistsPakistani consumers are generally brand loyal IF the price is right; one in five trades down
1 Multiple answers possible
SOURCE: McKinsey 2018 McKinsey Global Sentiment Survey
I traded up to a more expensive brand
I traded down to a less expensive brand or Private Label
I buy my preferred brand but at stores with lower prices
I buy my preferred brand but only when on sale or with coupon
I buy my preferred brand but in lower quantities
29
22
10
10
4
09/2017
Pakistan Middle East - incl Pakistan
34
21
14
11
14
09/2017

McKinsey & Company 56|
2Thrifty brand loyalistsConsumers look for ways to buy their preferred brands for less; very few trade down and some trade up
1 Multiple answers possible
Changes in buying behavior in the last year among those who changed buying behavior, Weighted average for categories in basket, Percent, September 2017
SOURCE: McKinsey 2018 McKinsey Global Sentiment Survey
Macro category
I buy my preferred brand but at stores with lower prices
I made another change
I buy my preferred brand but in lower quantities
I buy my preferred brand but only when on sale or with coupon
I traded up to a more expensive brand
I traded down to a less expensive brand or Private Label
Non alcoholic beverageFood
Personal care
Household products
4
10
10
24
22
29
3
11
25
29
10
23
5
20
10
19
10
35
11
4
29
10
26
20
4
10
18
13
18
36
McKinsey & Company 57|
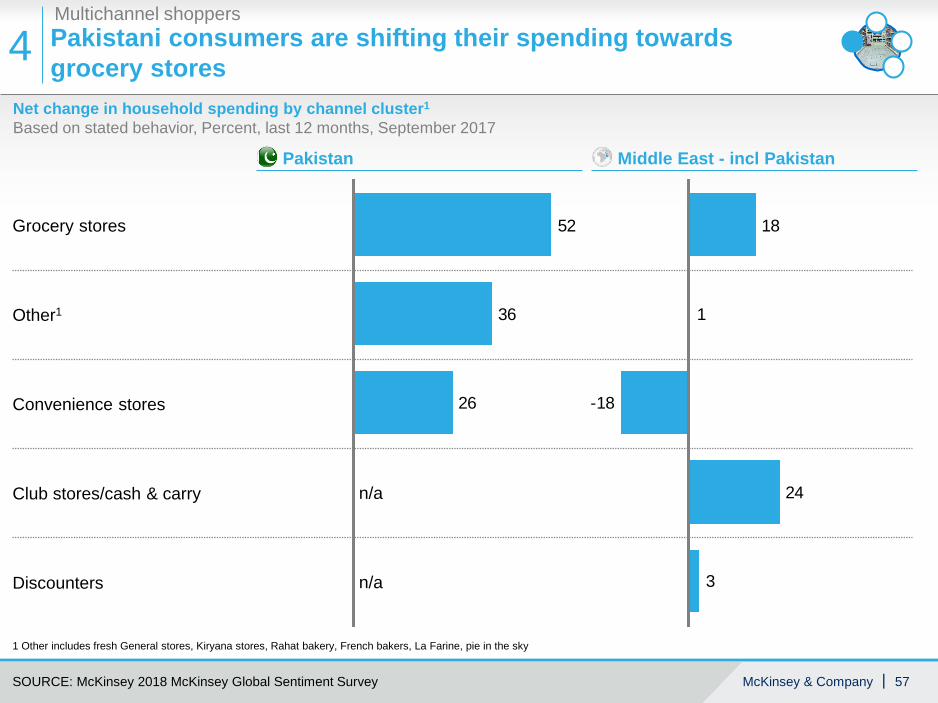
Net change in household spending by channel cluster1
Based on stated behavior, Percent, last 12 months, September 2017
Multichannel shoppers
4
1 Other includes fresh General stores, Kiryana stores, Rahat bakery, French bakers, La Farine, pie in the sky
SOURCE: McKinsey 2018 McKinsey Global Sentiment Survey
26
36
52
n/a
n/a
Pakistan Middle East - incl Pakistan
1
3
24
-18
18
Club stores/cash & carry
Other1
Grocery stores
Convenience stores
Discounters
Pakistani consumers are shifting their spending towards grocery stores