microscale vacuum pumps - bme eet
TRANSCRIPT

29Microscale Vacuum
Pumps
29.1 Introduction29.2 Fundamentals
Basic Principles • Conventional Types of Vacuum Pumps • Pumping Speed and Pressure Ratio • Definitions for Vacuum and Scale
29.3 Pump ScalingPositive-Displacement Pumps • Kinetic Pumps • Capture Pumps • Pump-Down and Ultimate Pressures for MEMS Vacuum Systems • Operating Pressures and Requirements in MEMS Instruments • Summary of Scaling Results
29.4 Alternative Pump TechnologiesOutline of Thermal Transpiration Pumping• Accommodation Pumping
29.5 ConclusionsAcknowledgments
29.1 Introduction
Numerous potential applications for meso- and microscale sampling instruments are based on massspectrometry [Nathanson et al., 1995; Ferran and Boumsellek, 1996; Orient et al., 1997; Piltingsrud,1997; Wiberg et al., 2000; White et al., 1998; Freidhoff et al., 1999; Short et al., 1999] and gas chroma-tography [Terry et al., 1979]. Other miniaturized instruments utilizing electron optics [Chang et al., 1990;Park et al., 1997; Callas, 1999] will require both high-vacuum and repeated solid-sample transfers fromhigher pressure environments. The mushrooming interest in chemical laboratories on chips will likelyevolve toward some manifestations requiring vacuum capabilities. At present, there are no microscale ormesoscale vacuum pumps to pair with the embryonic instruments and laboratories that are being devel-oped. Certainly, small vacuum pumps will not always be necessary. Some of the new devices are attractivebecause of low quantities of waste and rapidity of analysis, not directly because they are small, energyefficient, or portable. However, for other applications involving portability and/or autonomous opera-tions, appropriately small vacuum pumps with suitably low power requirements will be necessary. Thischapter addresses the question of how to approach providing microscale and mesoscale vacuum pumpingcapabilities consistent with the volume and energy requirements of meso- and microscale instruments andprocesses in need of similarly sized vacuum pumps. It does not review existing microscale pumping devicesbecause none are available with attractive performance characteristics (a review of the attempts has recentlybeen presented by Vargo, 2000; see also NASA/JPL, 1999).
In the macroscale world, vacuum pumps are not very efficient machines, ranging in thermal efficienciesfrom very small fractions of one percent to a few percent. They generally do not scale advantageously to
N
E. Phillip MuntzUniversity of Southern California
Stephen E. VargoSiWave, Inc.
© 2002 by CRC Press LLC

small sizes, as is discussed in the section on pump scaling. Because of the continuing significant effortsto miniaturize instruments and chemical processes, it is a reasonable hypothesis that there is not muchattraction in using oversized, power-intensive vacuum pumps to permit them to operate. This is probablygenerally true even for situations where pump size and power are not critical issues. More specifically,because microscale-generated vacuums are unavailable today, serious limits are imposed on the potentialmicroscale applications of many high-performance analytical instruments and chemical processes whereportability or autonomous operations are necessary.
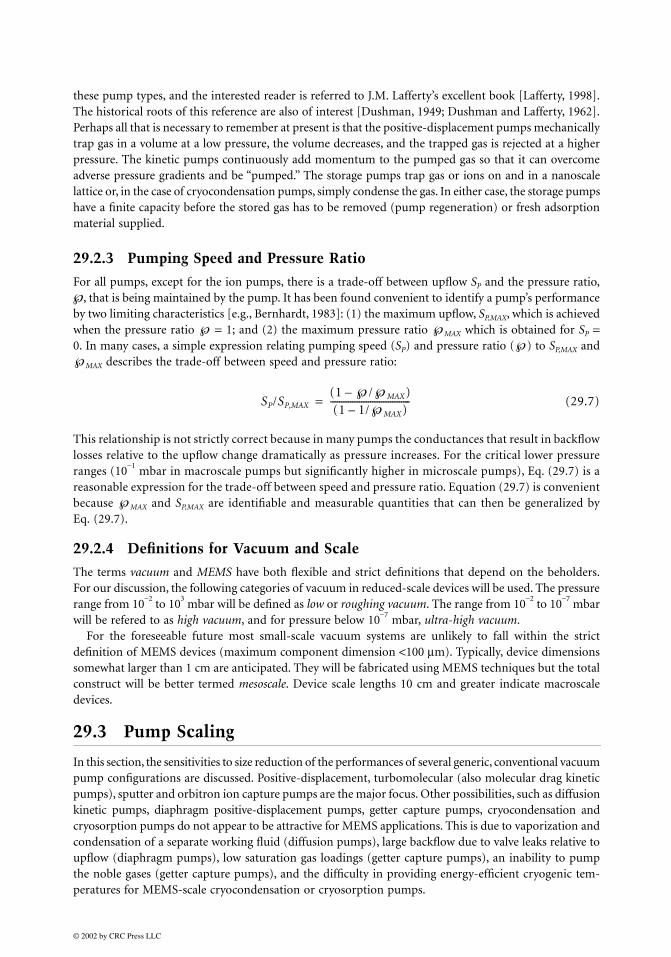
To illustrate this point, the performance characteristics of several types of macroscale and mesoscalevacuum pumps are presented in Figure 29.1 and Table 29.1. Pumping performance is measured by ,which is derived from the power required ( ) and the pump’s upflow in molecules per unit time
Representative vacuum pumping tasks are indicated by the inlet pressure pI and the pressureratio ℘ through which is being pumped. Also shown in the figure is the reversible, constant-temperature compression power required per molecule of upflow ( ) as a function of ℘. The adiabaticreversible (isentropic) compression power that would be required is also shown in Figure 29.1. Theconstant temperature comparison is most appropriate for vacuum systems. Note the 3- to 5-decade gapin the ideal and the actual values for the macroscale vacuum pumps. For low pump inlet pressures,the gases are very dilute and high volumetric flows are required to pump a given . The result is relativelylarge machines with significant size and frictional overheads. Unfortunately, scaling the pumps to smallersizes generally increases the overhead relative to the upflow .
In addition to the power requirement, vacuum pumps tend to have large volumes, so that anotherindicator of relevance to miniaturized pumps is a pump’s volume (VP) per unit upflow . The twomeasures and will be used throughout the following discussions for evaluating differentapproaches to the production of microscale vacuums.
The bias adopted in this chapter is to address only the production of appropriate vacuums wherethroughput or continuous gas sampling or, alternatively, multiple sample insertions are required. In somecases, so-called capture pumps (sputter ion pumps, getter pumps) may provide a convenient high- andultra-high-vacuum pumping capacity. However, because of the finite capacity of these pumps beforeregeneration, they may or may not be suitable for long-duration studies. Because such trade-offs are verysituation dependent, only the sputter ion and orbitron ion capture pumps are considered in the present
FIGURE 29.1 Representative performance ( ) of selected macro- and mesoscale vacuum pumps (from Table29.1) as a function of pressure ratio (℘).
10 109
Group 1Group 2Group 3IsentropicReversibleT = constant
Apparent high performance limit of representative macro- and mesoscale pumps
TM-2TM-4
PER
DIF RBSCL, CLRVSCW
T/DR
ORB
SP
℘
Q•
N•
10-12
10-13
10-14
10-15
10-16
10-17
10-18
10-19
10-20
10-21
102 103 104 105 106 107 108 1010
Q/N
Q/NQ,W
(N, #/s).N
Q/N
Q/NN
N
(VP/N)Q/N VP/N
© 2002 by CRC Press LLC

study. Both of these pump “active” (N2, O2, etc.) and inert (noble and hydrocarbon) gases, whereas othernonevaporable and evaporable getters only pump the active gases efficiently [Lafferty, 1998].
29.2 Fundamentals
29.2.1 Basic Principles
Several basic relationships that are derived from the kinetic theory of gases [cf. Bird, 1994; Lafferty, 1998;Cercignani, 2000] are important to the discussion of both macroscale and microscale vacuum pumps.The conductance or volume flow in a channel under free molecule or collisionless flow conditions canbe written as:
(29.1)
where CL is the channel volume flow in one direction for a channel of length L. The conductance of theupstream aperture is CA and α is the probability that a molecule, having crossed the aperture into thechannel, will travel through the channel to its end (this includes those that pass through without hittinga channel wall and those that have one or more wall collisions). Employing the kinetic theory expressionfor the number of molecules striking a surface per unit time per unit area gives
(29.2)
where: AA is the aperture’s area; is the mean thermal speed of the gas molecules ofmass m; k is Boltzmann’s constant; and Tg and ng are the gas temperature and number density, respectively.The probability, α , can be determined from the length and shape of the channel and the rules governingthe reflection at the channel’s walls [c.f. Lafferty, 1998; Cercignani, 2000].
TABLE 29.1 Data with Sources for Conventional Vacuum Pumps that Might be Consideredfor Miniaturization
Type pI, pE (mbar) SP (1/s) (W) (W/ #/s) ℘(—) Comments and Sources
Group 1: Macroscale Positive Displacement
Roots blower (RB) 2E-2, 1E3 2.8 2100 1.6E-15 5E4 5 stage (Lafferty, 1998, p. 161)Claw (CL) 2E-2, 1E3 6.1 2100 7.5E-16 5E4 4 stage (Lafferty, 1998, p. 165)Screw (SCW) 2E-2, 1E3 3.6 500 3E-16 5E4 (Lafferty, 1998, p. 167)Scroll (SCL) 2E-2, 1E3 1.4 500 7.7E-16 5E4 (Lafferty, 1998, p. 168)Rotary vane (RV) 2E-2, 1E3 0.7 250 6.2E-16 5E4 Catalog
Group 2: Macroscale Kinetic and Ion
Drag (DR) 2E-2, 1E3 36 3300 1.9E-16 5E4 Molecular/regenerative(Lafferty, 1998, p. 253)
Diffusion (DIF) 1E-5, 1E-1 2.5E4 1.4E3 2.5E-15 1E4 Zyrianka catalogTurbo/drag (T/DR) 1E-5, 4.5E1 30 20 2.5E-15 4.5E6 Alcatel catalog (30H+30)Orbitron (ORB) 1E-7, 1E3 1700 750 2E-13 1E10 (Denison, 1967)
Group 3: Mesoscale Pumps
Turbomolecular (TM-4)
1E-5, 1E-2 4 2 2E-15 1E3 Experimental, fP 1.7 E3, 4-cmdia., Creare web site
Peristaltic (PER) 1.6, 1E3 3.3E-3 20 1E-16 6E2 (Piltingsrud, 1996)Sputter ion (SP) 1E-7, 1E3 2.2 1.1E-2 1.7E-15 1E10 Based on Suetsugu (1993), 1.5-cm
dia., 3.1-cm lengthTurbomolecular
(TM-2)1E-5, 1E-2 1.5 2 5E-15 1E3 Muntz scaling of Creare pump to
2-cm dia., using Bernhardt(1983)
QQ/N
CL CAα=
ngC′/4( )
CA (C′/4)AA (8kTg/πm)1/2/4 AA= =
C′ 8kTg/πn 1/2=
© 2002 by CRC Press LLC

Several terms associated with wall reflection will be used. Diffuse reflection of molecules occurs whenthe angle of reflection from the wall is independent of the angle of incidence, with any reflected directionin the gas space equally probable per unit of projected surface area in that direction. The reflection issaid to be specular if the angle of incidence equals the angle of reflection and both the incident andreflected velocities lie in the same plane and have equal magnitude.
The condition for effectively collisionless flow (no significant influence of intermolecular collisions)is reached when the mean free path (λ) of the molecules between collisions in the gas is significantlylarger than a representative lateral dimension (l) of the flow channel. Usually this is expressed by theKnudsen number (Kn), such that:
(29.3)
The mean free path λ can have, for our purposes, the elementary kinetic theory form,
(29.4)
with Ω being the temperature-dependent, hard-sphere, total-collision cross section of a gas molecule(for a hard-sphere gas of diameter d, Ω = πd
2). As an example, the mean free path for air at 1 atm and
300 K is λ ≈ 0.06 µm.Expressions for conductance analogous to Eq. (29.1) can be obtained for transitional (10 > Knl > 0.01)
flows and continuum (Knl ≤ 10−3
) viscous flows [Cercignani, 2000, and references therein]. For ourdiscussion, the major interest is in collisionless and early transitional flow (Kn ≥ 0.1).
The performance of a vacuum pump is conventionally expressed as its pumping speed or volume ofupflow (Sp) measured in terms of the volume flow of low-pressure gas from the chamber that is beingpumped (see Lafferty, 1998, for details on the size and shape of the chamber). Following the recipe ofEq. (29.1), the pumping speed can be written as:
(29.5)
Once a molecule has entered the pump’s aperture of conductance CAP , it will be “pumped” with probabilityαP . Clearly, (1 − αP) is the probability that the molecule will return or be backscattered to the low-pressurechamber. A pump’s upflow in this chapter will generally be described in terms of the molecular upflowin molecules per unit time ( , #/s). For a chamber pressure pI and temperature TI, the number densitynI is given by the ideal gas equation of state, pI = nIkTI, and the molecular upflow is
(29.6)
29.2.2 Conventional Types of Vacuum Pumps
The several types of available vacuum pumps have been classified [c.f. Lafferty, 1998] into convenientgroupings, from which potential candidates for microelectromechanical systems (MEMS) vacuum pumpscan be culled. The groupings are
• Positive-displacement (vane, piston, scroll, Roots, claw, screw, diaphragm)
• Kinetic (vapor jet or diffusion, turbomolecular, molecular drag, regenerative drag)
• Capture (getter, sputter ion, orbitron ion, cryopump)
In systems requiring pressures <10−3
mbar, the positive-displacement, molecular and regenerative dragpumps are used as “backing” or “fore” pumps for turbomolecular or diffusion pumps. In their operatingpressure range (<10
−4 mbar), the capture pumps require no backing pump but have a more or less limited
storage capacity before requiring “regeneration.” Also, some means to pump initially to about 10−4
mbarfrom the local atmospheric pressure is necessary. There is insufficient space here to discuss the details of
Knl λ/l 10≥=
λ 1/( 2Ωng)=
SP CAPαP=
N
N SPnI=
© 2002 by CRC Press LLC
these pump types, and the interested reader is referred to J.M. Lafferty’s excellent book [Lafferty, 1998].The historical roots of this reference are also of interest [Dushman, 1949; Dushman and Lafferty, 1962].Perhaps all that is necessary to remember at present is that the positive-displacement pumps mechanicallytrap gas in a volume at a low pressure, the volume decreases, and the trapped gas is rejected at a higherpressure. The kinetic pumps continuously add momentum to the pumped gas so that it can overcomeadverse pressure gradients and be “pumped.” The storage pumps trap gas or ions on and in a nanoscalelattice or, in the case of cryocondensation pumps, simply condense the gas. In either case, the storage pumpshave a finite capacity before the stored gas has to be removed (pump regeneration) or fresh adsorptionmaterial supplied.
29.2.3 Pumping Speed and Pressure Ratio
For all pumps, except for the ion pumps, there is a trade-off between upflow SP and the pressure ratio,, that is being maintained by the pump. It has been found convenient to identify a pump’s performance
by two limiting characteristics [e.g., Bernhardt, 1983]: (1) the maximum upflow, SP,MAX, which is achievedwhen the pressure ratio ℘ = 1; and (2) the maximum pressure ratio ℘MAX which is obtained for SP =0. In many cases, a simple expression relating pumping speed (SP) and pressure ratio (℘) to SP,MAX and℘MAX describes the trade-off between speed and pressure ratio:
(29.7)
This relationship is not strictly correct because in many pumps the conductances that result in backflowlosses relative to the upflow change dramatically as pressure increases. For the critical lower pressureranges (10
−1 mbar in macroscale pumps but significantly higher in microscale pumps), Eq. (29.7) is a
reasonable expression for the trade-off between speed and pressure ratio. Equation (29.7) is convenientbecause ℘MAX and SP,MAX are identifiable and measurable quantities that can then be generalized byEq. (29.7).
29.2.4 Definitions for Vacuum and Scale
The terms vacuum and MEMS have both flexible and strict definitions that depend on the beholders.For our discussion, the following categories of vacuum in reduced-scale devices will be used. The pressurerange from 10
−2 to 10
3 mbar will be defined as low or roughing vacuum. The range from 10
−2 to 10
−7 mbar
will be refered to as high vacuum, and for pressure below 10−7
mbar, ultra-high vacuum.For the foreseeable future most small-scale vacuum systems are unlikely to fall within the strict
definition of MEMS devices (maximum component dimension <100 µm). Typically, device dimensionssomewhat larger than 1 cm are anticipated. They will be fabricated using MEMS techniques but the totalconstruct will be better termed mesoscale. Device scale lengths 10 cm and greater indicate macroscaledevices.
29.3 Pump Scaling
In this section, the sensitivities to size reduction of the performances of several generic, conventional vacuumpump configurations are discussed. Positive-displacement, turbomolecular (also molecular drag kineticpumps), sputter and orbitron ion capture pumps are the major focus. Other possibilities, such as diffusionkinetic pumps, diaphragm positive-displacement pumps, getter capture pumps, cryocondensation andcryosorption pumps do not appear to be attractive for MEMS applications. This is due to vaporization andcondensation of a separate working fluid (diffusion pumps), large backflow due to valve leaks relative toupflow (diaphragm pumps), low saturation gas loadings (getter capture pumps), an inability to pumpthe noble gases (getter capture pumps), and the difficulty in providing energy-efficient cryogenic tem-peratures for MEMS-scale cryocondensation or cryosorption pumps.
℘
SP/SP,MAX
(1 ℘/℘MAX)–(1 1/℘MAX)–
------------------------------------=
© 2002 by CRC Press LLC

29.3.1 Positive-Displacement Pumps
Consider a generic positive-displacement pump that traps a volume VT of low-pressure gas with afrequency of fT trappings per unit time. In order to derive a phenomenological expression for pumpingspeed several inefficiencies must be taken into account: backflow due to clearances, which is particularlyimportant for dry pumps and the volumetric efficiency of the pump’s cycle, including both time-dependent inlet conductance effects and dead volume fractions. The generic positive-displacement pumpis illustrated in Figure 29.2. Without going into detail, the pumping speed (SP) for an intake numberdensity nI and an exhaust number density nE (or ℘ corresponding to the pressures pI and pE, as theprocess gas temperature is assumed to be constant in the important low-pressure pumping range) canbe derived:
(29.8)
FIGURE 29.2 Generic positive-displacement vacuum pump.
Sp (1 ℘℘G1–– )(1 e
CLI/VT,I fT( )β1–– )VT,I fT (℘ 1– )CLBβ2–=
2
3
45
6
1011
21
3
8
2
71
812
4 6
7 12
7
1
9
Backflow loss
pI
Intake
VT,I VT,E
Exhaust
pE
℘ = VT,I /VT,E
Intake from pI to VT,I at pressure pE/pG, partial filling of VT,I due to limited inlet time.VT,I closed at ≤ pI.
Volume decreases and backflow loss begins.
Volume continues to decrease to VT,E, backflow increases, pressure in VT,E > pE .
Exhaust of excess pressure from VT,E to pE.
VT,E closed with pressure pE.
Volume expands to VT,I, pressure drops to pE/℘G.
Cycle repeats.
© 2002 by CRC Press LLC
where ℘ is the pressure ratio pE/pI nE/nI (assuming TI = TE); CLI is the pump’s inlet conductance; VT,I
is the trapping volume at the inlet; CLB is the conductance of the backflow channels between exhaust andinlet pressures; ℘G = VT,I/VT,E is the geometric trapped-volume ratio between inlet and exit; β1 is thefraction of the trapping cycle during which the inlet aperture is exposed; and β2 is the fraction of thecycle during which the backflow channels are exposed to the pressure ratio ℘.
The pumping speed expression of Eq. (29.8) applies most directly to a single compression stage. Thebackflow conductance is assumed to be approximately constant because the flow is in the “collisionless”flow regime that exists in the first few stages of a typical dry pumping system. The inlet conductance fora dry microscale system will be in the collisionless flow regime at low pressure (say 10
−2 mbar). The inlet
conductance per unit area can increase significantly (amount depends on geometry) for transitional inletpressures [Sone and Itakura, 1990; Lafferty, 1998; Sharipov and Seleznev, 1998]. The performance ofmacroscale (inlet apertures of several centimeters and larger) positive-displacement pumps at a giveninlet pressure will thus benefit from the increased inlet conductance per unit area compared to theirreduced scale counterparts in the important low-pressure range of 10
−3 to 10
−1 mbar.
The term (1 − ℘ ) in Eq. (29.8) represents an inefficiency due to a finite dead volume in the exhaustportion of the cycle. The effect of incomplete trapped volume filling during the open time of the inletaperture is represented by . The ideal (no inefficiencies) pumping speed is VT,IfT. Thebackflow inefficiency is (℘ − 1)CLBβ2. The dimensions of all groupings are volume per unit time. As inall pumps, a maximum upflow (SP,MAX) can be found by assuming ℘ = 1 in Eq. (29.8). Similarly, themaximum pressure ratio (℘MAX) can be obtained from Eq. (29.8) by setting SP = 0. With some manip-ulations, Eq. (29.8) can be rewritten as:
(29.9)
The relationship between ℘, ℘MAX, SP and SP,MAX can be found by setting ℘ = 1 in Eq. (29.9). Substitutingback into Eq. (29.9) gives the same expression as in Eq. (29.7).
For the purposes of the present discussions, the upflow of molecules per unit time is auseful measure of pumping speed. The form of Eq. (29.9) has been checked by fitting it successfully toobserved pumping curves (SP vs. pI) for several positive-displacement pumps (using data in Lafferty,1998) between inlet pressures of 10
−2 and 10
0 mbar. This is done by following Eq. (29.9) and replotting
the experimental results using SP and (℘MAX –℘) as the two variables. The variation of inlet conductancewith Kn, CLI(Kn), is important in matching Eq. (29.9) to the observed pumping performances.
At low inlet pressures, the energy use of positive-displacement pumps is dominated by friction lossesdue to the relative motion of their mechanical components. Taking the two possibilities of sliding andviscous friction as limiting cases, the frictional energy losses can be represented as:
(29.10a)
for sliding friction, and for viscous friction:
(29.10b)
Here, and are the powers required to overcome sliding friction and viscous friction, respectively.The coefficients are, respectively, µsf and µ; As is the effective area involved; is the normal force perunit area; and is a representative relative speed of the two surfaces that are in contact for sliding frictionor separated by a distance h for the viscous case. The contribution to viscous friction in clearance channelsexposed to the process gas at low pumping pressures is usually not important, but there may be significantviscous contributions from bearings or lubricated sleeves. An estimate of the power use per unit of upflowcan be obtained by combining Eqs. (29.9) and (29.10) to give ( ), with units of power per moleculeper second or energy per molecule.
℘G1–
(1 e CLI/VT ,IfT( )β1– )–
SP VT,I fT℘G1– 1 (CLBβ2/VT,I fT)℘G exp( CLIβ1/VT,I fT)––+ (℘MAX ℘)–=
(N SPnI)=
Qsf uµsf AsFN=
Qµ uµAs(u/h)=
Qsf Qµ
FN
u
Q/N
© 2002 by CRC Press LLC

Consider the geometric scaling to smaller sizes of a “reference system” macroscopic positive-displacementvacuum pump. The scaling is described by a scale factor si applied to all linear dimensions. Inevitablemanufacturing difficulties when si is very small are put aside for the moment. As a result of the geometricscaling, the operating frequency fT,i needs to be specified. It is convenient to set , whichkeeps the component speeds constant between the reference and scaled versions. This may not be possiblein many cases; another more or less arbitrary condition would be to have fT,i = fT,R. Using the scalingfactor and Eq. (29.9), an expression for the scaled pump upflow, , can be written as a function of si andvalues of the pump’s important characteristics at the reference or si = 1 scale (e.g., ).For the case of ,
(29.11)
Similarly, the scaled version of Eq. (29.10b) becomes:
(29.12)
Forming the ratios eliminates many of the referencesystem characteristics and highlights the scaling. In this case, for the viscous energy dissipation permolecule of upflow in the scaled system compared to the same quantity in the reference system, a scalingrelationship is obtained:
(29.13)
A summary of the results of this type of scaling analysis applied to positive-displacements pumps ispresented in Table 29.2, along with all the other types of pumps that are considered below. In Table 29.2it is convenient to summarize the performance using ℘MAX (SP = 0) and SP,MAX or (℘ = 1) in orderto eliminate ℘ appearing explicitly as a variable in the scaling expressions through the dependency of
on the pressure ratio (refer to Eq. (29.11)).
29.3.2 Kinetic Pumps
Because of their sensitivity to orientation and their potential for contamination, diffusion pumps do notappear to be suitable for MEMS-scale vacuum pumps, except possibly for situations permitting fixedinstallations. The other major kinetic pumps, turbomolecular and molecular drag, require high-rotational-speed components but are dry and in macroscale versions can be independent of orientation, at least intime-independent situations. More or less arbitrarily, only the turbomolecular and molecular drag pumpsare discussed in this chapter.
A simplified model of turbomolecular pumping has been developed by Bernhardt (1983). Followingthis description, the maximum pumping speed (℘ = 1) of a turbomolecular pumping stage (rotatingblade row and a stator row) can be written as:
(29.14)
In Eq. (29.14): AI is the inlet area to the rotating blade row; vc is an average tangential speed of the blades;q is the trapping probability of the rotating blade row for incoming molecules, and besides blade geometryit is a function of ( ). The term, df, accounts for a reduction in transparency due to blade thickness.It is assumed in Eq. (29.14) that the blades are at an angle of 45° to the rotational plane of the blades.As an instructive convenience, write ; vr is similar to but not identical with the Mach number.
fT ,i si1– fT ,R=
Ni
VT,I,i si3VT,I ,Rsi
1– fT ,R=fT ,i si
1–= fT ,R
Ni nIsi3VT,I ,Rsi
1– fT ,R℘G1– [1 (si
2CLB ,Rβ2/si3VT,I ,Rsi
1– fT ,R)℘G+=
exp (si2CLI ,Rβ1/si
3VT,I,Rsi1– fT ,R)– ](℘MAX ℘)––
Qµ ,i u2µsi
2AS ,R/sihR=
(Qµ ,i/Qµ ,R)/(Ni/NR) (Qµ ,i/Ni)/(Qµ ,R/NR)≡
(Qµ ,i/Ni)/(Qµ ,R/NR) si1–=
NMAX
N
SP ,MAX AI(C′/4)(vc/C′)/ (1/qdf) (vc/C′)+[ ]=
vc/C′
vr (vc/C′)=
© 2002 by CRC Press LLC

The maximum pressure ratio (SP = 0) can be written as [Bernhardt, 1983]:
(29.15)
where ξ is a constant that depends on blade geometry. Dividing Eq. (29.14) by gives thepumping probability:
(29.16)
The ℘MAX for turbomolecular stages is generally large (> [105]) for gases other than He and H2 due to
the exponential expression of Eq. (29.15). During operation in a multistage pump, the stages can beemployed at pressure ratios of ℘ << ℘MAX. Thus, from Eq. (29.7) (which also applies to turbomoleculardrag stages), the pumping speed approaches SPMAX.
The scaling characteristics of turbomolecular pumps can be derived using Eqs. (29.14) and (29.15).It is assumed that the pump blades remain similar during the scaling. The tangential speed (vc) will bewritten as 2πRfp, where R is a characteristic radius of the blade row and fp is the rotational frequency inrps. From Eqs. (29.14) and (29.15):
(29.17)
TABLE 29.2a Effect of Scaling on Performance
Type
Positive displacement
1 1 si
Turbomolecular 1 1 si
Positive displacement
[1] to [si] > [1] > [1] > [1]
Turbomolecular > > >
Sputter ion (inactive and active gases)
1 VD,i/VD,R ≈ 1 si
Orbitron ion active gases
1 1 si
Obitron ion inactive gases (ions)
1 si 1
Notes: For the case of fT, i = fT, R the expressions that result are sensitive to the particular importance of backflow andinlet losses in each case. Estimates have been made, using typical values for the losses, of the order of magnitude of theseexpressions in order to simplify the presentation. The detailed expressions appear below in Table 29.2b. The scaling ofVP,i/VP,R is assumed to be as when obtaining the scaling.
℘MAX,i
℘MAX,R-------------------
SP ,MAX ,i
SP ,MAX ,R---------------------
(Qsf/NMAX)i
(Qsf/NMAX)R
--------------------------------(Qµ/NMAX)i
(Qµ/NMAX)R
--------------------------------VP/NMAX( )i
VP/NMAX( )R
-------------------------------
fT ,i si1–fT ,R (ui uR)= =
si2
si1–
si2
si1–
fT ,i fT ,R (ui siuR)= =
si3[ ]
(℘MAX R, )(si 1)–
si4[ ] si
1–[ ] si1–[ ] si
1–[ ]
℘MAX,i
℘MAX,R-------------------
SP ,MAX ,i
SP ,MAX ,R--------------------- (Q/NMAX)i/(Q/NMAX)R
(VP/NMAX)i
(VP/NMAX)R
-------------------------------
si2
si2
si2
si3 (VP/NMAX)i/(VP/NMAX)R
℘MAX eξvr=
AI(C′/4)
αP ,MAX vr/ (1/qdf) vr+[ ]=
(SP ,MAX)i si2AI ,R(C′/4) 2πsiRR fP ,i/C′[ ]/ (1/qidf ,i) (2πsiRR fP ,i/C′)+[ ] =
℘MAX ,i exp(ξ2πsiRR fPi/C′)=
© 2002 by CRC Press LLC

losses, but the larger KB,R the more serious thet pumps.
i
R
--(Qµ/NMAX)i
(Qµ/NMAX)R
--------------------------------
R)
I ,R)-------
1 exp ( KI ,R)––
1 exp ( si1–KI ,R)––
-------------------------------------
,R/C′)
R/C′)------------
(qRdf ,R)
1–(sivc ,R/C′)+
(qRdf ,R)1–
(vc ,R/C′)+-----------------------------------------------
TABLE 29.2b Detailed Expressions for Size Scaling with fT, i = fT,R
Type
Positive displacement
Turbomolecular
Notes: The KI,R and KB,R are associated with the inlet loses and backflow losses, respectively (larger KI,R leads to less inlet,backflow loss). KI,R = CLI,Rβ1/VTI,R fT,R, KB,R = CLB,Rβ2/VTI,R fT,R. The symbols are defined in the section on positive displacemen
℘MAX,i
℘MAX,R-------------------
SP ,MAX ,i
SP ,MAX ,R---------------------
(Qsf/NMAX)
(Qsf/NMAX)------------------------------
1 exp ( si1–KI ,R)– si
1–KB ,R+–
1 exp ( KI ,R)– KB ,R+–-----------------------------------------------------------------------
1 exp ( KI ,R)– ℘GKB ,R+–
1 exp ( si1–KI ,R)– si
1– ℘GKB ,R+–----------------------------------------------------------------
si3 1 exp ( si
1–KI ,R)––
1 exp( KI ,R)––-------------------------------------
1 exp ( KI ,––
1 exp ( si1–K––
------------------------------
(℘MAX ,R)(si 1)–
si3 (qRdf ,R)
1–(vc ,R/C′)+
(qRdf ,R)1–
si(vc ,R/C′)+-----------------------------------------------------------
(qRdf ,R)1–
(sivc+
(qRdf ,R)1–
(vc ,+-----------------------------------
© 2002 by CRC Press LLC

For example, the case of fP,i = fP,R, df,i = df,R, gives
(29.18)
(29.19)
For the case of (constant vc)
(29.20)
A complete set of scaling results is presented in Table 29.2.
29.3.3 Capture Pumps
29.3.3.1 Sputter Ion Pumps
The sputter ion pump (SIP) is an option for high-vacuum MEMS pumping. The application of simplescaling approaches to these pumps is difficult; however, centimeter-scale pumps are already available.The SIP has the basic configuration illustrated in Figure 29.3. A cold cathode discharge (Penning discharge),self-maintained by a several-thousand-volt potential difference and an externally imposed magnetic fieldthat restricts the loss of discharge electrons, causes ions created in the discharge by electron-neutralcollisions to bombard the cathodes. The energetic ions (with energy some fraction of the driving poten-tial) both sputter cathode material (usually Ti) and imbed themselves in the cathodes. Sputtered materialdeposits on the anode and portions of the opposing cathodes. The freshly deposited material acts as acontinuously refreshed adsorption pumping surface for “active” gases (most things other than the noble
FIGURE 29.3 Sputter ion pump schematic.
(SP,MAX)i
(SP,MAX)R
--------------------- si3 (1/qRdf ,R) (vc ,R/C′)+[ ]/ (1/qidf ,R) (sivc ,R/C′)+[ ]=
℘MAX,i (℘MAX ,R)si 1–
=
fP ,i si1– fP ,R=
(SP,MAX)i
(SP,MAX)R
---------------------- si2, ℘MAX,i ℘MAX,R= =
s
s
s
s
B
ee
s
s
s
s
Cylindrical anode
Cathode
Active neutrals are adsorbed and sputtered material deposited on anode’s inner wall.
Vd
Pumping is through spaces between cathodes and anode.
Cathode Ions sputter cathode and are permanently buried on periphery of both cathodes.
© 2002 by CRC Press LLC

gases and hydrocarbons). Small (down to an 8-mm-diameter anode cylinder and a cathode separationof 3.6 cm) pumps have been studied theoretically by Suetsugu (1993). His results compare reasonablywell to experimental results for the particular case of a 1.5-cm-diameter anode. For a discharge voltageof 3000 V, a magnetic field strength of 0.3 T and a 0.8-cm-diameter anode, a pumping speed of slightlygreater than 0.5 l/s is predicted at 10
−8 Torr. For these conditions, the discharge is operating in the high-
magnetic-field (HMF) mode, which results in a maximum pumping speed. The pumping speed increasesslowly as pressure increases.
SIPs have a finite but relatively long life and may be useful when ultra-high vacuums are required insmall-scale systems. Their scaling to true MEMS sizes is uncertain because they require several thousandvolts to operate reasonably effectively (ion impact energies approaching 1000 V are required for efficientsputtering and rare gas ion burial). The description of the SIP operation developed by Suetsugu (1993)can be used to provide a scaling expression (that needs to be employed cautiously). The power used bythe discharge can be obtained knowing the applied potential difference, VD, and the ion current, Iion.Suetsugu (1993) gives for the pumping speed:
(29.21)
where pI is the pressure in Torr, is the sputtering coefficient of cathode material due to the impact ofenergetic ions, and q is the sticking coefficient for active gases on the sputtered material. The charge onan electron is e, and KG is a nondimensional geometric parameter derived from the electrode configurationthat remains constant with geometric scaling. An expression for the power required per pumped moleculebecomes:
(29.22)
and
(29.23)
This assumes qi = qR, .The scaling expression for pumping speed becomes:
(29.24)
where the SP,MAX is employed to be consistent with the previous usage for other pumps, although the Eq.(29.7) relationship does not really apply in this case.
The ion current is obtained by an iterative numerical solution involving the number density of trappedelectrons [Suetsugu, 1993]. The scaling expression for in Eq. (29.23) is particularly simple becausethe ion currents cancel. The scaling represented by Eq. (29.23) appears reasonably valid providing remains relatively constant, which implies that the ion energy should be relatively constant. Ion burialin the cathodes, which is the mechanism by which SIPs pump rare gases, is not discussed in detail herebut can be considered within the framework of Suetsugu’s analysis. Scaling results are summarized inTable 29.2.
29.3.3.2 Orbitron Ion Pump
The orbitron ion pump [Douglas, 1965; Denison, 1967; Bills, 1967] was developed based on an electro-static electron trap best known for application in ion pressure gauges. A sketch is presented in Figure 29.4.Injected electrons orbit an anode; the triode version illustrated in Figure 29.4 [Denison, 1967; Bills, 1967]has an independent sublimator that provides a continuous active getter (Ti) coating of the ion collector.The getter permits active gas pumping as well as permanent burial of rare gas and other ions that are
SP (KGqηIion)/(3.3 1019)epI=
η
(Q/N)i (VDIion)i/ (KGqηIion)/((3.3 1019)epI) i 10 3– nI [ ]=
(Q/N)i/(Q/N)R VD ,i/VD ,R=
ηi ηR=
SP ,i/SP ,R SP ,MAX,i /SP ,MAX ,R≡ (Iion)i/(Iion)R=
Q/Nη
© 2002 by CRC Press LLC

accelerated out of the trap through the cathode mesh by the radial electric fields. Initial work on reducingthe size of an orbitron to MEMS scales has recently been reported by Wilcox (1999).
For a given geometry and potential difference between the anode and cathode mesh, the cylindricalcapacitor represented by the trap geometry has a limiting maximum net negative charge of orbitingelectrons. The corresponding ionization rate in the trap can be written as:
(29.25)
where X is the fraction of the maximum charge that permits stable electron orbits (less than 0.5), VD isthe applied potential difference, me is the electron mass, is the permittivity of free space, ΩI is theelectron-neutral ionization cross section, L is the trap’s length, and r2 and r1 are the radii of the trap’scathode and anode, respectively (Figure 29.4).
The orbitron’s noble gas pumping speed and the trap’s volume can be scaled based on the expressionfor ionization rate in Eq. (29.25):
(29.26)
Note that this is favorable scaling.The sublimator’s scaling, assuming the temperature of the sublimating getter is constant, can be written
for neutrals and ions as:
(29.27)
Complete scaling results are presented in Table 29.2.
FIGURE 29.4 Orbitron pump schematic.
L
2r1r
Sublimator Ion pumpAnode
Grid Cathode
Sublimator, getter deposited on collector
e-, at about 100 ev
Collector, biased negative with respect to cathode to enable efficient ion burial in collector
Trappedelectrons
Grids on plates at ends of traps to reflect electrons and maximize trap efficiency
Electron emitter
Active neutrals and ions pumped by getter from sublimator
Ions created in trap accelerate radially throughcathode to collector
NMAXions2Xπε0VD
3/2ΩILng
(eme)1/2 (r2/r1)3/2ln
----------------------------------------------=
ε0
(SP ,MAXions)i
(SP ,MAXions)R
---------------------------- si
Ωi
ΩR
-------(VD
3/2)i
(VD3/2)R
----------------- ; (VP/NMAXions)i
(VP/NMAXions)R
---------------------------------- si2 ΩI ,i(VD)i
3/2
ΩI ,R(VD)R3/2
---------------------------= =
(Qs˙ /NMAXneut)i
(Qs˙ /NMAXneut)R
------------------------------------ 1(Qion/NMAXions)i
(Qion/NMAXions)R
--------------------------------------; 1= =
© 2002 by CRC Press LLC
29.3.4 Pump-Down and Ultimate Pressures for MEMS Vacuum Systems
What is the consequence of size-scaling a vacuum system? Consider an elementary system made up ofa pump and a vacuum chamber of volume Vc and surface area Asc. The pump is modeled by writing thepumping speed as:
(29.28)
where AI,P is the area of the pump’s inlet aperture from the chamber and αP is the probability that once throughthe aperture a molecule will be pumped. For a geometrically similar size change ,and the pumping speed per unit surface area of the vacuum chamber is
(29.29)
Assuming equal outgassing rates per unit area for the reference and scaled systems, the ultimate systempressure will depend only on the pumping probability ratio, αP,i /αP,R. The pump-down time for the systemcan be measured using the ratio :
(29.30)
For geometric scaling and the same outgassing rates, a MEMS vacuum system will have a significantlyshorter pump-down time assuming αP, i/αP,R can be kept near one.
In practice MEMS-scale vacuum systems are likely to have pump apertures relatively much largerthan their macroscopic counterparts. The economic deterrent to having large aperture pumps that existat macroscales does not apply at the MEMS scale. At MEMS scales, it appears that technical issuesassociated with pump construction will favor making the pumps as large as possible. Consequently,relatively large pump apertures with areas about the same as the cross section of the pumped volumeare anticipated.
29.3.5 Operating Pressures and Requirements in MEMS Instruments
The selection of vacuum pumps for MEMS instruments and processes will depend on operating pressureand requirements. Because these can be determined reliably only when the task, instrument anddetector or a particular process has been specified, it is virtually impossible to discuss significant, generalsize-scaling tendencies. For example, there has been speculation [Young, 1999] that a MEMS massspectrometer sampling instrument might operate at upper pressures specified by keeping the Knudsennumber based on, say, the quadrupole length constant compared to similar macroscale instruments. Thiscan typically lead to tolerable upper operating pressures for microscale instruments of 10
−3 to 10
−2 mbar,
depending on the scaling factor (see also Ferran and Boumsellek, 1996). On the other hand, the defaultresponse of many mass spectroscopists is 10
−5 mTorr, independent of scaling. Vargo (2000) based
requirements for a miniaturized sampling mass spectrometer on the goal of replacing the entire volumeof gas in the instrument (30 cm
3 in Vargo’s case) every second at an operating pressure of 10
−4 mTorr,
giving molecules/s. A point to remember is that for a constant Kn system the equilibriumquantity of adsorbed gas in the system increases compared to unadsorbed gas as the si decreases [Muntz,1999].
A careful consideration of the operating pressure and requirements for a particular situation isobviously important, but impossible within the confines of the present discussion. It is clear that becauseof the difficulty in supplying volume- and power-compatible microscale vacuum systems, it will beimportant for overall system design to define operating conditions that are based on real needs.
SP ,i AI ,P(C′/4)αP i=
SP ,i si2(αP ,i/αP ,R)SP ,R=
(SP/Asc)i/(SP/Asc)R αP ,i/αP ,R=
SP/Vc τP=
τP ,i/τP ,R si1–= (αP ,i/αP ,R)
N
N
N
N 1.4 1014 =
N
© 2002 by CRC Press LLC

29.3.6 Summary of Scaling Results
The scaling analyses outlined above have been applied to several pump types, with the results appearingin Table 29.2. The operating frequencies were selected to give two extremes: maintaining a constantaverage speed (tangential for rotating devices or linear for reciprocating) by using the frequencyscaling, ; or maintaining a constant frequency, , resulting in . Twoalternative types of frictional drag, sliding and viscous, have been included, again as extremes of the likelypossibilities.
The scaling expressions for the case are simple when normalized by their respective referencescale values. For the second case, where , the expressions are more complex and the resultsdepend on the relative magnitude of the quantities KI,R, KB,R, qRdf,R, etc. (see Table 29.2b). For the casesinvolving more complex expressions, order of magnitude estimates of the scaling based on typical pumpcharacteristics have been included in Table 29.2a.
The sputter ion pumps have been included assuming that permanent magnets provide the requiredfield strengths. Note that the mesoscale SIP performance presented in Figure 29.1 and Table 29.1 is forHMF operation.
In order to put the scaling results appearing in Table 29.2 in perspective it is important to rememberthat they are for geometrically accurate scale reductions. It is assumed that the relative dimensionalaccuracy of the components is the same in the reduced scale realization as in the reference macroscopicpumps. This is a very idealized assumption. The dimensional accuracy that can currently be attainedin micromechanical parts as a function of size is illustrated in Figure 29.5, which is derived in partfrom Madou (1997). It is clear from Figure 29.5 that the scaling results of Table 29.2 may be veryoptimistic if true MEMS-scale pumps (component sizes 100 µm or less) are required. On the otherhand, the scalings do represent the best scaled performances that could be expected and as such area useful guide. Note from Figure 29.5 that the smallest fractional tolerances can be achieved by precisionmachining techniques for approximately 1-cm size components. As a result, mesoscale pumps may bepossible from a tolerance (although perhaps not economic) perspective using precision machiningtechniques.
FIGURE 29.5 Dimensional accuracy of manufactured components as a function of size. (Adapted from Madou,1997.)
ui uR=fT ,i si
1– fT ,R= fT ,i fT ,R= ui siuR=
ui uR=ui siuR=
Tolerances for a
turbomolecular pump
Tolerances less than about 0.01%
achieved by precision machining
techniques
Typical tolerances
for a roots blower
Linear Dimension (m)
RelativeTolerance(%
)
10-5
10-4
10-3
10-2
10-1
100
101
102
102
101
100
10-1
10-2
10-3
10-4
10-5
10-6
10-7
10-8
© 2002 by CRC Press LLC

Several points should be noted in the Table 29.2 results. For the case of , the ideal scalingsto small sizes are reasonable (remember si will range between 10
−1 and 10
−4). In the case of viscous friction
losses, the energy use per molecule of upflow becomes large at small scales (increases as ) while thepump volume per unit upflow decreases as si decreases. For the case of positive-displacement pumps and
, the energy use per molecule of upflow scales satisfactorily, but upflow scales as so that thevolume scaling is of [1] rather than the for the case. The ℘MAX scaling to small scales for
is a disaster for turbomolecular pumps. Also, the upflow, energy and pump volume all scalebadly for the turbomolecular pump with . These scalings are all a result of the trappingcoefficient q ∼ si for low peripheral speeds. Although not explicitly included, molecular drag pumps canbe expected to scale similarly to the turbomolecular pump. For positive-displacement pumps, the pressureratio scales well if there are no losses but can scale as badly as si depending on specific pump characteristics.For the cases where the pressure ratio scales badly, more pump stages would be required for a given task,leading to larger pumps as indicated by the > symbol in the energy use and pump volume per unit upflowcolumns.
The sputter ion pump scales well to smaller sizes. The major concern here for microscales will be thefundamental requirement for relatively high voltages. Also, thermal control will be difficult as it iscomplicated by the need for high field strengths (0.5–1 T) using co-located permanent magnets.
The orbitron ion pump scales well to smaller sizes but unfortunately, as seen in Figure 29.1 andTable 29.1, begins with a very poor performance as measured by .
Generally speaking, for the positive-displacement and turbomolecular pumps, the idealized geometricscaling results presented in Table 29.2 demonstrate that there is a mixed bag of possibilities, ranging fromdecreased performance to maintaining performance, with a few cases showing improvement on macro-scale performance by going to smaller scales. From a vacuum pump perspective, with ideal scaling thereis little to no advantage based on performance to go to small scales, except for the ion pumps.
The actual performance of small-scale pumps is likely to be significantly poorer than the idealizedscaling results shown in Table 29.2. For instance, it has proven to be very difficult to attain the highrotational speeds necessary to satisfy the requirements in MEMS-scale devices; on the otherhand, recent progress in air-bearing technology [Fréchette et al., 2000] has been reported for mesoscalegas turbine wheels. Mesoscale sputter ion pumps have been operated, and the investigation of orbitronscaling is just beginning. Whether either can be scaled to true MEMS sizes is unclear, but they may bethe only alternative for achieving high vacuum with MEMS pumps.
Keeping the preceding comments in mind, it is useful to re-visit the macroscale vacuum pumpperformances reviewed in Figure 29.1. Consider a typical energy requirement from Figure 29.1 of 3 10
−15 W/molecule of upflow for macroscale systems, and assume that this can be maintained at mesoscales
to pump through a pressure ratio of 106 (10
−3 mbar to 1 bar). A typical upflow, assuming a 3-cm
3 volume
at 10−3
mbar is changed every second, is 1.1 1014
molecules/s and the required energy is 0.33 W. Thisis somewhat high but perhaps tolerable for a mesoscale system. However, with the expected degradationof the performance of complex macroscale pumps at meso- and microscales, it is clear that it is importantto search for alternative, unconventional pumping technologies that will be buildable and operate effi-ciently at small scales.
29.4 Alternative Pump Technologies
The previous section on scaling indicates that searching for appropriate alternative technologies as a basisfor MEMS vacuum pumps is necessary. There has been some effort in this regard during the past decade.In the fall of 1993, Muntz, Pham-Van-Diep and Shiflett hypothesized that the rarefied gas dynamicphenomenon of thermal transpiration might be particularly well suited for MEMS-scale vacuum pumps.Thermal transpiration is the application of a more general phenomenon, thermal creep, that can be usedto provide a pumping action in flow channels for Knudsen numbers ranging from very large to about0.05. The observation resulted in a publication [Pham-Van-Diep et al., 1995] and has very recently ledto the construction of a prototype micromechanical pump stage by Vargo (2000). A MEMS thermal
ui uR=
si1–
ui siuR= si3
si1– ui uR=
ui siuR=ui siuR=
Q/N
ui uR=
© 2002 by CRC Press LLC

transpiration pump has also been proposed by Young (1999). There is one fundamental problem withthermal transpiration or thermal creep pumps—for reasons explained later, they are staged devices thatrequire part of each stage to have a minimum size corresponding to a dimension greater than about 0.2molecular mean free paths (λ) in the pumped gas. At 1 mTorr (1.32 10
−3 mbar) λ ≈ 0.05 m in air,
resulting in required passages no smaller than about 1 cm. Thus, at low inlet pressures the pumps canbe unacceptably large for MEMS applications.
An interestingly different version of a thermal creep pump has been suggested by Sone and his co-workers [Sone et al., 1996; Aoki et al., 2000], although it also has a low-pressure use limit similar to theone mentioned above.
Another alternative, the accommodation pump, which is superficially similar to thermal transpirationpumps but based on a different physical phenomenon, has been investigated [Hobson and Pye, 1972].It can in principle be used to provide pumping at arbitrarily low pressures without minimum sizerestrictions.
29.4.1 Outline of Thermal Transpiration Pumping
Two containers, one with a gas at temperature TL and one at TH are separated by a thin diaphragm of areaAi having single or multiple apertures, each of which has an area Aa and a size (refer toFigure 29.6). The number of molecules hitting a surface per unit time per unit area in a gas is . InFigure 29.6 this means that there are molecules passing from cold to hot through an aperture.Similarly, there are molecules per unit time passing from hot into the cold chamber.
Assume m is the same for the molecules in both chambers, and assume that the inlet and outlet areadjusted so that pL = pH . Under these circumstances, the net number flow of molecules from cold to hotis, with the help of the equation of state:
(29.31)
If, on the other hand, there is no net flow:
(29.32)
For pH between pL and there will be both a pressure increase and a net flow, which are thenecessary conditions for a pump! This effect is known as thermal transpiration. If there are Γ apertures
FIGURE 29.6 Elementary single stage of a thermal transpiration compressor.
Aa << λL or λH
nC′/4(nLC′L/4)Aa
(nHC′H/4)Aa
NMAX Aa(2πmk) 1– /2pL TH1/2 TL
1/2–[ ]/(TLTH)1/2=
(pH/pL)N=0
℘MAX (TH/TL)1/2= =
pL(TH/TL)1/2
Flow N•
Flow N
•
Thin Membrane Aperture Area, Aa
nL
TL
pL
nH
TH
pH
Container’s cross-sectional area, A
© 2002 by CRC Press LLC
the total upflow of molecules is
(29.33)
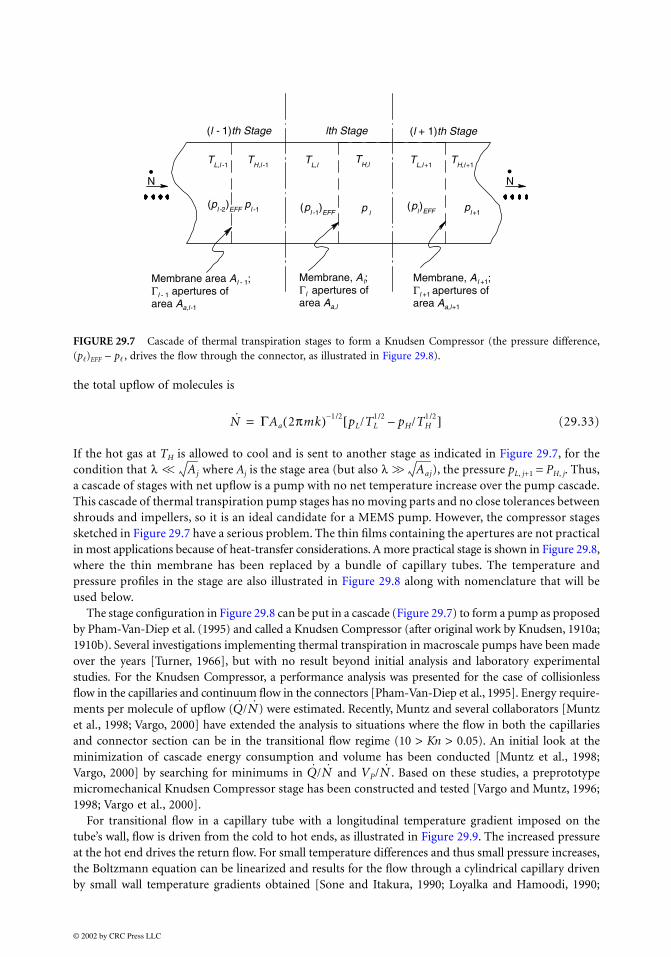
If the hot gas at TH is allowed to cool and is sent to another stage as indicated in Figure 29.7, for thecondition that where Aj is the stage area (but also ), the pressure pL, j+1 = PH, j. Thus,a cascade of stages with net upflow is a pump with no net temperature increase over the pump cascade.This cascade of thermal transpiration pump stages has no moving parts and no close tolerances betweenshrouds and impellers, so it is an ideal candidate for a MEMS pump. However, the compressor stagessketched in Figure 29.7 have a serious problem. The thin films containing the apertures are not practicalin most applications because of heat-transfer considerations. A more practical stage is shown in Figure 29.8,where the thin membrane has been replaced by a bundle of capillary tubes. The temperature andpressure profiles in the stage are also illustrated in Figure 29.8 along with nomenclature that will beused below.
The stage configuration in Figure 29.8 can be put in a cascade (Figure 29.7) to form a pump as proposedby Pham-Van-Diep et al. (1995) and called a Knudsen Compressor (after original work by Knudsen, 1910a;1910b). Several investigations implementing thermal transpiration in macroscale pumps have been madeover the years [Turner, 1966], but with no result beyond initial analysis and laboratory experimentalstudies. For the Knudsen Compressor, a performance analysis was presented for the case of collisionlessflow in the capillaries and continuum flow in the connectors [Pham-Van-Diep et al., 1995]. Energy require-ments per molecule of upflow ( ) were estimated. Recently, Muntz and several collaborators [Muntzet al., 1998; Vargo, 2000] have extended the analysis to situations where the flow in both the capillariesand connector section can be in the transitional flow regime (10 > Kn > 0.05). An initial look at theminimization of cascade energy consumption and volume has been conducted [Muntz et al., 1998;Vargo, 2000] by searching for minimums in and . Based on these studies, a preprototypemicromechanical Knudsen Compressor stage has been constructed and tested [Vargo and Muntz, 1996;1998; Vargo et al., 2000].
For transitional flow in a capillary tube with a longitudinal temperature gradient imposed on thetube’s wall, flow is driven from the cold to hot ends, as illustrated in Figure 29.9. The increased pressureat the hot end drives the return flow. For small temperature differences and thus small pressure increases,the Boltzmann equation can be linearized and results for the flow through a cylindrical capillary drivenby small wall temperature gradients obtained [Sone and Itakura, 1990; Loyalka and Hamoodi, 1990;
FIGURE 29.7 Cascade of thermal transpiration stages to form a Knudsen Compressor (the pressure difference,(p)EFF − p , drives the flow through the connector, as illustrated in Figure 29.8).
N •
N •
(l - 1)th Stage lth Stage (l + 1)th Stage
TL,l -1
TH,l -1
TL,l
TH,l
TL,l +1
TH,l+1
(pl -2
)EFF
pl -1 p
l (p
l -1)EFF
(pl)EFF p
l +1
Membrane area Al - 1; Γl - 1 apertures of area Aa,l -1
Membrane, Al +1; Γl +1 apertures of area Aa,l+1
Membrane, Al; Γl apertures of area Aa,l
N ΓAa 2πmk( ) 1– /2 pL/TL1/2 pH/TH
1/2–[ ]=
λ << Aj λ >> Aaj
Q/N
Q/N VP/N
© 2002 by CRC Press LLC

Loyalka and Hickey, 1991]. The definition of the flow coefficients (QT and QP) is implied in the followingexpression [Sone and Itakura, 1990]:
(29.34)
Here, A is the cross-sectional area of the capillary, Lr is its radius, QP is the backflow due to thepressure increase, and QT is the thermally driven upflow near the walls. The sum determines the netmass flow through the tube from cold to hot. For large Kn (= λ/Lr), the pressure increaseprovided by a tube is , identical to the aperture case discussed earlier.In the large Kn case, the backflow and upflow completely mingle over the entire tube cross section.For transitional Kns the upflow is confined near the wall in a layer on the order of λ thick, as illustratedin Figure 29.9.
The values of QT and QP vary markedly throughout the transitional flow regime, as shown in Figure 29.10.The details of their functional variations as well as the ratio QT/QP are important to any pump using
FIGURE 29.8 Capillary tube assembly as a model of a practical Knudsen Compressor.
x
x
2
2
T
P
Capillaryradius, Lr,l
(l - 1)th Stage
Lx,l
lth Stage
Lx,l
Gas flow
LR,l
(l + 1)th Stage
Connector sectionCapillary section
TAVG
TL,l
TH,l
pl
(pl -1)EFF
l ∆pI,l
TL,l+1
(pl)EFF
∆pC,l
(∆pl)T
∆Tl
∆Tl
κ
M pAVG(2(k/m)TAVG) 1/2– ALr
TAVG
-----------dTdx------QT
Lr
pAVG
----------dpdx------Qp–=
M 0=pH/pC QT/QP (TH/TC)1/2= =
© 2002 by CRC Press LLC

FIGURE 29.9 Transitional flow configuration in a capillary tube.
FIGURE 29.10 Transitional flow coefficients as a function of Knudsen number (Kn = λ/Lr) for cylindrical capillaries.(Adapted from Vargo, 2000.)
x
dT
dx= =
TL
λ
Tube Wall
p = pL
Cold Slow Return Flow
Thermal Creep Flow
p = pH
HotTH
Thermal Creep Flow
Wall temperature gradient∆T
∆x
TH - TL
xH - xL
λ
© 2002 by CRC Press LLC

thermal transpiration. Their roles are best illustrated by the expression for pumping speed and pressureratio of the jth stage of a Knudsen Compressor [Muntz et al., 1998]:
(29.35)
In Eq. (29.35), the j is a parameter that sets the fraction of the pressure rise that is realized ina finite upflow situation. The pressure ratio for the stage, assuming [Muntz et al., 1998], is
(29.36)
In Eqs. (29.35) and (29.36), is the temperature change across both the capillary section and theconnector section; F is the fraction of the capillary section’s area, Aj, that corresponds to the open areaof the capillary tubes; and FC is the fraction of the connector section’s area, AC, j, that is open (usuallyFC,j = 1). The dimensions Lx,j , LX,j , Lr,j, LR,j are defined in Figure 29.8.
From Eq. (29.36), if κj = 0 then ℘j = 1. The corresponding maximum upflow is obtained by substitutingκj = 0 into Eq. (29.35) to give (SPMAX)j. The result is
(29.37)
which can be combined with the expression for ℘j, MAX, j (using κj = 1 in Eq. (29.35)) to give the familiarrelationship for a vacuum pumping system, Eq. (29.7), between SP,j, SP,MAX,j , ℘j and ℘MAX, j .
The expression for pumping speed in Eq. (29.35) can also be used to compute the pumping probabilityαP,j, where from Eq. (29.5) . Using Eqs. (29.35) and (29.36) and remembering that
, where nI,j is the number density at the inlet to the stage, cascade performance calculationscan be accomplished. The approach is presented in detail in Muntz et al. (1998). The results of severalcascade simulations are given by Vargo (2000). As shown by Muntz, the majority of the energy requiredis the thermal conduction loss across the capillary tube bundle. The physical realization of the capillarysection of a Knudsen Compressor is frequently not a bundle of capillary tubes, but rather a porousmembrane. Nevertheless, the theoretical behavior based on “equivalent” capillary tubes appears to beconsistent with the results obtained experimentally [c.f. Vargo, 2000, and the discussions presentedtherein].
Selected results of micro/meso and macroscale pump cascade simulations reported by Vargo (2000)are plotted in Figure 29.11 and presented in Table 29.3. It is important to note that all the KnudsenCompressor cascade results are from simulations; a micromechanical cascade has yet to be constructed,although several mesoscale stages have been operated in series [Vargo and Muntz, 1996]. In his thesis,Vargo (2000) describes the construction of a laboratory prototype micromechanical Knudsen Compressorstage and the experimental results obtained from it. A scheme for constructing a cascade is also presented,along with predicted energy requirements, but this has yet to be built and tested. The Knudsen Com-pressor performance presented in Figure 29.11 is based on a significant body of preliminary work buthas not yet been demonstrated experimentally. The results are for varying initial pressures pI and pumpingto 1 atm (the detailed conditions are presented in Table 29.3. In MEMS devices, pressures below 10 mTorrextract a significant energy penalty, tending to preclude Knudsen Compressor applications to lowerpressures at MEMS scale. This restriction, however, depends on the that is required. The energy penaltyoriginates from the difficulty in effectively reaching continuum flow in the connector section for areasonable size. Note that the macroscale simulations presented in Figure 29.11 give efficient pumpingto significantly lower pI (higher ℘).
SP j, π1/2(1 κ j– ) ∆TTAVG
-----------QT
QP
------QT C,
QP C,-----------–
j
Lx/Lr
FQP
------------LX/LR
FC(Ac/A)QP
-----------------------------+j
1–
(CA)j=
M 0=∆T/TAVG >> 1
℘j 1 κ j∆T
TAVG
-----------QT
QP
------QT ,C
QP ,C
----------–j
+=
∆T
SP , j/(SP ,MAX)j (1 κ j)–=
αP , j Sp , j/CA j,=Nj SP , jnI , j=
N
© 2002 by CRC Press LLC

The size scaling of Knudsen Compressors at low inlet pressures is dominated by the ratio LR/Lr, whichcan be achieved in the early stages of a particular design. The ratio LR/Lr determines the Knudsen numberratio, which in turn determines the QT/QP ratio (Figure 29.10). By referring to Eq. (29.36), the effectson the stage ℘j are immediately clear. In the limit of LR/Lr → 1, ℘ = 1. For LR/Lr >> 1, QT,C/QP,C << 1and ℘j reaches a maximum value that depends only on κj and .
Minimizing the energy requirement of a Knudsen Compressor cascade depends on a number ofimportant parameters describing the individual stage configurations. The results reported by Vargo (2000)
TABLE 29.3 Results of Simulations of Micro-, Meso- and Macroscale Knudsen Compressors for Several Pumping Tasks
pI (mTorr) pE (mTorr) W/(#/s) cm3/(#/s) ℘
Micro-/Mesoscalea
0.1 7.6E5 1.4E-12 7.8E-12 7.6E61.0 7.6E5 9E-15 5.2E-14 7.6E510 7.6E5 9E-17 5.2E-16 7.6E410 5.25E3 1.4E-17 1.6E-16 5.25E250 7.6E5 2.9E-17 1.6E-16 1.5E4
Macroscaleb
0.1 7.6E5 9.1E-16 1.3E-12 7.6E61.0 7.6E5 2.8E-17 4.1E-14 7.6E510 7.6E5 1.5E-17 2.1E-14 7.6E4
a From Vargo (2000, Tables 3, 4 and 9).
b From Vargo (2000, Tables 3).
Notes: Micro-/mescoscale cascade: Lr = 500 µm, LR/Lr = 5 from pI to 50 mTorr,then constant Knj. Macroscale cascade: Lr = 5 mm, LR/Lr = 20 from pI to 10 mTorr,then constant Knj.
FIGURE 29.11 Simulation results for several macro- and microscale pumping tasks from pI to pE = 1 atm usingKnudsen Compressors (as presented in Table 29.3).
Q/NVP/N
0.1 1 10 100
Q•
N•
N•
N• Macro
•MacroQ
N•
•Micro /MesoQ
N•
Micro /MesoN
Vp
Vp
VP
pI m Torr
10-11
10-12
10-13
10-14
10-15
10-16
10-17
10-11
10-12
10-13
10-14
10-15
10-16
10-17
•
∆T/TAVG
© 2002 by CRC Press LLC

are only a beginning attempt at optimizing Knudsen Compressor performance (there are extendeddiscussions of optimization issues in Muntz et al., 1998). The predicted Knudsen Compressor perfor-mance presented in Figure 29.11 is quite promising. Generally, as illustrated in Figure 29.12, the energyrequirement for the micro-/mesoscale version is at least an order of magnitude better than macroscale,positive-displacement mechanical backing pumps. It also appears very competitive with the macroscalemolecular drag kinetic backing pumps used in conjunction with turbomolecular pumps.
Another MEMS thermal transpiration compressor has been proposed by Young (1999). Its configu-ration is different from the Knudsen Compressor, relying on temperature gradients established in thegas rather than along a wall. No experimental or theoretical analysis of the flow or pressure-rise charac-teristics of this configuration has been reported. There are theoretical reasons to believe that the floweffects induced by thermal gradients in a gas are significantly smaller than the effects supported by wallthermal gradients [Cercignani, 2000].
29.4.2 Accommodation Pumping
In 1970, Hobson introduced the idea of high-vacuum pumping by employing a characteristic of surfacescattering that had been observed in molecular beam experiments [cf. the review by Smith and Saltzburg,1964]. For some surfaces that give quasi-specular reflection under controlled conditions, when the beamtemperature differs from the surface temperature, the quasi-specular scattering lobe moves toward thesurface normal for cold beams striking hot surfaces. For hot beams striking cold surfaces, the lobe movesaway from the normal. Hobson’s initial study was followed in short order by several investigationsadopting the same approach [Hobson and Pye, 1972; Hobson and Salzman, 2000; Doetsch and Ryce, 1972;Baker et al., 1973]. Other investigators, relying on the same phenomenon, have used different geometricalarrangements [Tracy, 1974; Hemmerich, 1988]. Recently Hudson and Bartel (1999) analyzed a samplingof previous experiments with the Direct Simulation Monte Carlo technique. To date, the most successfulpumping arrangement, which is sketched in Figure 29.13, has been that of Hobson.
Following Hobson’s lead it is easy to write expressions for ℘MAX, j = p3/p1 and SP,MAX, j for the stage inFigure 29.13. The accommodation pump works best under collisionless flow conditions, so assume λ ≥ 10d,where d is the tube diameter. Assuming steady-state conditions, conservation of molecule flow equationsfor each volume can be solved simultaneously for zero net upflow to give:
(29.38)
FIGURE 29.12 Comparison of macro- and microscale Knudsen Compressor performances from simulations [Vargo,2000] to representative available macro- and mescoscale vacuum pumps.
10 -18
10
Group 1Group 2Group 3Micro/Meso KnCMacro KnCIsentropicReversibleT = constant
℘
Q•
N•
Macro KnC
Micro/MesoKnC
Lower limit for Q/Nenvelope of macro andmeso vacuum pumps
••
10-12
10-13
10-14
10-15
10-16
10-17
10-19
10-20
102 103 104 105 106 107 108 109 1010
℘MAX,j
α23
α32
-------α12
α21
-------⋅α12
α21
-------= =
© 2002 by CRC Press LLC

Here, αkl is the probability for a molecule having entered a tube from the kth chamber reaching the lthchamber. In this case, because the tube joining chambers 2 and 3 is assumed always to reflect diffusely,α23 = α32.
The same molecule flow equations can be solved along with Eq. (29.38) to provide maximum upflowor pumping speed (℘j = 1):
(29.39)
From the earlier discussions, it is reasonable to anticipate that α2,1 will have a value that approximatelycorresponds to diffuse reflection, which for a long tube is (8Lr/3Lx). A simple approximate expressionfor maximum pumping speed becomes:
(29.40)
If ℘MAX, j is known from experiments, SP,MAX, j can be found from Eq. (29.40).Scaling accommodation pumping is not difficult because, unlike the Knudsen Compressor, the flow
is collisionless everywhere. If the minimum radius of the two channels in a stage is such that Lr ≥ 100 nm,there is little reason to believe that ℘MAX,j or the transmission probabilities will vary with scale. Forgeometric scaling:
(29.41)
No analysis or measurements of the energy requirements of accommodation pumping are available, butthe temperature differences required to obtain an effect are quite large (the temperature ratio in variousexperiments ranges from 3 to 4). Careful thermal management would be required at MEMS scales.Additionally, the stage ℘MAX,j values are quite low (Hobson’s are typically around 1.15). For an upflowof SP,MAX,j /2, to pump through a pressure ratio of 10
2 would require about 125 stages. For comparison,
a Knudsen Compressor operating between the same temperatures would require 10 stages. Of course, as
FIGURE 29.13 Schematic representation of Hobson’s accommodation pump configuration. (Adapted from Hobson,1970).
13
2
"Rough" tube giving diffusereflection
T ≈ 290 K
"Smooth" tubing (quasi-specular reflection for Tgas = Tsurface).
LN2, T = 77 K
"Smooth" tube is normal Pyrex tubing.
"Rough" tube is leached Pyrex to provide suppression of specular reflection for the temperature differences of the experiment.
SP ,MAX , j
C′HAj
4-------------- ℘MAX , j 1–( )α2,1/ 1 (α2,1)/(8Lr/3Lx)+[ ] =
SP , MAX , j (C′H/4)Aj(4Lr/3Lx)(℘MAX , j 1)–=
SP , MAX , j
SP , MAX , R
------------------- si2=
© 2002 by CRC Press LLC
outlined earlier, the Knudsen Compressor could not pump effectively at very low pressures, whereasaccommodation pumps can.
Using the miniature Creare turbomolecular pump scaled down with constant fP,i to a 2-cm diameter,the authors have estimated an air pumping probability of about 0.05. A Hobson-type accommodationpump with 2-cm-diameter, Lr/Lx = 0.05 Pyrex® tubes and operating between room and LN2 temperatureswould have, from Eq. (29.40), a pumping probability of about 0.01.
Scaling Hobson’s pump to MEMS scales would permit operation with molecular flow up to pressuresmuch greater than 10
−2 mbar, providing the surface reflection characteristics were not negatively affected
by adsorbed gases. This is a serious uncertainty, as all of the available experiments have been reportedfor pressures between 1 and several orders of magnitude less than 10
−2 mbar.
29.5 Conclusions
The performances of a representative sampling of macroscale vacuum pumps have been reviewed basedon parameters relevant to micro- and mesoscale vacuum requirements. If the macroscale performancesof these generally complex devices could be maintained at meso- and microscales, they might be barelycompatible with the energy and volume requirements of meso- and microsampling instruments. A generalscaling analysis of macroscale pumps considered as possible candidates for scaling (although going tomicroscales with these scaled pumps is currently beyond the state of the manufacturing art) is presentedand provides little to no incentive for simply trying to scale existing pumps, with the possible exceptionof ion pumps. When the difficulty in developing MEMS manufacturing techniques with adequate toler-ances is considered, the possibility of maintaining the macroscale performance at microscales is remote.As a consequence, two alternative pump technologies are examined. The first, the Knudsen Compressor,is based on thermal creep flow or thermal transpiration and appears attractive as a result of both analysisand initial experiments. The second, also a thermal creep pump, is under study but requires furtheranalysis before its microscale suitability can be established. Both, however, have a characteristic thatprevents them from operating efficiently when pumping high vacuums (<10
−3 to 10
−2 mbar).
The second possibility, accommodation pumping, although superficially similar to the Knudsen Com-pressor, is based on surface molecular reflection characteristics and will pump to ultra-high vacuums.Further analysis and experiments are required to be able to provide performance estimates of accommo-dation pumping in meso- and microscale contexts.
The alternative technology pumps have no moving parts; no liquids are required for seals, pumpingaction or lubrication. These are characteristics shared with the ion pumps. They all have the capabilityof providing mesoscale pumping and the potential for truly MEMS-scale pumping. To realize thesealternative technology pumps, significant and focused research and development efforts will be required.
Acknowledgments
The authors thank Andrew Jamison for preparing the figures and Tariq El-Atrache and Tricia Harte forpatiently working on the manuscript through many revisions. Dr. Andrew Ketsdever, Professor GeoffShiflett, and Mr. Dean Wiberg have provided helpful comments. Discussions with Dr. David Salzmanover several years have been both entertaining and informative.
Defining Terms
Capture pumps: Vacuum pumps where pumping action relies on sequestering pumped gas in a solidmatrix until it can be removed in a separate, off-line operation.
Conductance: Measure of the capability of a vacuum system component (tube, channel) for handlinggas flows; has units of gas volume per unit time.
Knudsen number: Indication of the degree of rarefaction of flow in a vacuum system component; forKn > 10, molecules collide predominantly with the walls, and, for Kn < 10
−3, intermolecular
collisions dominate.
© 2002 by CRC Press LLC
Microscale, mesoscale and macroscale: In reference to a device, these terms as used in this chaptercorrespond to the following typical dimensions:
• Microscale: Smallest components <100 µm, device <1 cm
• Mesoscale: Smallest component 100 µm to 1 mm, device 1 cm to 10 cm
• Macroscale: Smallest components >1 mm, device >10 cm
Pumping speed: Measure of the pumping ability of a vacuum pump in terms of volume per unit timeof inlet pressure gas that can be pumped.
Regeneration: Off-line removal of sequestered gas from a capture pump.Vacuum: For the purposes of this chapter, the pressure ranges corresponding to various descriptions
attached to vacuums are
• Low or roughing: 103 to 10
−2 mbar
• High: 10−2
to 10−7
mbar
• Ultra-high: <10−7
mbar
References
Aoki, K., Sone, Y., Takata, S., Takahashi, K., and Bird, G. A. (2000) “One-Way Flow of a Rarefied GasInduced in a Circular Pipe with a Periodic Temperature Distribution,” in Proc. 22nd Rarefied GasDynamics Symp., G. A. Bird, T. J. Bartel, and M. A. Gallis, Eds., July 9–14, Sydney, Australia.
Baker, B. G., Hobson, J. P., and Pye, A. W. (1973) “Further Measurements of Physical Factors InfluencingAccommodation Pumps,” J. Vacuum Sci. Technol. 10(1), pp. 241–245.
Baum, H. (1957) Vakuum-Technik, 7, pp. 154–159.Bernhardt, K. H. (1983) “Calculation of the Pumping Speed of Turbomolecular Vacuum Pumps by Means
of Simple Mechanical Data,” J. Vacuum Sci. Technol. A 1(2), pp. 136–139.Bills, D. G. (1967) “Electrostatic Getter-Ion-Pump Design,” J. Vacuum Sci. Technol. 4(4), pp. 149–155.Bird, G. A. (1994) Molecular Gas Dynamics and the Direct Simulation of Gas Flows, Clarendon Press, Oxford.Callas, J. L. (1999) “Vacuum System Requirements for a Miniature Scanning Electron Microscope,” in
NASA/JPL Miniature Vacuum Pumps Workshop, Glendale, CA, JPL website http://cissr.jpl.nasa.gov/pumpsworkshop/.
Cercignani, C. (2000) Rarefied Gas Dynamics, Cambridge University Press, Cambridge, U.K.Chang, T. H. P., Kern, D. P., and Muray L. P. (1990) “Microminiaturization of Electron Optical Systems,”
J. Vacuum Sci. Technol. B 8, pp. 1698–1705.Denison, D. R. (1967) “Performance of a New Electrostatic Getter-Ion Pump,” J. Vacuum Sci. Technol.
4(4), pp. 156–162.Doetsch, I. H., and Ryce, S. A. (1972) “Separation of Gas Mixtures by Accommodation Pumping,” Can.
J. Chem. 50(7), pp. 957–960.Douglas, R. A. (1965) “Orbitron Vacuum Pump,” Rev. Sci. Instrum. 36(1), pp. 1–6.Dushman, S. (1949) Scientific Foundations of Vacuum Technique, Wiley, New York.Dushman, S., and Lafferty, J. M. (1962) Scientific Foundations of Vacuum Technique, 2nd ed., Wiley,
New York.Ferran, R. J., and Boumsellek, S. (1996) “High-Pressure Effects in Miniature Arrays of Quadrupole Ana-
lyzers for Residual Gas Analysis from 10−9
to 10−2
Torr,” J. Vacuum Sci. Technol. 14, pp. 1258–1265.Fréchette, L. G., Stuart, A. J., Breuer, K. S., Ehrich, F. F., Ghodssi, R., Kanna, R., Wang, C.W., Zhong, X.,
Schmidt, M. A., and Epstein, A. H. (2000) “Demonstration of a Microfabricated High-SpeedTurbine Supported on Gas Bearings,” in Solid-State Sensor and Actuator Workshop, pp. 43–47,Hilton Head Island.
Freidhoff, C. B., Young, R. M., Sriram, S. S., Braggins, T. T., O’Keefe, T. W., Adam, J. D., Nathanson, H. C.,Symms, R. R. A., Tate, T. J., Ahmad, M. M., Taylor, S., and Tunstall, J. (1999) “Chemical SensingUsing Nonoptical Microelectromechanical Systems,” J. Vacuum Sci. Technol. A 17, pp. 2300–2307.
© 2002 by CRC Press LLC

Hemmerich, J. L. (1988) “Primary Vacuum Pumps for the Fusion Reactor Fuel Cycle,” J. Vacuum Sci.Technol. A 6(1), pp. 144–153.
Hobson, J. P. (1970) “Accommodation Pumping—A New Principle for Low Pressure,” J. Vacuum Sci.Technol. 7(2), pp. 301–357.
Hobson, J. P., and Pye, A. W. (1972) “Physical Factors Influencing Accommodation Pumps,” J. VacuumSci. Technol. 9(1), pp. 252–256.
Hobson, J. P., and Salzman, D. B. (2000) “Review of Pumping by Thermomolecular Pressure,” J. VacuumSci. Technol., A 18(4), pp. 1758–1765.
Hopfinger, E. J., and Altman, M. (1969) “A Study of Thermal Transpiration for the Development of aNew Type of Gas Pump,” J. Eng. Power, Trans. ASME 91, pp. 207–215.
Hudson, M. L., and Bartel T. J. (1999) “DSMC Simulation of Thermal Transpiration Pumps,” in RarefiedGas Dynamics, Vol. 1, R. Brun et al., Eds., pp. 719–726, Cépaduès Éditions, Toulouse, France.
Knudsen, M. (1910a) “Eine Revision der Gleichgewichtsbedingung der Gase. Thermische Molekular-strömung,” Annalen der Physik 31, pp. 205–229.
Knudsen, M. (1910b) “Thermischer Molekulardruck der Gase in Röhre,” Annalen der Physik 33,pp. 1435–1448.
Lafferty, J. M. (1998) Foundations of Vacuum Science and Technology, John Wiley & Sons, New York.Loyalka, S. K., and Hamoodi, S. A. (1990) “Poiseuille Flow of a Rarefied Gas in a Cylindrical Tube:
Solution of Linearized Boltzmann Equation,” Phys. Fluids A 2(11), pp. 2061–2065.Loyalka, S. K., and Hickey, K. A. (1991) “Kinetic Theory of Thermal Transpiration and the Mechanocaloric
Effect: Planar Flow of a Rigid Sphere Gas with Arbitrary Accommodation at the Surface,” J. VacuumSci. Technol. A 9(1), pp. 158–163.
Madou, M. (1997) Fundamentals of Microfabrication, CRC Press, Boca Raton, FL.Muntz, E. P. (1999) “Surface Dominated Rarefied Flows and the Potential of Surface Nanomanipulations,”
in Rarefied Gas Dynamics, R. Brun, R. Campargue, and J. C. Lengrand, Eds., pp. 3–15, CépaduèsÉdition, Toulouse, France.
Muntz, E. P., Sone, Y., Aoki, K., and Vargo, S. (1998) “Performance Analysis and Optimization Consid-erations for a Knudsen Compressor in Transitional Flow,” U.S.C. Aerospace and Mechanical Engi-neering Report No. 98001, University of Southern California, Los Angeles.
NASA/JPL (1999) NASA/JPL Miniature Vacuum Pumps Workshop, http://cissr.jpl.nasa.gov/.Nathanson, H. C., Liberman, I., and Freidhoff, C. (1995) In Proc. IEEE 8th Annu. Int. Workshop on Micro
Electro Mechanical Systems (MEMS ’95), pp. 72–76, IEEE, Amsterdam, The Netherlands.Orient, O. J., Chutjian, A., and Garkanian, V. (1997) “Miniature, High-Resolution, Quadrupole Mass-
Spectrometer Array,” Rev. Sci. Instrum. 68, pp. 1393–1397.Orner, P. A., and Lammers, G. B. (1970) “The Application of Thermal Transpiration to a Gaseous Pump,”
J. Basic Eng., Trans. ASME 92, pp. 294–302.Park, J.-Y., et al. (1997) “Fabrication of Electron-Beam Microcolumn Aligned by Scanning Tunneling
Microscope,” J. Vacuum Sci. Technol. A 15, pp. 1499–1502.Pham-Van-Diep, G., Keeley, P., Muntz, E. P., and Weaver, D. P. (1995), “A Micromechanical Knudsen
Compressor,” in Proc. 19th Int. Symp. on Rarefied Gas Dynamics, J. Harvey and G. Lord, Eds.,pp. 715–721, Oxford University Press, London.
Piltingsrud, H. V. (1994) “Miniature Cryosporption Vacuum Pump for Portable Instruments,” J. VacuumSci. Technol. A 12, pp. 235–240.
Piltingsrud, H. V. (1996) “Miniature Peristaltic Vacuum Pump for Use in Portable Instruments,” J. VacuumSci. Technol. A 14, pp. 2610–2617.
Piltingsrud, H. V. (1997) “A Field Deployable Gas Chromatograph/Mass Spectrometer for IndustrialHygiene Applications,” Am. Ind. Hygiene Assoc. J. 58, pp. 564–577.
Sharipov, F., and Seleznev, V. (1998) “Data on Internal Rarefied Gas Flows,” J. Phys. Chem. Ref. Data 27,pp. 657–706.
Short, R. T., Fries, D. P., Toler, S. K., Lembke, C. E., and Byrne, R. H. (1999) “Development of an UnderwaterMass-Spectrometry System for In Situ Chemical Analysis,” Meas. Sci. Technol. 10, pp. 1195–1201.
© 2002 by CRC Press LLC
Smith, J. N., and Saltzburg, H. (1964), “Recent Studies of Molecular Beam Scattering from ContinuouslyDeposited Gold Films,” in Proc. 4th Int. Symp. on Rarefied Gas Dynamics, Vol. 2, J. H. de Leeuw,Ed., pp. 491–504, Academic Press, New York.
Sone, Y., and Itakura, E. (1990) “Analysis of Poiseuille and Thermal Transpiration Flows for ArbitraryKnudsen Numbers by a Modified Knudsen Number Expansion Method and Their Database,”J. Vacuum Soc. Jpn. 33, pp. 92–94.
Sone Y., and Yamamoto, K. (1968) “Flow of a Rarefied Gas through a Circular Pipe,” Phys. Fluids, 11,pp. 1672–1678.
Sone, Y., Waniguchi, Y., and Aoki, K. (1996) “One-Way Flow of a Rarefied Gas Induced in a Channelwith a Periodic Temperature Distribution,” Phys. Fluids 8, pp. 2227–2235.
Suetsugu, Y. (1993) “Numerical Calculation of an Ion Pump’s Pumping Speed,” Vacuum 46(2),pp. 105–111.
Terry, S. C., Jerman, J. H., and Angell J. B. (1979) “A Gas Chromatographic Air Analyzer Fabricated ona Silicon Wafer,” IEEE Trans. Electron. Devices ED-26, pp. 1880–1886.
Tracy, D. H. (1974) “Thermomolecular Pumping Effect,” J. Phys. E: Sci. Instrum. 7, pp. 533–563.Turner, D. J. (1966) “A Mathematical Analysis of a Thermal Transpiration Vacuum Pump,” Vacuum 16,
pp. 413–419.Vargo, S. E. (2000) “The Development of the MEMS Knudsen Compressor as a Low Power Vacuum Pump
for Portable and In Situ Instruments,” Ph.D. thesis, University of Southern California, Los Angeles.Vargo, S. E., and Muntz, E.P. (1996), “An Evaluation of a Multi-Stage Micromechanical Knudsen Com-
pressor and Vacuum Pump,” in Proc. 20th Int. Symp. on Rarefied Gas Dynamics, C. Shen, Ed.,pp. 995–1000, Peking University Press, Beijing, China.
Vargo, S. E., and Muntz, E. P. (1998) In Proc. 21st Int. Symp. on Rarefied Gas Dynamics, R. Brun,R. Campargue, and J. C. Lengrand, Eds., pp. 711–718, Cépaduès Éditions, Marseille, France.
Vargo, S. E., Muntz,, E. P., Shiflett, G. R., and Tang, W. C. (1999) “The Knudsen Compressor as a Microand Macroscale Vacuum Pump without Moving Parts or Fluids,” J. Vacuum Sci. Technol. A 17,pp. 2308–2313.
White, A. J., Blamire, M. G., Corlette, C. A., Griffiths, B. W., Martin D. M., Spencer S. B., and Mullock,S. J. (1998) “Development of a Portable Time-of-Flight Membrane Inlet Mass Spectrometer forEnvironmental Analysis,” Rev. Sci. Instrum. 69, pp. 565–571.
Wiberg, D., Scheglar, K., White, V., Orient, O., and Chutjian, A. (2000) “Toward a Micro Gas Chromato-graph/ Mass Spectrometer (GC/MS) System,” presented at the 3rd Annu. Int. Conf. IntegratedNano/Microtechnology Space Applications, Houston, TX.
Wilcox, J. Z., Feldman, J., George, T., Wilcox, M., and Sherer A. (1999) “Miniaturization of High VacuumPumps: Ring-Anode Orbitron,” presented at AVS 46th Int. Symp., Oct. 25–29, Seattle, WA.
Young, R. M. (1999) “Analysis of a Micromachine Based Vacuum Pump on a Chip Actuated by theThermal Transpiration Effect,” J. Vacuum Sci. Technol. B 17, pp. 280–287.
Further Information
A concise up-to-date review of the mathematical background of internal rarefied gas flow is presentedin the book, Rarefied Gas Dynamics, by Carlo Cercignani [Cercignani, 2000]. Vacuum terminology andimportant considerations for the description of vacuum system performance and pump types are pre-sented in the excellent publication by J. M. Lafferty, Foundations of Vacuum Science and Technology[Lafferty, 1998]. A detailed presentation of work on rarefied transitional flows is documented by theproceedings of the biannual International Symposia on Rarefied Gas Dynamics (various publishers overthe last 45 years, all listed in Cercignani, 2000). This reference source is generally only useful for thosewith the time and inclination for academic study of undigested research, although there are several reviewpapers in each publication.
© 2002 by CRC Press LLC