microbiology and radiochemistry of...
TRANSCRIPT


The Florida Institute of Phosphate Research was created in 1978 by the Florida Legislature(Chapter 378.101, Florida Statutes) and empowered to conduct research supportive to theresponsible development of the state’s phosphate resources. The Institute has targeted areas ofresearch responsibility. These are: reclamation alternatives in mining and processing, includingwetlands reclamation, phosphogypsum storage areas and phosphatic clay containment areas;methods for more efficient, economical and environmentally balanced phosphate recovery andprocessing; disposal and utilization of phosphatic clay; and environmental effects involving thehealth and welfare of the people, including those effects related to radiation and waterconsumption.
FIPR is located in Polk County, in the heart of the central Florida phosphate district. TheInstitute seeks to serve as an information center on phosphate-related topics and welcomesinformation requests made in person, by mail, or by telephone.
Research Staff
Executive DirectorRichard F. McFarlin
Research Directors
G. Michael Lloyd Jr. -Chemical ProcessingJinrong P. Zhang -Mining & BeneficiationSteven G. Richardson -ReclamationGordon D. Nifong -Environmental Services
Florida Institute of Phosphate Research1855 West Main StreetBartow, Florida 33830
(863) 534-7160Fax:(863) 534-7165
FINAL REPORT
William C. Burnett, James B. Cowart, and Paul LaRockPrincipal Investigators
and
Carter D. HullResearch Associate
with
Zigeng Zhang, Jennifer Cherrier, Peter Cable, and Geoffrey Schaefer
FLORIDA STATE UNIVERSITYTallahassee, Florida 32306
Prepared for
FLORIDA INSTITUTE OF PHOSPHATE RESEARCH1855 West Main StreetBartow, Florida 33830
Contract Manager: Gordon D. Nifong
May, 1995
DISCLAIMER
The contents of this report are reproduced herein as receivedfrom the contractor.
The opinions, findings and conclusions expressed herein are notnecessarily those of the Florida Institute of Phosphate Research,nor does mention of company names or products constituteendorsement by the Florida Institute of Phosphate Research.
ii
PERSPECTIVE
Gordon D. Nifong, Ph. D.
Florida Institute of Phosphate Research
Since its inception more than fifteen years ago, the FloridaInstitute of Phosphate Research has stressed research in theenvironmental aspects of phosphate mining and processing.Included in that emphasis has been the health and safety ofindustry employees and also the public that live in the vicinityof the industry or who are otherwise affected by its operations.The legislation that created the Institute empowered it in afirst directive to conduct or sponsor environmental studies asmay be necessary for the health, safety, and welfare of Florida'scitizens, especially those in the phosphate region. Thisdirective has been heeded closely in the Institute's mission, asmost recently described in the 1995 publication "StrategicInitiatives and Applied Research Priorities." It is recognizedthat protection of the public health and of the environment areimplicit goals of all Institute research, but also there areareas of special interest, including air and water pollution,natural radiation, indoor radon, land reclamation, and thehandling and storage (and possible use) of by-productphosphogypsum. Although these areas overlap somewhat, it is thegypsum issue that this current project most directly addresses.
Naturally occurring radioactive materials are ubiquitousover all the earth, but are elevated above background inphosphate minerals. Chemically processing phosphate rock intophosphoric acid and phosphogypsum partitions the radionuclidespresent in the ore in such a way that most radium, and hence itsdecay products radon, polonium and lead, remain with the gypsum,while uranium and thorium remain with the acid. Largely becauseof this elevated level of natural radioactivity, little use forphosphogypsum has been found, and indeed the U. S. EnvironmentalProtection Agency currently bans most use and instead requiresthe material to be left in storage at the plant site. About 700million tons are currently stockpiled in Florida. Thus over theyears the Institute has funded much phosphogypsum research,including the effects of leaving it in storage, and the effectsof using it in agriculture, in construction, and in the recoveryof sulfur. More recently the risks to health and the environmentof using phosphogypsum versus the risks of storing it have beenemphasized, along with technical and economic considerations ofeach alternative.
iii

This study by investigators at Florida State Universityaddresses the gypsum issue in four ways. A first topic is anexpanded characterization of radionuclides present in thematerial. Part two explores the actual sites in the gypsum wherethe nuclides are concentrated, a first step in any purificationprocess. A third section examines the impact on near-bygroundwater of phosphogypsum storage. Finally any relationbetween the nuclides, mainly polonium, and certain bacteria,mainly those involved in sulfur cycling, was explored for anypotential of using bacteria to release radionuclides from thegypsum or to remove them from process waters.
iv

MICROBIOLOGY AND RADIOCHEMISTRY OF PHOSPHOGYPSUM
EXECUTIVE SUMMARY
Phosphogypsum, a waste by-product derived from the wet process production ofphosphoric acid, represents one of the most serious problems facing the phosphateindustry today. This by-product gypsum precipitates during the reaction of sulfuricacid with phosphate rock and is stored at a rate of about 30 million tons per year onseveral stacks in central and northern Florida. The main problem associated with thismaterial concerns the relatively high levels of natural uranium-series radionuclides andother impurities which could impact the environment and which makes its commercialuse impossible. Our general approach to this problem was to start the task of detailingexactly where and how radionuclides are hosted within the material. In this way, it ishoped that ultimately one may develop purification schemes for this waste material.
Our experimental approaches for characterizing the radiochemistry andmicrobiology of Florida phosphogypsum has been directed along four specific lines ofresearch. One component of this study involved detailed analyses of the sameradionuclides in the phosphate ore rocks and the phosphogypsum. Anothercomponent includes preliminary investigations of radionuclides in shallowgroundwaters collected from a limited number of monitor wells adjacent to gypsumstacks. The majority of research in the third component of this study involvesdissolution and leaching studies of the phosphogypsum and developing techniques toisolate and concentrate specific radionuclides from the phosphogypsum matrix. Theultimate goal of this line of research was to identify the actual sites occupied byindividual nuclides and how they are bound in the phosphogypsum. The final researchcomponent concerned microbiological studies which endeavored to identify and culturebacteria that either show the ability to release radionuclides from phosphogypsum orhave promise of scavenging radionuclides from fluids that are associated with thematerial. The microbiological research was focused on microbes which metabolize Poand may play a role in the solubility and mobility of Po (and perhaps otherradionuclides) in solutions circulating in and through gypsum stacks.
This Final Report presents data and discussion of these efforts which have beenmade since the study was initiated in 1992. The report is organized to show how these
V

research topics were addressed: Chapter 1 presents general radiological data forphosphate ore rock, phosphogypsum that has been stored on gypsum stacks for varioustimes, and water samples from monitor wells adjacent to phosphogypsum storage areasin Florida. The primary objective of the research described in this chapter was toradiochemically characterize and provide a comprehensive data base of uranium-seriesnuclides in Florida phosphogypsum and ore rocks. By evaluating all significantnuclides, including ‘**6Ra, *lol?b, and *lol?o in pairs of ore rock feed materials andphosphogypsum , sufficient data were obtained to describe fractionations between thevarious members of the *38U decay chain during processing. A thorough sampling ofphosphogypsum of various ages stored in Florida has also been completed in order toassess whether some radioelements migrate preferentially to others during storage.
The actual location of uranium-series radionuclides within phosphogypsum wasinvestigated in more detail in Chapter 2 by several different approaches. The hope herewas that if the actual sites within the phosphogypsum that host radionuclides could beidentified, this may represent a first step towards radiochemical purification of thismaterial. In this way, a waste material that may potentially contaminate theenvironment could ultimately be put to some good use. The material presented inChapter 2 is an extension of the broad-based radiochemical research presented inChapter 1. We describe methods that have been investigated for fractionating,concentrating, and leaching radionuclides from Florida phosphogypsum by bothphysical and chemical methods. Our results show that the behavior of radium, andother radionuclides, is often sample dependent, i.e., there are significant differences inthe solubility of radionuclides for different samples. In general, about 10-50% of theradium in Florida phosphogypsum is water soluble, although there are some datawhich suggest that the radium is actually associated with extremely fine-grain particles,perhaps colloids. The remaining, water-insoluble radionuclides are associated with themajor elements Al, Fe, and P and the minor elements Ba, Sr, and rare-earth elements (asCe and La). Our data suggest that the radionuclides appear to be hosted in analuminum-rich phase, probably an aluminum phosphate resembling the mineralcrandallite. The ultimate controls which govern the observed differences betweenphosphogypsurn samples still eludes us although substantial progress has been made indetailing the mechanisms which influence release and migration of radionuclides fromphosphogypsum.
vi

Chapter 3 concerns investigations related to the elevated concentrations of 210Po,the last radioactive member of the *3&J decay-series, which have been reported in anumber of shallow wells from the Central Florida Phosphate District. Although theexact source is uncertain, the *loPo probably originates either from the naturally-occurring phosphate rock of the area or from phosphogypsum. We assessed thepotential of a bacterial isolate to remove and incorporate dissolved polonium fromsolution by conducting comparative radiotracer experiments using 3!%04 and *08Po.
Since the observed chemical concentration of Po in these wells is too low to serve in anydirect metabolic function, it was suspected that it might be cometabolized with itschemical analog sulfur. Our experiments were designed to (1) measure the rate ofisotope uptake as a function of bacterial growth; and (2) fractionate the bacteria intovarious cellular components to determine how polonium and sulfur were partitionedwithin the cell. Results indicated that while the initial uptake mechanisms for SO, andPo differ, once associated with the bacterial cells, polonium is dispersed between thecell walls, cytoplasm, and protein in a manner similar to sulfur. The uptake rate ofpolonium is sufficiently rapid that the potential exists for development of abioremediation scheme for removal of polonium (and perhaps other contaminatingions) from process waters and other aqueous solutions.
The research reported in Chapter 4 is an extension of the uptake experimentspresented in the previous chapter. In this section, we investigated the moreenvironmentally significant bacterial release of polonium from phosphogypsum.Because of the chemical similarity of Po to sulfur (both occupy the same column in theperiodic table) studies were initiated to determine whether bacteria, particularly thosespecies active in sulfur cycling, could account for the selective solubilization andmobilization of Po. This chapter reports on experiments involving interaction ofbacteria with this waste gypsum. Bacteria were isolated from gypsum that werecapable of mediating Po release in column experiments when fed a growth medium.Sulfate-reducing bacteria were particularly effective at mediating Po release providedthe sulfide levels did not rise above 10 µM, in which case Po was apparently co-precipitated as a metal sulfide. Thus, whether microbes release or take up polonium inthis system depends upon the prevailing environment (oxic or reducing) which willultimately dictate which bacteria are present.
vii


xi

CHAPTER 1
RADIOCHEMISTRY OF PHOSPHOGYPSUM
INTRODUCTION
The majority of the phosphate fertilizer industry in North America is located inFlorida, which contains one of the world’s largest deposits of natural phosphorite.In the late 1970s, Florida supplied over 80% of the national output and more than30% of world production of phosphate ore. As in most other phosphate deposits,the Florida ores contain from about 50 to 500 parts per million (ppm) uranium.Sweeney and Windham (1979) estimated the Central and South Florida Phosphatedistricts contain 3.7 x 10⁵ metric tons of U308. Deposits of sedimentary phosphoritesin northeastern Florida which contain less uranium are also exploited forphosphate. The daughters of 238U, usually in radioactive equilibrium within thephosphate rock, are fractionated during reaction of the phosphate rock with sulfuricacid during the production of phosphoric acid. The solid by-products and theprocessing fluids used in the manufacturing process have the potential to beradiologically, as well as chemically, damaging to the environment.
Although phosphoric acid can be made in a variety of ways, the most commonmethod is the so-called “wet-process” production in which phosphate rock is reactedwith sulfuric acid. Operating conditions in the reaction chamber determinewhether gypsum is crystallized in either the dihydrate (CaS04.2H20) or hemihydrate(CaSO4.1/2H20) form. The capacity of existing phosphoric acid plants is so large thatthe phosphate fertilizer industry is the largest consumer of sulfuric acid in theworld. The process also results in the production of substantial quantities of by-product gypsum known as “phosphogypsum.” A very simplified chemical reactionfor the dihydrate process may be shown as follows:

ca&?o4)& + loH2so4 + 20H20 --> lOCaS04.2H20 + 6H3PO4 + 2HF{phosphate rock} {phosphogypsum}
While the mole ratio between gypsum and phosphoric acid is 5:3, the massratio is closer to 2.9:1, i.e., almost 3 tons of gypsum are produced for every ton ofphosphoric acid. The mass ratio of phosphogypsum produced to phosphate ore rockreacted is about 1.7:1 based on this equation, but is probably less and varies with theproportion of sand and unreacted solids in the ore rock. As a consequence of thisapproach, the phosphate industry as it operates in most parts of the world couldmore accurately be termed a gypsum industry. Since the phosphate industrymeasures its phosphoric acid production in terms of many millions of metric tonsper year, the amount of by-product gypsum produced is clearly substantial, currentlyon the order of 100 million tons per year on a worldwide basis.
The solid by-products, predominately phosphogypsum with lesser quantities ofquartz sand, clays, and minor unreacted phosphate ore are mixed withprocessing/cooling water solutions and pumped as a slurry with approximately20% solids to storage areas, the so-called gyp-stacks. The slurries are discharged onthe top of stacks and processing solutions drain through the pile of by-product.Solutions discharge through the base of the older stacks which are not lined andlarge containment channels along stack perimeters collect discharging solutionswhich have low pH and high concentrations of S04, F, Na, Ca, some trace metalsand radionuclides. These solutions are then ponded and re-used in the productionprocess.
According to a review by Nifong (1988) , the principal environmental concernswith phosphogypsum storage are fluorine emissions to the atmosphere and possiblecontamination of groundwater with radium, sulfate, and fluoride due to leaching ofthe phosphogypsum stack by processing solutions or rain water. The problemassociated with phosphogypsum storage that is perceived as being of greatestconcern, at least in the United States, is its content of radioactive elements,especially 226Ra (Fig 1). Other uranium-series nuclides associated withphosphogypsum, including 2loP0, have been found at high concentrations in someshallow groundwaters in the Florida mining area (Harada et al., 1989; Upchurch etal., 1991) and may be related to phosphogypsum in some cases. Generally theconcern is focused on the potential impact on the environment in the immediatevicinity of the gypsum stacks (Kouloheris, 1980; Miller and Sutcliffe, 1984).
Although phosphogypsum has been used in Japan and some other countriesfor production of cement and other construction materials, its commercial use inthe U.S. is currently limited to small quantities sold to farmers as a soil amendment.The U.S. Environmental Protection Agency (USEPA) has ruled that gypsum must beplaced on stacks or in mine cuts and only limited quantities can be removed foragricultural (226Ra<10pCi/g) or research purposes. Phosphogypsum cannot be usedfor construction or similar applications in the United States following an EPA
1-2

ruling (57 Fed Reg 23305, June 3, 1992 ) and reconsideration of this ruling (57 FedReg 14040, March 24, 1994). This ruling was predicated on: (1) risk assessments andenvironmental concerns associated with radionuclides in the 238U decay chain,especially radon; and (2) the substantial amount of natural gypsum already producedin the U. S. This situation is unfortunate for Florida, where the inventory of by-product gypsum has been growing tremendously within the past few decades. Thisproblem does not exist in some countries. For example, at this time the UK and theNetherlands discharge phosphogypsum into rivers or the sea, Morocco plans topump 25,000 tons/day of phosphogypsum from one plant directly into the AtlanticOcean, and France until recently discharged into the mouth of the Seine River(Becker, 1989; McDonald et al., 1992; Germain et al., 1992; Koster et al., 1992;Pennders, et al., 1992).
Although no industrial discharge of phosphogypsum into the environmentcontinues today in the United States, there was a plant near Taft, Louisiana thatdischarged a substantial amount of phosphogypsum directly into the MississippiRiver from the 1960’s to the mid-1980’s (Kraemer and Curwick, 1990). It may befortunate that this discharge has been stopped. A radiological assessment byMcDonald et al. (1992) of the dose received by the public in the UK has shown thatthere is actually a higher potential exposure from eating seafood near theWhitehaven phosphogypsum outfall than from the nearby Sellafield operationswhich have had significant discharges from a plutonium reprocessing facility.Nevertheless, stockpiling has its own problems because of the tremendous volumesthat are produced. In Florida, it is estimated that more than 700 million metric tonsof phosphogypsum are already stored at 18 sites throughout the state, with 30 - 40million tons being added each year. At this pace, Florida will have nearly 1 billion(1x10⁹) metric tons of stockpiled phosphogypsum by the year 2000 (May andSweeney, 1982; Nifong, 1988).
Phosphate Ore Rocks and Phosphoric Acid Production
On a world-wide basis, the total production of phosphate rock has averagedbetween 150-160 million tons per year from 1987 to 1991 (E&MJ, 1993). Becausefertilizer manufacture accounts for the overwhelming majority (>95%) of thisproduction, the long-term growth will ultimately be driven by human populationgrowth which is expected to continue to increase for at least several more years(Brown et al., 1987). Phosphate ore rocks are widely distributed in Florida, but havevarying concentrations of phosphate and 238U series radionuclides (Menzel, 1968;Bosch, et al., 1976; Burnett, 1988). Sedimentary phosphorites of most ages and areas(but with some notable exceptions) contain significant uranium concentrationswith typical values over 100 ppm. High grade ores in the Bone Valley Formation ofthe Hawthorne Group in central Florida are predominantly granular to pebble-sizedgrains of carbonate fluorapatite in a matrix of quartz sand, clays, and organicmaterial. Ore bodies are often weathered and the mineralogy, chemicalcomposition, and distributions of 238U decay series radionuclides in weathered
1-3

profiles are complex (Altschuler et al., 1958; Riggs, 1979; Burnett, 1988). Daughternuclides in the 238U series have been demonstrated to be fractionated during suchnatural weathering of the ore-bodies, but in phosphorites, as in most naturally-occurring rocks and minerals, radionuclides in the 2sU decay-series (Figure 1-1), atleast as far as 226Ra, are in approximate radioactive equilibrium. One notableexception to this is loss of 222Rn, an inert gas. In an earlier study conducted by ourgroup for the Florida Institute of Phosphate Research (FIPR), we showed that mostphosphate rocks in Florida lose between 10-20% of their natural 222Rn content(Burnett, 1988).
Approximately 70% of phosphate ore mined in Florida is initially converted tophosphoric acid before production of soluble phosphatic fertilizers. The granularore rocks are concentrated or “beneficiated” by removing matrix materials by sizingtechniques and flotation in fatty acids. Several studies have shown that after thegranular phosphate ore has passed through the beneficiation process, theequilibrium conditions in the uranium decay chain are largely unchanged. Sincevirtually all economic deposits of phosphorite are old enough for radioactiveequilibrium to be established in the 238U decay chain (this requires approximately 1million years), the specific activity (number of radioactive disintegrations per unittime per unit mass, i.e., decays per minute per gram) of all uranium decay productswill be approximately equal. Thus, a Miocene phosphorite in Florida with auranium content of 100 ppm will not only have a 238U activity of approximately 74decays per minute per gram (dpm/g), but individual activities of 23@Th, 226Ra, 222Rn,etc. of an equivalent amount.
During mining, but especially during chemical processing of the ore, theseradioelements become separated and radioactive equilibrium is no longer the case.This creates an entirely different situation because each isolated daughter willbehave according to its own chemistry and, if truly isolated, will decay away with itsown half-life. For example, should 21oPo be released into the environment withoutits radioactive predecessors, it will decay away with its own half-life (138.4 days),rather than be controlled by longer-lived parents. The radioactive daughters below226Ra in the chain are often observed to have lower activities due to 222Rn loss.However, during chemical operations such as wet process phosphoric acidproduction, the radioactive equilibrium in the phosphate rock is disrupted, aredistribution of radioactivity occurs, and the various members of the decay seriesfollow separate pathways as determined by their chemical properties.
Composition of Phosphogypsum
The chemical and radiochemical composition of phosphogypsum dependsupon the composition of the phosphate rock used for feed material and on the acidprocessing method employed. While three methods of processing are currentlyused throughout the world, only two are in use in Florida, the dihydrate process
1-4

Radionuclides in Phosphogypsum
U-238 U-234 4.47 x 10⁹yrs 2.48 x 16 yrs f L I- Pa-234
Th-234 Th-230 24.1 days 7.52 x lo4 yrs
escape to the
environment
l’b-206 (STABLE)
Fig. 1-l Natural 238U decay chain with nuclides of interest to this study enclosed in boxes. Downward arrows indicate alpha particle decay and diagonal arrows represent beta decay.

used throughout the Central Florida Mining District and the hemihydrate processused in northern Florida. Typical chemical compositions of two hydrated forms ofphosphogypsum from these processes are given in Table 1. Detailed chemicalcompositions and some radioisotopic analyses of phosphogypsum have beenpublished (Ferguson, 1985; Becker, 1989; Luther, 1991; McDonald et al., 1992;Germain et al., 1992; Kiister et al., 1992; Pennders, et al., 1992; Luther and Dudas,1993; Luther et al., 1993; Rutherford et al., (1993, 1994, submitted), Arocena et al., (submitted). The Dudas research group at the University of Alberta has an extensivedatabase of phosphogypsum compositions. The most recent detailed compositionalanalyses for Florida phosphogypsum have been reported by Carter and Scheiner(1992). Typical examples of these compositions are given in Table 2. In terms of theradioisotopic composition, phosphogypsum contains the same radionuclides, but indistinctly different ratios than its phosphate rock raw material. These radioisotopicdifferences are discussed at length in a later section.
Previous Work
Even though a considerable amount of compositional data exist forphosphogypsum produced throughout the world, comparatively little detailed workhad been undertaken on the fractionation and re-distribution of 238U decay-seriesradionuclides during processing of the ores and during storage on stacks.Radionuclide data, when presented, are generally confined to analyses of U, Th, andRa. Rutherford et al., (in press) have recently given some analyses of 21?l?b inphosphogypsum, but the most complete published analyses for 23%J decay chainisotopes that we have been able to locate are those published by Horton et al., (1988).Our studies focus on Florida ores and by-products and only a very few radiochemicalstudies of Florida phosphogypsum that were conducted prior to 1990 contain data onthe activities of several radionuclides in the uranium decay-chain. Most previousradiochemical studies of phosphogypsum up to that time usually presented data forgross alpha activities and/or 226Ra.
Studies by Guimond and Windham (1975), Lardinoye et al., 1982; Roessler(1984, 1988), May and Sweeney (1982), Laiche and Scott (1991); Burnett et al., (1992),and others have consistently shown that uranium tends to follow the phosphoricacid phase, while most of the radium is incorporated into the phosphogypsum. Avery limited number of analyses (Guimond and Windham, 1975; Roessler, 1984)present data that implies thorium tends to follow the phosphoric acid phase. Evenhigher activities of 2*6Ra (up to 220,000 dpm/g) are found in the small quantities ofscale associated with the filter pan which separates gypsum from the phosphoricacid (Keaton, 1987; Burnett et al., 1993). The French scientist J. Moisset hasattempted to locate radium site(s) in phosphogypsum as an integral part of anapproach to find a way to radiochemically purify phosphogypsum. He proposed thatradium is probably located together with calcium, strontium, and barium sulfate insmall crystals of 4-8 µm in diameter (Moisset, 1988). Another population of evensmaller (about 1 µm diameter) crystals of unidentified composition were also
1-5

Table 1. Typical analyses of phosphogypsum (from Kouloheris, 1980).
Component Dihydrate Hemihydrate
process process
CaO 32.5 SO3 44.0
p205 0.7 F 1.2 Si02 0.5
Fe203 0.1
A12O3 0.1
MgO 0.1 H20 19.0
36.9 50.3
1.5 0.8 0.7 0.1 0.3
9.0
Total 98.2 99.6

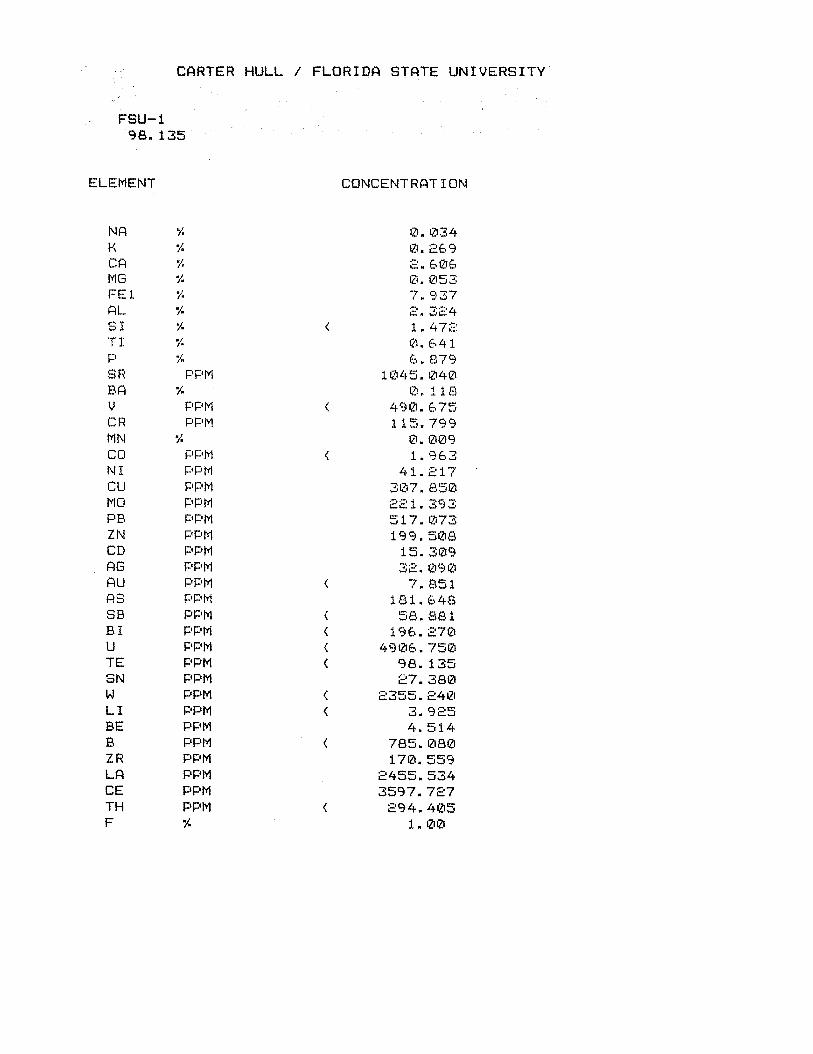
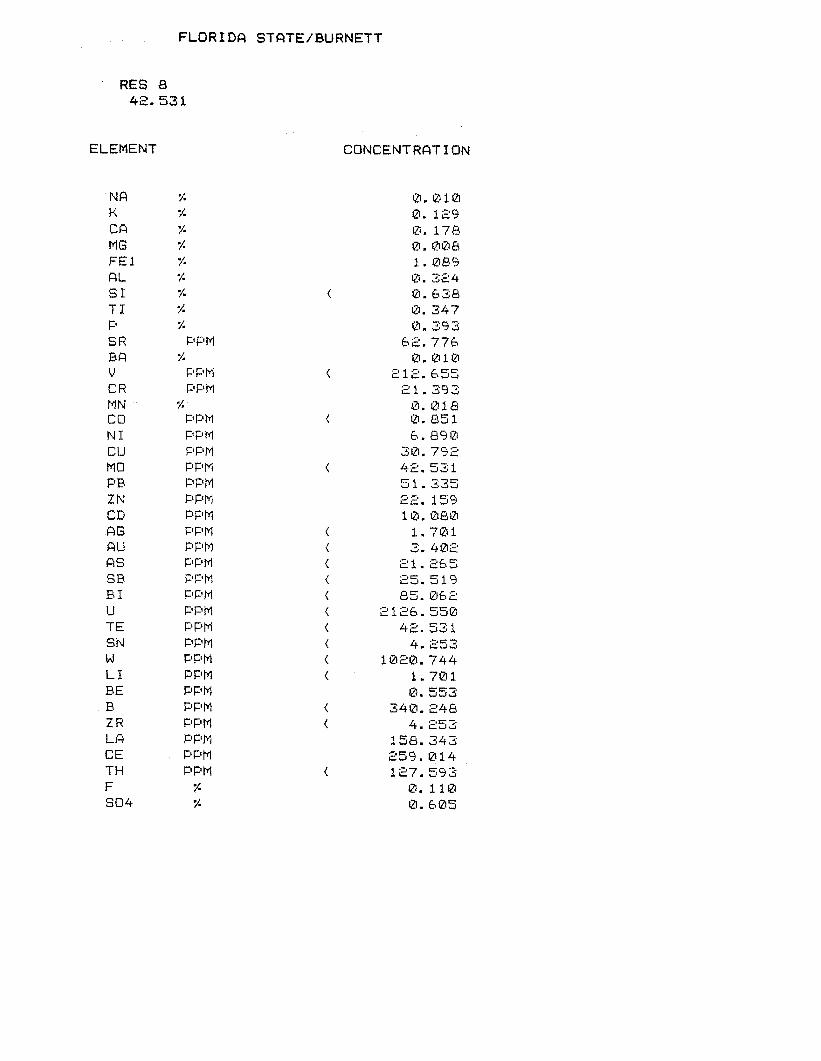
Table 2. Detailed compositional analyses of three Florida phosphogypsum (dihydrate) samples from Carter and Scheiner (1992) and this study. Concentrations are in “g/Kg. Water in the gypsum structure (CaSO4.2H20) makes up 20.9% (209,000 ppm) by mass and is not accounted for in the total of these analyses. Carbon compounds comprise <I % of most bulk phosphogypsum samples. Fe is total Fe. Concentrations of Cd, As, Hg, Sb, Se, V are less than detection limits for these ICP analyses.
Chemical Component
Florida Phosphogypsum Sample Leach Gyp* Gyp DL3 Gyp-46
(USBM) (FSU) (FSU)
Na
K
Ca
Mg Fe Al
Si
Ti
I?
Sr Ba
Cr
Ni
cu
Pb
zr
La
Ce F
so4
1700
<lOOO
191500
400
940
1300
90000
200
2400
550
32
75
9.2
250
195
400
cl00
c40
5750
350000
160 4110
130 1750
207200 171910
50 80
1110 830
810 830
83200 76200
470 220
2450 2920
603.5 638.7
80 70
3.1 cl.6
20 10
c5 5.1
5.5 ~4.2
10.7 16.6
30.1 6.2
105.7 109.2
58.3 <8.4
2700 4240
466200 480500
Total (Anhydrous) -645500 -765390 -744450
* Sample contained 14.8% porewater

tentatively identified as containing significant amounts of radium. Recent work byRutherford et al., submitted) have addressed the mobilization of 226Ra asphosphogypsum is leached with deionized water and the correlation of Ba:Ra inresidues and leachates.
There are few actual analyses of polonium in phosphogypsum although whatis available (Hurst and Arnold, 1980 and 1982; Horton et al., 1988) suggests thatpolonium is strongly favored by the gypsum phase. There is disagreement on whatfraction 21oPb is associated: reports by SENES Consultants Ltd. (1987), Roessler (1990)and others suggest that 21Qb follows the phosphoric acid fraction while analysespresented in Horton et al. (1988) show that 21Qb is contained in thephosphogypsum.
Objectives of this Research
The primary objectives of the research presented in Chapter 1 are toradiochemically characterize and provide a comprehensive database of uranium-series nuclides in Florida phosphogypsum and the ore rocks from which thegypsum was derived. We intended to produce a sufficient number of analyses ofnuclides in the 238U decay chain, including 226Ra, 21Qb, and 21oPo in ore-rock feedmaterial - phosphogypsum pairs, to enable a description of the fractionationbetween these members, of the 23&J decay chain during processing of the ores. Inaddition, a thorough sampling of phosphogypsum of various ages stored in Floridahas been completed in order to assess whether some elements migrate preferentiallyto others in phosphogypsum storage stacks.
RADIOANALYTICAL PROCEDURES
Solid Sample Collection
Phosphogypsum and beneficiated ore rock samples have been collected from 15of the 18 gypsum storage stacks in Florida and all but one production facility that iscurrently producing phosphoric acid. Beneficiated ore rocks were collected from themajority of the production facilities. Ore rock slurries were usually sampled sincemost production operations mix the ore rock with processing/cooling water beforefeeding it into reaction vessels. Samples of the resulting “fresh gyp” slurries werecollected directly from the discharge pipe which carries the by-product material ontothe active phosphogypsum stacks. The phosphogypsum slurries may be mixed withprocessing fluids again after sulfuric acid reaction to maintain proper viscosity forpumping it to the top of the adjacent gyp stack. Tons of fresh gyp can be depositedon a stack during a typical production day. In addition to the “fresh gyp” that wascollected directly from the discharge lines on the stack, some samples were drawnfrom ports on the discharge lines, and from terrace deposits that are rapidly
1-6

constructed into channels beneath discharge lines. Ore rock and phosphogypsumpairs were collected for all but one Florida production facility during 1992 and 1993.
Samples of phosphogypsum was also collected at a number of locations on eachstack that was sampled (see Appendix A - Sample Descriptions). The objective wasto collect samples that had been on the stack for various lengths of time; e.g., fromthe oldest material near the base of the stack, gyp that was >6 and <10 years old, >2and <6 years old, etc., up to the fresh gyp that was being discharged at the time.About 5 kg samples of older phosphogypsum were collected from undersaturatedzones of stacks with a shovel after the weathered surface layer was removed. Theless friable, weathered horizon was sampled in two near-surface profiles of stacksurfaces that had been inactive for decades. Samples of a filter screen from aphosphoric acid plant was also collected and analyzed for radionuclides.
.Preparation of Solid Samples for Radiochemical Analyses
Calcium sulfate has three crystalline forms: dihydrate (CaSO4.2H20),hemihydrate (CaSO4.1/2H20), and anhydrite (CaSO4). Depending on the chemicalprocess used in phosphatic fertilizer production, calcium sulfate may occur as eitherdihydrate or hemihydrate in phosphogypsum. Conversions between the threephases based on thermodynamic considerations may be shown as follows(Greenwood and Earnshaw, 1989):
150°C 600°C
CaS0~~2H~0-------+CaSO~~1/2H~0---->CaS0~dihydrate hemihydrate anhydrite
Since water exists in the crystalline structure of phosphogypsum and a freeform, consideration must be given to the methodology of drying these samplesbefore analysis. It is difficult to remove completely free water by air drying samplesat room temperature because the sample is influenced by humidity. The “fresh”phosphogypsum samples were very difficult to dry and homogenize due to thehydroscopic properties of the processing solutions, particularly sulfuric acid. It wasalso observed using X-ray diffraction (XRD) procedures that dihydrate can be partlyconverted into hemihydrate even at relatively low temperatures (~35° C) in a dryingoven. Pure dihydrate or hemihydrate is thus not easily obtained in an oven becausephase changes between these two forms cannot be perfectly controlled. Since allradiochemical analyses of solid phase material is ultimately based on a gravimetricdetermination (specific activities), and there exists a potential mass difference ofabout 15.7% between dihydrate and hemihydrate, analyses of phase mixtures wouldresult in unacceptable and irreproducible artifacts.
Thus, the processing of phosphogypsum samples for measuring specificactivities of radionuclides requires special care. All samples for this study wereprepared by drying the sample under atmospheric conditions until moisture was
1-7

reduced enough to allow a preliminary grinding of 400 - 600 grams of sample to agrain-size of <500 µm (30 mesh). After drying to constant weight in a vacuumdessicator at room temperature, samples were again ground to a grain-size of <250µm (60 mesh), split with a powder sample splitter, and stored in sealed glass bottles.XRD patterns were then produced for each sample to identify the predominantcrystalline phase(s) of CaSO4.nH20 as well as other phases in the phosphogypsum.Almost all the phosphogypsum samples used in this study are from the CentralPhosphate District of Florida and are produced using the dihydrate process. Twohemihydrated phosphogypsum samples and one dihydrate/ hemihydrate mixtureproduced at a plant in northeastern Florida are also included in the radiologicaldatabase.
Collection and Measurement of Nuclides in Liquids
We sampled shallow groundwater from wells in the immediate proximity ofseven phosphogypsum stacks; at Farmland Industries (Figure 1-2), the IMC P-21stack (Figure 1-3), Mulberry Phosphates (Figure 1-4), CF Industries (Figure 1-5),Occidental Chemical (Figure 1-6), Cargill Fertilizer (Figure 1-7), and Agrico, SouthPierce (map unavailable). Either a peristaltic or submersible pump was used in eachwell that was sampled to collect several liters of shallow groundwater. Wells werepumped for 20 - 40 minutes and water samples collected after temperature, pH, andconductivity measurements stabilized. Samples were fixed in the field for dissolvedsulfide measurements. Samples for radiochemical analysis (except radon) werefiltered immediately after collection through a 0.45 µm membrane filter, acidified toa pH<2 with HNO3, and all radio-tracers and carriers were added before returning tothe laboratory. Spiked solutions were allowed to equilibrate for at least three daysbefore chemically processing the samples. Samples for 222Rr-t were collected intriplicate by syringe and injected into pre-measured amounts of a mineral oil basedscintillator. Activities of 226Ra were determined by PERALS (Photon ElectronRejecting Alpha Liquid Scintillation) for a selected group of samples, while 21%and 2loPo were scavenged from the liquid and electrochemically separated (Narita etal., 1991). Po was spontaneously plated on Ag and measured by alpha spectrometry.Pb was deposited on filters as a sulfate, yields calculated, and 21?Pb activitiesmeasured by low-level proportional counting. Radon was assayed by standardliquid scintillation counting techniques.
Radon Emanation
Most radium activities in groundwater samples were determined by the radonemanation method. Any 222Rn gas initially present was removed by degassing thesolution with helium and then the sample was sealed and stored for several days,during which time 222Rn grew towards secular equilibrium with the 226Racontained in the sample. The sample was then returned to the stripping systemwhere samples were simultaneously de-emanated using high-purity (99.995%)helium at flow rates of approximately 400 mL per minute. Each gas stream was
1-8


Fig. 1-4 Monitor wells sampled around the gypsum stacks at Royster (nowMulberry) Phosphates, Mulberry, Florida. Samples were collected fromwells 1, 6, and 9.

Fig. 1-5 Monitor wells sampled around the gypsum stack at C.F. Industries,Bartow, Florida. Water samples were collected from wells SW-1, 2,3, and 5.

Occidental Chemical Occidental Chemical Swift Creek Complex Swift Creek Complex
,. ,.
Occidental Chemical Occidental Chemical Suwannee River Complex Suwannee River Complex
Gypsum Gypsum Stack Stack
Pit
m = Monitor Well
Fig. l-6 Fig. l-6 Monitor wells sampled around a gypsum stack at Occidental Chemical, White Springs, Florida. Water Monitor wells sampled around a gypsum stack at Occidental Chemical, White Springs, Florida. Water samples were collected from wells 35,4D, and 4s. samples were collected from wells 35,4D, and 4s.

Fig. 1-7 Monitor wells sampled adjacent to a gypsum stack at CargillFertilizer, Riverview, Florida. Water samples were collected fromwells 1, 3, and 8.

passed through a drying tube filled with Drierite and Ascarite to remove Hz0 andCO2, respectively (Mathieu et al., 1988). The gas streams then flowed into cold trapskept at liquid-nitrogen temperature. Under these conditions, radon will condensein the cold traps while the carrier helium passes through and is ultimately vented tothe atmosphere. The length of sample degassing depends upon the sample volume,approximately 50 minutes being suitable for 4-liter samples.
When degassing was complete, the radon was transferred to the alphascintillation cell by heating the trap with a hot air gun so that the gas “expands”through the cell-fill valve into the evacuated cell. Any radon left in the trap wasflushed into the counting cell with helium through the trap (Key et al., 1979). Cellswere isolated and removed from the system when the helium pressure reachedapproximately one atmosphere pressure. After an ingrowth period ofapproximately 3 hours to establish equilibrium between radon and its immediatedaughters, cells were placed on a photomultiplier alpha scintillation counter tocount the 222Rn and its a-emitting daughters, 218Po and 214Po (Ivanovich andHarmon, 1982). Activities of 226Ra were then calculated from the equation:
RA=mx 1 ht3
(1-P
where:A = activity of 226Ra (dpm);R = the net sample count rate;E= the total system efficiency (includes stripping, trapping, transferring, and
cell counting efficiencies) expressed as a fraction (the factor of 3 accountsfor the decays due to 218Po and 214Po as well as 222Rn);
h = the radioactive decay constant of 222Rn (1.253 x 10⁻⁴ mm-l);t1 = radon ingrowth time, i.e., time measured from the end of the initial
degassing period of the sample to the end of the current sampleemanation (min);
t2 = time from the end of sample flushing to the beginning of counting(min); and
t3 = counting time (min) .
Cell backgrounds were determined prior to processing each sample. Back-grounds of the cells used for this study generally ranged from 0.1 to 0.5 cpm with anaverage of approximately 0.2 cpm. Helium circulation blanks were run once amonth and averaged about 0.5 cpm above background. The system efficiencies weredetermined by repeated analysis of NIST radium solution standards.
1-9
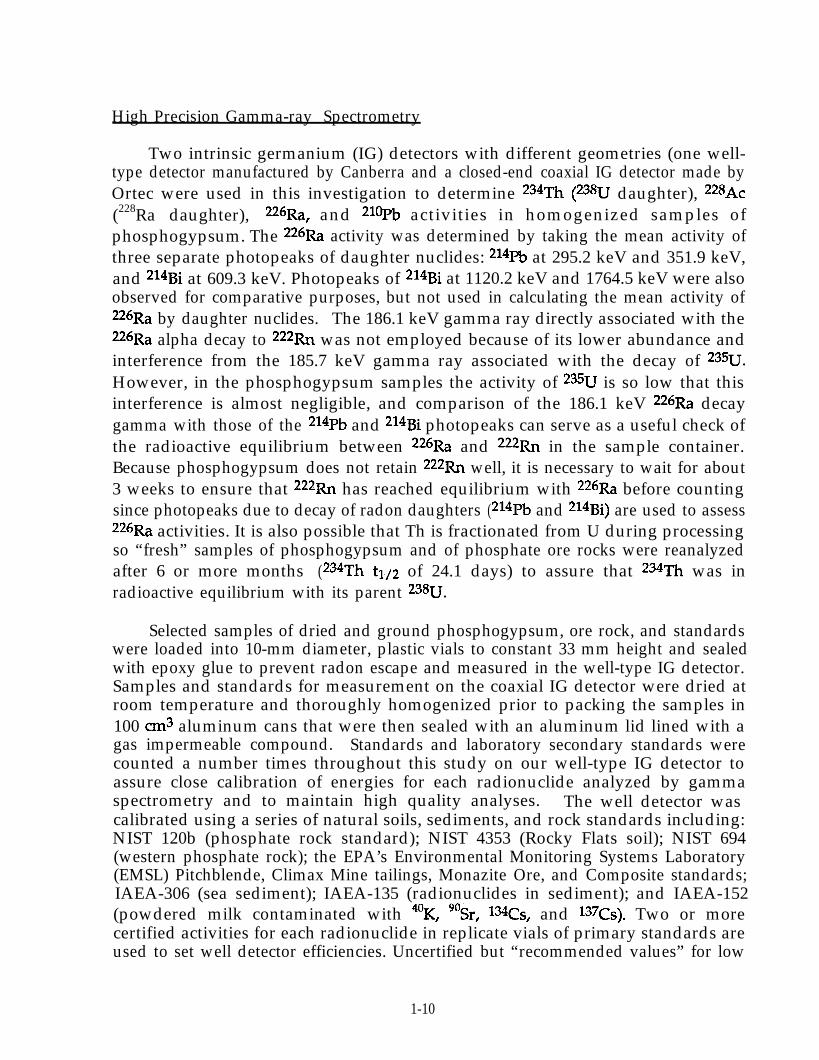
High Precision Gamma-ray Spectrometry
Two intrinsic germanium (IG) detectors with different geometries (one well-type detector manufactured by Canberra and a closed-end coaxial IG detector made byOrtec were used in this investigation to determine *34Th (2% daughter), **8Ac(228Ra daughter), **6Ra, and *?l?b activities in homogenized samples ofphosphogypsum. The **%a activity was determined by taking the mean activity ofthree separate photopeaks of daughter nuclides: *14Pb at 295.2 keV and 351.9 keV,and *l4Bi at 609.3 keV. Photopeaks of *14Bi at 1120.2 keV and 1764.5 keV were alsoobserved for comparative purposes, but not used in calculating the mean activity of**6Ra by daughter nuclides. The 186.1 keV gamma ray directly associated with the**6Ra alpha decay to ***Rn was not employed because of its lower abundance andinterference from the 185.7 keV gamma ray associated with the decay of 23%.However, in the phosphogypsum samples the activity of *sU is so low that thisinterference is almost negligible, and comparison of the 186.1 keV **6Ra decaygamma with those of the *14Pb and *14Bi photopeaks can serve as a useful check ofthe radioactive equilibrium between 22613, and 22%~ in the sample container.Because phosphogypsum does not retain ***Rn well, it is necessary to wait for about3 weeks to ensure that **%n has reached equilibrium with **6Ra before countingsince photopeaks due to decay of radon daughters (*%?b and *14Bi) are used to assess**6Ra activities. It is also possible that Th is fractionated from U during processingso “fresh” samples of phosphogypsum and of phosphate ore rocks were reanalyzedafter 6 or more months (*sTh t1/2 of 24.1 days) to assure that *34Th was inradioactive equilibrium with its parent *3%J.
Selected samples of dried and ground phosphogypsum, ore rock, and standardswere loaded into 10-mm diameter, plastic vials to constant 33 mm height and sealedwith epoxy glue to prevent radon escape and measured in the well-type IG detector.Samples and standards for measurement on the coaxial IG detector were dried atroom temperature and thoroughly homogenized prior to packing the samples in100 cm3 aluminum cans that were then sealed with an aluminum lid lined with agas impermeable compound. Standards and laboratory secondary standards werecounted a number times throughout this study on our well-type IG detector toassure close calibration of energies for each radionuclide analyzed by gammaspectrometry and to maintain high quality analyses. The well detector was calibrated using a series of natural soils, sediments, and rock standards including:NIST 120b (phosphate rock standard); NIST 4353 (Rocky Flats soil); NIST 694(western phosphate rock); the EPA’s Environmental Monitoring Systems Laboratory(EMSL) Pitchblende, Climax Mine tailings, Monazite Ore, and Composite standards;IAEA-306 (sea sediment); IAEA-135 (radionuclides in sediment); and IAEA-152(powdered milk contaminated with 4oK, “Sr, l%Cs, and 1%~). Two or morecertified activities for each radionuclide in replicate vials of primary standards areused to set well detector efficiencies. Uncertified but “recommended values” for low
1-10

activities of *38U decay chain nuclides in IAEA-312 and 314 are also used to monitorwell detector efficiencies and MDAs for nuclides on this system. A secondary,interlaboratory standard of sediments from Lake Rowell, Florida which has beenanalyzed numerous times in four radiochemistry laboratories for *38U decay chainnuclides and two interlaboratory phosphogypsum standards are also used toevaluate efficiencies for each energy used on the well detector.
The coaxial IG detector was calibrated by analysis of the same NIST and IAEAprimary standards. Unfortunately, the amounts of EMSL standard samplesavailable to us were not sufficient for packing larger, 100 cm3 containers for thecoaxial detector. In addition to calibrating the coaxial IG detector efficiencies withprimary standards, four well-homogenized phosphogypsum samples, two secondarystandards, and five primary standards were analyzed on the well detector and largerreplicates of these same samples were used to cross check results on the coaxial IGdetector. Since some phosphogypsum samples contain up to 11% by mass of sand,clay, and fine-grained aluminophosphates with elevated U activities, it wassuspected that heterogeneities in 2 to 3 gram, sub-samples of phosphogypsummeasured by y spectrometry on the well-type IG detector could introduce analyticaluncertainties. Therefore, gamma activities in approximately 130 g samples weremeasured one or more times on the coaxial IG detector for every phosphogypsumand ore rock sample and are reported in the radio-chemical database for this study(the complete database is given in Appendix B).
A plot of the absolute efficiency for the coaxial IG detector versus photopeakenergy shows that the detector is most efficient at photopeak energies <100 keV andthat there is a good log-linear relationship of efficiency versus energy at energiesgreater than 100 keV. It was also observed that efficiency was inversely proportionalto sample height in the container for the lowest energy peak measured (**?t?b = 46.5keV) as a result of both self-absorption (discussed below) and geometry effects. Self-absorption had no apparent effect on efficiency for the higher energy peaks (such as351.9 keV and 609.3 keV) which both responded to a change in packing height withsimilar slopes . Although geometry changes with packing height in large containerswere documented, sufficient sample sizes were used for all bulk analyses reportedhere such that no geometry corrections were necessary, i.e., only full containers withnearly identical geometries were analyzed.
Self-absorption of low energy (energies below about 200 keV) X-rays and y rayshas a significant effect on the apparent efficiencies calculated for the coaxial IGdetector in this energy range. Self-absorption corrections must be carefully appliedfor the *l?l?b peak at 46.5 keV and for the measurements of *34Th at 63.3 and 93.1keV. Since the attenuation for low energy gamma rays is highly dependent uponsample composition, a simple method which can easily correct for self-absorptionon a sample-to-sample basis without knowledge of the chemical composition isrequired for direct analysis by y spectrometry. The following approach was modified
1-11

from that suggested by Cutshall et al., (1983). For a transmitted beam of γ-rays,attenuation will follow the equation:
T = IeWX
In which T and I are the attenuated and unattenuated beam intensities, µ is thetotal attenuation coefficient (ar?/g), p is the material density (g/cm3) and x is thepath length (cm). The self-absorption equation may be written:
O = A (l-e-Clpx)/(ppx)
where O is the attenuated sample output (count rate) and A is the actual samplephoton emission rate. To obtain a correction factor for self-absorption, T and I maybe measured and the ratio A/O computed from:
A/O = ln(T/I)/(T/I-1)
In this work, the attenuated beam intensity T at any one energy was defined asthe difference between the count rate of each sample with and without an externalsource containing *lol?b and natural U centered on top of the sample container. Wecurrently use a plexiglass “hockey puck” that contains a high activity *l@b foilsource and also about 30 grams of uranyl acetate to provide a relatively high activitysource. The factor “I” was determined by making a measurement with the sameexternal *lQb and *34Th (*38U) source (the “hockey puck”) on top of an emptycontainer. We now find that it is more efficient to define “I” as transmissionthrough the efficiency standard and “T” as transmission through the unknownsample. Gyp-6, a phosphogypsum sample that had been very well characterized, wasused as a secondary standard to obtain the apparent (uncorrected) efficiency for the46.5 and 63.2 keV peaks for the coaxial IG detector. Relative absorption factors (fabs)for all samples were then calculated by dividing the measured correction factors(A/O) for each sample by the same correction factor in the secondary standard (Gyp-6). This ratio thus represents how each sample compares to the efficiency standardin terms of self-absorption. Relative absorption factors were close to unity for all thephosphogypsum samples analyzed here with a range from 0.89 to 1.14. The final*l%‘b and 234Th activities were then obtained by substituting the relative absorptionfactors into the activity calculation equation (Rim and Burnett, 1983):
A (dpm/g) = (cpm-bgd)*fabs/(Wt * fg * fi *feff)where:
A = activityWt = sample weight in grams;
:r:= geometry factor;
*= intensity factor; andfeff = efficiency of 46.5 keV photopeak.
1-12

When this method is applied to the analysis of IAEA-306, a deep-sea sedimentsupplied by the International Atomic Energy Agency and used as an internationalintercomparison sample for 2?Pb, BsU, and other radionuclides, good agreementwith the “recommended” values was obtained Table 3. Absorption corrections arevirtually identical for numerous analyses of the same sample as expected. All 21?Pband *%I values for bulk samples reported here have been corrected according tothis scheme while activities of higher energy nuclides (>200 keV) have been assessedwithout an absorption correction.
Activities of *3&J in 29 samples of phosphogypsum and ore rocks have beenanalyzed using both gamma and alpha spectrometry and results from the twotechniques are plotted in Figure 1-8. Activities of 238U range from less than 2 to 119dpm/g and the effective packing densities are about 0.8 to 2.0 g/cm3 for this set ofphosphogypsum and ore rock samples. The correlation factor (r*) of 0.996 and the1.00 slope of the line regressed through the data indicate that the method we use forcorrecting the attenuation of the low energy (<200 keV) gamma rays works quitewell over a range of activities and packing densities. The “error bars” representativeof counting uncertainties at the 10 level are less than the symbol radius until *%Iactivities are 50 dpm/g or greater in samples that are mostly ore rocks. Generally,uncertainties in alpha spectrometry results for ore rocks were comparable or greaterthan those of gamma spectrometry. This was partially due to lower chemical yieldsof U for some of these samples. Poor yields can result from elevated phosphateactivities in the sample which cause matrix effects and loss of U from the ionchromatographic resin we use for separating U and Th isotopes. Some scatter insamples plotting above 50 dpm/g in Figure 1-8 may result from using limitedquantities of samples (0.3 g) for alpha spectrometry which may not be sufficientlyhomogenous to be representative of 100 to 200 g of the sample which were packedinto the 100 cc aluminum cans and measured by gamma spectrometry.
Overall the method of measuring *MTh in bulk samples and applying anabsorption correction factor that is directly related to sample density (Burnett et al.,1993; Oresegun et al., 1993) has proved to be very successful. The advantages ofusing this technique are that the 23% can be indirectly measured for a sampleconcurrently with *l@b, **6Ra and 2*8Ra with very little additional work. Theattenuation measurements for *34Th as well as other nuclides of interest whichhave gamma energies with photopeak energies of <200 keV can be madeconcurrently with that of *%l?b so an additional attenuation measurement is notrequired. Absorption corrected results are comparable to those obtained for *38U byalpha spectrometry which is very time consuming, laborious, and requires an entirealpha spectrometry system and data reduction software. One disadvantage ofmeasuring *MTh directly by gamma spectrometry is that samples which have beenchemically processed within the preceding six months may have U and Th isotopeswhich have been fractionated and are not in radioactive equilibrium and the *34Th
1-13

Table 3. Natural uranium and thorium decay-series nuclides measured on the coaxial IG detector for the IAEA-306 intercomparison sample seven times during this study. Errors shown for individual analyses are lo based on counting statistics. Means are given and 1 standard deviation of individual counts are also shown. All 210Pb values corrected to reference date of 1 January 1988 and 210l?b and 234Th activities are absorption corrected. The “confidence interval,” defined by IAEA, brackets the median value at the 95% confidence level (20).
Analysis
1
2*oPb 2%U(234Th) 226Ra* 228&(228Ac) Date 46.5 keV 63.2keV 338.4keV counted
29.5kO.2 4.9kO.l 3.8kO.l 2.8kO.I 11/12/91
2 28.8kO.3 5.3-L0.2 3.5kO.l 2.8kO.l 03/16/92
3 29.4zLO.4 4.9rt0.2 3.6kO.l 2.6kO.l 03/29/92
4 28.7kO.3 4.4kO.l 3.9fO.l 2.9kO.l 05/26/92
5 27.7IfIO.l 4.3kO.l 3.6fO.l 2.8kO.l 10/30/92
6 29.2kO.2 4.0rt0.2 4.OkO.l 2.9kO.2 03/04/93
7 28.5kO.3 4.6kO.2 4.4kO.l 3.WO.l 06/04/94
Mean & 1 SD 28.8kO.6 4.6kO.4 3.8kO.3 2.8kO.2
“Recommended” values**
Median 26.6 4.6 4.0 2.9
Confidence 22.9-32.1 3.9-5.7 3.6-4.9 2.3-4.9
Interval (a=0.05)
* 22613, determined by mean of photopeaks for 214Pb at 295.2 and 351.9 keV, and the 609.3 keV peak of 214Bi.
** Ballestra et al., 1989.

234T
h (2
38U
dau
ghte
r) by
y S
pect
rom
etry
\ \ \ \ \ \ \ \ \ \ . . \

must be allowed to attain secular equilibrium with its parent *3*U. An additionaldrawback is that only *3*U is measured by gamma spectrometry and not other Uisotopes in the samples. We feel that in some circumstances the benefits of thistechnique far outweigh the shortcomings.
Isotope Dilution Alpha Spectrometry
Isotope -dilution alpha spectrometry was used to determine quantitatively theactivities of *loI? for every sample and *3*U, *xU, *3@I’h, and *32Th for selectedsamples of Florida ore rocks and phosphogypsum. This well-known method isbased on measuring the alpha-activity of isolated and chemically purifiedradionuclides. Chemical yields are determined by the addition of a known activitytracer. Our laboratory uses *ml?0 for polonium samples and *3*U and ***Th foruranium and thorium isotopes.
Uranium and thorium isotopes were measured following total dissolution ofthe sample. Accurately weighed ~1 gram samples of phosphogypsum and ~0.35gram samples of ore rock were dissolved in 750 mL of 4M HCl and 1.000 mL of 232U-2**Th spike and 10 mg Fe were added. After 16 - 24 hours to allow for dissolution ofgypsum and isotopic equilibration of the spike, solution pH was raised to 6, andhydroxides were scavenged. The ferric and other hydroxides were rinse indeionized water, and redissolved in 4M HCl. This process was repeated three to fourtimes until hydroxide scavenges were mostly Fe(OH)3. The final scavenge wasacidified with 2M HCl and the soluble fraction was decanted off. Any solids whichremained were centrifuged and transferred to a graphite bottomed Teflon beaker,rinsed with DDW and evaporated to near dryness. The solids were then fumed withHF, HClO4, HNO3, H202, and a 3% boric acid solution until all quartz and refractoryand highly insoluble phases (ilmenite, zircon, calcium and lanthanum groupfluorides, alumuniofluorides) were completely dissolved. Two mL concentratedI-IN03 were added and evaporated to near dryness again to remove excess HClO4and HF. The two solutions were combined, again scavenged with Fe(OH)s, anddissolved in 2M HNO3. U and Th were separated with ion chromatographic resin(TRU-SpecTM), and then electrodeposited on stainless steel planchets for counting onvery low background, ion-implanted alpha detectors.
Samples for *loPo analyses were processed and Po was separated from *l?Pb and*loBi within a few weeks of collection. Ore and phosphogypsum samples weredissolved in an acid digestion bomb with 2 mL concentrated HCl, 3 mL concentratedHNO3, 1 mL concentrated HF, 0.5 mL concentrated HCl04, and 1.000 mL 209I?o tracer.Samples were heated overnight in sealed bombs at approximately 140°C. Ore rockswere processing in a manner similar to U and Th samples. After removing aphosphogypsum sample from an acid bomb, about 3.5 grams K&O3 and 20 mLDDW were added and the sample was refluxed twice to convert the insoluble
1-14

CaS04*nH,O to HCl-soluble CaC03. The sample was transferred to a centrifuge tubeand washed with DDW until pH=7 was reached to remove all excess carbonate andsulfate from the sample. The precipitate was totally dissolved with approximately 2mL of concentrated HCl. At this point, 10 mg of Fe carrier was added and Fe(OH)sprecipitated with ammonium hydroxide, the solids were centrifuged, washed,decanted, and finally dissolved in 2M HCl. Any solids remaining were treated asdescribed above for U and Th samples and the solution was scavenged, redissolvedin 2M HCl, and Po solutions were recombined.
At this point Po samples were totally dissolved and ready for sourcepreparation either by electrodeposition or spontaneous plating. Most Po sourceswere prepared by spontaneous plating of polonium from an acidic solution ontopure silver discs by the method described by Harada et al. (1989). For poloniumelectrodeposition, a 24-mm polished stainless steel disc was plated with a thin layerof copper in a cell containing around 50 mg CuSO4 in 1M H2SO4 for about 10seconds at 2.6 volts. When spiral marks were apparent on the disc, they werepolished off by rubbing the disc once or twice on a 600 grit polishing strip and thenelectrodeposited again. One gram of ascorbic acid and 1.5 grams of hydroxylaminehydrochloride were added and polonium was electrodeposited onto the copper-coated discs at 1.1 volts for 90 minutes. The surface of the discs were then washed asit emerged from the plating solution by using the elongated and curved tip of awashbottle to prevent acid staining of the disk surface.
All prepared sources for alpha spectrometry were then counted in one ofseveral low-background alpha spectrometers routed to a Canberra Series 95 Multi-Channel Analyzer. Backgrounds of the alpha spectrometers used for this studyranged from 0.004 to 0.011 cpm with an average of approximately 0.007 cpm for the21oPo peak, and ranged from 0.013 to 0.034 cpm with an average of approximately0.02 cpm for the *@?o peak. Reagent blanks averaged about 0.01 cpm abovebackground for both the *loPo and *ogPo peaks. Data reduction was performed by acustomized computer program that includes provisions for decay corrections anderror propagation due to counting statistics.
RESULTS AND DISCUSSION
Radionuclides in Ore Rocks and Phosphogypsum
Radionuclide activities have been measured for seventy-eight samples ofFlorida phosphogypsum and seventeen phosphate ore rocks. A statistical summaryof these results is given in Table 4. Replicate samples were occasionally performedfor 21oPo analyses and *loPo activities are decay/ingrowth corrected to the date ofcollection. Activities measured for replicate and recounted samples were averagedbefore use in the statistical summary and uncertainties for both types ofmeasurements were propagated accordingly. Activities of ?l?o in some samples of
1-15

Table 4. Statistical summary of radiochemcial results for Florida phosphogypsum and phosphate rock samples.
Radionuclide 23qJ 226Ra ZlOm, 210P0 P’Pb/ (210Po/ Specific Activities Given in dpm/g 226Ra) 210Pb)
,Phosphogypsum .- Central & Southern Florida Dihydrate
Mean 7.9 54.4 51.6 51.6 0.95 1.00
Stan. Deviation 5.1 11.3 11.9 12.2 0.13 0.17 Od
Range 2.4-22.1 30.3-81.2 34.7-110.0 26.1-105.9 0.66-1.37 0.68-1.65
No. of Analyses 97 98 97 82
Phosphogypsum - Northern Florida Hemihydrate
Mean 7.8 26.0 26.1 25.6 1.01 0.98
Stan. Deviation 8.0 7.5 4.5 4.1 0.15 0.10 (10)
Range 1.4-27.1 16.2-35.9 20.8-33.2 21.3-34.0 0.78-l .28 0.74-l .08
No. of Analyses 13 13 13 10
Phosphate Rock - Central & Southern Florida
Mean 75.8 87.6 86.5 81.3 0.99 0.94
Stan. Deviation 26.5 17.2 15.8 16.5 0.06 0.03 (10)
Range 50.9-118.8 52.9-118.8 52.9-110.1 52.3-110.1 0.94-1.16 0.93-1.08
No. of Analyses 21 21 21 24
Phosphate Rock (Northern Florida)
Mean 41.5 38.5 41.4 38.9 1.07 0.94
Stan. Deviation 21.2 18.4 20.8 18.0 0.05 0.07 (10)
Range 14.5-58.9 13.8-53.0 14.4-58.9 14.3-52.6 1.01-1.13 0.89-1.03
No. of Analyses 4 4 4 4

phosphogypsum collected <3 years from production were not in secular equilibriumwith parent *loI?b. Replicate analyses for these samples were conducted during theingrowth period to confirm that 21oPo approached equilibrium. Detaileddescriptions of all samples collected for this study are given in Appendix A and thecomplete radioanalytical database is presented in Appendix B.
Detailed radiochemical analyses of long-lived radionuclides in the *3*U decay-chain and *3*Th for a sub-set of 17 representative samples of phosphogypsum and 11phosphate rock samples from Florida are given in Table 5. Eleven of the freshphosphogypsum samples shown in Table 5 were collected in pairs with ore rock thatwas being reacted when samples were collected. The approximate percentage of aradionuclide that fractionated to the phospho-gypsum for these 11 ore rock -phosphogypsum pairs are listed in Table 6. Ideal mass ratios are applied in thesecalculations, so percentage data must be considered rough estimates. It is clear thatthe reaction is far from ideal and unreacted materials introduce significantuncertainties that are not accounted for in these data.
The phosphate rock samples from central and southern Florida display *3*Uand daughter activities in the range 50-110 dpm/g (Tables 4 and 5). Ores fromnortheastern Florida contain less than half the activity of all these nuclides as do thecorresponding phosphogypsum samples. This is a direct reflection of the rawmaterial being processed there because the rock used for production of phosphaticfertilizer contains significantly lower level of radionuclides. These results confirmthat the various members of *3*U decay chain, including *3&J, *?Th, 2*6Ra, *lol?b,and *loPo, are in approximate radioactive equilibrium in phosphate rock. It is clearthat this equilibrium is significantly disrupted during the chemical manufacture ofphosphoric acid.
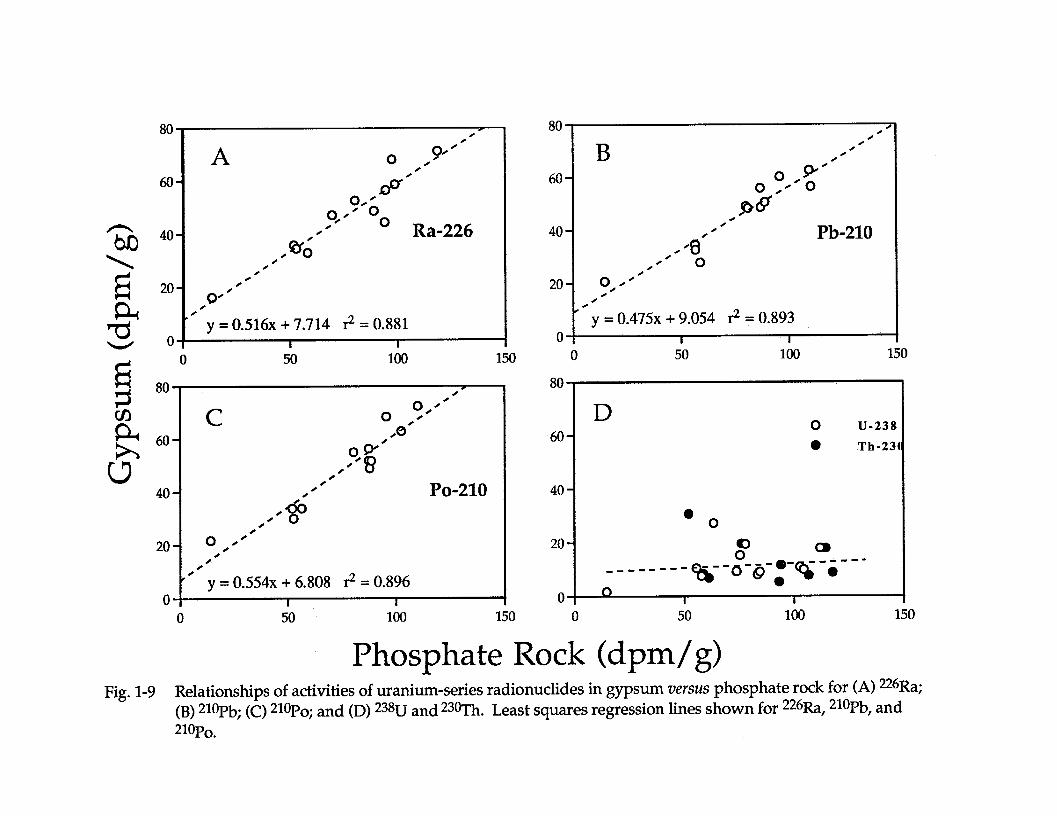
This disruption is evidenced in Tables 4, 5, and 6 and is clearly shown in Figure1-9 which displays plots of *3*U, *3@Ih, **6Ra, ?Pb, *?Po in 12 phosphogypsumsamples versus activities in the corresponding phosphate rock. The activities of*26Ra, *loPb, and *lol?o in phosphogypsum display good correlation’s versusactivities of the corresponding phosphate rock. The rock: gypsum mass ratio of~1:1.7 can be factored with slopes for the regressed lines in these plots to give arough percentage of the nuclide that reports to phosphogypsum. Results are 81 to95% for Pb, Ra, and Po in the gypsum when the data are smoothed in this way. Thatthe great majority of **6Ra remains with the phosphogypsum has been wellestablished, but these results demonstrate that virtually all *lol?b and *loI? are alsopresent in fresh phosphogypsum as well (Table 5). It most cases the activities of**6Ra, *l?l?b, and to a lessor extent, *loI? in fresh phosphogypsum are directly andpredictably proportional to the activities in the input phosphate rock, indicating thatthe extent of incorporation of these nuclides into the phosphogypsum is primarilycontrolled by the amount supplied by the ore rock.
1-16

Table 5. Radiochemical analyses of long-lived radionuclides in the 238U decay-chain and 232Th for selected samples of phosphogypsum and phosphate rock. Activities of 23%J, 234U, 23@Ih, 232Th, and 21oPo activities were measured by a -spectrometry and 226Ra and 21oPb by yspectrometry. Two or more cx spectrometric analyses have been performed for replicates of selected samples. Uncertainties are given at the 1 (r level based on counting statistics only.
Sample ID
238~
dpm/g
234~
dPI-e 230T h dpm/g
21@‘b dPm&
21OPO
dPm& 232T h
dPm&
Phosphogypsum Samples
GYP-8 16.B0.3 16.kkO.3 19.3+0.2 4ei9+0.3 17.Od10.6 18.5kO.7 19.6kO.3
Gyp-10 1.73kO.08 13.BO.3 17.20.2 16.X0.2 16.lf0.2
Gyp-13 6.420.1 6.5kO.l 12.4d10.1 44.810.2 12.2IkO.l
Gyp-18 9.1f0.4 10.8kO.5 8.8kO.l 53.5f0.3 9.kko.3 9.6f0.3 9.2zko.3 51.6kO.4
Gyp-19 9.8k0.3 9.5kO.3 6.8kO.l 32.71k0.2 33.3kO.3
45.920.7
20.6kO.4 20.9f0.5
44.7Iko.5
49.2kO.7 54.3kO.9 0.18+0.02 48.9k0.9 55.8kO.6 0.17~0.04
34.9kO.5 34.5f0.7
33.9f0.6 0.25rtO.03
45.3kO.6 0.14kO.02 0.61f0.08
21.9kO.4 0.691kO.05
46.21kO.6 0.64fO.03 0.5OkO.02

Table 5 (continued)
Sample ID
238~
dPm&
234~
dpm&
23oT h
dpmk 226Ra
dpmk
21oPb
dpmk
2W.30
dpmk
232T h
dpm/g
Gyp-21 lO.OIkO.2 10.2ko.2
Gyp-26 15.5kO.2 15.8kO.2
Gyp-30 9.61kO.2 9.9kO.2 9.OkO.3 9.3+0.3
Gyp-31 10.7rtO.l 11.9kO.l
Gyp-34 10.6f0.3 10.8kO.4
Gyp-38 24.4k0.5 24.21kO.5
Gyp-43 2.8fO.l 4.1+0.1
8.21kO.l 57.7kO.4 7.&!zO.l 59.6kO.5
11.7kO.2 44.BO.2 44.5kO.4
7.31t0.2 7.OIkO.l 7.kkO.l
8.9kO.3
46.41k0.4 45.0zko.3
72.2zk0.4 70.4kO.4
5.4kO.l 57.8kO.3 55.3kO.4
19.6kO.3 44.8kO.3 49.91k0.2
18.lIfrO.2 65.7k0.2
60.7&-0.8 59.7~1.0
50.6f0.5 50.8kO.8
51.0+0.7 51.OkO.7
62.2kO.S 63.1kO.9
54.7kO.5 57.OkO.8
5O.k!IO.8 46.5kO.6
57.1k0.5
69.1kO.9 71.4Iko.9 70.6kO.5 62.8+_0.5
51.8kO.4
38.8k0.4
72.6kO.6
51.9kO.6
56.5-10.6
56.4zkl.0
0.17~0.01 0.12*0.01
0.21+0.03
0.24+0.05 0.25+0.01 0.20f0.01
0.35+0.05
0.12*0.02
0.50+0.05
0.30f0.03

Table 5 (continued)
Sample ID
238~
dPm/g 234~
dP%S 21(?I.'b
dPm/g
Gyp-47 19.8kO.7 17.920.6
Gyp-48 17.3kO.4
Gyp-53 7.5kO.2
28.kkO.7
Gyp-57 9.OLO.2
Ores-18
OreS-19
Ores-21
84.3k2.0
60.4kl.2
102.6f2.5 106.Ok2.2
20.1+0.7 23.1kO.8
16.8k0.4
7.7k0.2
28X-0.7
11.9kO.2
87.7k2.1
63.M.3
105.2k2.6 113.4f2.4
14.3k0.2 66.2zkO.3 14.1kO.2 64.9kO.4
18.0k0.2 68.1kO.3 68.0f0.3
8.4kO.l 36.OkO.2 35.7kO.3
30.8kO.3 34.750.2 34.420.2
26.7rfi0.3 19.4kO.2
Phosphate Rock Samples
84.0k0.8 80.9f0.3
61.kkO.S 56.4k0.2
104.3H.O 99.9kO.4 108.5k1.2
57.2k0.6 55.4f0.9
56.5kO.8 56.6k0.8
27.9k0.4 27.8kO.6
33.2ko.5 32.2kO.5
23.0+_0.5
80.3+1.1 82.8k2.5
56.2k0.7
94.421.2
59.1kO.5
63.1kO.9
30.2ko.5
34.OkO.9
23.0k0.3
77.8k1.4
57.8kO.5 54.9kl.O
93.4k2.1 97.8k1.6
0.15kO.02 0.41f0.04
0.24+0.02
.59+0.04
1.34kO.07
1.11+0.05
1.75+0.12
2.2OkO.16
0.66*0.08 0.85kO.11

Table 5 (continued)
Sample ID
238~
dpmk 2WJ
dpm/g
23oT h
dpmk
226Ra
dpmk
21oI’b
dpm&
21OPO
dpm/g
232Th
dpmk
OreS-26 97.2&l .2 98.9&l .3 93.9ko.9 94.3kO.3 91.2ko.4
88.8zkO.9 91.2k1.3
88.5H.6 1.62kO.12
111.6z!A.l 131.0+1.3
89.6k2.4 89.6+2.4
117.4kO.7
93.1+1.0
113.7kO.4 109.9&l .4 llO.kk1.6
87.4k0.8
0.76f0.06
2.14kO.16
OreS-31
Ores-34 94.7k0.2 91.7kO.4
86.7kO.5 91.4&l .3
76.OH.3
96.3LO.7
114.1rt0.8
58.6+0.5
52.OkO.6
69.8kO.2 80.9f0.8 87.4k0.8
61.2Ll.l
102.5k1.2
52.6fl .O
52.Ok1.2
2.10+0.21
0.66+0.06
0.81kO.07
3.24kO.12
2.05kO.13
Ore!+38
Ore!!%47
Ore48
Ore-53
Ore-54
81.Ok2.1
90.3&l .6
117.kk2.2
57.9&l .6
63.3&l .O
79.9zk2.0
90.8k1.6
124.2X2.3
59.1k1.6
68.7H .l
55.OkO.2 59.4+0.8
97.7rto.4 110.1+1.6
52.OkO.2 58.9k0.7
56.7H .O 53.OkO.3
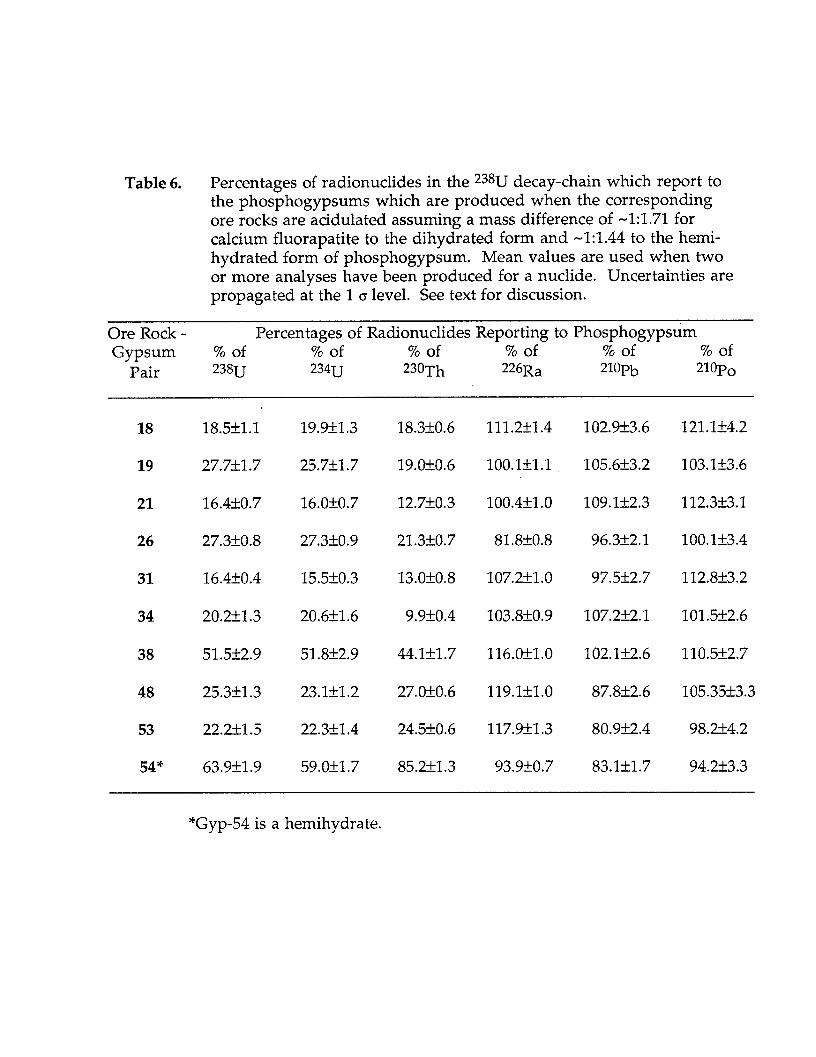
Table 6. Percentages of radionuclides in the 238U decay-chain which report to the phosphogypsums which are produced when the corresponding ore rocks are acidulated assuming a mass difference of -1:1.71 for calcium fluorapatite to the dihydrated form and -1:1.44 to the hemi- hydrated form of phosphogypsum. Mean values are used when two or more analyses have been produced for a nuclide. Uncertainties are propagated at the 1 CT level. See text for discussion.
Ore Rock - Percentages of Radionuclides Reporting to Phosphogypsum Gypsum % of % of % of % of % of % of
Pair 238~ 234~ 23oT h 226Ra 2%-b 21OPO
18
19
21
26
31
34
38
48
53
54"
18.5A11.1
27.7xk1.7
16.4kO.7
27.3kO.8
16.4f0.4
20.2k1.3
51.5k2.9
25.3k1.3
22.2k1.5
63.9f1.9
19.9f1.3 18.3kO.6 111.3+1.4 102.9f3.6 121.Hz4.2
25.751.7 19.OkO.6 100.1+1.1 105.6k3.2 103.1zk3.6
16.0+0.7 12.7rt0.3 100.4+1.0 109.1f2.3 112.3k3.1
27.3f0.9 21.3kO.7 81.8kO.8 96.3k2.1 lOO.lf3.4
15.520.3 13.0f0.8 107.3+1.0 97.5f2.7 112.8k3.2
20.6f1.6 9.9kO.4 103.8rtO.9 107.2k2.1 101.5k2.6
51.8f2.9 44.kk1.7 116.0fl.0 102.1f2.6 110.5k2.7
23.1rt1.2 27.0f0.6 119.kkl.O 87.8rk2.6 105.35k3.3
22.3dz1.4 24.5kO.6 117.9k1.3 80.9k2.4 98.21k4.2
59.Ok1.7 85.2k1.3 93.9kO.7 83.1rt1.7 94.2k3.3
“Gyp-54 is a hemihydrate.
A 0 ,p=’
N” 0,’
0,’ ‘0
,EY;" ' Ra-226
, . , # ,o='
’ y = 0.516x + 7.714 3 = 0.881 I I
0 50 100 150
C 0 O/
,o=
,$ . , . 4 PO-210 ,
* , , F ,
60~
40,
20’
0
B
Pb-210
0 U-238
a Th-23
Phosphate Rock (dpm/g) Fig. 1-9 Relationships of activities of uranium-series radionuclides in gypsum versus phosphate rock for (A) 22613,;
(B) 2*oPb; (C) ?Po; and (D) 238U and 23@Th. Least squares regression lines shown for 226Ra, 21%‘b, and W?O.

Uranium and Thorium Nuclides
The great majority of 226Ra ?Pb, and 21ol?o are incorporated in thephosphogypsum, but the partitioning of 230Th and 238U is more variable. Thedissolved uranium is largely incorporated in the acid phase as uranyl phosphate,sulfate, and fluoride complexes. Any tetravalent uranium which is in thephosphate rock is oxidized to U6+ during the acidulation process and uranyl ions arepredominately complexed with phosphates. Many fertilizer production facilitieshave, at one time or another, recovered U from acid for sale to the nuclear industryso the reaction and speciation of U in phosphoric acid is fairly well understood.However, up to 50 - 60% of U fractionated to phosphogypsum in samples given inTable 6 demonstrate that the redistribution of 238U and 23oTh during acidulation ofphosphate rock may be controlled by a number of factors. Some of these factorsinclude redox potential and digestion temperature during the processing ofphosphate rock, sorption on humic substances and clays, coprecipitation withfluorides, etc. The 238U content of the by-product gypsum shows no significantcorrelation to the 238LJ content of the phosphate rock (r2c0.11 in Figure 1-9) and maysimply be related to the extent of unreacted ore and oversaturation and re-precipitation of calcium fluorapatite which is known to occur in productionprocesses. The presence of chuvkhrovite and other complex Fe phosphates,fluorosilicates, and fluorite documented by Kennedy et al. (1991) forphosphogypsum slurries and process waters was confirmed in XRD patterns ofleached phosphogypsum samples collected for this study. We have also identifiedU-bearing resistate minerals such as Fe-Ti oxides, various polymorphs of iron andaluminum phosphates the high U phase in weathered ore deposits) in bulkphosphogypsum using XRD.
Radium
Radium, which exhibits a chemical behavior similar to calcium in thesesystems (Roessler, 1988; Lardinoye et al., 1982) has been proposed to: (1) coprecipitateas some yet unknown phase or solid solution with CaSO4.nH20 (Roessler, 1990); (2)be included in radiobarite (BaS04 containing radium) or (Ba,Sr)S04 solid solutions(Moisset, 1988; 1990; Rutherford et al., in press); and (3) be sorbed on organic material(Ferguson, 1985). It is not definitively known how 226Ra is included inphosphogypsum and this topic is addressed further in Chapter 2 of this report. Itmay be that a combination of these and other processes control z26Ra solubility inphosphogypsum. Although the site(s) occupied by 226Ra are not well characterized,it is clear from data presented in Table 6 and from studies by Roessler et al., (1979),Lardinoye et al., (1982), and results presented here that virtually all 226Ra inphosphate ore rock fractionates to phosphogypsum.
The summary of activity data (Table 4) lists mean values for (21?l?b/226Ra) inphosphogypsum produced from ores in both phosphate districts. Both are near
1-17

unity, but values range from 0.66 to 1.37. Ratios that are slightly less than 1 can beexplained by Rn loss, but when (21qb/226Ra) is less than 0.85, it is likely that 226Ramust be added to the sample or 21ol?b was lost and vice versa when (21qb/226Ra) isgreater than 1.1. Based on studies of the behavior of 226Ra in leachedphosphogypsum samples (Rutherford et al., in press; Chapter 2 of this report) Ra isrelatively immobile on the unsaturated, aerobic portions of gypsum stacks incomparison to ?Pb. However, process and cooling pond waters at fertilizerproduction facilities may contain appreciable activities of 226Ra (eg. 121 dpm/L, 190dpm/L, and 149 dpm/L at one facility sampled in 1979, 1988, and 1994; Florida DEPunpublished data). Fresh phosphogypsum slurries being discharged onto stacks aremade up of 75 to 80% of cooling pond water so the possibility exists for addition ofradionuclides, especially in freshly discharged phosphogypsum.
Lead and Polonium
The other main radionuclides which are found in phosphogypsum, 21?Pb and2lol?o, are present in all samples including fresh samples collected directly fromgypsum discharge pipes at phosphoric acid plants. Since the activities of 21opb and21?l?o are generally comparable to 226Ra (Table 4), the predominant source of thesenuclides must be the phosphate rock instead of accumulating as decay products of226Ra during gypsum storage (Roessler, 1984). The half-lives of 21oPb (22.3 years) and210Po (138.4 days) are such that ingrowth periods of approximately 100 years for 21opband 2 years for 21?Po would be necessary to obtain secular equilibrium by ingrowth.
When the (2?l?b/z6Ra) activity ratios for individual samples are examined,most display a few percent deficiency in 21ol?b which can be attributed to radon lossin older samples. During the analyses of these gypsum samples, it was discoveredthat larger radon losses, on the order of 30% or more of the radon, would occur overshort time periods (sample preparation). The long-term, less than 10% loss based onthe 21ol?b activities implies that radon emanation in the field is much less importantthan may be implied by “emanation coefficients” as measured in the laboratory.Two of the 25 fresh phosphogypsum samples have (210l?b/226Ra) less than 0.85 and 4other fresh samples with slightly higher ratios suggest that the (21ol?b/226Ra) incooling pond waters used to slurry the by-product may influence activity ratios insome younger samples. Activity ratios (21?i?b/226Ra) less than 0.85 in 5 of 53 oldersamples could result from either or a combination of the processes described aboveor by l?b loss from the sample during storage. In 4 of these 5 older samples,(21oPo/21oPb) is near unity so if Pb was leached from the sample, the leaching ceased>3 years before sampling. An older phosphogypsum sample (Gyp-51) showsevidence for leaching of Pb within 2 years of collection as evidenced by (21oPb/226Ra)of 0.66 and (21oPo/21oPb) of 1.57 (Appendix B).
1-18

Twelve of the 78 phosphogypsum samples (Gyp-9, Gyp-10, Gyp-17, Gyp-26, Gyp-29, Gyp-30, Gyp-38, Gyp-39, Gyp-45, Gyp-46, Gyp-50, and Gyp-57), have 21?l?b activitiessignificantly above 226Ra (21ol?b/226Ra greater than 1.1) implying that either 21ol?b ispreferentially scavenged relative to 226Ra, the (21ol?b/226Ra) of the slurry water mayhave influenced the ratio in the sample, or that there is migration of 2?l?b and/or226Ra in solutions within gypsum stacks. Of the 12 samples with significantamounts of excess 21ol?b, 5 are fresh (no more than weeks old) while the remainderare years to decades old. In the 25 samples of freshly produced phosphogypsums,only 5 had (21opb/226Ra) greater than 1.1 and 18 fresh samples all had (21oPb/~6Ra)between 0.88-1.05. It seems that excess 21@b could be added with process water, but(21ol?b/226Ra) in fresh samples are most influenced by the ratio in the ore rock. Twosamples that had been on stacks for a number of years (Gyp-9 and Gyp-45) had(21oPb/226Ra) of 1.20 and 1.22 whereas (?l?o/ 21oPb) at the date of collection 0.71 and0.83 which clearly demonstrates that 2@l?b had been added to the samples fromsolutions percolating through the gypsum stacks sometime during the 2 yearspreceding collection.
The activities of 21oPo and (21(?Po/21ol’b) in 25 fresh phosphogypsum samplesare quite variable (Appendix B) and show that 21oPo closely approaches equilibriumwith 2lm in 10 samples (Gyp-7, Gyp-14, Gyp-15, Gyp-19, Gyp-26, Gyp-34, Gyp-35,Gyp-47, Gyp-50, Gyp-54), is significantly enriched in 9 samples (Gyp-18, Gyp-21, Gyp-22, Gyp-31, Gyp-36, Gyp-38, Gyp-40. Gyp-48, Gyp-53) or depleted in 6 samples (Gyp-23,Gyp-30, Gyp-33, Gyp-39, Gyp-44, Gyp-49) in relation to its 21?l?b grandparent. Thevariability of 21ol?o activities in fresh phosphogypsum samples, some producedwithin weeks of one another and deposited in the same region of a gypsum stack,may be related to changes in ore rock compositions, redox potentials and digestiontemperatures during the processing of phosphate rock, and the quantity of organicmaterial in the ore. Another factor which undoubtedly impacts (?Po/21oPb) infresh phosphogypsum is the (21ol?o/21oPb) in the cooling water that is used to slurrythe by-product for discharge onto the stacks.
.
The (21oPo/21oPb) activity ratios for those samples older than two years shouldbe approximately equal to unity since 21ol?o will reach >97% equilibrium with 2?l?bin about five half-lives of 21ol?o, either by decay of excess 21ol?o or by ingrowth from21?Pb via 21oBi. However, the activities of 21oPo and 21oPb in six phosphogypsumsamples that are old enough for (21?l?o/21@b) to have reached secular equilibrium(Gyp-9, Gyp-18, Gyp-45, Gyp-51, Gyp-52, Gyp-56) do not all have activity ratios of 1.00.Four of the 6 “mature” phosphogypsum samples that do not have (2?l?o/210Pb)between 0.9-1.1 are depleted in 21ol?o relative to 21@b (Gyp-9, Gyp-45, Gyp-52, Gyp-55), but the apparent depletion in 3 of these samples (Gyp-9, Gyp-45, Gyp-55) is likelycaused by Pb being added to the sample from solutions circulating in the gypsumstack within two years of sample collection. The remaining 2 of these 6 samples
1-19

(Gyp-18, Gyp-51) had (21oPo/21@b) activity ratios greater than 1.1 and on the date ofcollection, indicating probable loss of Pb from these samples.
Hurst and Arnold (1982) suggested previously that excess amounts of 210Po arepresent in phosphogypsum because of more efficient polonium incorporation in thegypsum phase relative to 21Opb. Preferential incorporation of polonium does notseem to be the case in samples we have analyzed since only 9 of the 25 freshphosphogypsums had excess 21oPo and Po migration and addition is not indicatedfor any of the 53 older phosphogypsums which were collected after various periodsof weathering on or near stack surfaces. On the other hand, Pb leaching,mobilization, and re-sorption/precipitation may be the processes responsible for(21?l?b/21@o) disequilibrium in mature phosphogypsum samples. Thisinterpretation is consistent with some of our groundwater data which showsoccasionally very high ?Pb and high (21oPb/21oPo) activity ratios, especially in someof the more acidic wells (see section on “Monitor Well Waters” below).
We do not know as yet if 21oPo is leached and migrates in the saturated,reduced portions of gypsum stacks since all our older samples have been collected ator near the stack surface or from one very shallow well in the P-21 stack. Eventhough Po is surface reactive under most physiochemical conditions, unsupported21oPo in acidic, reduced groundwaters in areas associated with ore bodies is welldocumented and has been attributed to the activity of sulfate-reducing bacteria(Harada et al., 1989). Migration of 21oPo in gypsum stacks in relation tomicrobiological factors is discussed in Chapters 3 and 4 of this report.
Radionuclides on Production Filter Screens
The activities of 21oPb, 226Ra, and 228Ra (228Ac) are given in Table 7 for residueson woven polypropylene and glass fiber filter screens that were used to separatephosphoric acid in an phosphoric acid facility in central Florida. These filter screensare known to contain relatively high activities of 22613, (Keaton, 1987) so we feltthere was a high probability that the insoluble phase(s) which contains the greatmajority of radionuclides in phosphogypsum would be concentrated on such a filterscreen. A Geiger-Mueller detector was used to target segments of the filter screenthat contained higher activities of radionuclides and these sections of the unwashedfilter screen were carefully cut into strips which could be rolled into tubes with thesame geometries and inserted into the vials used for our well-type IG detector.Scales deposited on the screen were disturbed as little as possible. An extremelyfine-grained scale that is not visible without magnification could not be physicallyseparated from the woven filter substrate. The mass of the filter screen itself isbelieved to comprise >95% of the total mass contained in the vials.
Barite was positively identified by XRD in a very small sample of scale (Scale#3) that separated from the filter when a portion of the screen was leached in 0.1M
1-20

Table 7. Activities of *lol?b, 2*6Ra, and **8Ra measured in scales removed from production filters and in very fine-grained encrusted scales measured while still on the filter. Errors shown for individual analyses are lo and based only on counting statistics.
**@b **6Ra 228Ra(**gAc) Mass 46.5 keV 185.9 keV 338.4keV
Sample (g>” @pm/g) (dpm/g) (dpdg) (21ol?b/ **6Ra)
Scale 1 1.916 1050+10 2270+10 11+2 0.46LOl
Scale 2 1.585 133OrtlO 2850&l 0 19+2 0.47IL.01
Scale 3 0.010 51 OOf200 14000+3000 1400+400 0.35f.01
Filter 0.621 14820+70 34400+100 160f20 0.43f.01
* Masses are of encrusted scale together with dry filter screen except Scale 3 (co.01 g) that separated from filter during O.lM HCl leaching.

HCl. This leached scale has the highest specific activity of 226Ra measured duringthis study (>35,000 dpm/g) (Table 7) so a radiobarite type of phase does exist on thisscreen. However, these screens are used for filtration for weeks and represent openchemical systems. Although a radiobarite type of mineral phase may contain aportion of the 22% in phosphogypsum, barite has yet to be positively identified inphosphogypsum by XRD and SEM techniques.
Monitor Well Waters
The pH, conductivity, temperature, and sulfide concentrations in groundwatersamples collected over a two year period from monitoring wells adjacent to sevenphosphogypsum stacks are given in Table 8. Wells at the P-21 stack were sampled anumber of times under various hydrological recharge conditions. Wells near otherstacks were sampled only once or periodically to characterize the fluid compositionsand activities of 226Ra, 222Rn, ?I%, and 21oPo in solution. Activities in well watersamples are given in decay per minute per liter (dpm/L) for these nuclides in Table9.
There is a wide range of pH, electrical conductivity, and sulfide concentrationsin surficial groundwaters collected from monitor wells waters adjacent tophosphogypsum stacks in Florida (Table 8). The pH values of well waters areextremely variable. Waters collected from wells in northern Florida at theOccidental facility are near neutral (pH of ~ 6 to 7) and those collected in SW 1 and 2at the CF Bartow site are quite acidic at pH ~2. Electrical conductivity’s of watersfrom SW 1 and 2 are over an order of magnitude higher in these two well watersthan almost all other water samples and are likely caused by higher concentrationsof total dissolved solids in these acidic waters. Conductivity’s are also relativelyhigh in the Cargill - Tampa MW 1 and 8 and Farmland MW 2 and 5. Sulfideconcentrations are elevated in the IMC P-21 wells and Farmland MW 2 and 5. Thelack of sulfide in Occidental wells and Cargill - Tampa MW 3 is notable as is the lowsulfide concentration in Royster (Mulberry) MW 9. Low sulfide concentrations arenot correlatable with higher pH in each instance, but there seems to be an inverserelationship between these two parameters when pH approaches 7 as is expectedfrom Eh - pH diagrams of the S-O-H system (Wagman et al., 1982; Brookins, 1988). Itis not clear at this time whether the lack of sulfide is due to well depths anddistributions or results from the pH and Eh of the hydrologic systems. However, itis most likely that Eh controls sulfide activities to a much greater degree in the pHrange of most groundwaters sampled in this study.
There are also appreciable variations in the activities of radioelements (Table9). Radon, for example, ranges from relatively low values of 590 dpm/L in oneanalysis of P-21 MW 16 and 880 dpm/L in Cargill - Tampa Stack MW 8 to over132,000 dpm/L in the P-21 MW 12. This is not unusual since radon has been provento vary tremendously over short distances in shallow aquifers because of “source
1-21

Table 8. Groundwater parameters from monitor wells near gypsum stacks. Low pH values show that extremely acidic conditions develop within some of these gypsum stacks.
Company Well ID Temp. Cond. pH Sulfide
OC hmhos) wm.J
Farmland MW 1 25.9 130 Farmland MW3 24.0 110 Farmland MW5 26.1 5540 Farm Land MW6 -- --
IMC (P-21) MW 12 22.0 1320 IMC (P-21) MW 16 21.6 760
IMC (P-21) IMC (P-21) IMC (P-21) IMC (P-21) Royster Royster Roys ter Roys ter Royster
IMC (P-21) IMC (P-21) CF Industries CF Industries CF Industries CF Industries
Occidental Occidental
Jan. S-9,1991
Feb. 13-14,199l
MW 11 26.0 1600 MW 12 23.9 1620 MW 16 24.5 1140 MW 17 24.0 690 MWl 22.7 271 MW6 23.0 202 MW6/2 23.0 188 MW9 22.3 205 M-w 9/2 23.0 220
March 25-26,199l
MW 12 23.5 1600 MW 16 25.5 1300 SW-1 25.5 40 SW-2 24.0 24800 SW-3 26.0 13000 SW-5 23.6 79
April 30, 1991
SC 3s 22.6 500 SC 4D 22.5 410
Occidental SC 4s 23.8 1870
4.45 4.71 4.75
-- 3.84 5.44
1 12 91 73 40
7
3.73 -- 4.18 91 4.53 -- 3.93 3 6.44 96 5.43 0 5.33 -- 6.78 1 7.24 --
4.21 4.45 4.88 1.57 2.04 5.56
6.76 6.80 6.22
-- -- -- -- -- --
0 0 0

Table 8 (Continued)
Company Well ID Temp. Cond. pH Sulfide
OC (pmhos) GWL)
IMC (P-21) IMC (P-21) IMC (P-21) IMC (P-21) IMC (P-21) Cargill Cargill Cargill
MW 11 24.8 2120 MW 12 24.2 1920 MW 16 24.9 1690 MW 17 24.8 1200 MW 18 26.0 125 MWI 24.8 11200 MW3 25.0 1350 MWS 27.0 17000
Nov. 7-8, 1991
4.82 --
4.14 134 4.40 165 4.20 183 5.41 0 4.88 100 6.70 0 5.30 2
IMC (P-21) IMC (P-21) IMC (P21) Farmland Farmland
MW 12 23.8 1850 MW 16 25.0 1390 MW 17 24.8 1300 MW2 26.0 9100 MW5 25.2 6200
Feb. 3‘1992
4.20 129 4.20 156 4.23 224 4.71 177 4.68 247
IMC (P-21) IMC (P-21) IMC (P-21) IMC (P-21)
MW 11 23.0 1380 MW 12 23.3 1920 MW 16 25.0 1380 MW 17 24.0 1420
Mar. 26,1992
4.42 39 4.13 93 4.47 111 4.20 212
IMC (P-21) IMC (P-21) IMC (P-21)
MW 11 24.0 1620 MW 12 22.3 1550 MW 16 23.7 1180
Jzm, 16, 2992
4.49 72 4.21 95 4.44 96
IMC (P-21) MW 11 24.5 1860 4.92 -- IMC (P-21) MW 12 23.5 1700 4.18 -- AgriCo MW8 26.0 5600 6.40 --
Jun. 3-4,199l
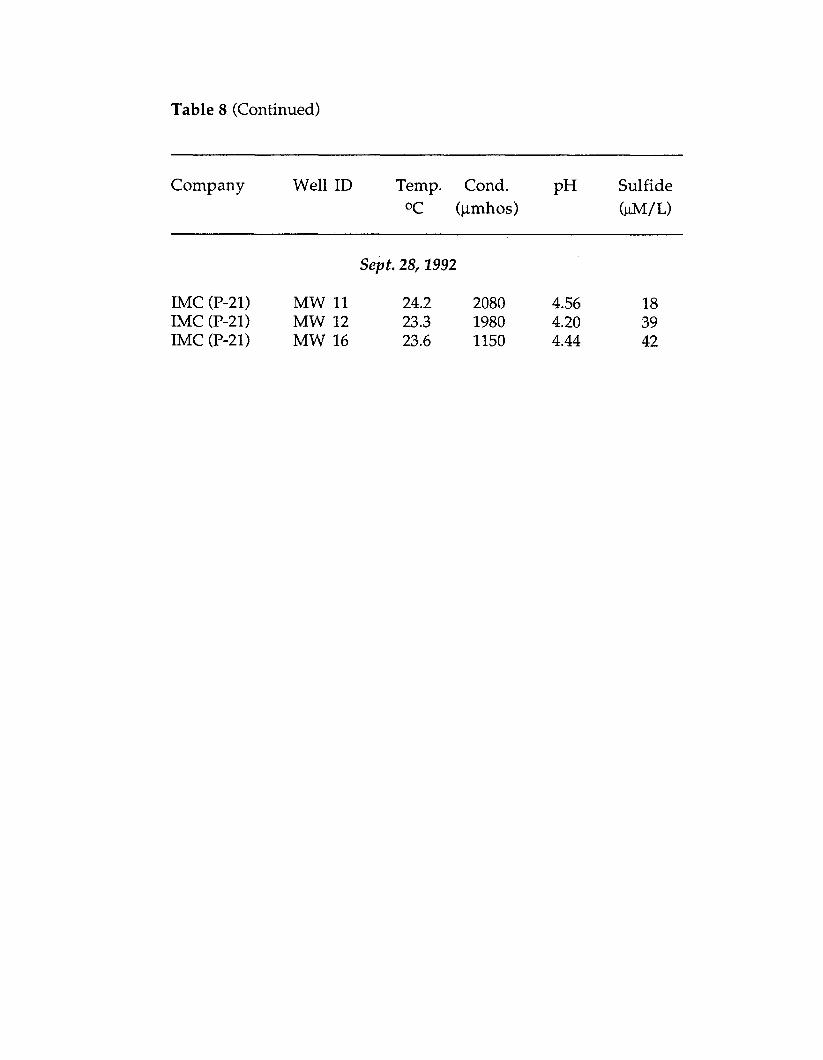
Table 8 (Continued)
Company Well ID Temp. Cond. pH Sulfide OC (pmhos) (am)
Sept. 28,1992
IMC (P-21) MW 11 24.2 2080 4.56 18 IMC (P-21) MW 12 23.3 1980 4.20 39 IMC (P-21) MW 16 23.6 1150 4.44 42

Table 9. Radiochemical analysis of groundwaters sampled from monitor wells near gypsum stacks. Errors quoted represent lo errors based on counting statistics.
Company Well ID 2lOPO
dpm/L
Farmland MW 1 Farmland MW3 Farmland MW5 Farmland MW6 IMC (P-21) MW 12 IMC (P-21) MW 16
IMC (P-21) IMC (P-21) IMC (P-21) IMC (P-21) Royster Royster Royster Royster Roys ter
IMC (P-21) IMC (P-21) CF Industries CF Industries CF Industries CF Industries
Occidental Occidental
MW 11 MW 12 MW 16 MW 17 MW 1 MW6 MW6/2 MW9 MW 9/2
MW 12 MW 16 SW-1 SW-2 SW-3 SW-5
SC 3s SC 4D
Jan. B-9,1991
2.9kO.2 650f 20 13.7kO.3 10100+ 150
9.9kO.2 6000+ 120 40.3kO.5 8930f 100 17.6kO.3 61300+2300 30.7k1.2 270+ 50
Feb. 23-24,199Z
8.7rfrO.5 5120+ 90 20.5+0.3 54900+1700 2O.OAzO.3 12900+ 570
2.8zLO.l 4790+ 60 0.6+0.1 2580+ 130 1.1kO.l 36300+1300 1.5kO.l 287OOrt 310 0.9kO.l 753ort 430
-- 11700f 80
March 25-26,299l
19.BO.3 68000+ 230 4O.lkl.O 21200+ 250
6.8kO.2 39700+ 200 30.8kO.5 1040+ 20 67.9kO.6 8900+ 100
0.4zLzO.l 186OOrt 530
April 30, 1992
0.8kO.l 2000+ 90 1.3+0.1 2260+ 70
--
1.06+0.03 --
5.68kO.09 4.7UO.07 0.58+0.03
-- 2.74kO.06 1.10_+0.03 1.14+_0.13
-- 0.80f0.04
-- -- --
-- we
3.5kO.l 618.6kO.5
73.5kO.8 2.4&O. 1
0.15+_0.02 0.17zLo.05
Occidental SC 4s 4.3kO.3 206Ortr 50 co.09
14.8kO.l 13.1+0.2 2.tiO.l
12.1f0.2 56.3f0.3
3.4kO.l
8.2AzO.5 121.21.4
17.6kO.2 5.20.1 3.8rtO.l 2.lfO.O
0.7kO.O
147.6f1.6 102.6kO.7
1.6hO.l 17.4kO.2
181.1+3.2 1.1kO.l
2.HO.2 0.3kO.l 7.3kO.3

Table 9 (Continued)
Company Well ID 226Ra 222Rn 2*oPb 2lOPO
dpm/L (pCi/U dpm/L dpm/L
IMC (P-21) MW 11 IMC (P-21) MW 12 IMC (P-21) MW 16 IMC (P-21) MW 17 IMC (P-21) MW 18 Cargill MW 1 Cargill MW3 Cargill MW 8
IMC (P-21) IMC (P-21) IMC (P-21) Farmland Farmland
MW 12 MW 16 MW 17 MW2 MW5
IMC (P-21) IMC (P-21) IMC (P-21) IMC (P-21)
MW 11 MW 12 MW 16 MW 17
IMC (P-21) IMC (P-21) IMC (P-21)
MW 11 MW 12 MW 16
IMC (P-21) IMC (P-21) AgriCo
MW 11 MW 12 MW8
Jun. 3-4,1992
co.03 10900+ 490 ll.lfO.l 58000+ 900 27.4&l .2 203OOrt 170
3.7kO.l 12400f 280 1.1+0.0 3280+ 160 0.3kO.O 930+ 60 3.0fO.l 608Ok 40 0.3kO.O 4oort 30
Nov. 7-8 , 1991
19.9k2.5 67490+ 650 32.9k4.1 21860+ 240
6.5kO.l 13050+ 200 2.OkO.4 5030+ 200 4.6kO.5 5840f 100
Feb. 3,1992
2.OkO.2 10530+ 220 13.kkO.6 69600+1320 12.15kO.59 22620+ 300
2.1+0.1 13430f 180
Mar. 26,1992
4.5kO.2 134805 300 13.9kO.3 67650+1120 23.7h0.4 21250+ 140
Jun. 16,1992
4.5kO.2 13360f 250 23.2kO.5 65320+1330
9.20.2 9210f 80
0.48kO.03 3.OkO.l 2.78rtO.20 139.4kl.O 2.16kO.04 27.6kO.2 2.07kO.04 144.5k1.2 0.28rtO.03 0.5kO.l
co.10 1.0+0.0 0.16kO.03 1.4fO.l 0.66+0.08 3.7k0.2
-- -- -- -- --
-- -- -- --
-- -- --
-- -- --
145.6 k1.3 19.0 kO.1
12.3f0.3 6.4fO.l
6.20.2 180.9f1.6
22.1kO.3 132.6kO.9
2.8kO.2 146.8kl.O
22.7k0.3
4.5fO.l 157.6kl.l
25.7k0.2

Table 9 (Continued)
Company Well ID 226Ra dpm/L
222Rn (pCi/L)
*loI’b dpm/L
Sept.291992
IMC (P-21) MW 11 7.6kO.3 14990+ 930 -- 7.9+0.1 IMC (P-21) MW 12 30.3f0.5 65760+ 230 -- 156.6+2.2 IMC (P-21) MW 16 31.3kO.6 21840+ 320 -- 17.6+0.2

term” and other variations. It is unlikely that there is any significant input of 222Rninto the groundwaters directly from the gypsum stacks since there is no meaningfulrelationship between components that are thought to be derived from thephosphogypsum, as radium, with the radon contents. Most likely the wells withhigh radon activities are simply responding to the presence of naturally elevateduranium decay-series isotopes in the underlying phosphate rock. Although some ofthe radon concentrations are high, none of the values encountered are outside therange we have encountered earlier during investigations of undevelopedmineralized land in Florida (Burnett et al., 1991). Some of the 226Ra values are highenough, however, to be considered outside of the range normally expected forshallow groundwater, even in mineralized areas.
The highest radium values encountered are in some of the wells around the P-21 stack, MW 6 at Farmland, and in two wells (SW 2 and 3) at CF Industries-Bartow.The P-21 stack is not considered typical, however, of the other gypsum stacks inFlorida. As the oldest stack, it is severely cracked and does not have animpermeable barrier field placed between the stack and the substrate to preventmigration of contaminated groundwater. The way the mining was carried out inthis area, however, left a matrix of impermeable material which functions as anaquitard and constrains most contamination from the stack from percolatingdirectly into the surficial aquifer. The CF Bartow wells that display high 226Ra alsohave the highest activities of 21oPb and 21oPo of all wells sampled in this study. Thisis undoubtedly related to the unusually high acidity present in these wells duringthe period when the samples were collected. The extremely low pH valuesmeasured in these groundwaters (1.57 and 2.04 - see Table 8) are also atypical, evenfor groundwaters associated with gypsum stacks, and apparently resulted fromcontamination of these wells from the nearby cooling ponds.
Fractionation of Radionuclides to Raw Phosphoric Acid
Guimond and Windham (1975), May and Sweeney (1982), and Guimond (1990)presented limited data on Th in phosphoric acid and in phosphogypsum. The twoanalyses of Th in Florida phosphate rock and phosphoric acid presented the firstevidence that most of the Th as well as the U may fractionate to the phosphoric acid.Activities of 23oTh and 232Th (232Th is very minor in phosphate ores) in 17 Floridaphosphogypsum samples and 11 ore rocks and the approximate percentage of 230Thin the phosphogypsum are given in Tables 5 and 6. These data provideunambiguous evidence that only about 25% of the 23oTh reports to thephosphogypsum. This is surprising in light of the extremely surface reactive natureof this element. Gascoyne (1989) mentions the kinetics of Th sorption is so rapidthat Th produced by decay of U in natural systems is immediately hydrolyzed andsorbed by the nearest solid. This explains concentrations of <1x10-12 mg/L for Th innatural solutions and seawater (Kaufman, 1969), but processing solutions at gypsumstacks are not natural by any description and commonly have pH values less than 2and very high ionic strengths. No Th analyses have been reported for
1-22

processing/cooling waters in these systems, but Th is likely bound to particulatesupon release from lattice sites and is probably transported on very fine-grainedphases during the preliminary filtering rather than as dissolved species inphosphoric acid.
The (230Th/2%J) activity ratios in ore rocks and ore slurries in Table 5 average0.99 and are greater than 0.96 in all but one sample confirming that beneficiation ofores and slurrying ore rocks does not appreciably alter these activity ratios. Thesame activity ratios in corresponding phosphogypsums are variable and can bemuch greater than 1, but are generally close to unity, even though a majority of This apparently fractionated to the acid. Some 23oTh is undoubtedly included in theless soluble or unreacted fraction of the ore rock and may be sorbed preferentiallyonto clays, but it is not clear what proportions of the nuclides are in lattice sites inresistate minerals, co-precipitated in discrete mineral phases, or are sorbed on fine-grained phases in phosphogypsum. Figure 1-10, which is a plot of (2?Th/2%)versus (23%/238U) for the 17 phosphogypsum samples and replicates listed in Table5, shows a cluster of samples near unity on both axes which represents secularequilibrium of 2%J, 2%J, and 23@lh. Another group of phosphogypsum sampleshave (2%/2%J) near 1, but plot below the first group of samples implying loss of23oTh or preferential incorporation of 2% by some phosphogypsum. The foursamples in Figure 1-10 that plot far above the equiline with (234U/2%J) muchgreater than 1 contain significantly more 23oTh and excess 2aU. These nuclides areprobably sorbed on clays, complexed with phosphate, and perhaps on organicmaterial in the case of 234U. Most phosphogypsum samples we have analyzed seemto have near equilibrium values of (2xTh/2%J) as well as (23@Ih/2%). Activitiesof 234Th for “fresh” phosphogypsum did not change appreciably when the selectedsamples were re-analyzed six or more months after the first measurementindicating there was no appreciable excess 2MTh.
CONCLUSIONS AND RECOMMENDATIONS
The technique we have developed for determining 238U activities in bulksamples by measuring 234Th via y-ray spectrometry and applying an attenuationcorrection factor that can be further related directly to packing density has proved tobe very successful. Activities of 238U in 29 samples of phosphogypsum and ore rocksanalyzed using both gamma and alpha spectrometry compare exceptionally well.
Florida phosphate ore rocks analyzed in this study have 2% activities whichrange from ~50 - 120 dpm/g for central and southern Florida ores and ~15 to 60dpm/g for a limited number of ore samples from northern Florida. Activities of238T.J decay products are comparable to the uranium activity in ores from eachregion. These results confirm that the various members of 2% decay chain,
1-23

Fig. 1-10 Plot of activity ratios (23@h/ 23*U) versus (2WJPW) for 17 samples ofphosphogypsum. Replicate analyses have been produced and areplotted for most samples. Error bars are smaller than plotting symbols.

including 23*U, 23@Th, 226Ra, 2?Pb, and 210Po, are in approximate radioactiveequilibrium in Florida phosphate ores.
During acidulation of Florida phosphate ores, the great majority of 226Ra,typically 90 - 100%, is fractionated to the phosphogypsum and virtually all andoccasionally excess amounts of 21oPb and 21oPo are present in fresh phosphogypsum.In most cases the activities of 226Ra, 21oPb and, to a lessor extent, 210Po inphosphogypsum are directly and predictably proportional to the activities in theinput phosphate rock, indicating that the extent of incorporation of these nuclidesinto the phosphogypsum is primarily controlled by the amount supplied by the orerock. Since the activities of 21?Pb and 21oPo are comparable to 226Ra, even for themajority of fresh phosphogypsum samples, the predominant source of thesenuclides is the phosphate rock and not due to ingrowth of decay products duringstorage. The partitioning of 230Th and 23*U between ore rocks and phosphogypsumis more variable. The dissolved uranium is incorporated in the acid phase;however, up to 50 - 60% of U may fractionate to the phosphogypsum andemphasizes that the redistribution of 23*U and 230Th during acidulation ofphosphate rock is controlled by a number of factors. The 2BU activities of Floridaphosphogypsums shows no significant correlation to the 23*U in the ore rock andmay simply be related to the extent of unreacted ore, oversaturation and re-precipitation of calcium fluorapatite in production processes, and sorption and co-precipitation of U with complex Fe phosphates, fluorosilicates, and other phases.
Radionuclides in portions of some Florida phosphogypsum stacks haveapparently been mobilized during storage. A few phosphogypsum samples thathave been on stacks two or more years have (210Pb/226Ra) less than 0.85 so 226Ramust have been added to the sample or 21oPb lost and vice versa when (21oPb/226Ra)is greater than 1.1. Activity ratios of (21oPb/226Ra) less than 0.85 in about 10% ofolder samples could result from either or a combination of the processes describedabove or by Pb loss from the sample during storage. Ra is believed to be relativelyimmobile on the unsaturated, aerobic portions of gypsum stacks in comparison to21o’l?b. Isotopic ratios clearly indicate that at least two samples of “mature”phosphogypsum lost Pb during storage. The opposite process seems to be true for afew older phosphogypsum samples. The (21qb/226Ra) and (21oI?o/21()Pb) ratios inthese samples indicate that 2?Pb had been added to the samples from solutionspercolating through the gypsum stacks sometime during the two years precedingcollection. The processes of Pb leaching, mobilization, and resorption/ precipitationseem to be responsible for most observed (21oI?b/21oPo) disequilibrium. Thisinterpretation is consistent with some of our groundwater data which showoccasionally very high 21oPb and high (210I?b/210Po) activity ratios. We conclude that21opb may be remobilized preferentially to 21oPo at surface conditions on gypsumstacks and a net loss of Pb from the stacks by leaching would thus enrich theassociated groundwater with 21oPb. Activities of 21oPo and 21?Pb in process waters
1-24

which is being used to slurry fresh phosphogypsum should be measured beforeattributing any one process or series of processes as responsible for 21?Po and/or21oPb fractionation in fresh phosphogypsum.
There is a wide range of pH, electrical conductivity, and sulfide concentrationsin surficial groundwaters collected from monitor wells waters adjacent tophosphogypsum stacks in Florida. There are also appreciable variations in theactivities of radioelements in these well waters. Some of the radon concentrationsare relatively high, but none of the values encountered in this study are outside therange encountered during earlier investigations of undeveloped mineralized landin Florida (Burnett et al., 1991). Some of the 226Ra values are high enough,however, to be considered outside of the range normally expected for groundwatersin the surficial aquifer systems in this region. The highest radium valuesencountered so far are adjacent to stacks that do not have an impermeable barrierplaced between the stack and the substrate to prevent migration of contaminatedgroundwater and in wells with water pH less than 2. Wells waters that display high226Ra also have the highest activities of 21oPb and 21oPo as well as the lowest pHvalues.
The activities of %Pb, 226Ra, and 22*Ra (22*Ac) in residues from filter screensused to separate phosphoric acid in an phosphoric acid facility in central Floridacontained elevated activities of 226Ra, 21Qb, and ?F’o. Barite was positivelyidentified by XRD in a very small sample of scale from the filter screen and thisleached scale has the highest specific activity of 226Ra measured during study(>35,000 dpm/g). Although a radiobarite type of phase does apparently exist on thesetypes of screens, barite has yet to be identified in phosphogypsum by XRD and SEMprocedures. Further studies intended to delineate the actual sites of radionuclides inphosphogypsum are presented in Chapter 2.
1-25

CHAPTER 2
DISTRIBUTION AND MOBILIZATION OF RADIONUCLIDES INFLORIDA PHOSPHOGYPSUM
INTRODUCTION
One of the major goals of the radiochemistry portion of this study was tocharacterize bulk samples of Florida phosphogypsum in order to provide a morecomprehensive data base of uranium-series nuclides in phosphogypsum than currentlyexists. These results, presented in Chapter 1 of this report, constitute the radiochemicalfoundation required to develop the second major line of the radiochemical research.This research, involves dissolution and leaching of bulk samples of well-characterizedFlorida phosphogypsum, identifying and assessing radionuclide re-mobilizationsduring leaching experiments, and developing techniques for isolating and concentratingspecific radionuclides from phosphogypsum matrices.
General Research Approach
We have attempted to determine the distribution of radionuclides within Floridaphosphogypsum by analyzing not only bulk samples for specific activities ofradionuclides, but also in different phosphogypsum fractions, separated by: (i) sizefractionation; (ii) sequential leaching of the solid phase material by various chemicalreagents; (iii) selective dissolution techniques; and (iv) total dissolution of the gypsumphase.
Chemical partitioning techniques (sequential leaching, selective, and totaldissolution approaches) have been used to concentrate insoluble residue fractions frombulk samples of phosphogypsum prior to radiochemical characterization of theinsoluble material. Partial dissolution techniques (both single dissolution and

sequential multiple dissolution approaches) have been used to concentrate the radiumfraction and other radionuclides from phosphogypsum. Total dissolution of thegypsum phase and separation of the water insoluble residues into density fractionsusing heavy liquid techniques has also been applied. Analyses of different size, density,and chemically-partitioned fractions, together with examination by X-ray diffraction(XRD), scanning electron microscopy (SEM) were used to identify probable mineral andchemical sites of radionuclides within the phosphogypsum. Solutions produced duringdissolution experiments were analyzed for specific activities of 226Ra to determine ifradium is mobilized during leaching and to provide additional information on howradium is bound within the phosphogypsum matrix.
Previous Work
The initial work on the location of radium in phosphogypsum was presented byMay and Sweeney (1982). They reported that most 22613, is present in the finest sizefraction although only 3 fractions were analyzed (<0.045 mm; 0.045-0.250 mm; and>0.250 mm) in their investigation. In a study of the 226Ra of agricultural gypsum,Lindeken and Coles (1978) reported that during the wet process phosphoric acidproduction, uranium follows the acid phase, probably as a uranyl sulfate (or phosphateaccording to Moisset and Lafarge, 1980), while radium coprecipitates with gypsum asRaSO4. No evidence was given in their work that radium actually forms a separatemineral phase. In fact, concentrations of Ra would have be 3 to 4 orders of magnitudehigher than the average concentration calculated from activities of 226Ra in Floridaphosphogypsum (Chapter 1 of this report) for RaSO4 to precipitate as a discrete phase(Langmuir and Riese, 1985; Upchurch et al., 1991). Therefore, one working hypothesisin our approach to this research is that radium could be incorporated in a (Ra,Ba,I?b)SO4 solid solution or “mixed” phase in the gypsum or is sorbed on crystal surfacesof the phosphogypsum matrix, or a combination of both.
Prior to this research only the French scientist, J. Moisset, had published findingson the actual site(s) in phosphogypsum that are occupied by radium as an integral partof an approach to find a way to remove radium from bulk samples. He proposed thatradium is probably located together with calcium, strontium, and barium sulfate insmall crystals of 4-8 µm in diameter (Moisset, 1988). However, a mineral phase withthis composition would be very unstable because the Gibbs free energy of the crystalwould be negative. Another population of even smaller (about 1 µm diameter) crystalsof unidentified composition were also tentatively identified as containing significantamounts of radium. However, Moisset’s results must be considered tentative becauseof the inability to directly detect radium via the secondary electron emission analyzerused in that study.
Moisset and Lafarge (1980) had earlier proposed a hydrocycloning treatmentprocess to remove radium from phosphogypsum. Unfortunately, this process provedto be unable to eliminate the radium located in the smallest-sized crystals (1 µm size)which apparently stick to the surfaces of the larger calcium sulfate crystal. Recently,
2-2

Moisset suggested a process which can be used to obtain purified phosphogypsum of abetter quality, free of radium and other non-soluble impurities (Moisset, 1990). In thisnew approach, raw phosphogypsum is calcined into hemihydrate to increase itssolubility and then dissolved in water with a water/phosphogypsum ratio greater than100 : 1. Radium and other impurities which are included in the less soluble, fine-grained fraction are left behind and then filtered off. The filtrate is a purified solution ofcalcium sulfate which can then be recrystallized into gypsum that is relatively free ofthe radium impurities. We have analyzed samples of "purified" phosphogypsum thatwere provided by J. Moisset and found the "purified" samples were also low in 210Pband 21oPo. However, this process may not be efficient on an industrial scale because ofthe expense of calcining large quantities of phosphogypsum.
Published research on the site(s) of radionuclides in phosphogypsum is otherwiselimited. There is some evidence that a portion of the 226Ra may be associated withradiobarite types of mineral phases on filter screens and pans in phosphoric acid plants.Activities of 226Ra (up to 220,000 dpm/g) are found in the small quantities of scaleassociated with the filter pan which separates gypsum from the phosphoric acid(Keaton, 1987; this study). Kraemer and Curwick (1991) reported fluxes of radiumisotopes both upstream and downstream of a phosphoric acid plant that wasdischarging phosphogypsum directly into the Mississippi River. They presented ratiosof adsorbed (on suspended sediment)/dissolved 226Ra at three sites downstream of thephosphogypsum discharge that were 1.04, 1.32, and 1.04. The ratio in the mixing zoneimmediately downstream of the discharge plume was only 0.19 which implies thatabout 80% of the z26Ra was in solution even though the concentration of suspendedsediments was higher at this point that at any other sampling locality. Recent work byRutherford et al., (in press) have addressed the mobilization of 226Ra asphosphogypsum is leached with deionized water and a strong correlation between Baand Ra was shown in residues and leachates. Conclusions drawn from this work arethat radium is associated with Ba and is likely coprecipitated with Ba in sulfate phases.Very small (a few microns in diameter) radium-enriched particles, also enriched in Pband Ba, have been identified in a sample of phosphogypsum using the X-ray diffractionunit at the State of Florida Institute of Phosphate Research (FIPR) (H. El-Shall and M.Bogan, pers. comm.).
jectives of the Research
The primary objectives of this research were to characterize how radium and otherradionuclides in phosphogypsum are sited and bound within the matrix of the by-product material. The first priority was to determine whether radionuclides aredistributed uniformly throughout phosphogypsum, if they are incorporated in aseparate mineral phase(s), or sorbed or exchanged on mineral surfaces in the matrix.Our reasoning rested on the assumption that locating the sites and bondingcharacteristics of radionuclides within phosphogypsum was a first step toward theultimate goal of developing techniques to remove the majority of radionuclides from
2-3

phosphogypsum. In this manner, a waste material could conceivably be transformedinto a useful product.
EXPERIMENTAL PROCEDURES
Procedures for analyzing the specific activities of radionuclides in bulk samples ofore rocks, phosphogypsum, solid residues, monitor well waters, and miscellaneoussamples such as filter screens were presented in Chapter 1 of this report and are notreiterated here. Analytical procedures for physical and chemical fractionation ofselected samples of phosphogypsum, preparing solid fractions for radiochemicalanalyses, analyzing solid fractions for chemical compositions, and procedures forpreparing supernatant solutions produced in leaching experiments for radiochemicalanalyzes are presented below.
Size Fractionation Studies
Selected bulk phosphogypsum samples have been physically disaggregated toanalyze radionuclide activities in the discrete size fractions to evaluate if theradioelement-rich component can be mechanically segregated into one or a few sizeclasses. Approximately 100 grams of vacuum dried sample was preweighed before dry-sieving. The sample was separated into standard size divisions by ultrasonictechniques through the following series of 1φ interval screens: >2,000 µm (-1φ); 1,000-2,000 µm (0φ); 500-1,000 µm (+1φ); 250-500 µm (+2φ); 125-250 µm (+3φ); 62.5-125 µm(+4φ); and <62.5 µm (+5φ). After size separation, all size fractions were weighed andsize distributions calculated. The sample loss during the dry-sieving and thedistribution of particle sizes were calculated by considering the weight of the individualsize fractions and the initial weight used for dry-sieving. Individual fractions were thendried, ground, and analyzed for radionuclides by γ-spectrometry.
Sequential Leaching Experiments
A series of sequential leaching solutions were used which had previously beenproved to be useful in the identification of the phases hosting radium in soil (Greemanet al., 1990). The solutions used in the sequence consisted of: (i) doubly deionizedwater, DDW; (ii) a 3% NaCl solution; (iii) 5% sodium hypochlorite or “bleach”, NaOCl;and (iv) a 0.25 M solution of the chelating agent Ethylenedinitrilo-tetraacetic aciddisodium salt, EDTA. Sequential leaching was carried out by using an accuratelyweighed, approximately 5.5 gram portion of each phosphogypsum sample (dried andground), divided into two 50 mL centrifuge tubes. Fifteen mL of reagent were added toeach tube, the sample was agitated in an ultrasound bath for 5 minutes, and then heatedin a hot water bath for another 5 minutes. After two cycles of agitation and heatingwere performed, the sample was centrifuged at 2500 rpm for 10 minutes. Two cycleswith each reagent and one with DDW were performed in every case. All threesupernatant solutions for each sequential step were then combined for 226Ra analysis by
2-4

the 222Rn emanation method. The solid residues were dried and ground for solid phaseradionuclide analysis by gamma spectrometry.
Selective Solubility Experiments
Phosphogypsum samples used for selective dissolution in EDTA were dried eitherin an air/desiccator at room temperature (dihydrate gypsum, DH) in a temperature-controlled oven at 55°C or 120° C (predominantly hemihydrate, HH), or in a furnace at600° C (anhydrite). Different temperatures were used so that mineralogical effects onsolubility and release of radium and other radionuclides could be evaluated. Samplepowders were mineralogically characterized by X-ray diffraction procedures. Allsamples were ground with a mortar and pestle, dried as described above, andthoroughly homogenized before dissolution. Accurately weighed portions ofapproximately 4.4 grams of homogenized samples were placed in either a 125 mL or 500mL Erlenmeyer bubbler flask for each run. The flask was then placed on an automaticshaker table, and samples were allowed to react with varying volumes of EDTA (thesevolumes ranged from 50-250 mL) for measured time intervals of 45 hours. Sampleswere allowed to settle, and then centrifuged at 2500 rpm for 10 minutes and decanted.The remaining residue was washed with 10 mL DDW two times, and the threesupernatant solutions were combined and transferred to an Erlenmeyer flask for radonemanation analysis. The residue was dried to constant weight and prepared forradiochemical analysis. Solubility calculations were based on the final weight of thedried residue normalized to the sample weight initially present. We determined thetime required for phosphogypsum dissolution in EDTA by setting up a similarexperiment with replicate samples run for different time periods. Approximately 2.2grams of dried, ground, and accurately weighed sample was used for each replicate,and samples were allowed to react with 25 mL EDTA for times varying from about 0.5 -1,500 minutes.
Other experiments were conducted using DDW and dilute HCl solutions undersimilar conditions. Both calcium sulfate dihydrate (CaS04.2H20) and calcium sulfatehemihydrate (CaS04*1/2H20) are produced in the phosphoric acid manufacturingprocess. DH is by far the predominant by-product produced and stored in Florida.Samples of both air-dried DH and HH dried at 160°C were used in these experiments.In order to assess possible binding of radionuclides by organic matter (this has beenshown by Greeman et al., 1990, as being important for radium in soils), experimentswere conducted with and without addition of 30% Hz02 (Schmiermund, 1977). For theHz02 pre-treated experiments, about 4.5 grams of sample was put in a 50 mL centrifugetube and 25 mL of hydrogen peroxide was added, stirred and left overnight. The nextday, the tube was heated in the water bath until effervescence ceased (about 1 hour).The tube contents were then washed into an empty 3.5-liter Winchester bottle. Thevolume was brought up to two liters with water or dilute HCl and the bottle wasperiodically shaken until the undissolved residue appeared to be a constant amount(this required about 5 hours). The bottle then stood overnight and the supernatantdecanted, with the last few hundred milliliters being centrifuged or filtered through a
2-5

47-mm diameter 0.45µm membrane filter. The solid residue was dried, weighed, andprepared for radiochemical analysis. The procedure for experiments without Hz02pretreatment was essentially the same but the sample was added directly to theWinchester bottle with the reagent.
Radium Adsorption Experiments
In each tracer experiment, 2129 dpm of a NIST 226138 solution standard was addedbefore sample dissolution. About 4.4 grams of Gyp-6 (25°C) was then reacted withvarying volumes of EDTA (0.25M, pH=10). Samples were allowed to react with EDTAfor 5 hours, and then the leaching solution was separated by centrifugation, and radiumwas determined by the radon emanation method. The adsorption experiment wasrepeated with the same EDTA volume (50 mL) but different pH levels. A blankexperiment (no gypsum added) was also performed to test for radium recovery whenno adsorption onto gypsum was possible. The residues from these experiments werethen analyzed by XRD to determine if any undissolved or DH or HH remained or wasreprecipitated.
Radium sorption in DDW solutions were also conducted for replicate samples ofGyp-6 (DH) and Gyp-6 (HH). Two liters of DDW, 1 mL of NIST 226Ra tracer (2129dpm/mL), and 0.5 mL 2.5N NaOH were added to 3.5-liter Winchester bottles. Thebottles were shaken for about one minute and allowed to stand for one hour or so. Anaccurately weighed sample was added, and the pH was adjusted to 6-7 with 2.5N NaOH.The bottle was then placed on the shaker table for 5 hours and allowed to settleovernight. The supernatant was siphoned and centrifuged, and finally filtered through47-mm WhatmanTM and 0.10 µm pore size polypropylene filters. The filtered solutionswere retained in 4-L bottles for analyses of 22613, by radon emanation. In order to obtain100% dissolution, one extra liter of DDW was added to dissolve any remainingCaSO4*nH2O for the first 4 experiments. The decanted and centrifuged solutions werefiltered as before and added to the same collection bottles for determination of 226Ratracer recoveries by radon emanation. The residue was then dried in a oven at about40°C, and prepared for radiochemical and XRD analysis.
Water Insoluble Residues and Supernatant Solutions
"R" Series Dissolution Experiments
The first large quantities of insoluble residues of phosphogypsum samples Gyp-2,Gyp-9, Gyp DL3, and Gyp-46 were produced by dissolving fifty grams of air-dried,homogenized samples in 18 L of DDW in an acid-cleaned 22-L glass bottle. Each 22-Lbottle was immediately placed on a custom-built drum rotator and kept turning for twoor more days. This set of dissolution experiments is referred to as the “R” dissolutionseries. Although dilute sodium salt solutions are known to increase the solubility ofgypsum (Nakayama, 1971), Na salts were not added to these solutions because someresidues were to be analyzed for chemical compositions. After two or more days the 22-
2-6

L bottle was removed from the drum rotator and the solid particulate matter wasallowed to settle for at least three days to allow the extremely fine-grained material inthe suspended load to settle.
The supernatant solution was then siphoned off and discarded. At least 3 L ofsolution was left above the residue during each dissolution cycle to minimizedisturbance of the very fine-grained residue at the solid-liquid interface during thesiphoning process. Another 50 g of phosphogypsum was then added to the bottle,about 15 L of DDW were added to make up the total volume to 18.0 L and the entireprocess was repeated until at least 400 g of bulk sample had been added to each bottle.The process was then repeated with two 18 L rinses of deionized water and one 18 Lrinse of doubly deionized water in each bottle without adding phosphogypsum toassure that very little, if any, CaSOq.nH20 remained in the solid residues. Five 22-Lbottles were used to produce insoluble residues RES 1 to RES 5 in the Gyp-46 “R” series.All of the residues were analyzed by X-ray diffraction (XRD) which confirmed thatalmost all CaSOg2H20 had been dissolved in these samples. Three 2-L aliquots of thesupernatant solutions were siphoned from the 22-L bottles, filtered to 0.22 µm andtransferred to acid-cleaned 4-L-bottles for Rn emanation analyses. Three 2-L unfilteredaliquots were similarly processed. Analyzes for 226Ra in solution were performed usingthe Rn emanation technique.
"RAS" Series Dissolution Experiment
A 50 g sample of air-dried, homogenized Gyp-46 was added to 18.0 L of DDW inan acid-cleaned 22-L bottle. The bottle was rotated on the drum rotator for 3 days andwas then allowed to stand undisturbed for 9 days. Four filtered and 3 unfiltered 2 Laliquots of the supernatant solution were carefully removed from about 10 cm abovethe sediment-solution interface using a peristaltic pump. Filtered solutions werepumped through either a 0.22 µm or 0.45 µm filter in an in-line filter holder into an acid-cleaned graduated cylinder and then decanted into acid-cleaned 4 L-bottles for analysesof 226Ra in solution by Rn emanation. This dissolution experiment is referred to as the"RAS" dissolution.
“D” Series Dissolution Experiments
A variant of the "RAS" series dissolution process was used to dissolve the watersoluble fractions of additional lots of homogenized samples of Gyp-46, Gyp DL3, andGyp-6. About 25 g of dry and homogenized phosphogypsum was added to 18-L ofDDW in a glass bottle that was sealed and then kept rotating constantly for severaldays. Six water insoluble residues of Gyp-46, 5 samples of residues of Gyp DL3, and 3insoluble residues of Gyp-6 were produced using this technique. After removing thebottle from the rotator, the residues were allowed to settle for a few minutes and thesupernatant solutions which contained virtually all of the finer-grained, suspendedmaterial (SM) was quickly transferred to a second acid-cleaned, 22-L glass bottle using aperistaltic pump. The solids that settled out in the first 22L bottle were rinsed twice
2-7

with DDW, the coarser-grained sediment allowed to settle for 2 or 3 minutes, and thesesolutions were combined with those in the bottle containing the SM. The granular,coarser-grained residues (called “Solids”) were then transferred to an acid cleaned, 500mL beaker and allowed to settle for one or two days or until the supernatant solutionwas clear and it was siphoned off and combined with the SM supernatant solution. The22-L bottles containing the SM samples were not moved or agitated for at least oneweek after rotation to allow the extremely fine-grained material to settle out of solution.One insoluble residue of each bulk. phosphogypsum sample in the “D” seriesdissolution experiments was not fractionated by grain size and the total insolubleresidue was dried and homogenized. Three filtered and unfiltered aliquots ofsupernatant solutions from each bottle were carefully pumped across 0.22 µm or 0.45µm filters in an in-line filter holder using a peristaltic pump into an acid-cleanedgraduated cylinder and then decanted into acid-cleaned 4-L bottles for analyses of 226Rain solution by Rn emanation. The 25-g samples dissolved in this way are referred to asthe "D" series dissolution experiments.
The water insoluble residues of “D” series dissolutions that were separated by thesuspension technique into two fractions, the coarser-grained sediments comprisedmostly of quartz sand (Solids) and suspended material (SM). These fractions wereprocessed separately. The two fractions were dried, homogenized, and prepared forradiochemical analyses. Selected samples were also prepared for compositional, XRD,SEM, and organic carbon analyses. Activities of radioactivities in the total residues andin the coarse- and fine-grained fractions were measured to determine whetherradioactivities and masses were balanced and internally consistent.
“SD” Series of Dissolution Experiments
The fourth dissolution process used smaller masses of about 2.8 g of homogenizedphosphogypsum samples which were dissolved in 2-L of DDW in 3.5-L Winchesterbottles. Winchester bottles were then agitated on a shaker table for 8 or more hours.The solutions were allowed to settle for several days and then the supernatant solutionswere filtered through 0.45 µm polypropylene filters. One liter of the supernatantsolutions were transferred to acid-cleaned, 4-L bottles for Rn emanation analyses. The1.0 L solutions in the Rn bottles were brought up to a total volume of 2.0 L by adding aliter of DDW and the solution pH was lowered to less than 2 by adding 15 to 20 mL ofnitric acid. These solutions were then prepared for radon emanation analyses fordetermining 22% in solution. These smaller dissolution experiments are referred to insubsequent sections as the “SD” series of dissolution experiments.
X-ray Diffraction
XRD patterns have been produced for bulk samples of phosphogypsum and manyleached residues and size fractions of residues. Samples were powered and analyzedvia a Philips vertical goniometer X-ray diffraction unit with a computerized APD 3520
2-8
Control Console and an XRG-2500 Generator at the Department of Geology at FloridaState University. Selected samples of solids on filters were analyzed by XRD at FIPRusing the automated peak search software and the FIPR and Tennessee ValleyAuthority XRD databases for phosphogypsum, phosphate rocks, and phosphatic clayphases.
Scanning Electron Microscopy/Energy Dispersive X-ray Analysis
We have utilized two SEM units, the JOEL 840A Scanning Electron Microscope(SEM) at the Institute for Materials Research and Technology at Florida State Universityand the JOEL 840 SEM in the Department of Biological Sciences at Florida StateUniversity. Both instruments are equipped with energy dispersive X-ray analyzers.Most samples were mounted on aluminum plugs and coated with graphite. Samplesfor imaging studies were mounted on aluminum discs and coated with a microlayer ofa gold/palladium alloy. Duplicate SEM mounts of phosphogypsum residues wereanalyzed for Ba, Sr, Pb, and S in the finest-grained, water insoluble residues of Gyp-2.Replicate samples of the finest-grained, water-insoluble, suspended material in Gyp-6Gyp DL3, and Gyp-46 were collected on 0.10 µm filters and mounted for analysis bySEM imagery and semiquantitative compositional analyses of the elements listed aboveby energy dispersive X-ray fluorescence (XRF).
Compositional Analyses
Chemical compositions of replicate samples of phosphogypsum, leachedphosphogypsum, and water insoluble residues of bulk phosphogypsum samples ofGyp DL3 and Gyp-46 were performed at the Earth Sciences Laboratory at theUniversity of Utah Research Institute in Salt Lake City. Cations were analyzed byinductively coupled mass spectrometry (ICP) and anion and complex ions analyzed bystandard techniques including titration, turbidity, and ion specific electrode methods.The samples designated FSU 1 to FSU 6 were produced by dissolving varyingproportion of the gypsum fraction of Gyp DL3. Samples RES 1-5 are the waterinsoluble residues produced during the “R” series of dissolutions of five bulk samplesof Gyp-46. Sample RES 6 is a replicate sample of RES 3. Samples RES 7, 8, and 9 are thewater insoluble residues of homogenized, bulk samples of Gyp DL3. Samples RES 8and RES 9 consist of the total water-insoluble residue and RES 7 represents the finest -grained fraction of the water insoluble residue of Gyp DL3 that was separated bycentrifugation. The compositional sample designated Gyp-46 is the anhydrouschemical composition of the homogenized bulk sample. Splits of each of these sampleswere also packed in plastic vials and analyzed for radionuclides by γ-spectrometry.Compositional analyses are listed in Appendix C.
Carbon in Residues and Dissolved Organic Carbon
Three replicate pairs of samples of the finest-grained insoluble residue whichremained suspended in supernatant solutions of Gyp-46 D3 were quantitatively
2-9
analyzed for total organic carbon (TOC) and nitrogen (N) on instrumentation in theBiology Department at Florida State University. Analyses of dissolved organic carbon(DOC) were analyzed in aliquots of supernatant solutions above insoluble residues of 8Florida phosphogypsum samples at the Marine Environmental Sciences ConsortiumLaboratory at Dauphin Island, Alabama.
PERALS Analysis of Ra-226 in Solution
Activities of 226Ra in solution were determined for a limited number of samples byPERALS (Photon Electron Rejecting Alpha Liquid Scintillation) spectrometry. PERALSspectrometry combines electronic pulse-shape discrimination (PSD) with theoptimization of the detector design and associated electronics for alpha pulses, and useof a liquid-liquid extractive scintillator. Transfer of the alpha-emitting nuclide to awater-immiscible scintillator of constant composition has eliminated many quenchingproblems and pulse shape discrimination lowers backgrounds by rejecting beta andgamma pulses with a 99.7+% efficiency. The extractant/ scintillator solution used formeasuring radium in solution in this study was RADEXTM which selectively extractsionic radium from solution. Although peak resolutions are not as good as withconventional surface barrier and ion implanted silicon detectors used in alphaspectrometry, energy resolution is substantially improved over standard LSCequipment. These improvements allow for energy resolutions that are generally lessthan 250 keV and a minimum limit of detection of less than 0.01 counts per minute(McDowell and McDowell, 1993).
Heavy Liquid Separations of Insoluble Residues
The major impediment to identifying phase(s) in water insoluble residues thatcontain radionuclides is that quartz and other common minerals comprise the greatmajority of the residue. If the radionuclide-bearing material can be separated from themajority of the quartz by mechanical means, the capability to identify the phase(s) bySEM or other techniques would be enhanced. Mixtures of heavy liquids have been usedto separate fractions of the water-insoluble residue of Gyp-46 by density to determinewhether a radionuclide-enriched fraction could be produced and the mineral phasesidentified by SEM. The heavy liquids bromoform and xylene were combined in varyingproportions to produce numerous liquids each having a discrete range of density. Oncea heavy liquid with the desired range of specific gravity was obtained, a homogenoussample of insoluble residue of known mass was wetted with a few drops of the liquid ina clean mortar and pestle. The remainder of the heavy liquid was added, the residuedispersed by stirring and slight grinding to a uniform consistency, and the mixturetransferred to a tared centrifuge tube. The residue and heavy liquid mixture in thecentrifuge tube were placed in an ultrasonic bath for about 30 seconds and thencentrifuged for 4 - 6 minutes. Solids within the density range of the solution remainsuspended in the heavy liquid while those with greater densities collect at the bottom ofthe tube.
2-10

The heavy liquid - solid supernatant mixtures were decanted into an extractiontube and filtered with a tared 0.22 µm pore-size polypropylene filters that are resistantto the chemical reagents. The solids in the centrifuge tube were returned to the mortarand pestle and the process repeated with the next density range solution. The taredfilters and solids were dried, the masses measured, and the solids carefully removedfrom the filters and the masses measured again. The solids removed from filters weretransferred to plastic vials and the activities of radionuclides measured in the well-typeIG y-ray detector after secular equilibrium had been attained. The solids that weredenser than the liquid used for that fraction were rinsed with acetone and thesupernatants were decanted into a holding beaker. The solid residues were dried, themass recorded, and the entire process was repeated for each density range of interest.
Theoretical Equilibrium Calculations (SOLVEQ - CHILLER)
Many multicomponent chemical equilibrium models have been developedutilizing software which employs chemical thermodynamic calculations to calculatephase equilibria and reaction paths in closed chemical systems. We used the models ofReed (Reed, 1982; Reed and Spycher, 1984) for calculating homogenous (SOLVEQ) andheterogeneous (CHILLER) chemical equilibria. These models have proven to be veryuseful for determining solubilities of mineral phases which could conceivably contain22613, for a number of solvents under a variety of physiochemical conditions. Theusefulness of phosphogypsum dissolution experiments was evaluated using thenumerical modeling technique before performing time consuming experiments.Chemical parameters were varied in the model to identify the most advantageousconditions for specific dissolution objectives.
RESULTS AND DISCUSSION
Size Fractionation
Results of dry-sieving were ambiguous with a minor trend of higher activities of226Ra in the in the fine-grained size classes (Table 2-1). Apparently, the dry sieving wasunable to completely disassociate aggregate grains. SEM imaging clearly demonstratedthat much of the material remaining on each screen size was composed of compositegrains of finer-sized particles. When the activities of radionuclides were displayed as afunction of size, the distribution of specific activities were relatively “flat”, i.e., there wasno systematic tendency for concentration of 226Ra or 21ol?b activities in any size class.Even after wet sieving, SEM images showed that much of the material remaining on thesmallest mesh screen (62.5 µm mesh size) was still composed of aggregate grains offiner-sized particles. These observations are consistent with those discussed by Moissetand Lafarge (1980) who attempted separating the radium-rich fraction fromphosphogypsum by hydrocycloning. The only conclusion that can be drawn from thesesize fractionation studies is that on a laboratory scale neither standard dry nor wetsieving techniques appear to be a viable approach for separating the radionuclide-rich
2-11

Table 2-l. Size distributions based on dry-sieving techniques together with radiochemical results for different size fractions from phospho- gypsum samples Gyp-4, Gypd/l, and Gyp-6 Errors reported for radiochemical results are la based on counting statistics.
Screen Diameter
(wd
Mass % **6Ra *Fl?b Fraction Mass dpm/g dpm/g
k) (Normalized)
Farmland (Gyp-4)
>2000 7.61 1000-2000 8.80 500-1000 6.11 250-500 14.97 125-250 22.91 62.5-125 26.59 ~62.5 Jd!La
total = 102.60 initial wt = 102.78
>2000 1.19 1000-2000 3.37 500-1000 5.18 250-500 10.61 125-250 21.84 62.5-125 27.30 ~62.5 29.30
total = 98.79 initial wt = 99.65
>2000 3.53 1000-2000 6.16 500-1000 11.28 250-500 26.11 125-250 26.37 62.5-125 22.73 ~62.5 ii.Qz total = 106.95 initial wt 107.34
7.42 77.9kO.8 8.58 89.6k0.9 5.95 89.3kO.9
14.59 71+2 22.33 61+2 25.91 64+2 15.23 70+2
100.00
IMC P-21 (GYP-~/~)
1.20 85k3 3.41 93+2 5.24 971?12
10.74 68+2 22.11 53+2 27.63 55fl 29.66 69k2
100.00
Royster (Gyp-6)
3.30 5.76
10.55 24.41 24.66 21.25 10.07
100.00
68fl 73+1 83+2 72k4 64k4 601t4 67rk4
66k6 57h4 86k4 99k4 6954 53f2 59k5
70+2 6Ok4 72+2 66k4 67&2 82k4 47fl 55k3 43+1 37k3 52+2 4Ok3 62rtl 46+2

fraction of these materials. However, it may be worth investigating more sophisticatedsieving techniques which utilize surfactants and/or ultrasonic vibration during theprocessing and filtering of the solids.
Sequential Leaching Experiments
The initial chemical fractionation experiments were series of sequential leachingsolutions that are progressively more vigorous and are “selective” for different fractions(Chao, 1984). The solutions and solid residues are then analyzed for elements ofinterest. In this way it is possible that an “operationally-defined” fraction may beidentified which contains the majority of the radionuclides. Unfortunately, none of thesolutions produced in the sequential leaching experiments of Gyp-6 and Gyp-5/1 hadelevated activities of 226Ra (Table 2-2). When the samples from the first experimentwere dried and reweighed at the end of the experiment, it was found that aradiochemically-depleted fraction of the phosphogypsum had been selectivelyremoved, i.e., several times more sample mass was removed by dissolution of thegypsum than the amount of radium liberated so 226Ra was effectively enriched in thesolid residue. However, the CaSOgnH20 had not been completely dissolved in theseexperiments. This may have an important effect on the interpretation of these results aswill be discussed in a later section.
Selective Solubility Experiments
Results of the selective solubility experiments of two phosphogypsum samples insolutions of 0.25 M EDTA are shown in Table 2-3. When the percentage of the samplethat is dissolved is plotted versus EDTA volume for an air-dried sample, the percentdissolved curve goes up rapidly at first as the EDTA volume increases, and then theslope becomes horizontal (Figure 2-1). Above this point, about 5% insoluble samplestill exists even though the EDTA is in excess at these higher volumes. This representsthe EDTA insoluble fraction of the gypsum, containing insoluble residues such as SiO2,clays, minor phases such as complex iron and aluminum phosphates, organic matter,etc. , and perhaps other sulfate mineral phases. Results of the dissolution timeexperiment (Figure 2-2) shows that phosphogypsum dissolves very quickly in EDTA.The solution quickly reaches a lower solubility condition in less than 1 minute and thenrises to the theoretical solubility (about 40 g/liter) after about one hour. However, thedissolution time curve showed an unexpected feature later in the experiment. After theinitial rise to a solubility plateau which persists for about 8 hours, the solubilitysuddenly decreased. A possible explanation for this phenomenon is that the solution issupersaturated with a relatively less soluble mineral phase(s) during this time periodbecause of the vigorous agitation on the shaker table, and the phase(s) precipitates aschemical equilibrium conditions are approached and the solution adjusts to the stable,lower level of solubility for radium in this system.
When 226Ra in solution (given as a percent of the total) is plotted versus the weightpercent of sample dissolved (Figure 2-3) it is clear that 226Ra does not enter solution
2-12
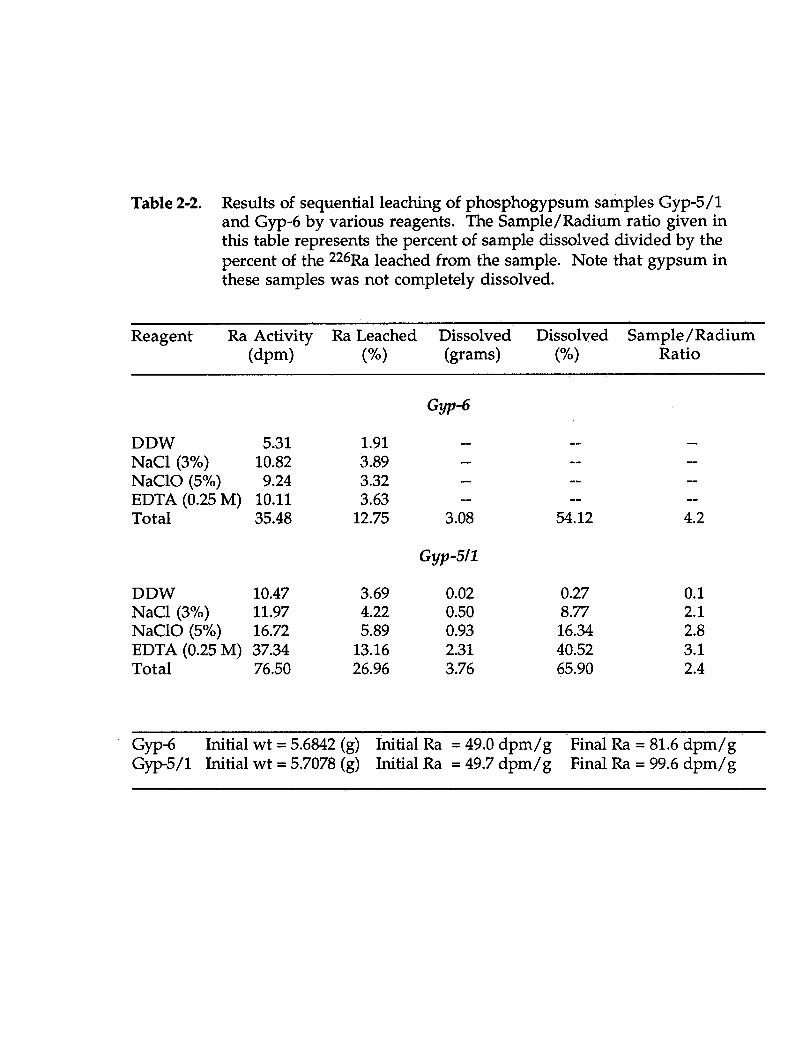
Table 2-2. Results of sequential leaching of phosphogypsum samples Gyp-5/l and Gyp-6 by various reagents. The Sample/Radium ratio given in this table represents the percent of sample dissolved divided by the percent of the **6Ra leached from the sample. Note that gypsum in these samples was not completely dissolved.
Reagent Ra Activity Ra Leached Dissolved Dissolved Sample/Radium (dpm) v-4 (grams) (“W Ratio
DDW 5.31 NaCl (3%) 10.82 NaClO (5%) 9.24 EDTA (0.25 M) 10.11 Total 35.48
DDW 10.47 NaCl (3%) 11.97 NaClO (5%) 16.72 EDTA (0.25 M) 37.34 Total 76.50
1.91 3.89 3.32 3.63
12.75
3.69 4.22 5.89
13.16 26.96
Gyp-6
--
--
-- --
3.08
Gyp-511
0.02 0.50 0.93 2.31 3.76
--
--
54.12
0.27 8.77 16.34 40.52 65.90
--
--
4.2
0.1 2.1 2.8 3.1 2.4
GYP-6 Initial wt = 5.6842 (g) Initial Ra = 49.0 dpm/g Final Ra = 81.6 dpm/g Gyp-5/l Initial wt = 5.7078 (g) Initial Ra = 49.7 dpm/g Final Ra = 99.6 dpm/g

Table 2-3. Results of selective leaching experiments of two phospho- gypsum samples of constant weight (Gyp-4 and Gyp-6) with varying amounts of 0.25 M EDTA after different drying temperatures and at different pH values.
EDTA (ml)
Solubility Dissolution EDTA-Ra EDTA-Ra (g/l) VW (dpm) rw
50 38.8 44.1 30.3 14.1 75 36.9 62.8 26.6 12.4 100 36.7 83.4 52.8 24.5 125 33.2 94.0 98.9 45.9 175 24.0 95.4 159.0 73.6 250 16.8 95.1 101.0 47.9
50 34.5 39.2 26.5 12.3 75 39.4 67.2 29.2 13.5 100 37.5 85.1 31.3 14.5 125 33.4 94.9 75.0 34.8
50 19.4 21.9 29.6 13.8 75 33.5 57.1 13.5 6.2 100 32.8 74.6 31.1 14.4 125 31.0 88.2 63.0 29.2
50 32.5 36.9 9.3 4.3 75 32.0 54.5 7.8 3.6 100 31.8 72.1 8.7 4.0 125 29.8 84.6 28.0 13.0
Gyp-6 (25“C, pH=lO)
Gyp-6 (55oC), pH=lO)
Gyp-6 (12oOC, pH=lO)
Gyp-6 (6OOoC, pH=lO)

Table 2-3 (Continued)
EDTA Solubility Dissolution EDTA-Ra EDTA-Ra (ml) (g/l) W) @pm) W)
50 43.2 49.0 17.6 6.0 75 42.4 72.2 26.1 8.9 100 37.9 85.9 49.6 17.0 125 30.8 87.4 161 55.2
Temx, Gyp-6 (50 ml EDTA, pH=6)
25“C 9.7 11.0 15.9 7.4 55oc 5.6 6.4 12.5 5.8 120% -* -* 9.4 4.4 6OOOC 16.3 18.5 16.3 7.6
Gyp-4 (25*C, pH=lOJ
* Sample gained mass, apparently by hydration.
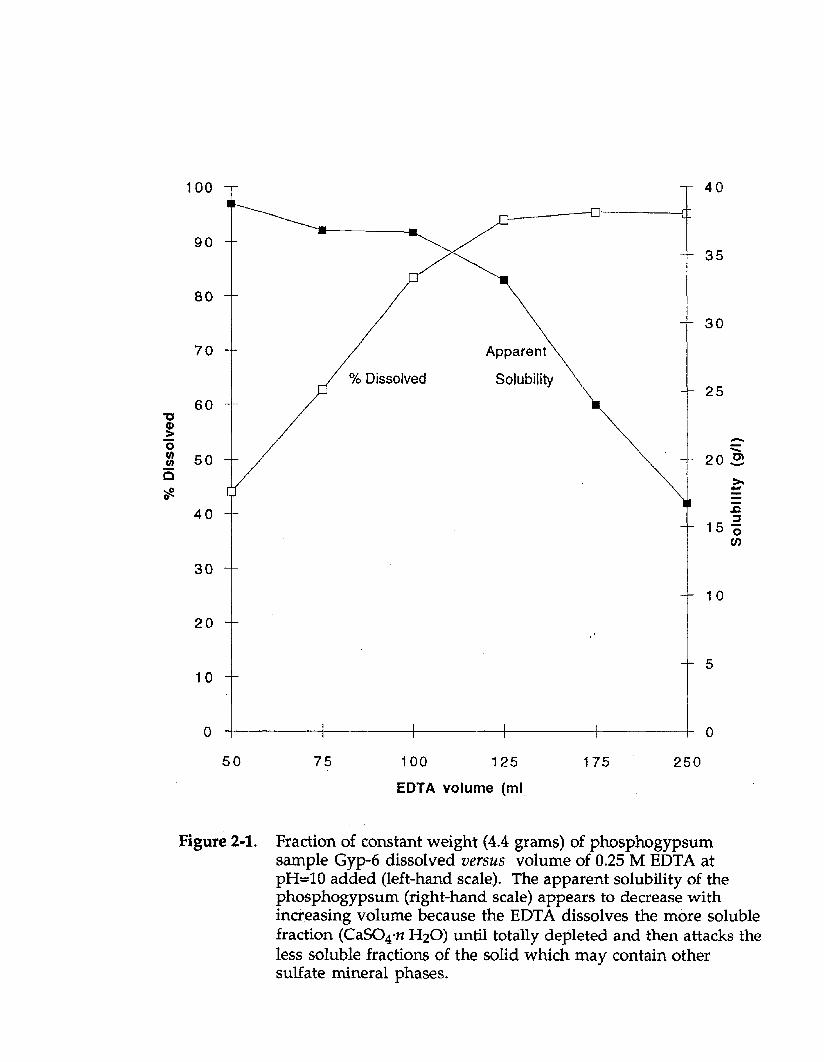
r-l
” 35
- 25
50 75 100 125
EDTA volume (ml’
175 250
Figure 2-l. Fraction of constant weight (4.4 grams) of phosphugypsum sample Gyp-6 dissolved ZWTSUS volume of 0.25 M EDTA at pH=lO added (left-hand scale). The apparent solubility of the phosphogypsum (right-hand scale) appears to decrease with increasing volume because the EDTA dissolves the more soluble fraction (CaSC@z H20) until totally depleted and then attacks the less soluble fractions of the solid which may contain other sulfate mineral phases.

30
E “normal” saturated state .-i-~---------..‘---------------------------------------
lower saturated state .--_-_____-------__----------------~--------------------. E
I I I I
0 300 600 900 1200 1500
Dissolution Time (mir
Figure 2-2. Solubility of phosphogypsum sample Gyp-4 versus time of dissolution. This curve shows that gypsum dissolves very quickly in EDTA. The solution reaches the theoretical saturated state within the first hour and returns to a lower apparent solubility after about 8 hours.

100
90
80
70
30
20
10
0
q Gyp-6 pH=lO II 0 Gyp-6 pH=6
l Gyp-4 pH=iO
1:l R&ypsum ,’ / m
/ /
/ /
/ /
/ /
/ /
/ /
+
n
8
/ /
/ / ’ m
ti ‘0 0
/
n m
I I I I I I I I I I I I I I I I
0 10 20 30 40 50 60 70 80 90 100
Percent Sample Dissolved
Figure 2-3. Percent 226Ra released into EDTA versus percent sample dissolved from phosphogypsum samples Gyp-6 at pH=lO (solid symbols) and Gyp-6 at pH=6 (open squares). The 1:l reference line shows where the data would plot if 226Ra was uniformly distributed as a lattice constituent of CaSOd.rr Hz0 and was released during dissolution without any subsequent adsorption.

congruently. If radium is an integral part of the CaSO4.nH20 matrix and no subsequentadsorption or reprecipitation of radium occurs during sample dissolution in EDTA, thedata points in this plot should plot along the 1:1 reference line. Instead, the data plotalong a flat trend at about 5% radium removal and then increase rapidly around the90% dissolution point. These results are quite significant and may be interpreted in twodifferent ways. First, EDTA may selectively dissolve low-radium or radium-freeCaSO4.nH20 and only begins to attack the radium-enriched fraction of thephosphogypsum when dissolution of CaSOKnH20 is complete. In this case thephase(s) containing radium must be less soluble than either the dihydrated (DH) orhemihydrated (HH) forms of CaS04enH20. Several other sulfates such as barite(BaSOq), celestite (SrQ), and anglesite (PbSO4) are less soluble than gypsum in mostreagents and radium has the least tendency of all alkaline earth metals to form complexions (Kirby et al ., 1964). The alternative explanation is that radium is released duringCaS04 dissolution in 0.25M EDTA and reprecipitates or immediately sorbs back ontoremaining surfaces until all CaSO4.nH20 is dissolved.
In contrast to the 226Ra results, plots of the percent 21oPb released versus percentsample dissolved (Figure 2-4) do fall along a 1:1 reference line, indicating that 21oPb isapparently released congruently during the dissolution of CaS04 by 0.25M EDTA.Thus, EDTA is effective in congruently dissolving the 21oPb rich fraction of the gypsumor Pb mineral phase. The divergent behavior of 226Ra and 21Ol?b may also be explainedin a few different ways: (1) 226Ra and 21oPb may exist in different phases; (2) the twonuclides have different tendencies to form EDTA complexes; or (3) they displaydifferent adsorptive behaviors during EDTA leaching.
Other solutions were also used to fractionate radium from phosphogypsum. Forexample, water and dilute HCl can completely dissolve CaS04.)2H20, although thesesolvents would require larger volumes because of reduced gypsum solubilities incomparison to EDTA. By comparing the various solubility and radium release results,the leaching reagent which is more efficient and cost effective in preferentiallyconcentrating radium and other radionuclides from phosphogypsum can bedetermined. If most of the radionuclides can be concentrated in the CaSOq*nH20-freefraction of the phosphogypsum which constitutes less than about 5-10% of the bulkmaterial, it should be substantially easier to identify the phase(s) which hosts thesenuclides. Results of leaching experiments using dilute HCl, dilute HCl and H202, andDDW solutions are summarized in Table 2-4. These results indicate thatphosphogypsum is more soluble in dilute HCl than in DDW, while DDW is moreefficient than dilute HCl in dissolving the radionuclide-depleted phases, i.e., the HClleaching experiments showed much higher release of 2*6Ra and 21ol?b than the waterleaching experimental results. Neither 226Ra nor 21ol?b were released in directproportion to CaS04.nH20 dissolution in DDW. Since these radionuclides aresignificantly enriched in the CaSO4
.nH2O-free residues (discussed in a following
2-13

100
90
80
70
30
20
10
0 /
= Gyp-6 pH=lO I------ q Gyp-6 pH=6
* Gyp-4 pH=lO
/ /
/ /
/
d /
/ /
/ /
/ /
I I I I I I I I I
:/ /
,% /
1:l Pb/gypsum *;;’
/ 8 /’ =
/ / l
/ /. n
/ / m
/
0 10 20 30 40 50 60 70 80 90 100
Percent Sample Dissolved
Figure 2-4. Percent *%‘b released into EDTA versus percent sample dissolved from two phosphogypsum samples, Gyp-4 and Gyp-6 at pH=lO (solid symbols) and Gyp-6 at pH=6 (open squares). The 1:l reference line shows where the data would plot if *loPb was congruently released during the dissolution of CaS04.n H20. This plot is based on radiochemical analysis of *lOl?b in the residues remaining after leaching.
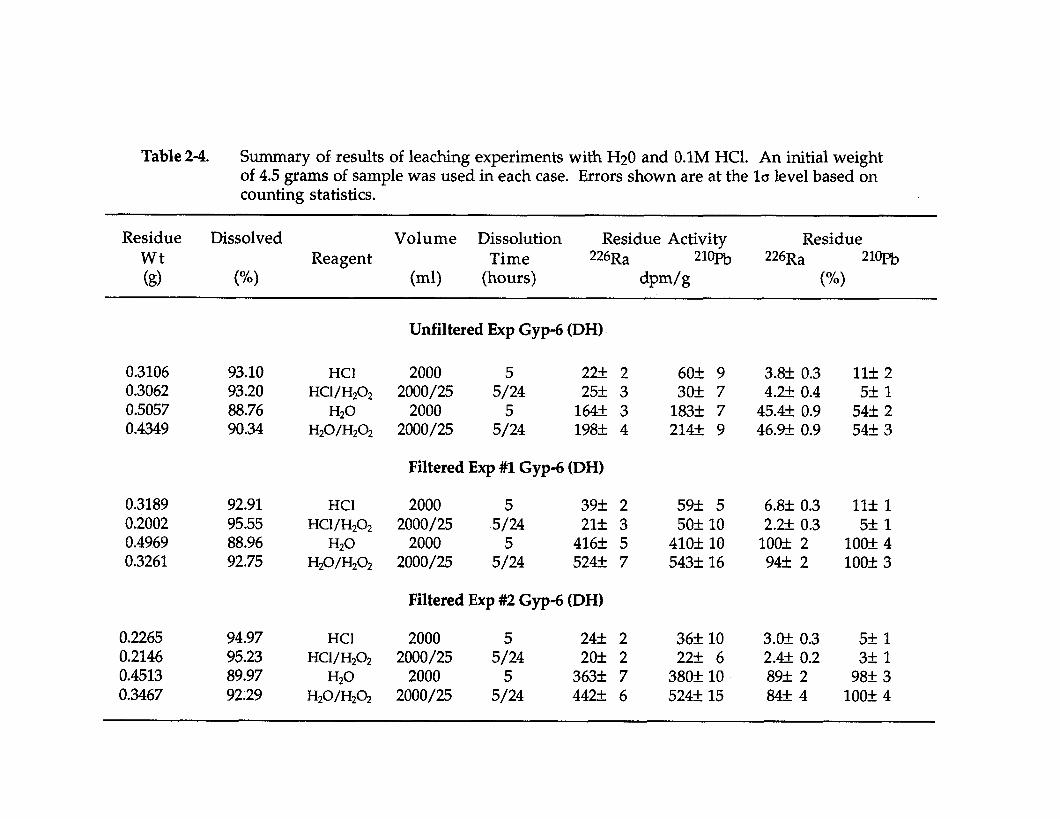
Table 2-4. Summary of results of leaching experiments with Hz0 and O.lM HCl. An initial weight of 4.5 grams of sample was used in each case. Errors shown are at the lo level based on counting statistics.
Residue Dissolved Volume Dissolution Residue Activity Residue wt Reagent Time 226Ra WPb 226Ra 2%l?b (g) 6) (ml) (hours) dpm/g w
0.3106 93.10 HCI 2000 5 22+ 2 0.3062 93.20 HCl/H202 2000/25 5/24 25k 3 0.5057 88.76 Hz0 2000 5 164f 3 0.4349 90.34 &~/&4 2000/25 5/24 198k 4
0.3189 92.91 HCl 2000 5 39f 2 0.2002 95.55 HC1/H202 2000/25 5/24 21f 3 0.4969 88.96 Hz0 2000 5 416k 5 0.3261 92.75 HzO/HzQ 2000/25 5/24 524rt 7
0.2265 94.97 HCl 2000 5 24f 2 0.2146 95.23 HCl/H202 2000/25 5124 2Of 2 0.4513 89.97 Hz0 2000 5 363f 7 0.3467 92.29 &ObWz 2000/25 5/24 442+ 6
Unfiltered Exp Gyp-6 (DH)
Filtered Exp #l Gyp-6 (DH)
Filtered Exp #I2 Gyp-6 (DH)
60+ 9 30+ 7
183f 7 214If: 9
59+ 5 50+ 10
41Ok 10 543f 16
36+ 10 22+ 6
380f 10 524fi 15
3.8& 0.3 11+ 2 4.3+ 0.4 5rt 1
45-e 0.9 54+ 2 46% 0.9 54+ 3
6.8& 0.3 ilk 1 2.B 0.3 5+ 1
lOof 2 lOOk 4 9& 2 lOOk 3
3&k 0.3 5+ 1 2.& 0.2 3+ 1 8% 2 98f 3 84zk 4 lOOk 4

section), both 226Ra and *lol?b may exist, at least partially, in phosphogypsum as adiscrete phase(s) rather than substituting in the calcium sulfate lattice. However, re-adsorption of radionuclides by CaSOanH20 cannot be ruled out until this isindependently evaluated (see next section).
Both **6Ra and *@l?b in samples of Gyp-6 are more soluble in dilute HCl solutionthan in DDW (Figures 2-5 to 2-7). Much of the **6Ra and *loPb may have beentransferred into solution as more soluble RaC12 and PbCl$- complexes. There is a clearfractionation between radium and lead, with lead being more enriched than radium ineach residue examined from the Hz0 leaching experiments. The fractionation between**6Ra and *lol?b implies that these two radionuclides either exist in phosphogypsum asdifferent phases or display different adsorption characteristics under the experimentalconditions. The enrichment factors of **6Ra and *lOl?b during leaching increased by 2 to3 times when the leaching solution was filtered rather than centrifuged to separateinsolubles for sample Gyp-6. Compare the unfiltered results (Figure 2-5) to the tworeplicates which were filtered (Figures 2-6 and 2-7). This indicates that suspended fineparticles which have high activities of **6Ra and *lol?b were lost during the unfilteredexperiments. Replicate experiments which included filtration for Gyp-6 (Figures 2-6and 2-7) show good agreement and is thought to be the more accurate representation ofthe behavior of **6Ra and z*ol?b when leached under these conditions. Once again,sorption of radionuclides by CaS04qnH20 cannot be ruled out in any of the leachingexperiments. In order to evaluate which processes control radium solubility in thesesystems the adsorption characteristics of radium onto phosphogypsum and insolubleresidues must be evaluated.
Radium Adsorption Experiments
The results of the previous experiments (Figure 2-3) imply that very little radium isreleased into solution until the majority of the DH or HH component ofphosphogypsum is completely dissolved. However, it is possible that radium isreleased and “reprecipitates” or immediately sorbs back onto remaining gypsumsurfaces (Moore and Scott, 1986). To test this possibility, we conducted a series of tracerexperiments. Tracer amounts of **6Ra were added to the leaching experiment and,assuming no reprecipitation or adsorption occurs, should be completely recovered atthe end of the experiment. The results of these adsorption experiments (Table 2-5)showed that undissolved gypsum adsorbed greater than 95% of tracer radium fromEDTA solutions when substantial quantities of DH remained, but dropped to less than10% adsorption when greater than 88% of the mass of the bulk phosphogypsum samplewas dissolved. At that level of dissolution (Exp. #5), virtually no CaS04. nH20remained as verified by XRD scans of the insoluble residue. Adsorption experiments atdifferent pH levels showed that the undissolved sample adsorbed more tracer radiumfrom acidic EDTA than in alkaline EDTA solutions.
2-14

Unfiltered Exp (Gyp-6)
0 .d
2 h
.z k- .w
3
10
8
6
m Ra-226 Ratio
Pb-210 Ratio
1.0 reference line 2
11-m1-1-B
HCI HWH202 H20 H20/H202
Reagent
Figure 2-5. Selective leaching results with various reagents for phosphogypsum sample Gyp-6. The enrichment or depletion of 226Ra, expressed as an activity ratio in the residue to that originally present is shown for each of the reagents tested by the black bars. The 21oPb enrichment/depletion is shown by the striped bars. Solutions were unfiltered in these experiments.

Filtered Exp #l (Gyp-61
8-
8-
n Ra-226 Ratio
Pb-210 Ratio
.O reference line
HCI H20/H202
Figure 2-6. Results from a replicate selective leaching experiment with various reagents for phosphogypsum sample Gyp-6. The enrichment or depletion of **6Ra, expressed as an activity ratio in the residue to that originally present is shown for each of the reagents tested by the black bars. The *@Pb enrichment/ depletion is shown by the striped bars. The experimental method was the same here as that shown in Figure 2-5 except that the leaching solutions were filtered in these experiments.

Filtered Exp #2 (Gyp-61
14
12 n Ra-226 Ratio
q Pb-210 Ratio
1.0 reference line
HCI Y
HCXH202 Ii20 H20/H202
Reagent
Figure 2-7. Results from a second replicate selective leaching experiment with various reagents for phosphogypsum sample Gyp-6. The enrichment or depletion of **6Ra, expressed as an activity ratio in the residue to that originally present is shown for each of the reagents tested by the black bars. The *loPb enrichment/depletion is shown by the striped bars. Solutions were again filtered in these experiments.

Table 2-5. Radium adsorption experiment results for different mineral forms of Gyp-6 in 0.25M EDTA and DDW. A known amount (2129 dpm) of 226Ra tracer was added to evaluate adsorption. Each pair of results for the DDW experiments represent duplicate experiments. All errors shown are *la.
Exp. No. Sample Wt pH Volume Solution-Ra Dissolved Adsorbed-Ra
k) (ml) (dpm) VW (“/I
1 4.4070 10 2 4.4019 10 3 4.4012 10 4 4.4062 10 5 4.4021 10
6 4.4042 2 7 4.4009 6 8 4.4072 10 9 0 10
10a 4.4018 6 lob 4.4023 6
lla 4.1625 6 lib 4.1624 6
12a 8.3249 6 12b 8.3242 6
13a 4.4041 6 13b 4.4027 6
14a 4.1639 6 14b 4.1643 6
15a 8.3286 6 15b 8.3293 6
Gyp-6 (DH) in 0.25 M EDTA
25 47+ 3 50 61k 5 75 42f 4
100 32f 3 125 196Ok80
50 6rtl 50 7fl 50 63f5 50 2230+100
Gyp-6 (DH) in DDW
3000 189OBO 3000 204Ok20
2000 117ok30 2000 1220flO
2000 890+70 2000 960530
Gyp-6 (HH) in DDW
3000 154Ok40 3000 1610+_10
2000 970+10 2000 93otio
2000 800+60 2000 73ok20
25.0 97.8+ 0.1 51.4 97.1 z!I 0.2 76.8 98.0+ 0.2 86.6 98.5 f 0.1 88.2 8 +4
-* 99.7+_ 0.1 -* 99.6+ 0.1
46.8 97.1 rt 0.2 -** 0 +5
92.3 93.2
11 f2 4.1+ 0.7
92.1 45 +1 91.6 43.6+ 0.5
64.1 58 +3 64.5 55 21
89.8 27 +2 89.6 24.4+ 0.6
78.3 54.9+ 0.5 78.9 56 +l
64.9 62 +3 64.1 66 +1
* Sample gained weight, ** no gypsum added.

Radon emanation results of the DDW experiments clearly demonstrate that thereis a significant amount of **%a adsorption onto the residues while CaSOq.nH20 is stillpresent. The amount of radium adsorption was roughly proportional to theCaS04enH20 residue mass, and there appeared to be no significant difference inadsorption by DH versus HH when the sample residues were approximately equal(Figure 2-8). As in the case for the EDTA solution experiments, there was clearly asignificant decrease in adsorption when CaS04.nH20 had been completely removedfrom the phosphogypsum. Note that the fraction dissolved for the experiment with thelowest apparent adsorption (Table 2-5 #10b) was only about 1 percent higher than itscounterpart (#l0a) which showed a factor of two greater adsorption. This sharpdecrease in radium adsorption implies that solid CaSOq.nH20 is the primary phasewhich adsorbs radium with very little adsorption occurring on the insoluble residuesurfaces.
These experiments verify that the high activity of **%a observed in CaSOq.nH@-free insoluble residue fractions (Table 2-5) must be due to a portion of radium beinglocated in separate insoluble phase(s) rather than a result of adsorption of radiumreleased during dissolution of the CaSOenH20 phase. These results confirm that aradium-depleted fraction of the phosphogypsum is removed during leaching by bothEDTA and DDW. Since both **6Ra and *lol?b are enriched in water-insoluble solidresidues after leaching, even when CaSOq.nH20 has been completely removed, afraction of these nuclides must exist in relatively insoluable mineral phases in theresidue despite the fact that adsorption onto CaS04.nH20 surfaces is important. Thisconfirms that although adsorption of radium is likely to occur during leaching ofphosphogypsum if solid CaSOq.nH20 remains, adsorption of radium probably is notsignificant on the type of insoluble residue present in phosphogypsum. These resultsindicate that at least a significant portion of the radium exists in phosphogypsum aspart of a discrete phase rather than a lattice component in the CaSOgnH20 crystals orabsorbed onto calcium sulfate surfaces.
Leaching experiments of different subsamples of Gyp-6 in two mineral formsyielded some surprising results in terms of the apparent solubilities. Theoretically, HH isapproximately twice as soluble at 20°C in DDW than DH. However, the extent ofhemihydrate and dihydrate dissolution observed in experiments with DDW are thereverse of what was anticipated based on theory. Subsequent X-ray diffraction analysisof the leaching residues from these experiments showed that only experiment 10bapparently had no solid CaSOq.nH20 remaining. Quartz and apatite were the only twominerals present in the insoluble residue within the XRD detection limit. According tothe XRD results, at least some CaSO4.nH20 was still present in all other DDW leachingresidues. It is not clear why the apparent solubility of the DH form was greater than theHH. One possibility is that a hydration crust formed around some of the HH grainspreventing further dissolution.
2-15

100 1
90 -
80-
70-
60-
50-
40-
30-
20-
0 Dihydrate
l Hemihydrate
IO-
0 .
I' I. 1.1. I' l ' 1.
60 65 70 75 80 85 90 95100
Sample Dissolved (%)
Figure 2-8. Radium adsorption experiment results for the dissolution of two crystalline forms of Gyp-6 in DDW. The proportional decrease in radium adsorption with the amount of undissolved CaS04.n Hz0 implies that CaSO4.n Hz0 is the primary phase which adsorbs radium. Very little adsorption onto the insoluble residue is indicated.

Activities of Ra-226 in Supernatant Solutions
Activities of Ra-226 in Solutions Analyzed by Radon Emanation
R-Series Experiments
The objective of the initial large-lot dissolution experiments was to produce largequantities of residues. Only the final DDW rinses of water-insoluble residues of bulksamples used to produce insoluble residues in the initial dissolution experiments ofGyp-2, Gyp-4, Gyp-9, Gyp DL3, and Gyp-46 in the “R” dissolution series were retainedfor analyses of **6Ra in solution. Based upon one of multiple working hypotheses, theactivities of **6Ra in these solutions were expected to be low based upon preliminaryresults of chemical modeling of phosphogypsum dissolved in DDW and previous workon the site(s) occupied by radium in this matrix. Therefore, significant **6Ra insolution was not considered at that time. Approximately 100 L of DDW were used forthe dissolution and rinsing of residues of Gyp-9 and Gyp DL3 residues and >180 L usedfor dissolution and rinse of each of the Gyp-46 samples in the “R” series (Table 2-6).The only supernatant solutions that were filtered in “R” series samples were the finalrinses of the insoluble residue produced by dissolution of 200 g of Gyp DL3 andsamples of Gyp-46 in the “R” series.
It was observed that all the supernatant solutions produced by dissolving bulkphosphogypsum samples in DDW released appreciable portions of **6Ra to solutionwhen virtually all the CaS04.nH20 phase in bulk samples was dissolved. Activities of**%a were low in comparison with the activities of **6Ra in the residues of Gyp-2, Gyp-4, and Gyp DL3. However, only a small fraction of the final rinse solutions in the “R”series were retained and some radionuclides were undoubtedly discarded with thesupernatant solutions in these dissolution experiments. There seemed to be a weaktrend of higher **%a activities in the solutions when a greater mass of bulk sample wasdissolved in these initial large lot dissolution experiments. Gyp-46 solutions containedabout 65 dpm/L which were the highest activities of **6Ra in supernatant solutions atthat time and are about 3 times that of the **6Ra in the leachate of Gyp DL3. There waslittle or no difference between the activities of **6Ra in the filtered and unfiltered DDWrinse solutions of Gyp-46 residue (Table 2-6).
RAS-Series Experiments
Several additional dissolution experiments were conducted for Gyp-46 and allsupernatant solutions were retained. In order to test the reproducibility of analyses of**6Ra in solution, a 50 g sample of Gyp-46 was dissolved in 18.00 L of DDW. The 22-Lglass bottle which contained the residues and solution was not disturbed for 10 daysfollowing rotation and the supernatant solution contained no visible particulatematerial or turbidity at the end of this settling period. None of the fine-grained solids atthe solid-liquid interface in the 22-L bottle were visibly disturbed during collection of
2-16


these aliquots. All six aliquots were analyzed for **6Ra in solution and results are givenin Table 2-7. Activities of **6Ra in the unfiltered samples of Gyp-46 are similar to thosein rinse solutions of the initial dissolution experiments of Gyp-46 presented in Table 2-6even though the dissolution technique was significantly different.
The filtered samples have only slightly lower **6Ra activities than the unfilteredsamples (~7%) which implies that >90% of the ~65 dpm/L of **6Ra is in solution if the0.22µm filter is assumed to effectively remove all particulate material. If thisassumption and the additional assumption of solution homogeneity are both valid, 40%of all the **6Ra in the 50.00 g of Gyp-46 used in this dissolution experiment goes intosolution. The activity of **6Ra in RAS4F is somewhat higher, but this aliquot wasdrawn from the second dissolution in which the supernatant solution did not stand foras long prior to the collection of solutions for analysis. Activities of **6Ra were againmeasured for these solutions subsequent to removing crystalline material which hadprecipitated in the Rn vessels during repeated de-emanations. These crystallites wereremoved by filtration and determined by XRD to be gypsum (CaS04.2H20). Activitieswere usually less than 2 dpm/L after the gypsum precipitates were removed and thesolutions were again de-emanated and analyzed by Rn emanation (Table 2-7). The low**6Ra activities in solutions which contained very limited masses of gypsum crystallitesagain demonstrates the strong influence of gypsum to either adsorb or incorporateradium. Incorporation of the radium into the gypsum lattice is not likely based onprevious experiments and thermodynamic considerations.
D-Series Experiments
Experimental techniques for subsequent phosphogypsum dissolution experimentswere modified to enable detailed mass-activity-composition balances to be constructed(see Experimental Procedures section). These dissolution experiments (the “D-series” inTable 2-8) used bulk samples of phosphogypsum which have been well characterizedradiochemically and compositionally. Activities of **6Ra in solution were analyzed for3 filtered and 3 unfiltered aliquots of solutions produced by dissolving 25.0 g of Gyp-6,Gyp DL3, and Gyp-46 in 18.0-L of deionized water. Filtered samples were passedthrough 0.45 µm polypropylene filters and one sample of Gyp-46 was filtered with a0.10 µm filter. The mean activities of 3 aliquots from each filtered and unfilteredsolution produced for several dissolution lots of each phosphogypsum sample areshown in Figure 2-9 as is the percentage of the total **6Ra activities in each bulkphosphogypsum sample that went into solution. The “error bars” for each percentagegiven are lo of the mean values of **6Ra in solution. Filtered samples are slightly lowerin activity than the unfiltered samples (<7%) which implies that greater than 90% of the**6Ra is either in solution or is sorbed on colloidal material that have mean diametersless than 0.45 µm.
2-17

Table 2-7. Activities of 226Ra in 4 filtered (F) and 3 unfiltered (U) 2.0 L aliquots of the supernatant solution produced by dissolving 50.0 g of Gyp-46 in 18.0 L of DDW referred to as the “RAS” dissolution experiment. Activities of 2*6Ra in solution were measured by Rn emanation. Errors are given at the lo level based on counting statistics only. Solutions were reanalyzed after fine-grained gypsum that precipitated from solutions over a period of three months were removed by filtration.
Sample Name
Type of Filter
Activity of 22613, in Solution (dpm/L) Remarks
RASlF RASlF
PPt*
RASlU RASlU
PPt.
RAS2F RAS2F
PPt.
RAs2u RAs2u
PPt*
RAS3F RAS3F
PPt.
RAs3u RAs3u
PPt*
RAS4F
Gyp-46 - 50.00 g Dissolved in 18.00 L of Deionized Water
0.22pm Fiber 61.9H.9 0.45 pm Poly. 3.940.2 2nd Analysis
- ppt. removed
Unfiltered 0.45 pm Poly.
62.4kO.9 0.9+,0.1 2nd Analysis
- ppt. Removed
0.22pm Fiber 0.45 pm Poly.
57.91k0.9 1.6kO.2 2nd Analysis
- ppt. Removed
Unfiltered 0.45 pm Poly.
62.2kO.9 0.39+0.09 2*d Analysis
- ppt. Removed
0.22ym Fiber 0.45 pm Poly.
62.6kO.9 0.09kO.05 2nd Analysis
- ppt. Removed
Unfiltered 0.45 pm Poly.
60.8kO.9 0.17M.06 2nd Analysis
- ppt. Removed
0.22~ Fiber 71*1 No re-analysis

Table 2-8. Activities of 226Ra in supernatant solutions and percentages of 226Ra in the bulk samples that went into solution for “D” series dissolution experiments. All samples were prepared by dissolving 25 g of phosphogypsum in 18 L of DDW. All filtered (F) and unfiltered (U) aliquots were analyzed by Rn emanation, but not all unfiltered solutions were analyzed for each dissolution experiment. All 226Ra activities are the means of analyses of three 2 L aliquots removed from the 18 L solution. Errors are standard deviations of the activities in the three aquiluots given at the lo level.
Sample Name
Type of Filter
Activity of 226Ra in Solution (dpm/L)
% of 226Ra in Solution
Gyp-46 D2F O.lOym Poly. Gyp-46 D2 F 0.45pm Poly. Gyp-46 D2 U Unfiltered
Gyp-46 D3 F 0.45q Poly. Gyp-46 D3 U Unfiltered
Gyp-46 D4 F 0.45p.m Poly. Gyp-46 D4 U Unfiltered
Gyp-46 D7 F 0.45pm Poly.
GypDL3DlF GypDL3DlU
Gyp DL3 D2 F GypDL3D2U
GypDL3D3F GypDL3D3U
GypDL3D4F
GypDL3D5F
0.45tXrt Poly. Unfiltered
0.45pm Poly. Unfiltered
0.45pm Poly. Unfiltered
0.45pm Poly.
0.45pm Poly.
Gyp-46 D2F Gyp-46 D2U
0.45pm Poly. Unfiltered
Gyp-46 D3F Gyp-46 D3U
0.45@n Poly. Unfiltered
Gyp-46 47&2 48+2 52+2
51.5kO.8 53&3
60&3 58f2
71f8
Gyp-DL3 30&5 30&4
29+5 33+5
25&4 40+10
32f5
40+10
Gyp-6 27&5 30+10
31&3 33+6
63&3 64&3 69k3
69fl 71&4
80&4 78&3
9oklO
40+7 4OZ!Z5
39+7 44&7
33&5 5OHo
43+7
50&10
48k9 50&20
55&5 6oflO

100
75
50
25
0 6F 6U 46F 46U DL3F DL3U
Gypsum Sample Number
Figure 2-9. Plots of the percentages of 226Ra in solution in “D” series dissolution experiments. Data for both filtered (F) and unfiltered (U) solutions are shown. The percentages plotted are mean values of 226Ra in solution in 2 dissolutions of Gyp-6,4 dissolutions of Gyp-46, and 5 dissolutions of Gyp DL3. Error bars represent lo of the mean values. Activities of 226Ra in solution were measured by Rn emanation.

SD-Series Experiments
Several supernatant solutions of bulk phosphogypsum samples produced in theSD series of dissolution experiments were also analyzed for 226Ra in solution in thesame manner. These sample were collected from a number of gypsum stacks in Floridaand had been on the stacks for varying periods. The activity of 2*6Ra in solution forthese samples are graphically presented in Figure 2-10. Results from these SD solutionsclearly indicate that some Florida phosphogypsum samples release significantly more226Ra into solution when identical leaching procedures are used. Samples in Figure 2-10 are presented in generalized “age” brackets or times since the phosphogypsumsamples were placed on the stack. Analyses depicted in Figure 2-10 are averages ofthree or more Rn emanation analyses of each solution and error bars in this case reflectone standard deviation from the mean value of these analyses. There appears to be a 3-7% decrease in activity when the supernatant solutions are filtered to 0.45 µm and 226Ra,in solution decreased slightly, but not appreciably, in solutions filtered to 0.10 µm.
Although a significant portion of 226Ra in these samples is apparently in solutionas defined by the ability to pass through a 0.45 µm filter, radionuclide sorption ontocolloids cannot be ruled out. The obvious points are that an large proportion of 226Racan enter solution for some samples and the release of 226Ra does not seem to be anobvious function of age or sample locality. This suggests that a process other thanincorporation of 226Ra in highly insoluble phases controls the activities of 226Ra insolution when all the CaSOgnH20 is dissolved. As shown earlier, re-adsorption of226Ra onto CaSOq.nH20 surfaces is important when even minor quantities CaSOq.nH20were not dissolved or re-precipitated. Re-precipitation of gypsum (CaS04.2H20) didoccur in the “R” series when the solutions were de-emanated a number of times in Rnbottles. This was the main reason for dilution and acidification of supernatant solutionsin Rn bottles for the “SD” series of dissolution experiments.
PERALS Analyses of Ra-226 Activities in Solutions
Activities of 22613, were determined by PERALS spectrometry in selected aliquotsof supernatant solutions used for Rn emanation analyses. Two aliquots of the samesupernatant solution used for dissolutions of Gyp-46 were processed for PERALSanalyses. The solution was allowed to stand undisturbed for two days beforeperistaltically pumping one 3.00-L and another 2.00-L aliquot through an in-line 0.22µmfilter with the solution drawn 3-5 cm above the residue-solution interface. A thirdsample of a supernatant solution above a Gyp-46 residue for PERALS analysis was alsofiltered with a 0.22µm Millipore fiber filter, but was collected from the upper 10 cm ofthe solution in a 20-L vessel. Apparent activities of 226Ra in solution were less than 45%of those in same solutions of Gyp-46 which were processed identicallyprior to analysisby Rn emanation (Table 2-9). Radium was scavenged from these solutions with BaSO4precipitates as required for the PERALS analytical technique and extremely fine-grained, light reddish-brown solids were observed within the BaS04 precipitates.
2-18


Table 2-9. Activities of **6Ra in supernatant solutions above water- insoluble residues of Gyp-46 and Gyp-6. In these experiments activities of **6Ra have been measured by Rn emanation and by PERALS spectrometry. Solutions were either unfiltered, filtered with 0.22pm fiber filters, or filtered with 0.45~ polypropylene filters. Errors are given at the lo level based on counting statistics only.
Sample Type of Name Filter
Analytical Technique
Volume Activity of **6Ra in Analyzed Solution (dpm/L)
Gyp-46 - 50.00 g Dissolved in 18.00 L of Deionized Water
RASlF 0.22pm Fiber Rn Emanation 2.00 L 61.9kO.9
RAS2F 0.22pm Fiber Rn Emanation 2.00 L 57.%!zo.9
RAS3F 0.22~ Fiber Rn Emanation 2.00 L 62.6kO.9
RASlU Unfiltered Rn Emanation 2.00 L 62.4f0.9
RAs2u Unfiltered Rn Emanation 2.00 L 62.2kO.9
RAs2u Unfiltered Rn Emanation 2.00 L 64.0ko.9
RASlFP 0.22pm Fiber PERALS 3.00 L 26.0k0.2
RAS2FP 0.22pm Fiber PERALS 2.00 L 26.lfO.l
RAS3FP” 0.22pm Fiber PERALS 3.00 L 18.5k0.2
RAS4F” 0.22~ Fiber Rn Emanation 2.00 L 70.3rfo.9
Gyp-46 - 4.00 g Dissolved in 2.00 L of Deionized Watew
Gyp-46FX 0.45 pm Poly. Rn Emanation 1.87 L 0.92ko.09
Gyp-6 - lO.OOg dissolved in 14.00 L of Deionized Water RAS67FP 0.45p Poly. PERALS 2.00 L 0.65kO.01
RAS68FP 0.45pm Poly. PERALS 2.00 L 3.46IfrO.02
RAS6 9 U l? Unfiltered PERALS 2.00 L 0.59+0.01
RAS6 10 F P 0.45pm Poly. PERALS 1.52 L 0.71+0.03
* Second Dissolution

These fine-grained particles appeared identical in appearance to the finest-grainedmaterial observed in water-insoluble residues of phosphogypsum. Upon backextraction of the Ra into the extractant scintillation solution used in this technique, thesolution turned dark yellow which is indicative of organic material in theextractant/scintillator solution (J. McDowell, pers. comm.).
Additional PERALS analyses were performed for supernatant solutions aboveinsoluble residues of Gyp-6. Experimental procedures for the dissolution of Gyp-6 areidentical to those described above except only 0.45 µm polypropylene filters were usedin an in-line filter holder. None of the fine-grained material was observed in BaSO4precipitates except for an extremely minor amount in the RAS68FP sample which hadapproximately 6 times the 226Ra activity than the remaining three samples (Table 2-9).Activities of *26Ra in the other three samples of Gyp-6 supernatants analyzed byPERALS contain only ~0.3% of the total 226Ra activity added to the vessel in Gyp-6,assuming the solutions are homogenous. It is surprising that the unfiltered sample(RASP9U) contains the lowest activity, but none of what is believed to be organicmaterial was observed in the BaSO4 precipitate from that solution. Solution RAS610FPwas collected as the last liquid was drained from the 20 L vessel. The insoluble residuewas disturbed and dispersed throughout the solution when this sample was beingfiltered, but 226Ra activity in this solution was still <0.3% of that in the total Gyp-6added to the vessel.
Two lines of evidence point towards the presence of an amorphous or organicphase in the fine-grained material within the BaS04 precipitates produced for PERALSanalyses: (1) color changes due to the presence of what may be carbon being partiallyabsorbed by the toluene-based extractant portion of the scintillator; and (2) lower 226Raactivities calculated by PERALS spectrometry which may be partially due to thepresence of organic phases and incomplete extraction of Ra (only ionic Ra2+ will extract)and/or color quenching in the scintillator solution. The presence of organic material inthe finest-grained residues is also indicated by the amorphous nature of the majority offinest-grained water-insoluble residue analyzed by XRD. If these particles are in factthe same material present in the water-insoluble residues, which is likely, then the0.22µm filters are ineffective in filtering these particles.
Dissolved Organic Carbon in Supernatant Solutions
Dissolved organic carbon (DOC) was analyzed in three aliquots of supernatantsolutions above eight samples of DH and HH phosphogypsum . Aliquots of solutionsused for DOC were drawn from the same supernatant solutions analyzed for 22613, byradon emanation. DOC analyses are given in conjunction with average values of 226Rain solution in Table 2-10. There does not appear to be any obvious relationshipbetween the concentration of DOC and the activities of 226Ra solution of the sortexpected if 226Ra were sorbed on organic particles that pass through a 0.45 µm filter.
2-19

Table 2-10. Dissolved organic carbon (DOC) concentrations given in parts per million (ppm) and 226Ra activities in supernatant solutions above water insoluble residues of 8 bulk phosphogypsum samples. Supernatant solutions were produced by dissolving about 2.8 g of phosphogypsum in 2 L of DDW. Concentrations are means of 3 analyses of 10 mL aliquots. The activities of 226Ra in solution for each sample are means of 3 or more analyses of a 1 L aliquot of the same supernatant solution used for DOC analyses.
Sample Name
226Ra in Solution (dpm/L)
GYP7 9.93rto.09
Gyp 10 7.1OH.08
Gyp 21 3.85kO.05
GYP30 6.OH.l
Gyp 31 5.8rto.3
Gyp 37 5.5kO.5
GYPS 5.2kO.2
GYP= 6.0fO.4
10.3kO.3
23.8kO.4
102+;!
77&3
94Ifr4
56zI13
31.6f0.9
23.8&0.4

Insoluble Solid Residues of Bulk Phosphogypsum Samples
Water Insoluble Residues of Gyp-2, Gyp-9, and Gyp DL3
The initial reason for producing relatively large quantities of water-insolubleresidues of phosphogypsum was to have enough material to analyze splits for chemicalcompositions, radionuclide activities, to isolate and identify the material(s) whichcontain the radionuclides by SEM - XRF, XRD, have adequate amounts of residues forC - N analyses for organic material, and to have enough sample remaining for archivingpurposes. The first experiments for measuring the activities of radionuclides in waterinsoluble residues of phosphogypsum were designed with the objectives of isolatingand identifying the mineral phase(s) which contains 226Ra. Residues of Gyp-2 wereproduced first because at that time the bulk sample had the highest 226Ra activity of thesamples analyzed. Activities of 226Ra and 21oPb in bulk samples of Gyp-2 are -64.5dpm/g and -56.6 dpm/g, respectively, whereas activities of these nuclides in the finest-grained, water-insoluble residue are over 1700 and 2300 dpm/g. Activities of 238U,226Ra and 21?l?b in the water insoluble residues of Gyp-2, Gyp-6, Gyp-9, and Gyp DL3are given in Table 2-11. Activities of 22613, and 21oPb in the total (fine-grained) andfinest-grained fractions of water-insoluble residues display a marked increase inactivities relative to bulk samples of unleached phosphogypsum. The activities of226Ra and 21oPb are highest in the very finest-grained fraction of Gyp-2 as compared tothe total insoluble residue which contains mostly quartz, rock fragments, and unreactedore.
Water Insoluble Residues of Gyp-46 Produced in the “R” and “D” Series
The masses and the percentages of the water-insoluble residues of the five samplesof Gyp-46 produced in the "R" and "D" series are given in Table 2-12 and 2-13.Approximately 8 to 9%, with an average value of 8.5%, of Gyp-46 consists of water-insoluble residue in "R" series dissolutions. Variations in the percentages of theseresidues in the “R” series are believed to result from the time residues were allowed tosettle out of the supernatant solutions, minor loses during siphoning and decanting thesupernatants. The solute/solvent ratio in the “R” series solutions were selected basedon the theoretical solubility of gypsum, but it is possible that the solutions weresupersaturated with gypsum during the course of the experiments as additional 50 glots of the bulk sample were added. Supersaturation of the “R” solutions with apatiteand precipitation of poorly crystallized apatite and perhaps some gypsum may haveoccurred due to the dissolution technique that was used. The 3 rinses of these residueswith DDW should have dissolved any residual gypsum. Residues produced in the “D”series contain about 1.5% less insoluble residues than "R" series dissolutions which isnot what one would expect if a portion of the “R” series insoluble residues weresiphoned off and discarded. Splits of all the residues were x-rayed and gypsum x-raypeaks were not significantly higher in XRD patterns of the “R” residue, butsemiquantitative XRD analyses were not performed. Peak shifts and change ofintensities for specific XRD peaks are common for hydrated crystals such as gypsum.
2-20

Table Z-11. Activities of 238U, 226Ra, and 21ol?b measured by gamma spectrometry in the CaSOq.nH20-free residues of Gyp-2, Gyp- 9, and Gyp DL.3. Residues were produced from leaching experiments with doubly deionized water.
Sample Sample 238~ 226Ra 2lopb
Description (dpm/g) (dpmk) (dpmk)
Gyp-2 FG Finest-grained, water- insoluble residue
17Ok30 176Ok20 238Ok50
GYP-2 Fine-grained water- insoluble residue
71f6 1493&B 1400&10
Gyp-6HH Finest-grained, water- insoluble residue of Gyp-6 Hemihydrate
68kll 1622k7 352of20
Gyp-9 Fine-grained water- insoluble residue
7.6k0.4 159ok20 122Ok30
Gyp DL3 Finest-grained, water- insoluble residue
18OklO 2270+10 414Ok20

Table 2-E Percentages of water-insoluble residues in six bulk samples of Gyp-46 produced in the “R” series of dissolution experiments.
Sample Name
Mass of Bulk Mass of Dry Sample Water-Insoluble
Dissolved (g) Residue (g)
Percentage of Water-Insoluble
Residue (T%)
Gyp-46 Rl 400.0 32.83 8.21
Gyp-46 R2 400.0 34.20 8.55
Gyp-46 R3 450.0 39.64 8.81
Gyp-46 R4 400.0 35.68 8.92
Gyp-46 R5
Mean and 1 Standard Dev.
400.0 31.91 7.98
8.5rt0.4
Table 2-13 Percentages of water-insoluble residues in five bulk samples of Gyp-46 produced in the “D” series of dissolution experiments.
Sample Name
Mass of Bulk Sample
Dissolved (g)
Mass of Dry Water-Insoluble
Residue (g)
Percentage of Water-Insoluble
Residue fi)
Gyp-46 D2 25.00 1.692 6.77
Gyp-46 D3 25.02 1.674 6.69
GYp-46M 25.00 1.747 6.99
Gyp-46 D5 24.63 1.883 7.65
Gyp-46 D6
Mean and 1 Standard Dev.
25.00 1.815 7.26
24AXO.2 1.76zkO.09 7.1zto.4

Broad XRD peaks indicative of cryptocrystalline apatite were observed in XRD patternsfrom both sets of residues.
Percentages of U-238, Ra-226, and Pb-210 in “R” and “D” Series Insoluble Residues
Specific activities of 238U, 226Ra, 21oPb, and (210Pb/226Ra) activity ratios given inTables 2-14 and 2-15. The specific activities of 238U are somewhat lower in the “R”residues which could be due to loss of fine-grained, uranium-bearing apatite when thesolutions were siphoned off. The specific activities of 226Ra are variable in both sets ofresidues, but trend to decrease in later dissolution experiments. This is also the case forspecific activities of 21oPb in “R” and “D” sets of residues and is likely related to thetime the suspended residues were allowed to settle out of the mixtures. The(210Pb/226Ra) activity ratios within each set of residues are similar which tends toconfirm the settling times are the predominant controlling factor in the amount ofradionuclides that are retained. The most notable difference between the “R” and “D”residues are the mean (210Pb/226Ra) activity ratios with the “R” series ratio at 0.83whereas the ratio for the “D” series is about 1.20.
The differences between the “R” and “D” residues of Gyp-46 are furtherdemonstrated in Table 2-16 and Table 2-17 which present the percentages of 238U,226Ra, 21qb activities retained in the water-insoluble residues. These percentages werecalculated by averaging the specific activities of 226Ra and 21oPb in two vials thatcontained splits of each residue, multiplying this mean value by the mass of water-insoluble residue, dividing these values by the total activities of 226Ra and 2*oPb in thebulk sample of Gyp-46, and converting these factors to a percentage. These calculationsshow that about 43-71% of 238U, 62-69% of 226Ra, and 54-59% of the 21oPb activities arenot present in these water-insoluble residues. The percentages of 226Ra in solution inthe “D” series supernatant solutions (Table 2-8) and the percentages of 226Ra retained inthe residues of Gyp-46 D2, D3, and D4 (Table 2-17) total to about 100% within errorwith the exception of D4 which totals to about 115±9%. These results support thehypothesis that significant proportions of the 226Ra were either dissolved, sorbed orincluded within fine-grained particles (less than 0.45 µm).
The “R” series of residues retained more 226Ra and less 21oPb than the “D” seriesresidues. The D-series residues were produced using a different dissolution technique(see Experimental Procedures section) in which all supernatant solutions were retainedand the starting solute/solvent ratio of 1.38 g of phosphogypsum per liter of DDWallowed, at least theoretically, for complete dissolution of the gypsum. Two processescould be responsible for the differences in the percentages of z26Ra and less 21?l?b in the“R” series residues. More gypsum with sorbed radium may have remained in the “R’series residues, as discussed above, hence the higher mean specific activity andretention of 2*6Ra in the “R” residues. The appreciably higher specific activities andpercentage of 21oPb in the “D” series ratios may be due to either retention of fine-
2-21

Table 214 Specific activities of 238U, 226Ra, 2lopb, and (21oPb/226Ra) activity ratios in CaS04.2H20-free, water-insoluble residues of Gyp-46 “R” series dissolution experiments. The mean value of two counting vials are given for Gyp-46 (Rl) - (R5). and standard deviations are given at the la level.
Sample 238~
Name (dpm/g) 226Ra
(dpm/g) 2wb
(dpm/g) (2?Pb/=6Ra)
Activity Ratio
Gyp-46 Rl 19k2 326s 278k4 0.85kO.01
Gyp-46R2 20x2 316k2 277k4 0.88zkO.01
Gyp-46 R3 20&2 27Ort2 217k4 0.8OzkO.02
Gyp-46 R4 21+2 269&l 221rt3 0.82&0.01
Gyp-46 R5
Mean and 1 Standard Dev.
20f2 296+2 244k4 0.82kO.01
20&l 3ook30 25Ok30 0.83kO.03
Table 2-15 Specific activities of 2%J, 226Ra, 2Wl?b, and (21@l?b/226Ra) activity ratios in CaSOq.2H20-free, water-insoluble residues of Gyp-46 “D” series dissolution experiments.
Sample Name
238~
@pm/g) 226Ra
(dpm/g) ?fb
(dpm/g) (21”I’b/226Ra)
Activity Ratio
Gyp-46 D2 23+2 302&g 335k9 1.11+0.05
Gyp-46D3 33k2 28WO 34Ok20 1.2rtO.l
Gyp-46 D4 25k2 27OklO 330410 1.22kO.06
Gyp-46 D5 17.6kO.7 22OAAo 28OklO 1.27kO.07
Gyp-46 D6
Mean and 1 Standard Dev.
27.0k0.8 24OddO 280410 1.17zko.07
25+6 2601t30 31Ok30 1.19ko.07

Table 2-16. Percentages of 238U, 226Ra, 21oPb retained in water- insoluble residues Gyp-46 R(l)-(5) produced in the “R” series of dissolution experiments. Percentages are calculated by dividing the total activity of the radionuclide in the insoluble residue by the total activity in the bulk samples of Gyp-46.
Sample Percentage of Percentage of Percentage of Name 23&J Retained 226Ra Retained 21ol?b Retained
Gyp-46 Rl 34 50 45
Gyp-46 R2
Gyp-46 R3
Gyp-46 R4
Gyp-46 R5
Mean and 1 Standard Dev.
45 42 38
29 46 37
31 59 41
30 42 36
34&6 48+_7 39k4
Table 2-17 Percentages of 238U, 226Ra, 21oPb retained in water-insoluble residues Gyp-46 D(2)-(6) produced in the “D” series of dissolution experiments. Percentages are calculated by dividing the total activity of the radionuclide in the insoluble
b-. residue by the total activity in the bulk samples of Gyp-46.
Sample Name
Percentage of 238U Retained
Percentage of 226Ra Retained
Percentage of 21oPb Retained
Gyp46 D2
Gyp-46 D3
Gyp-46 D4
Gyp-46D5
Gyp46 D6
Mean and 1 Standard Dev.
33 38 45
57 35 45
35 35 46
28 31 43
41 33 41
40&10 34+2 4ti2

grained phases or colloids that contain a mineral phase that has lead as a essentialcomponent or sorbed on the grain surfaces. These results add to the body of evidencethat 22613, and 21oPb are contained in different minerals phases or have differencesorption characteristics in the phosphogypsum matrix. However, direct comparisons ofthe "R" and “D” residues can easily be misinterpreted since the “R” dissolutionexperiments were effectively open chemical systems whereas the “D” series wereclosed.
Water Insoluble Residues of Gyp DL3 and Gyp-6 Produced in the “D” Series
The percentages of water insoluble residues by mass, specific activities of 238U,226Ra, and 21oPb and the percentages of these nuclides retained by water insolubleresidues of Gyp DL3 and Gyp-6 are given in Tables 2-18, 2-19, and 2-20, respectively.The percentage of the water insoluble residues were almost twice as high in the threebulk samples of Gyp DL3 than in Gyp-6 which is most likely due to the amount ofdetrital quartz sand in the two bulk samples. The specific activities of 226Ra in bothsamples were similar, but the specific activity of 238U and 21oPb were appreciablyhigher in the Gyp-6 sample. These differences are reflected in the (*lqb/226Ra) activityratios which agree quite well for replicates of the same bulk samples. The activity ratiosof (210Pb/226Ra) for these phosphogypsum samples were are much greater than unityas were the replicate samples of Gyp-46 in the “D” series experiments. These ratios andthe percentages of the 21oPb that were retained in water insoluble residues of thesesamples, about 100% of the *loI?b in the bulk sample of Gyp DL3 and about 87% of thatin the bulk sample of Gyp-6, indicates that retention of more 21oPb than 226Ra by waterinsoluble residues of Gyp-46 was not anomalous. In fact, the activity of 21oPb retainedby these samples is almost twice the activity of 226Ra so the (210Pb/226Ra) ratios inresidues of Gyp-46 may be anomalously low.
Distribution of Radionuclides in the Coarser- and Finer-grained Residues
The percentages of 238U, *26Ra, and 21oPb in water insoluble residues that werefractionated into two general grain-sizes by suspension techniques in the “D” series ofdissolution experiments are given in Table 2-21. These results agree with datapresented in Table 2-11 and strongly support the hypothesis that the great majority ofradionuclides in the phosphogypsum are contained by the finest-grained residue. It ispossible that there is a re-distribution of radionuclides during the dissolutionexperiments. However, radium sorption experiments indicate that the radium is notincorporated in the crystalline lattice of CaS04.nH20.
2-22

Table 2-18 Percentages of water-insoluble residues in bulk samples of Gyp DL3 and Gyp-6 produced in the “D” series of dissolution experiments.
Sample Name
Mass of Bulk Mass of Dry Sample Water-Insoluble
Dissolved (g) Residue (g)
Percentage of Water-Insoluble
Residue (%)
Gyp DL3 Dl 25.00 2.442 9.77
Gyp DL.3 D2 25.02 2.490 9.96
Gyp DL3 D3 24.97 2.488 9.96
GypQD2 24.98 1.395 5.58
Gyp-6D3 25.00 1.402 5.61
Table 2-19 Specific activities of 23sU, 226Ra, 21ol?b, and (21oPb/226Ra) activity ratios in CaSO4.2H20-free, water-insoluble residues of Gyp DL3 and Gyp-6 in “D” series dissolution experiments. The mean values and standard deviation are given at the 1 0 level for activities and activity ratios in the D series residues.
Sample Name
238~
@pm/g) 226Ra
@pm/g) 21opb
@pm/g) (21oPb/~6Ra)
Activity Ratio
Gyp DL3 Dl 70410 3OOk20 47Oz!z20 1.6+0.1
Gyp DL3 D2 7845 29oklO 47oI!do 1.62kO.09
Gyp DL3 D3 97k6 310_+10 48OklO 1.5OckO.08
Gyp-6D2 23OtiO 320+20 590+20 1.8rtO.l
Gyp-6 D3 2ooz!20 35Of20 590+20 1.7kO.l

Table Z-20. Percentages of *%.I, **%a, *W’b retained in water-insoluble residues Gyp DL3 D(1)-(3) and Gyp-6 D2 and D3 produced in the “D” series of dissolution experiments. Percentages are calculated by dividing the total activity of the radionuclide in the insoluble residue by the total activity in the bulk samples.
Sample Percentage of Name *%I Retained
Percentage of **6Ra Retained
Percentage of *@‘b Retained
Gyp DL3 Dl 120+40* 55&3 lOort4
Gyp DL3 D2 140+60* 53&3 101*3
Gyp DL3 D3 120+30* 57*3 101&3
Gyp-6D2 82&4 44f2 87IfI3
Gyp-6 D3 88&4 4852 87rt3
* Activities of *38IJ calculated from *s4Th were near the lower limits of detection in for 234117. by y- spectrometry in the IG well detector.

Table Z-21. Distribution of 238u, 226h, 2lopb in the two grain-size fractions of water-insoluble residues of Gyp-46 D2-D6, Gyp DL3 Dl-D3 and Gyp-6 D2 and D3 produced in the “D” series of dissolution experiments. Nuclides in the coarser-grained residue (referred to as “Solids”) and the finest-grained suspended material (SM) fractions are given as percentages of the total radionuclide activities retained by the water insoluble residues
Sample Name
% of 2% in Solids in SM
% of 22613, in Solids in SM
% of 21oPb in Solids in SM
Gyp-46 D2 231k4
Gyp-46 D3 2Of3
Gyp-46 D4 20&S
Gyp-46 D5 43k9
Gyp46 D6 39&s
Gyp DL3 Dl
Gyp DL3 D2
Gyp DL.3 D3
7k3 93k9
16k3 84&7
227 78k9
Gyp-6 D2
Gyp-6 D3
16k3
227
80+10
80+10
8Ok9
60+20
611t9
84k7
78k9
Gyp-46
7&l
8kl
7&l
18&l
21_+1
Gyp DL3
8+1
1Okl
23+2
GYP-6
6&l
4_+1
93k4
929
93f6
82k6
79k6
927 10&l
9Ok6 13&l
77&S 2421
94k7
96zk7
15&l
16+1
14+1
25&l
29kl
4+1
3stl
85k4
84+9
86&6
75+6
71&S
902-7
87k6
77*5
96k7
97k7

Chemical Compositions and Radionuclide Activities in Leached Phosphogypsum
FSU (Gyp DL3) Experiment
To ensure the validity and replicability of experiments relating the chemicalcompositions with radiochemistries of bulk sample and leachates of phosphogypsum, alarge quantity of phosphogypsum sample Gyp DL3 was air-dried, desiccated toconstant mass, ground to a fine powder, homogenized, and split into two sub-samples.Phosphogypsum from each bulk sample split was analyzed by XRD to confirm thatonly the DH phase was present prior to preparation of samples for compositional andgamma spectrometric analyses. Activities of *%J, **6Ra, and *lol?b in replicate samplesof bulk Gyp DL3 were measured by γ-spectrometry. Specific activities of these nuclidesare given for replicates of the bulk sample (FSU-4 and FSU-5) in Table 2-22. Theactivities of **6Ra and *lol?b agree within the lo precision. The specific activity of *38Uis near the lower limit of detection for this sample using this analytical technique. Sixsamples of the Gyp DL3 phosphogypsum were prepared: FSU-1 is the finest-grained,water insoluble residue and FSU-2 is the coarser-grained insoluble residue producedfrom the dissolution of 70.0 g of bulk Gyp DL3, split 1. FSU-3 is the water insolubleresidue (not fractionated by grain-size) produced by dissolution of a 60.0 g sample ofsplit 2 of the bulk Gyp DL3 bulk sample. FSU-4 and FSU-5 are bulk, air-dried samplestaken from Gyp DL3 split 1 and split 2, respectively. FSU-6 is a sample of Gyp DL3Split 1 that was 75% dissolved (by mass) in DDW. Specific activities of *3&J, **%a, and*loPb in the FSU samples are presented in Table 2-22. Once again, the highest specificactivities of *38U, **%I, and *loPb are associated with the finest-grained water insolubleresidue.
Relationships of Radionuclides to Chemical Compositions
The fractions of Gyp DL3 described in the preceding section and splits of the fivereplicate samples of Gyp-46 produced in the “R” series of dissolution experiments ofGyp-46 (RES 1-5) were used to relate the chemical compositions of bulk, partiallydissolved, and water insoluble residues of phosphogypsum to radionuclide activities.Three additional residues of Gyp DL3 have been analyzed for chemical compositionsand radioactivities; the finest-grained residue of a replicate sample of bulk Gyp DL3(RES-7), and water insoluble residues of two more bulk samples (RES-8 and RES-9). Weassumed that if different fractions produced from large phosphogypsum samples weretreated separately, they would have varying amounts of the minor chemicalcomponents. By tracking the elemental and radiochemical relations within andbetween these samples which were chemically and mechanically fractionated, weshould be able to assess which phases are most important in terms of controlling theradiochemical content. Although the approach is indirect, it is a way of determiningimportant relations within these samples which would not be possible by analysis ofsingle samples. Concentrations of chemical components in these samples (Appendix C)have been converted to units of millimoles or micromoles per gram of sample so atomicratios can be considered.
2-23

Table Z-22. Activities of *38U, **6Ra, and *loPb measured by rspectro- metry in FSU 1 to 6 samples (Gyp DL.3). FSU-1,2, and 3 are water insoluble residues, FSU-4 and 5 are replicate bulk samples, and FSU-6 is a sample of Gyp DL3 which had about 75% of the mass dissolved.
Sample Sample 238~ **6Ra wrb Sample Mass (g) Description (dpm/g) (dpm/g) @pm/g)
FSU-1 0.140
FSU-2 2.759
FSU-3 2.516
FSU-4 1.868
FSU-5 1.792
FSU-6 0.906
Finest-grained, water insoluble residue
183+13
Coarse-grained, water 9.7H.O insoluble residue
Total water insoluble 26.3k2.2 residue
Bulk, air-dried phos- 1.6kO.3 phogypsum, Split 1
Bulk, air-dried phos- 0.5+_0.1 phogypsum, Split 2
-75% Dissolved (by wt.). Split 1
3.3kO.6
227212 4135k24
75.tiO.7 155.2h1.7
176.ti1.3 382.9ti.3
53.6kO.5 45.5H.O
54.tio.3 46.31bO.6
109.2H.o 109.3H.8

Plots of Ba versus **6Ra and Ba versus *loPb are shown in Figures 2-11 (A) and(B). The Ba correlated with both **6Ra and *lol?b quite well. Unfortunately, samplesfrom the residues produced from the two bulk samples had a tendency to cluster into afew groups which can cause artifacts in correlating parameters. Activities of bothradionuclides were concentrated in the finest-grained residues of Gyp DL3 and Gyp-46which also had the highest concentrations of Ba. Activities of *lqb in the finest-grainedresidues were about twice those of **6Ra for similar concentrations of Ba. This trend isconsistent with the results given in Table 2-11 for the finest-grained water insolubleresidues of Gyp-2, 6, 9, and DL3 and *loPb activities in the finest-grained residues ofGyp DL3 shown in Table 2-22. Plots of Ce and La versus **6Ra are shown in Figure 2-12(A) and (B). These rare earth elements demonstrated the best correlations with **6Raactivities of any chemical components that were investigated. The activities of *loPbwere observed to be about twice that of **6Ra for similar concentrations of Ce and La.
Divalent cations and rare earth elements were not the only elements whichdemonstrated close correlations with these radionuclides. Figures 2-13 (A) and (B) areplots of Al and P versus **6Ra activities. Although the correlations of these elementswith **6Ra were not at strong as the rare earths, the finest-grained residues containedthe most Al, P, and radionuclides. The P/ **6Ra ratios appeared to remain fairlyconstant for the majority of the residues and finest-grained residues. The plots of Alversus P and Fe versus P shown in Figures 2-14 (A) and (B) also displays a goodrelationship between these elements. The samples of each bulk phosphogypsumsample were grouped into two discrete clusters for all but the finest-grained residues inFigure 2-14 (A), but the correlation is stronger for Fe/P ratios plotted in Figure 2-14(B).This implies that phases that contained a fixed ratio of Fe/P were present in thesamples. This trend was the strongest for the finest-grained residues.
Figure 2-15 demonstrates a trend could not be produced if the majority of the226Ra in these samples of phosphogypsum was included in BaS04. The Ba and **%$I inthese samples correlated quite well with **6Ra (Figure 2-11(A)) as did Al (Figure 2-13(A)). When Ra and Al were more abundant in the sample, so was **6Ra. The finest-grained water insoluble residues contain more Al, Ba, Fe, and P and the highestactivities of **6Ra. However, Figure 2-15 demonstrates that the Al remaining in thesolids increased much less than Ba when the samples were leached with DDW. As the(Ba/Al) molar ratios decreased, the **6Ra remained relatively unchanged until themajority of the water soluble fraction (predominantly gypsum) was dissolved. Once allthe water soluble material was dissolved, the activity of **6Ra increased and the (Ba/Al)molar ratio remained fairly constant. Exactly the opposite trend would be expected ifthe **%a were included in BaS04 because it is a not an aluminum-bearing mineralphase. Therefore, the insoluble **%a in phosphogypsum appears to be associated withan aluminum-bearing mineral phase, perhaps an aluminum phosphate. Figure 2-15also implies that there must be a non-radiogenic barium phase in the phosphogypsum.
2-24


Although the presence of water insoluble sulfates may still be important in termsof hosting radium and other radionuclides, it appears that most (and potentially all) ofthe **6Ra and *loPb in phosphogypsum may be associated with an aluminum-richphase. Based on the elemental relationships reported here and the chemicalcompositions of our most radium-enriched residues, it appears that the carrier phase forthe insoluble portion of the radium may have a composition similar to the mineralcrandallite, CaA13(PO&(OH)~H2Q. This mineral, found in nature as a low-temperature weathering product of carbonate fluorapatite, is known to containappreciable amounts of Sr, Ba, Fe, and rare-earth elements. Presumably, radionuclidessuch as **6Ra would be able to substitute into the structure of this mineral in the samelattice position as Ba and Sr. Positive identification of this or other phases will requiremore sophisticated phase separation techniques to isolate the mineral(s) of interest.
One or more F bearing phases must also be present in the phosphogypsum inaddition to the residual apatite. A (NaXJ(&$iF6 phase has been observed growing inzones of cooling water discharge on the gypsum stacks. The F in this phase is quitehigh stoichiometrically so these discharging solutions must contain high concentrationsof F. Another line of evidence that one or more water-insoluble F-bearing phase(s) incontained in the bulk phosphogypsum is suggested by compositional data for FSU-6(Appendix C). About 75% of the mass of the FSU-6 sample was dissolved in DDW andthe residue contains a higher (F/P) ratio than the bulk samples (FSU-4 and 5). It ispossible that fluoride phases such as CeF3, LaF3, and perhaps CaF2 in thephosphogypsum matrix also include radionuclides.
X-ray Diffraction Results
Water insoluble residues of phosphogypsum dissolution experiments (sampleswithout DH or HH) have been analyzed by XRD to identify the minerals phasespresent. XRD patterns have been produced for bulk samples and numerous grain sizeand mass fractions as well as the finest-grained fractions of water insoluble residues offive phosphogypsum samples (Gyp-2, Gyp-6, Gyp-9, Gyp-46, and Gyp-DL3). TheseXRD results indicate that the most abundant mineral phases in DDW insoluble residuesare quartz (silica sand) and cryptocrystalline apatite, most likely a carbonatefluorapatite [Cag(PO4, C03)3(F)]. Quartz comprises the greatest proportion of the totalresidues and is always detected by XRD. The fluorapatite is extremely fine-grained andthe cryptocrystalline nature of this phase, indicated by very broad peaks in the XRDpatterns, infers that this apatite has been reprecipitated from the acidic solutions in thereaction vessels rather than representing the primary mineral within the ore rock.Aluminum phosphates and complex calcium and iron aluminophosphate patterns wereinfrequently identifiable in finest-grained residues when all the gypsum was dissolvedand most the quartz had been removed. No other mineral phases, except for quartz,could be positively identified in the total or the finest-grained fractions of the water-insoluble residues using the XRD unit at Florida State University which has lower limitsof detection for mineral phases of about 2 to 3%.
2-25

Several of the finest-grained, suspended solids from samples Gyp-6, Gyp DL3, andGyp-46 collected by centrifugation and on filters have also been analyzed by XRD.XRD patterns provide evidence of multiple phases in the dark “uncentrifugable”fraction of brown, fine-grain sized particles collected on filters. These samples haveXRD peaks that are clearly of a different phase(s) than in the finest-grained residuecollected by centrifugation. The most intriguing of the XRD patterns are two of thefinest-grained solids on 0.10 µm filters used to filter Gyp-46 D3 that were analyzed onthe XRD unit at FIPR using the TVA supplemental database for phase identification.These peaks were probably masked in the centrifuged fractions since the phases arehighly diluted in the solid fraction. A summary of XRD results obtained using the FIPRinstrumentation and software is included as Table 2-23. A complex Fe-phosphate andchukhrovite (Ca&lSi(S04)F13~12H20) have been positively identified in the finest-grained water insoluble residues.
SEM Imagery and Semiquantitative XRF of Residue Fractions
The <0.65 µm fraction of a water insoluble residue of Gyp-2 was the first sampleanalyzed by Scanning Electron Microscopy (SEM). Extremely fine-grained quartz (SiO2- fine silt-sized grains), minor Ca, S, and O (CaSO4anH20), and appreciable quantities ofCa, F, P, O, and F were observed although no Ba or Sr were detected. Quartz grains areseparated from the finest-grained water insoluble residues by physical means(centrifugation), so the presence of some very fine-grained sand is not surprising. Avery minor amount of CaSOq.nH20, <0.2% of the total mass, was also present.
The compositional analyses of residues produced by XRF are semiquantitative andinterpretation is difficult since the area that was excited by the electron beam wasrelatively large compared to the sizes of the grains of interest. SEM images andsemiquantitative compositional analyses have been performed for selected densityfractions of residues of Gyp-46 R1, R2, and R3. Crystal habits observed by SEMimagery included the “small balls” mentioned by Moisset, 1990 (more properly referredto as nodular or boytryoidal morphologies) but no SEM imagery was diagnostic ofknown radionuclide-bearing, inorganic phases. However, there are some intriguingclues yielded by the compositional analyses. One composition which reoccurs is that ofa Al, Si, Ca, and Fe bearing material in the >3.30 g/cm3 fraction of Gyp-46 R3 (Table 2-24). A similar composition is noted in the <2.58 g/cm3 fraction along with minor S.The latter composition could be due to the presence of chukhrovite(Ca&O@AlF13~nH20) which we have observed in water-insoluble residues ofphosphogypsum.
Summaries of two heavy liquid separation experiments using Gyp-46 R4, a waterinsoluble residue produced in the “R” dissolution series, are presented in Tables 2-25and 2-26. Experiment A was performed using the highest specific gravity heavy liquid
2-26
Heavy Liquid Separations of Gyp-46 Residues

Table Z-23. Summary of XRD results of the very finest-grained, water- insoluble residues (the “uncentrifugable fraction”) of selected samples of phosphogypsum. Solids were collected on 0.1 pm filters and grains are oriented by size and shape. Extremely fine- grained a-quartz was also identified and amorphous material is likely present in all samples.
Sample Composition of Mineral Name Phase
Name of Mineral Phase
Gyp-6 D3 SM UCF
Gyp DL3 D3 SM UCF
I=-Fe,(PO,), (Tenative ID)
NHqFe3P6020.10H20
NH,Fe$,O,,.lOH,O
Na3PS03~12H20 (Tentative ID)
(Ce,La),Si,,O,OH (Very Tentative ID)
Gyp-46 D3 SM UCF Ca,A1Si(S04)F13.12H20
Fel?04 (Tentative ID)
Complex Fe-Phosphate (TVA XRD Datafile O-36)
Complex Fe-Phosphate (TVA XRD Datafile O-14)
Not Named (TVA XRD Datafile 25-911)
Complex Fe-Phosphate (TVA XRD Datafile O-36)
Not Named (ASTM Powder File 31-53)
Complex Fe-Phosphate (TVA XRD Datafile O-14)
Complex Fe-Phosphate (ASTM Powder File 31-1037)
Not Named (ASTM Powder File 18-1260)
Toernebohmite (ASTM Powder File 14-257)
Chukhrovite (ASTM Powder File O-20)
Polymorph Not Known (ASTM Powder File 29-715)

Table Z-24. Semiquantitative XRF analyses of material in density fractions of Gyp-46R3 separated with heavy liquids. Compositions are not solely those of the finest-grained materal in most cases. Compositions are given in atomic percent normalized to 100%.
Sample Name
Spectrum Density Range Number (g/cm3) Composition (Atom % of Element)
R3.f3 s14 Mininum Quartz
~2.58
R3.f3 s21 x2.58
R3.f3 s12 Nodular Debris
R3.Fl Zircon
s15
R3.fl Zircon
S16
R3.fl s17
R3.fl S18
R3.fl s19
R3.fl s20
2.59-2.75
B3.30
>3.30
B3.30
>3.30
>3.30
>3.30
Ca 56.5, Si 25.2, Al 8.6, S 4.1, I? 3.4, Fe 1.4
Si 36.6, Ca 35.7, I? 13.6, Fe 7.3, Al, 4.2, S 2.1
Ca 82.7, Si 10.1, Al 3.0, S 2.4, Fe 1.7
Zr 51.0, Si 49.0
Zr 49.2, Si 49.2, Ca 1.6
Si 39.4, Al 28.1, Ca 24.1, Fe 8.3
Al 54.0, Si 30.0, Fe 8.3, Ca 5.4
Al 56.7, Si 31.2, Fe 9.7, Ca 1.8
Fe 37.2, Ti 32.7, P 29.1

Table Z-25. Summary of heavy liquid separation of Gyp-46R4 - Experiment A. The starting material was 1.1058 g of residue with **6Ra activity (relative) of 224s dpm/g used in density (p) fractionation experiment. Errors are given at the lo level based on counting statistics only. See text for explanation.
Density Range Mass in p % of Mass in **6Ra in dpm/g 226Ra in dpm/g
(g/cm3) Fraction (g) p Fraction of Total Residue of p Fraction
~2.53 0.331 29.9 126.1+7.7 381ti3
2.53-2.67 0.701 63.4 73.5k5.3 105s3
2.67-2.71 0.037 3.3 12.1k2.6 3271k70
>2.71 0.014 1.3 6.8zk1.3 486zk93
c 1.083 97.9 218.7zk9.8 Normalized to 100% Recovery: 223.4SO.O

Table Z-26. Summary of heavy liquid separation of Gyp-46R4 - Experiment B. The starting material was 1.2090 g of residue with 226Ra
,” activity (relative) of 224k3 dpm/g for the density (p) fractionation experiment. Errors are given at the lo level based on counting statistics only. See text for explanation.
Density Range Mass in p % of Mass in 226Ra in dpm/g 226Ra in dpm/g
(g/cm3) Fraction (g) p Fraction in Total Residue in p Fraction
Water & Acetone 0.016 Soluble
1.3 18.2k1.4 1138k88
1.94-2.50 0.090 7.4 20.2k4.1 224k46
2.50-2.55 0.018 1.5 19.8Ik3.1 1100+172
2.55-2.60 0.033 2.7 19.6k2.2 594rt67
2.60-2.65 0.918 75.9 98.6k6.5 107k7
2.65-2.71 0.039 3.2 18.4k3.7 47195
2.71-2.89 0.045 3.7 20.61k3.6 458k80
>2.89 0.021 1.7 12.7k1.4 604+67
1.180 97.4 228.kk10.2 Normalized to 100% Recovery: 234.2k10.5

first and then less dense liquids whereas the residue in Experiment B was initiallyseparated with the least dense liquid and then by progressively denser liquids. Theactivities of **6Ra in Gyp-46 R4 do not agree precisely with those given in Table 14because calibration of the well type IG γ-ray detector had not been completed whenthese experiments were conducted. These experimental results remain valid since therelative activities of **6Ra in the density fractions yield the information required toevaluate the data.
Unfortunately, the results of Experiment A are not replicated in Experiment B. Theless than 2.53 g/cm3 fraction in Experiment A contains about 30% of the mass of thetotal residue and approximately 56% of the total **6Ra activity (Table 2-25). The lessthan 2.53 g/cm3 fraction contains some quartz, but most quartz is in the 2.53-2.67 g/cm3fraction as expected (α-quartz ρ=2.65 g/cm3). This fraction contains 33% of the **6Ra,and 63% of the residue mass. There appears to be a systematic relationship of lower**6Ra activities (with respect to the total residue) with increasing density fractions.Results of Experiment B are presented in Table 2-26 and the largest fraction of the **6Raactivity is in the fraction containing quartz and 76% of the mass of the residue. Notrend of decreasing 2*6Ra activity with increasing density is apparent and thedistribution of **6Ra activities in density fractions is not similar to results of ExperimentA. Experimental procedures were different in that the density fraction separations wereperformed in reverse order in the two experiments, but SEM examination of densityfractions suggests that the major reason for irreproducibility is grain aggregation. Thisis the same reason that dry and wet sieving could not effectively concentrateradionuclide-bearing phases in grain-size fractions by sieving homogenized bulkphosphogypsum samples.
Total Organic Carbon in Insoluble Residues
One reference in the scientific literature (Ferguson, 1985) mentions thatradionuclides are retained by fine-grained, organic material in phosphogypsum.However, none of the statements in this report that refer to radionuclides being sorbedon organic material or the activities of sorbed nuclides were documented. Mineralphases which contain the appropriate stoichiometric proportion of C were included insearches of XRD peaks being used to identify the minor phases in the water-insolubleresidues, but none were indicated. Organic phases are usually amorphous and if so,will not produce XRD patterns. The presence of an organic component in the finest-grained solid residues is of importance not only for determining whether sorption is animportant process in radionuclide fixation and mobilization, but also because sulfatereducing bacteria (SRB) cultured from samples of Florida phosphogypsum requirecarbon in their metabolic cycle. The roles of bacteria in fixing and releasingradionuclides in gypsum stack environments are discussed in Chapters 3 and 4 of thisreport.
2-27

The finest-grained water insoluble residues contain the highest activities of *loPband **6Ra and the possibility that this fine-grained, organic material contains aproportion of the radioactivity in phosphogypsum was investigated even though thefirst sequential leaching experiments with Hz02 did not liberate appreciably higheractivities of z6Ra to solution and there is no discernible relationship of **6Ra in solutionwith dissolved organic carbon. Three replicate samples of Gyp-46 insoluble residueswere analyzed for total organic carbon (TOC) and nitrogen (N) because of the highproportion of 2*6Ra that Gyp-46 releases into DDW solutions. Results are presented inTable 2-27 and TOC ranges from about 6 - 8% of the total mass of the finest-grainedresidue and nitrogen (N) is negligible. Carbon is present, but the role it plays in thesorption of radionuclides is still not clear. Sorption of radionuclides onto carbon in thegypsum stack environments may not be a viable process because of the low pH ofsolutions would tend to inhibit sorption and the high chemical activity of calcium andcalcium complexes would be expected to occupy most of the sorption sites. The samemay be true for radionuclide sorption onto calcium sulfate complexes, but theseprocesses can not be evaluated until the solutions which are circulating in the gypsumstacks can be better characterized.
Multicomponent Chemical Equilibrium Models
Both homogeneous (SOLVEQ) and heterogeneous (CHILLER) chemicalequilibrium models predicted that barite (BaS04) and strontianite (SrS04) would behighly insoluble in solutions that were produced during dissolution of phosphogypsumwith DDW using the solvent/solute ratio (25 g of phosphogypsum dissolved in 18 L ofDDW) used in all of the “D” series dissolution experiments. The chemical compositionof Gyp DL3 was used in these models and the composition was normalized to adihydrate form (gypsum) which was know to be the predominant phase present fromXRD of the bulk samples. Anglesite (RbSO4) should also be insoluble in these solutions,at least in theory, if the pH does not decrease below about 2.7. The pH measured insupernatant solutions for 3 “D” series dissolutions of Gyp DL3 never decreased belowabout 3.6.
No internally consistent thermodynamic data exist for a (Ba,Sr,Pb)SO4 type ofmineral phase that has been postulated as being present in phosphogypsum or the(Ca,Sr,Ba)SOd phase mentioned by Moisset (1990) as the probable site of **6Ra in fine-grained residues that were produced by dissolving and hydrocycloning HH. However,CHILLER models of the majority of the water insoluble residues of Gyp-46 and GypDL3 indicated that the sulfate (SO& that remained in the residues after all the DH wasdissolved was insufficient to balance all of the Ba as barite. A solid solution phase suchas (Ba,Sr,I?b)S04 or (Ca,Sr,Ba)SOq would therefore be even less likely to be present sincea higher molality of sulfate would be required to precipitate all of the Ba, Sr, and Pb.Based on our compositional data, it is unlikely that all of the **6Ra or *lol?b could be co-precipitated as divalent sulfates. A neutrally-charged aqueous species of radium,RaS04”taq ) was calculated in SOLVEQ models of the “D” series type dissolutions of Gyp
2-28

Table 2-27. Percentages by mass of C and N in replicate samples of three sub-samples of the finest-grained, CaSO4.2HzO-free, water- insoluble residues from Gyp-46 dissolution D3. This residue was X-rayed to assure that no CaS04.2H20 and very little quartz was present in this residue.
Sample C Name % by Mass
N
% by Mass
Gyp-46 D3 01A 8.051 0.043 Gyp-46 D3 OlB 6.011 0.060
Gyp46 D3 02A 6.262 0.049 GYP-46 D3 028 6.531 0.056
Gyp-46 D3 03A 6.482 0.058 Gyp-46 D3 03B 6.276 0.078

DL3, but the molality was extremely low. However, not much radium in solutionwould be required to account for the activities of **6Ra that we have measured insolutions.
Rare earth fluorides (LaF3 and CeF3) were not modeled using the numericalmodeling techniques because the chemical thermodynamic data for these phases are notcontained in the database as yet. Fluorite (CaF2) was saturated in some CHILLERmodels of solutions that had the same solute/solvent ratios of the “D” series solutionsand surprisingly so was topaz [A12(Si04)(0H,F)2] which has been synthesized byheating amorphous Al203 with Na#&j (Deer et al., 1966). This silica hexafluoridephase is the Na end-member of the solid solution phase that we have identifiedgrowing in seeps of discharge fluids in gypsum stacks and is well know to analyticalchemists and production managers in the fertilizer industry as the mineral phase thatclogs filter screens. This coincidence is even stranger considering that gypsum stacksand filter pans in phosphoric acid plants are the only places, with the exception of hightemperature volcanic vents, this mineral phase has been identified. We have measuredthe activities of radionuclides in crystals of (K,Na)2Si& collected on gypsum stacks andactivities of z6Ra and *%l?b are near the lower limits of detection. The relevance of thisinformation to this study is that all of these mineral phases, with the exception of theO(INa)zSiFb based on our data, are capable of scavenging radionuclides from solutions.In fact, co-precipitation of radionuclides from solutions with rare-earth elementfluorides, as CeF3, is a standard practice in radiochemistry laboratories.
CONCLUSIONS
Based on the observations made in this chapter, we summarize the principalconclusions below.
(1) A radionuclide-enriched fraction of bulk phosphogypsum samples cannotbe produced, at least on a laboratory scale, by either standard dry or wet sievingtechniques. It may be worth investigating more sophisticated sieving techniques whichutilize surfactants and/or ultrasonic vibration during the processing and filtering of thesolids.
(2) Neither **6Ra nor *lol?b were released in direct proportion to CaSOq.nH20dissolution in DDW. The fractionation between **6Ra and *lol?b implies that theseradionuclides either exist in phosphogypsum as different phases or display differentadsorption characteristics.
(3) Both 2*6Ra and *lol?b are enriched in water-insoluble solid residues afterCaSOq.nH20 has been completely dissolved. The great majority of radium is adsorbedor is included within a discrete phase rather than being incorporated as latticecomponent in the CaSOq.nH20 crystals.
2-29

(4) Supernatant solutions produced by dissolving bulk phosphogypsumsamples in DDW released appreciable portions of **6Ra to solution when virtually allthe CaSOq.nH20 phase in bulk samples was dissolved. Although a significant portionof 226Ra is apparently in solution as defined by the ability to pass through a 0.45 µmfilter, radionuclide incorporation onto colloids cannot be ruled out. The release of **6Rainto solution does not seem to be an obvious function of the time phosphogypsum hasbeen on a storage stack.
(5) The great majority of radionuclides in water insoluble residues ofphosphogypsum are contained by the finest-grained material. The activities of 2*%‘bretained by these finest-grained residues are about twice as high as activities of z6Ra.Thus, **6Ra is apparently more easily desorbed/leached from the solid phases whichcontain the majority of the radionuclides.
(6) Heavy liquid separations of water insoluble residues of phosphogypsumsamples were not successful in isolating a radionuclide-enriched fraction of theinsoluble residues.
(7) Radionuclides in phosphogypsum are not strongly bound by organicmaterial. There does not appear to be any relationship between the concentration ofdissolved organic carbon and the activities of **6Ra in solution.
(8) Quartz and cryptocrystalline apatite were detected in every water-insolubleresidue of phosphogypsum that was been analyzed by XRD. Aluminum phosphatesand complex calcium and iron aluminophosphates were identified by XRD in some ofthe finest-grained residues when all the CaSO4.nH20 was dissolved and most of thequartz was removed.
(9) No Ba or Sr has been detected in semiquantitative XRF analyses of fine-grained, water insoluble residues of phosphogypsum. We did observe small nodularmaterials with high contents of Al, Si, Ca, and Fe. This could be due to the presence ofchukhrovite (Ca&O&AlF13~nH20) which was identified by XRD in water-insolubleresidues of phosphogypsum.
(10) Barite does not contain the majority of **6Ra in phosphogypsum. It appearsthat most of the insoluble 22% and *loPb in phosphogypsum may be associated withan aluminum-rich phase. Complex iron phosphates and calcium alumina phosphatesmay also contain portions of the radionuclides. The main radionuclide carrier phasemay have a composition similar to the mineral crandallite, CaAl#O&(OH)5.H20.Fluoride phases, specifically CeF3 and LaF3 may also host significant portions of theradionuclides in phosphogypsum matrices.
2-30

CHAPTER 3
UPTAKE OF POLONIUM AND SULFUR BY BACTERIA
INTRODUCTION
Polonium-210 is the final alpha-emitting daughter nuclide in the naturaluranium-238 decay series. It normally is considered a “particle reactive” element(tends to adsorb to negatively charged particles) and as such has been used as atracer to study the mechanisms of metal removal by particles in aquatic systems(Talbot and Andren, 1984; Benoit and Hemond, 1987; Harada et al., 1989).Ranked in the very hazardous group of radionuclides, polonium is considered tobe extremely radiotoxic when ingested. The maximum contaminant level fornatural gross alpha-particle activity in drinking water is 15 pCi/L, as defined bythe U.S. Environmental Protection Agency (Aieta et al., 1987). Somegroundwaters from shallow wells in west-central Florida, however, were foundto have *lol?o activities greater than 500 pCi/L (Burnett et al., 1987; Harada et al.,1989). The exact source of Po in these wells is uncertain although it mustsomehow ultimately be related to the relatively high content of uranium (~100ppm) and subsequent daughter products found naturally in phosphatic stratacharacteristic of the region. Phosphogypsum (CaS04. 2H20 with impurities) isanother potential source of polonium found in ground waters in this area. It is aby-product formed during the chemical processing of phosphate rock whereconcentrated ore is reacted with sulfuric acid to produce phosphoric acid, the rawmaterial used for production of phosphatic fertilizers. Because of its relativelyhigh content of radionuclides, phosphogypsum is not used commercially andcurrently is being stockpiled at a rate of several tens of millions of metric tons peryear.
A detailed study of one well with *lop0 activities consistently over 500 pCi/L

showed that virtually all of the *loI? in the sampled wells was unsupported; i.e.,its presence was unaccompanied by its radioactive predecessors *Wl?b and *loBi(Harada et al., 1989). Some process, therefore, must be affecting the geochemistryof Po such that it is capable of migrating and concentrating in the ground watersystem. Furthermore, evidence presented by these authors led them to suggestthat soluble Po was preferentially released from the surrounding phosphate rockby indigenous microorganisms. They showed that ground waters with high*%Po concentrations were also characterized by the presence of sulfide at levelsgreater than approximately 10µM H$S, and pH values generally lower than 5.Harada and his colleagues also experimentally investigated the relationshipsbetween bacterial growth, Po activity, and sulfide concentrations in Po-richground water. They observed a concurrent increase in bacterial biomass andparticulate Po and an equivalent decrease in soluble Po and sulfide over a timescale of hours to days. These findings suggested that bacterial activity and uptakeof soluble Po in ground water could be a dominant factor controlling thedistribution between soluble and particulate phases. Because Po and sulfur havesome chemical affinities (both elements, for example, are members of Group VIin the periodic table) and the absolute maximum chemical concentrations of Poin the study site wells were too low (approximately lo-*GM) to serve in any directmetabolic function, it was hypothesized that biochemical mechanisms governingsulfur metabolism could also affect the uptake and cellular distribution ofpolonium in the indigenous bacterial populations.
Sulfur can enter into bacterial metabolism in three ways: (1) as an energysource (sulfide oxidation); (2) as a terminal electron acceptor (dissimilatorysulfate reduction); or (3) as a precursor for the synthesis of the amino acidscysteine and methionine (assimilatory sulfate reduction). In suboxic marinewaters, Cutter (1982) and Cutter and Bruland (1984) have demonstrated theexistence of a reduced form of the element selenium (another Group VIelement) which they operationally-defined as organic selenide. They found thatmost of this organic selenide was associated with dissolved amino acids andsuggested that it might exist as selenocysteine and selenomethionine. In termsof polonium behavior in natural waters, the most common valance state isthought to be Po4+ (Bacon et al., 1988). Bagnall(1957), however, noted that whilethe reduced form of Po, H2P0, has never been isolated in weighable amounts,there is tracer scale evidence for its formation. These observations led us tospeculate that Po might be reduced in a similar manner as sulfur in the normalcourse of microbial metabolism (i.e., assimilatory sulfate reduction) to form Po-labeled proteins.
The long-term goal of our research concerning polonium-bacteriainteractions is to determine if bacterial activity is central to the mobilization ofPo from the solid phase to the fluid portion of the aquifer. Earlier studies in ourlaboratory (Harada et al., 1989) provided circumstantial evidence for poloniumuptake by bacteria after Po-enriched ground waters had been removed from the
3-2

aquifer. The experiments reported here were designed to evaluate themechanisms and fate of polonium after uptake. Another report (see Chapter 4)will deal with the specific issue of bacterial mobilization of polonium fromphosphogypsum. In this report, we compare the patterns of uptake and cellularcompartmentalization of Po and sulfur using a bacterial culture isolated from afreshly-collected phosphogypsum sample. The results indicate that while theinitial mechanism of bacterial uptake for SO4 and Po appears to differ, once Po isassociated with the cell, it is dispersed between the cell walls, cytoplasm, andprotein in a manner very analogous to sulfur. These observations thus serve toestablish that bacteria may, in fact, be involved in the “processing” of aqueouspolonium species.
MATERIALS AND METHODS
Organism. Culture Media. and Radioisotopes
The aerobic bacterial culture used in all experiments was isolated onnutrient agar (Difco Laboratories, Inc., Detroit, Mich.) from a phosphogypsumsample collected from an inactive gypsum stack (IMC P-21 stack) in Bartow,Florida. The Gram negative rod-shaped cells were classified in the Psuedomonasgroup using Biolog MicroplatesTM (Biolog, Inc., Hayward CA). The isolate wasmaintained on the low-nutrient medium described below. All experimentsemployed a nutrient medium that consisted of 0.08% peptone, 0.02% yeast extract(Difco Laboratories, Inc.), 1 mL of trace metals solution, basal salts, and distilledwater. The basal salts per liter of medium were as follows: 0.02g Na2SO4, 0.10gKH$?O4,0.25g NH4Cl, 1.0g NaCl, 0.40g MgCl2+6H20, 0.50g KCl, and CaClr2H20.The trace metals stock solution (1,000 fold concentrated) consisted of thefollowing compounds per liter of distilled water: 8.5 mL of concentrated HCl, 2.1gof FeSO4.7H20,O.lOg MnCl2’4H20, 0.19g CoCl2*6H2O, 0.144g ZnSO4*7H2O, 0.006gHsB03,0.024g NiCl2.6H20,0.002g CuCl2.2H20, and 0.036g Na2MoOm2H20.
We omitted Na2S04 from the medium for those experiments in whichsulfate partitioning was examined, relying only on the sulfate-S contained in thepeptone and yeast extract to support growth. The non-labeled sulfate-Sconcentration in the medium for these experiments was 1.7mg SO4-S L-l asmeasured with a Dionex 4500i Ion Chromatograph, equipped with an ASHAanion exchange column.
To compare how bacteria use sulfur and polonium, we employedcommercially-available radioisotopes of sulfate (Na$?SO4, 5.0mCi/mL, NEN,DuPont Biochemicals, Boston, MA) and polonium (*o@oCl4, 0.5µCi/mL, IsotopeProducts Laboratories, Burbank, CA). The bacteria were grown in 250 mL of
3-3

medium to which a total activity of either 35SO4 (6.0µCi) or *o*Po (0.028µCi) hadbeen added. Cost considerations dictated that initial isotopic concentrations ofthe medium in the growth flasks labeled with *osPo be much lower than thoselabeled with 35SO4. Even at trace concentrations, polonium is known to bind tocharged surfaces and exhibit colloidal behavior (Bagnall, 1957). In an effort tominimize losses of polonium to glass-ware, we used only plastic growth vessels,centrifuge tubes, spectrophotometer cuvettes, and filtration units.
Changes in optical density were used to follow bacterial development ingrowth experiments and to determine the physiological phase of the culture.Absorbance readings (OD& were calibrated against direct cell counts by phasecontrast microscopy using a Petroff-Hauser cell so that optical density could beused to subsequently determine cell numbers when required.
Polonium and Sulfate Incorporation Experiments
The respective radiolabled growth media (i.e., 3%04 or *osI?o) wereinoculated with approximately 9.0 x 10⁴ cells, placed on a shaker table, andallowed to incubate at room temperature (23°C) for periods up to 90 hours. Atselected time intervals within the bacterial growth cycle, 10 mL aliquots wereremoved from each culture flask to (1) measure changes in optical density, and(2) determine total cellular uptake of the appropriate radioisotope. Thesealiquots were passed through a 0.3 µm membrane filter (Millipore Corp., BedfordMa). The filter was washed twice with sterile distilled water and then counted byliquid scintillation (LSC) to measure cell-associated radioactivity. The filtrate (1mL aliquot) was also counted to quantify the isotope not taken up by the bacteriain order to conduct a mass balance of the isotope between the culture media andthe bacteria. Filter backgrounds for each isotope were determined by filteringcell-free labeled media through a membrane filter, as was done for the samplesthemselves, and subtracting the measured background from sample counts.Total isotope uptake and culture growth were expressed as net counts per minute(cpm) and optical density (OD), respectively. The experimental procedures forthe isotope incorporation as well as the fractionation experiments are outlined inthe accompanying flow chart (Figure 3-1).
Cellular Partitioning of Polonium And Sulfur
The partitioning of Po and SO4 within the bacterial culture was determinedby fractionating the cells using a modification of the methods of Schneider (1945;
1946), Burrous and Wood (1962), and Gray and Thurman (1967). At variousstages during the growth cycle, cells in 10 mL subsamples were harvested bycentrifugation (4500 x g for 30 minutes at 4°C) and washed once in a 0.85% NaCl-1mM EDTA solution. The cells were resuspended in 5 mL tris buffer (pH 7.8) andlysed with lysozyme (10 mg/mL, Sigma Chemical Co., L6876, St Louis, MO) and a
3-4

Experimental Procedure
Culture and
Isotope
I
Uptake Fractionation Experiment Experiment
c I
I 1 Soluble Particulate
High Molecular
Weight
Protein Fraction
I 1
Fig. 3-1. Flow chart of the experimental procedures for PO and SO4 uptake and fractionation experiments.

10% sodium lauryl sulfate detergent solution. Once lysed, the suspension wascentrifuged (40,000 x g for 30 minutes at 4°C) to pellet the cell envelope, and thesupernatant containing the total cell cytoplasm was saved for further analysis.The cell envelope (pellet) and a 1 mL aliquot of the cell cytoplasm were countedfor total radioactivity. The remaining cytoplasmic material was fractionated toisolate proteins and nucleic acids to determine how the radiotracer waspartitioned intracellularly.
The high molecular weight (HMW) compounds, which include the nucleicacids and proteins, were collected by cold 10% trichloroacetic acid (TCA)precipitation from the cytoplasmic fraction. These then were washed withethanol and counted by LSC. The separation of nucleic acids from protein wasdone on duplicate samples, which were further processed by resuspending theHMW precipitate in 5% TCA and heating it for 15 minutes at 90°C to dissolve thenucleic acids and leave the insoluble protein precipitates behind. Thisprecipitate was then collected by centrifugation, washed in ethanol, and theactivity measured by LSC.
Experimental Controls
The inhibition of the production of bacterial proteins by the addition ofchloramphenicol was chosen as an experimental control. Chloramphenicolblocks protein synthesis by inhibiting peptide chain elongation. A 150 mg/Lsolution was added to growth flasks at the middle of the log phase(approximately 16th hour of growth) and the culture incubated for another hour,after which radiotracer was added to the respective flasks. The chloramphenicol-treated samples were analyzed for uptake and isotope fractionation along withthe experimental cultures as detailed above. All uptake and fractionationexperiments, together with their respective controls, were run in duplicate andthe results averaged. The average coefficient of variation between duplicatesamples for 35SOd and 208Po were 0.18 and 0.11, respectively.
RESULTS AND DISCUSSION
We conducted comparative radioisotope uptake and cellular fractionationexperiments to determine if polonium behaved similarly to sulfur and enteredinto the bacterial metabolic cycle. Theoretically, both isotopes could be reducedand incorporated into bacterial proteins if Po does mimic sulfur. However, thissimple model may be complicated by two factors. First, Pod+ differs from theSO$- molecule in its overall charge and consequently its reactivity in solution.Polonium is highly surface reactive and in trace concentrations will adsorb ontoany negatively charged surface (Bagnall, 1957), whereas 35SO4 will not. Thisdifference in the adsorptive quality of polonium presents an alternatemechanism (i.e., passive adsorption) by which it may be removed from the
3-5

solution. Secondly, the chemical concentration of Po in the growth medium wasorders of magnitude lower (lo-14M) than the sulfate concentration (1.7 x lo-4M),and thus our experiments were restricted to a comparison of the patterns ofisotopic uptake and cellular partitioning of the two elements.
Polonium and Sulfate Incorporation Experiments
At selected intervals within the bacterial growth cycle subsamples of labeledculture (either 35SO4 or 208Po were filtered to determine the temporal changes in)isotope uptake by the bacteria (Figure 3-2). Four percent of the total 35sO4available in the medium was associated with the cells by the onset of thestationary phase (Fig. 3-2a). A mass balance of the cell-associated 2osl?o (filter) andthe 2osPo remaining in solution (filtrate) indicated that approximately 35% of the208Po added to the culture medium was unaccounted for and presumably lost toadsorption onto the growth flask. However, of the 208Po remaining in solution,96% was cell associated by the late log phase (OD=0.4 in Fig. 3-2b). The shapes ofthe isotope uptake and optical density curves revealed that incorporationessentially paralleled culture growth for sulfate (Fig. 3-2a), whereas Po.incorporation (Fig. 3-2b) preceded exponential growth and 50% of the availablePo had been removed from solution by the early log phase (O.D.=0.15).
This difference in incorporation patterns between SO4 and Po can be seenmore clearly by plotting the cell-associated radioactivity against bacterial numbers(Figure 3-3). There is a direct relationship between the number of cells in theculture and the quantity of 35s retained by the bacteria. Uptake of SO4 wasdirectly proportional to cell number during both the lag and exponential growthphases. Polonium, however, behaved very differently. Polonium displayed twoapparent rates with uptake more rapid during the late lag phase (slope=2.4) andslower during exponential growth (slope=0.7). At low cell numbers (Log CellNo=7.5-7.8, in Fig. 3-3) Po was scavenged from solution until approximately 50%of the PO had been removed and was associated with the bacteria. As the culturegrew the rate of the Po removal declined, reflecting almost complete depletion ofthe element from the growth medium.
The differences in Po uptake rate can be explained on the basis of theelement’s surface reactivity and the negative charge associated with the bacterialcell wall. The cell walls of gram negative bacteria are characterized by a highlipid content which, when the pH is greater than 4, imparts a negative charge tothe bacterial surface (Lamanna and Mallette, 1965; Richmond and Fisher, 1973;Doyle et al., 1980; Urrutia et al., 1992). As the number of bacteria in the culturebegin to increase, they provide negatively charged surfaces that willpreferentially scavenge Po until it is totally removed from solution. Theinteraction between Po and bacteria appears to be a two-step process in which Pois first adsorbed onto the cell surface, and then (as will be shown later) processed
3-6


internally by the organism.
The question now arises as to whether Po is processed further by the cell forprotein synthesis as is the case for sulfate. Uptake and incorporation of Po bymarine microbiota (i.e., bacteria and algae) have been reported for oceanicsystems, although the mechanisms involved are not well understood (Fisher etal., 1983; Heyraud and Cherry, 1983; Bacon et al., 1988). Fisher et al., (1983)investigated the relationship between marine algae and polonium and notedthat while Po may initially adsorb to cell surfaces, the relatively uniformdistribution of Po in various cell fractions was reflective of eventual cellularincorporation.
In order to assess the possibility of Po incorporation into cellular proteinswe added chloramphenicol to control samples during early exponential growth(hour 16, in Figure 3-4) to block protein synthesis and then followed its effect onculture growth and isotope uptake (Figure 3-5). Culture growth was negligiblefollowing the addition of chloramphenicol (Fig. 3-4). The OD in control flasksincreased from 0.16 to 0.20, reflecting approximately one population doubling, ascompared to the experimental sample increase of 0.15 to 0.45 (more than 4population generations). The addition of chloramphenicol surpressed SO4uptake and curtailed culture growth (final OD=0.28 in Fig. 3-5a compared to anOD=0.45 in Fig. 3-4 for untreated samples) as is reflective of blocked proteinsynthesis. Only 0.17% of the total available SO4 was taken up by cells in thecontrol flasks as compared to 4% in the experimental flasks. In sharp contrast toSO,, Po uptake by the chloramphenicol treated culture continued to the pointwhere 58% of the polonium in solution was associated with cells by 22 hr and71% after 24 hr (Fig. 3-5b). The distinctly different effects of chloramphenicol onSO4 and Po uptake further supports our hypothesis of a two-step mechanism forPO removal from solution, namely Po scavenging by negatively-charged bacteriafollowed by physiological processing.
Cellular Partitioning of Polonium and Sulfate
Cells were fractionated into their various cellular components to (1)determine where the cell-associated polonium ultimately resides, i.e., cellenvelope, cell cytoplasm, or cell proteins; and (2) determine how the patterns ofpolonium incorporation compared to that of sulfur. Since sulfur is a constituentof the amino acids cysteine and methionine and is primarily incorporated intocell proteins, it was hypothesized that bacterial cometabolization of poloniumwith sulfur would result in a similar intracellular cell distribution for 35SO4 and2aPo with a fraction of each isotope associated with cell proteins. Alternatively,if polonium uptake was the exclusive result of passive adsorption to the bacterialsurfaces then the majority of the isotope would be expected to be found in thecell envelope fraction.
3-7


At selected time intervals within the bacterial growth cycle, aliquots of thelabeled culture (either SO4 or Po) were removed and the cells fractionated into (1)cell envelope, (2) cell cytoplasm, (3) a high molecular weight fraction consistingof nucleic acids and proteins, and (4) the protein fraction alone. Theexperimental procedure dictated that first both nucleic acids and proteins bejointly separated from the cytoplasmic material. However, no statisticaldifferences for the activities of the HMW fraction and the protein fraction(p=.433, Wilcoxon Rank Sum Test) were found. This was not surprising sincesulfur is not a component of nucleic acids. Hence, the data from the HMW andprotein fractions were pooled, averaged, and expressed cumulatively as the“protein fraction” since proteins (not nucleic acids) were the presumed cell targetfor both SO4 and Po. Also, because proteins were extracted from the cellcytoplasm, that activity associated with the proteins has been accounted for andthe activity in the cytoplasm has been expressed as cytoplasm less the cellproteins.
The cellular distribution of SO4 and Po in late stationary phase cells (hour40) has been summarized in Table 3-1 for both experimental andchloramphenicol treated controls. Although the total cellular radioactivity ofexperimental samples was more than ten times greater for SO4 labeled cells(28,600 cpm) than for the cells labeled with Po (2250 cpm), the cellularpartitioning patterns were similar for both isotopes (Figure 3-6, Table 3-1). In theexperimental samples both sulfur and polonium were approximately evenlydistributed between the cell envelope (46% SO4,47% PO) and the cytoplasm (49%SO4, 40% Po) with a small fraction associated with the cell proteins (5% SO4, 13%Po).
The chloramphenicol treated samples also exhibited similar distributionpatterns for SO4 and PO (Fig. 3-6b) even though the uptake for each isotope wasdramatically different (i.e., SO4 uptake essentially ceased but Po uptakecontinued, Fig. 3-5). In the control samples, SO4 and Po were associated almostexclusively with the cytoplasm (88% SO4, 85% Po) and very little isotopeassociated with either the cell envelope (0.01% SO4, 6% Po) or the proteinfractions (11% SO4, 7% Po). While chloramphenicol blocked polypeptideformation, it is possible that the viable cells (see Fig. 3-4) were still capable oftaking up and storing protein precursors in cytoplasmic pools in an attempt tosynthesize proteins (Gottlieb and Shaw, 1967). It was therefore not surprisingthat the label (either 35SO4 or 2mPo) in the control samples was predominantlyassociated with cell cytoplasm. Another important point to note is that afterchloramphenicol was added to the control samples, the cultures went throughone additional doubling before cell growth was inhibited (Fig. 3-4). This couldexplain why a small fraction of isotope was found associated with the cellproteins in both 35SO4 and 208Po controls. Of primary significance, however, was
3-8

TABLE 3-l Cellular partitioning of 35SO4 and 2@Po in stationary phase cultures.
Isotope/ Cell number Total cellular Envelope activity Cytoplasma activity Protein activity
treatment analyzed radioactivity (cpm) cpm IL s.d. % total cpm A- s.d. % total cpm + s.d. % total
35S04 (EXPb) 5.90E+09 28,610 13,300 42000 46% 13,900 + 1020 49% 1,410 +290 5%
35S04 (CON9 3.40E+08 2,040 30+20 1% 1,780 k 270 88% 230 + 90 11%
20%‘o (EXPb) 1.20E+lO 2,250 1,050 Ik 220 47% 900 Ik 220 40% 300 IL 120 13%
208Po (CONC) 7.10E+08 2,180 130 4 30 6% 1,890 f 90 85% 160 +_149 7%
a cytoplasm less protein fraction
b experimental sample
c control sample

SULFUR-35 POLONIUM-208
CELL FRACTION
SULFUR-35 POLONIUM-208
CELL FRACTfON
Fig. 3-6. Cellular distribution patterns of SO, and PO for: (A) experimental; and (B) chlorampheni,col-treated samples taken during the late stationary phase of culture growth. Error bars represent the standard deviation from the mean between duplicate samples.

that the cellular distribution patterns of both %Od and 208Po were similar toeach other in all treatments even though there were dramatic differences in thecellular partitioning between the experimental and chloramphenicol-amendedsamples.
SUMMARY
The findings reported here suggest that although the initial uptakemechanisms of sulfur and polonium may differ (Figs. 3-2, 3-3, and 3-5), similarmechanisms appear to govern their fate within bacterial cells. Whether or notsulfur and polonium are cometabolized has not been resolved by theseexperiments. The similarity in the partitioning patterns of 3%0* and 208l?o,however, does suggest that polonium may undergo assimilatory reductivereactions similar to those of sulfur. This implies that Po could be reduced indissimilatory processes and could explain, for example, how Po is mobilizedfrom phosphate rock or phosphogypsum and occasionally attains the highgroundwater concentrations such as are found in parts of west central Florida. Inaddition, the uptake experiments reported here show that bacteria may be veryeffective in removing Po from aqueous solutions. This opens the possibility thata bioremediation scheme could be devised for Po decontamination of domesticor process waters.
3-9

CHAPTER 4
BACTERIAL MOBILIZATION OF POLONIUM
INTRODUCTION
High levels of alpha-emitting radionuclides of the uranium decay series incentral Florida groundwater taken from the surficial aquifer have been reported(Burnett et al., 1987). Of particular interest was the finding that in some areas 210Poaccounted for virtually all of the activity in the complete absence of its radiogenicpredecessors %l?b and 21oBi. Levels of 1,000 dpm/l or more have been reported, incontrast to the few dpm that are ordinarily encountered in most radiochemicalsurveys (Krishnaswami et al., 1982; Hess et al., 1985). Polonium is the last memberof the 23&J decay series and is produced from the decay of 21@b via 21oBi. Little isknown about Po geochemistry other than that the element has two oxidation states(+2 and +4) and that it will react with sulfide to form PoS2 (Bagnall, 1957).Polonium is also particle-reactive, a property that has been used to study removalmechanisms of metals in lakes and seawater. Reports dealing with Po in seawatersystems indicated that 21?l?o/21@b range from about 0.2 to 1 and that the ratioappeared to be affected by biological productivity and upwelling (Harada et al., 1989).
In previous experiments (Harada et al., 1989), we demonstrated that Po lossfrom a ground water sample paralleled the growth of the microbial consortium inthat sample and that Po appeared in the particulate phase as it was removed fromsolution. Sulfide also was lost, and the implication was that sulfide oxidizingbacteria affected the loss of both sulfide and Po. The simultaneous occurrence ofsulfide and Po in groundwater, the concurrent removal of both by bacteria underaerobic conditions, and the fact that Po and sulfide may behave in a chemicallysimilar manner (both are in the same column in the periodic table) suggested thatfactors affecting sulfur cycling could also affect Po availability.
4-1

The uranium-containing phosphorite deposits in central Florida serve as theraw material for the manufacture of fertilizers and phosphoric acid, obtained bytreating phosphate rock with sulfuric acid. Consequently, the single largest regionalsource of sulfur in central Florida is the sulfate which is tied up in phosphogypsum,a by product of phosphoric acid manufacture. There is currently over 600 millionmetric tons of phosphogypsum in Florida with another 30-40 million tons beingadded each year. All this material is stockpiled because the relatively high contentof radionuclides (primarily 226Ra, 21OPb, and 210Po) and other impurities makes thegypsum unsuitable for construction or other purposes.
Since sulfate reducing bacteria (SRB) are known to be able to use the sulfatemoity in gypsum in their normal metabolic activity (Ehrlich, 1990), our hypothesiswas that SRB, and possibly other bacteria, could use some component of the gypsumdirectly (e.g., sulfate in dissimilatory reduction), or otherwise breakdown gypsumand by so doing release (solubilize) Po in the process.constructed plastic columns
To test this theory wethat were filled with sterile phosphogypsum
(henceforth referred to as gypsum), and by varying the microbial consortia added tothese columns and the attendant redox conditions, we were able to demonstrate adirect bacterial involvement in Po solubilization.
MATERIALS AND METHODS
Experimental Rationale
Gypsum is a very delicate material whose physical treatment can producedrastic and highly variable experimental results. When freshly collected, gypsumcontains a substantial microbial population (about 10’ cells/g) which were found todie off upon storage of the material over a six to eight month period. In our earlyexperiments, variations in the microbial assemblage, particularly the SRB, led toerratic results. We had no way of maintaining consistency in the microflora overthe time frame required between experiments. We also experienced considerabledifficulty in arriving at suitable sterile experimental controls. All efforts at drying orautoclaving gypsum served only to decompose or otherwise alter the material itself,which again led to unpredictable results. Ultimately, 6oCo irradiation (a 1.8 megaraddose administered over a 24 hr. period) yielded a sterile and stable product suitablefor our purposes.
Since variation in the natural gypsum microflora would unpredictably affectexperimental outcome, we decided to isolate a number of bacterial cultures fromfreshly collected gypsum samples and to then add these cultures back to sterilizedgypsum to insure consistency of the bacterial consortia and inoculum size betweenexperiments. In this manner, we were also able to illustrate the role of SRB bycomparing systems to which they had been added to ones in which they wereomitted.
4-2
Although the radionuclide levels are of environmental concern, the amountof *1oPo in gypsum is such (40-60 dpm/g) that it is necessary to use relatively largequantities, and to carry out the experiments over extended periods of time in orderto measure releases at reasonably precise levels. The only practical approach thatencompasses these requirements is the use of percolation columns that allows forthe continual introduction of nutrients and the removal of Po-enriched spentmedium.
Bacterial Culture Isolation and Maintenance
Phosphogypsum was collected in five gallon containers from an abandonedstack belonging to IMC Fertilizer Inc., Mulberry, FL. A culture medium (PYE) wasused to both isolate the bacterial cultures and serve as a growth medium in thecolumn experiments that contained peptone (0.08%), yeast extract (0.02%) andmineral salts (inorganic salts, g/l: Na+#O4, 0.02; NH&l, 0.25; NaCl, 1.0; MgC12.6H20,0.4; KCl, 0.5; CaC12’2H20, 0.07 and KH$‘O4, 0.10: trace metals, µg/l: MnC12, 0.1;COC~~*GH~O, 190; ZnSO4*n-I,O, 144; H3BO3, 6.0; NiQ6H20, 24.0; CuC12*2H20, 2.0;Na2Mo04.2H20, 36.0; FeC13’6H20, 1600). When SRB were used in columnexperiments sulfate was eliminated from the medium so that the gypsum itselfcould serve as the sole sulfate source in the system. When a solid medium wasneeded for isolation and culture maintenance, agar was added for a finalconcentration of 1.5%.
A total of four bacterial cultures were isolated under aerobic conditions byshaking freshly-collected gypsum in a mineral salts diluent, surface streaking platesand incubating the samples at room temperature in the laboratory. A SRB culturewas isolated by filling screw cap tubes (16 x 150mm) with PYE medium, includingsulfate, adding gypsum and allowing the mixed community to develop. Subcultureswere taken from those tubes that had blackened (indicating FeS formation) andsmelled of sulfide and transferred to sulfate API broth medium (Difco Laboratories,Detroit, MI) contained in screw cap tubes (16 x 150mm). As the SRB developedsamples were taken and used to inoculate sulfate API plates that were thenincubated anaerobically in a GasPak system (BBL, Cockeysville, MD). Single colonieswere selected for repeated culturing until a pure culture was obtained.
For the column experiments all four of the aerobically-isolated cultures weregrown on PYE plates, harvested and mixed together in equal proportions yielding amixture henceforth referred to as BACT. Two mL of BACT suspension were addedto each column and yielded a final cell density of approximately 107 bacteria pergram of gypsum, which was comparable in size to the naturally occurring bacterialcommunity found in the gypsum stacks. The SRB, when needed, were grown in thePYE broth and 2 mL of the suspension added to each column.
4-3

Column Construction
The use of percolation columns enabled us to use a large mass of gypsum,between 100 and 300 g depending on the column size, which was an importantconsideration since the Po activity for the gypsum used was only 42 dpm/g. In thoseexperiments in which we added cultures to sterile gypsum, 19mm ID polystyrenecolumns filled with 100g gypsum were used because of the limitation on theirdimensions imposed by. the @Co irradiator used for sterilization. Whenunsterilized gypsum containing natural microflora were used in experiments(either in conjunction with or without BACT or SRB) 30-mm diameter polystyrenecolumns were filled with 300g of gypsum.
In all but two of the experiments described, the gypsum was first sterilized byirradiation (1.8 magarads) and the appropriate bacterial cultures were subsequentlyadded. This approach was necessary since we found that the native microflora diedas the gypsum aged which in turn introduced unexplained variation betweenexperiments. Admittedly adding bacteria to sterile gypsum does not accurately depictnatural processes, but it does afford a high degree of control in our experiments sothat interactions between microbes and Po could clearly be demonstrated. Inparticular, this approach was the only way to delineate the role of SRB.
Aside from their dimensions, the large and small percolation columns wereconstructed in an identical fashion. The bottom was plugged with a rubber stopperthat had a 1-cc plastic syringe barrel pushed through it that served as an outflownozzle. The tip of the syringe was opened slightly to facilitate fluid flow, but underexperimental conditions the syringe always held some of the exiting medium thatserved as a barrier to prevent air from entering. Above the rubber plug was placed 5cm of Teflon lathe turnings (obtained from a machinist who worked with thematerial) that served to support the gypsum and promote the flow of spent mediumout of the column. Next, gypsum was added to within 5 cm of the top of thecolumn and a second stopper inserted that contained two short glass tubes throughwhich medium, air or an inert gas (either hydrogen or nitrogen were used) could beintroduced. The nutrient media was pumped through the column at a rate of 65mL/day using a Harvard Apparatus peristaltic pump. Air and Hz-N2 were firstpassed through cotton filters and then into the columns in order to preventflooding and either prevent anoxia (air) or promote anoxia (Hz-N*).
Polonium and Sulfide Analysis
The procedure for Po analysis was that of Harada et al. (1989). Columneffluents were collected over one (65 mL), two (130 mL) or three (195 mL) dayperiods and one mL of concentrated HCl added to the sample containers, whichwere stored until assayed at the end of the experiment. Each analysis began byadding one mL of a 209Po tracer (22.2 dpm/mL) to a known volume (depending onthe duration of sample collection) of column effluent in 250 mL Teflon beakers.
4-4

The samples were digested by adding concentrated HCl (2 mL) and 60% perchloricacid (2 mL) and evaporating to dryness on hot plates. The residue was dissolved in2.5 mL HCl, 1 g of hydroxylamine hydrochloride and 0.1 g of ascorbic acid were thenadded and the mixture diluted to 50 mL with distilled water. A 25-mm diametersilver disk (M10331, United Mineral and Chemical Co., Lyndhurst, NJ) that had beencovered on the back side with plastic electrical tape, was placed in the digest solutionand the 209Po and 21OPo allowed to self-plate onto the front of the disk for threehours at a temperature of 85 - 90°C. After plating the disk was rinsed with distilledwater and counted in an a-spectrometer.
Sulfide analysis was performed according to the method of Cline (1969) on 2mLaliquots of column effluent as needed.
RESULTS
The first experiment performed was to determine if bacteria had any effect onPO release from gypsum. Columns were set up that had the following treatments:(1) freshly-collected gypsum; (2) sterilized gypsum to which BACT and SRB wereadded; (3) unsterilized gypsum to which BACT and SRB were added; and (4) asterilized, uninnoculated control. Results are reported either as the cumulative POreleased (Figure 4-1), since this is how gypsum newly added to a storage stack wouldbehave, and as a daily release rate (Figure 4-2) which illustrates the temporalsequence of release after bacteria were added, or other treatments begun.
Medium was first pumped through the columns for seven days, after whichbacteria were added to two of the columns and PO release monitored for a total 25days. Before examining the bacterial effects, it is important to note that the sterilizedcontrol shows some Po release which is most pronounced in the first day of theexperiment (Fig. 4-2). We assume that this apparent release is associated with fineparticles that passed the teflon turnings at the bottom of the column.
The general conclusions from this experiment are that bacteria do affect asignificant enhancement in PO release, whether the column is simply flushed withmedium and the natural microflora allowed to proliferate (Fig. 4-1, solid squares) orwhether amended with laboratory grown cultures (Fig. 4-1, open squares). Theaddition of bacteria to the sterilized gypsum at day 7 yielded a dramaticenhancement of PO release (Fig. 4-1, open diamonds), as did the addition of bacteriato untreated gypsum (Fig. 4-1, open squares). The effects of SRB became evident byday 10 when the two columns to which they had been added turned black.
The daily Po release showed a dramatic increase resulting from the addition ofbacteria at day seven, but then decreased at the time when the column turned blackbecause of the presence of FeS. Since Po also reacts with sulfide to form PoS2(Bagnall, 1966), or could presumably co-precipitate with FeS, the presence of elevated
4-5

0
CU
MU
LATI
VE
P
O-2
10 R
ELE
AS
ED
, dp
m/l
0
s 0 0
h3
2s
0


sulfide might actually serve to prevent Po mobilization and migration fromgypsum. Thus, the effects of SRB on Po solubilization is mixed. SRB apparently canuse the sulfate moity in gypsum and mobilize Po in the process. Althoughdestroying the gypsum would facilitate Po release, the sulfide produced by SRBmetabolism could serve to precipitate Po under appropriate conditions.
In an effort to further elucidate the role of SRB, a series of columns wereprepared in which the BACT mixture was added to sterilized gypsum, either aloneor together with SRB. Duplicate columns of each microbial mix (two columns eachof BACT and two of BACT plus SRB) were prepared and air pumped through one ofeach paired column in an effort to prevent fluids from accumulating and at thesame time raise the redox level. The anticipated effect was to retard SRB and fosterauto-oxidation in the air-purged columns relative to their unpurged companions.Initially, both columns with SRB showed the most rapid PO release until day 10when the column without air turned black indicating the formation of FeS (Figure4-3, open diamonds). The companion column (purged with air) did not blacken andcontinued to release Po for the remainder of the experiment (Fig. 4-3, soliddiamonds).
The columns that contained the BACT mixture alone (no SRB) also mediatedenhanced Po release (Fig. 4-3, open and solid squares). Again the air-purged columnafforded more extensive Po solubilization than did the unventilated column.
The daily Po release rate for the SRB columns was essentially identical for thefirst 10 days, but after FeS appeared (and presumably PoS) the unventilated columnhad a dramatic reduction in Po release to a rate of approximately 1 dpm L-1 Day-l,equivalent to the sterilized control (Figures 4-4 and 4-5). In contrast, the air-purgedcolumn continued to release Po at a significant level. The daily release rates for theBACT mixtures and the control indicate decreasing activity in the order BACT plusair, BACT and control. Exponential regression curves of the type y = Be-mt were fitto the daily release data to provide further quantification of these observations. Inthis instance B would represent the initial release, -m would be equivalent to arelease rate constant, and t is elapsed time. Of primary concern is the rate constant -m, since it determines just how long and to what extent Po will be mobilized underthe specific experimental conditions. From the data in Table 4-1 it is apparent thatthe passage of air through the columns facilitated Poirelease to an equivalent degreewhether SRB were present or not (-m = 0.026). In contrast, the presence of SRBunder more anoxic conditions appears to bind Po (-m = 0.060) thus affording evenless mobilization than observed with sterile gypsum alone (-m = 0.050). Theseresults indicate that bacteria, including SRB, do in fact mediate Po dissolution fromgypsum, but the process is affected by redox conditions and sulfide levels.
In the previous experiment it was evident that SRB potentially play a majorrole in Po mobilization, depending on the level of sulfide produced in the course oftheir metabolic function. In an effort to quantify the effects of SRB still further, we
4-6


Table 4.1. Removal rate constants for poloniuma.
Column Removal Rate Manipulation Constant c-m>
BACT + SRB + Air BACT + SRB BACT + Air BACT Control
- 0.026 - 0.060 - 0.026 - 0.041 - 0.050
a An equation of the type, y = B x e-mt was fit to the daily release data. In this equation, y indicates PO released (dpm day-l), B is the initial release, -m is the removal rate constant, and t is the elapsed time (days).

performed a experiment in which SRB activity would either be promoted orhampered and the effects of SRB activity determined by changes in Po and sulfidereleased from the columns. In a closed or strongly reducing environment, SRBshould rapidly develop and sulfide levels would be expected to reach elevatedconcentrations, whereas the introduction of air would at least serve to reduce thesulfide level, as well as raise the overall redox conditions within the gypsum bypreventing flooding. Under such a regime we would expect to see very little POreleased in the strongly reducing environment with active SRB, if Po is scavengedby insoluble sulfides. Furthermore, measuring sulfide and Po contained in thecolumn effluent would provide some index of how these elements interacted.
Columns of sterile gypsum were thus prepared with the followingamendments: (1) the BACT consortium was added followed by air purging; (2) theBACT consortium plus SRB were added followed by air purging; (3) the BACT plusSRB were added followed by purging with either hydrogen or nitrogen; and (4) acolumn was run unamended to serve as a sterile control. The outcome of thisexperiment (Figure 4-6) clearly indicated that the complete bacterial mixture,including SRB, when purged with air affords the greatest polonium solubilization.The air-purged bacterial mixture (without SRB) had the second greatest poloniumrelease followed by the sterile control and finally the anoxic column with SRB.Sulfide measurements of the column effluents (Table 4-2) revealed that thehydrogen/nitrogen purged column contained 30-fold more sulfide than the air-purged SRB column indicating that the SRB were active under both conditions.The elevated polonium release in the air-purged SRB column relative to the air-purged bacteria column (a 40% increase in polonium when SRB are present) furtherindicated that SRB do actually participate in polonium solubilization and thatpolonium is free to migrate through the column provided the sulfide concentrationis maintained at very low levels (<10µM). If it is assumed that the same processesare taking place in the hydrogen/nitrogen column, then we can conclude that highsulfide concentrations serve to scavenge polonium and may in fact afford amechanism to remove polonium from stack effluent or the groundwater. The dailyrelease rates of polonium from the anoxic SRB column are even less than those ofthe sterile control once the sulfide levels have risen (Figure 4-7).
The experiments described to this point all involve the addition of cultures tosterilized gypsum in order to demonstrate the ability of bacteria to affect poloniumsolubilization. These experiments only establish the potential for such a process anddo not address the extent to which it may occur in the environment. In order toarrive at an approximation for polonium dissolution by the native gypsummicroflora, fresh gypsum samples were collected and immediately packed into a setof columns and transported back to the laboratory where the following experimentswere begun within three days: (1) groundwater (pH 6.8), collected from the same site,was pumped through the gypsum; (2) the same nutrient solution as used ourprevious laboratory experiments was passed through the gypsum; and (3) thiscolumn was sterilized and fed autoclaved groundwater. The results (Figures 4-8 and4-9) indicated that there was little difference between the sterile control and the
4-7


Table 4.2. Sulfide concentration (pM> in each column.
Elapsed Bact. t SRB Bacteria Bact. + SRB Control Days & H2/N2 gas & aeration & aeration
5 260.58 3.15 7.95 BDL 7 215.32 BDLa 8.94 BDL 9 226.64 0.32 5.38 BDL
11 198.35 BDL BDL BDL 13 215.32 BDL BDL BDL
%DL indicates below detection level.


untreated gypsum when the columns were pumped with groundwater, althoughthe daily release rate for the freshly-collected gypsum did increase by day 16.However, when the gypsum was fed a nutrient-rich solution there was a significantincrease in polonium release that had been mediated by the natural microflora.These findings confirm the results from our previous experiments, namely, thatbacteria do mediate Po release when their growth is fostered and further suggest thatpolonium dissolution may be a fairly widespread property among the regionalmicroflora provided there is an adequate nutrient source. We have no way ofknowing the nutritive value of the process waters and other solutions that passthrough the gypsum stacks but this experiment suggests that by making substrateresources available, the natural microflora will mediate significant poloniumreleases.
Several years prior to the current research effort we measured bacterialcommunity growth rates in groundwater collected from a shallow monitor wellknown to have elevated (>1000 dpm) 21oPo activities (Harada et al., 1989). Growthrates were determined by a pulse labeling technique (LaRock, et al., 1988) over a oneyear period between 1988 and 1989 in order to assess growth potentials. Thereciprocal of community doubling time (multiplied by 100 to provide a index ofgrowth) was compared to temporal changes in 21oPo concentrations and the averageannual rainfall for the area (Figure 4-10). During the period between Sept. 1988 andMarch 1989 there was a decline in the groundwater community growth to the pointwhere the growth rates become zero or negative indicating that the population wasunable to sustain itself and was in a state of decline. This same period coincidedwith a annual minimum in rainfall and a simultaneous reduction in groundwaterPo concentrations. As rainfall increased in March 1989, the groundwater bacteriabecome active again and there was a concomitant increase in Po levels. We cannotstate unequivocally that bacteria were the sole cause for the observed changes inground water Po, but in light of the findings in this paper, bacteria will in somemeasure alter Po levels provided their growth is facilitated.
DISCUSSION
We conclude from these experiments that: (1) bacteria are capable of releasingpolonium from the gypsum matrix in which it is bound; (2) SRB enhance poloniumrelease provided the sulfide levels resulting from their metabolism do not becomeexcessive, i.e., remain below approximately 10 µM; and (3) naturally-occurringmicroflora will serve to mobilize polonium depending upon the nutrient resourcesmade available to them.
The finding of Po as the sole a-emitting nuclide, accompanied by low sulfideconcentrations, in some ground water systems can best be explained by bacterialaction such that Po is selectively mobilized over its radiogenic parent and enabled tomigrate through the aquifer system. Since sulfide accompanies Po one logicalrelease mechanism is a direct reductive attack on the sulfate moity of gypsum that
4-8


ultimately frees PO by some undefined process. Zajic (1969) reported that microbialsulfate reduction was responsible for gypsum decomposition that resulted in therelease of dissolved Ca. Bolze et al. (1974) and McCready and Krouse (1980)demonstrated that SRB were capable of utilizing barite, and Fedorak et al. (1986)reported on the release of Ba and z26Ra from a Ba-Ra sulfate sludge accompanied bythe production of sulfide. The ability of bacteria to incorporate Po into cellularprotein has also been demonstrated (J. Cherrier, Master’s thesis, Florida StateUniversity, 1992; Cherrier, Burnett and LaRock, 1994) indicating at least a potentialfor assimilative Po reduction and a biochemical role analogous to that of sulfur. It isnot unreasonable in light of the findings we present here, to suggest further that Poundergoes a dissimilatory reduction that facilitates its solubilization and migrationthrough ground water in a manner similar to sulfate reduction.
An important controlling factor appears to be the availability of nutrients to thebacterial community. When we added organic substrates to the native assemblage(Fig. 4-8) Po release began immediately. Similarly, field measurements revealed adirect relationship between bacterial growth and Po levels that coincided with theannual rainfall pattern (Fig. 4-10). Since water is the primary vehicle fortransporting nutrients through soils it is not unreasonable that rainfall should exerta controlling influence on microbially mediated Po release.
In all of our experiments we noted a decline in the daily Po release rate as theexperiments progressed. The gypsum used had been stored in the stockpile for overa decade before we collected material for use in these experiments, and was verydense and compact. In preparing our columns, the gypsum was loosely added to thecylinders, but became compacted as medium flowed through this material. Thevolume was observed to decrease by as much as 15% and consequently would havethe effect of decreasing porosity and thus limiting oxygen and nutrient availabilityboth of which serve to reduce Po solubilization to some lower, but steady leveldepending on physical and nutritional conditions.
In our experiments with SRB we found an enhancement of Po release only inthose cases where we were able to maintain sulfide levels of 8 µM or so (Fig. 4-6 andTable 4-2). The work of Harada et al. and of Burnett et al. (1987) also reported highPo concentrations (on the order of 1,000 dpm/l) in the presence of sulfide levels thatwere on the order of 10 µM or less. These findings suggest that at the low levelsencountered (<10 µM) Po and S can coexist and do not precipitate. At higher sulfidelevels, it is likely that some other metal sulfide becomes important and co-precipitates Po.
While it is easy to envision a direct link between the metabolic activity of theSRB and Po utilization, different mechanisms must also be applicable if aerobic,nonspecific bacteria are capable of releasing Po. One of the more interesting aspectsof Po chemistry is that Po reacts to form complex ions in acid media. Oxalic andphosphoric acids are both known to form complexes with Po, and as such raises thepossibility of interactions with end products that are produced as a result of bacterial
4-9

catabolism. Carbonic or organic acids are produced by bacteria as are naturallyoccurring complexing agents such as carboxylic acids (Ehrlich, 1990; Silverman andEhrlich, 1964). Our present effort offers no definitive explanation on how the BACTmix affects Po solubility, but indicates only that there are mechanisms other thandirect enzymatic attack that may be operative in these systems.
Our findings also suggest that manipulation of the gypsum microflora could beused as a remediation device to prevent selective Po solubilization. Since rainwaterappears to be a principal environmental variable, it may be possible to prevent itfrom percolating through the gypsum stacks by installing impervious layers in thestacks as they are constructed. In experiments using newsprint that had been addedto gypsum we found the mixture to be almost completely impervious to liquid flow.By adding used newsprint to gypsum, at say 10 to 20 foot depth intervals, it would bepossible to economically isolate the deeper layers in storage stacks, and in so doingprevent (or retard) the microflora to such an extent that Po is no longer released.
A second mechanism which might be applied to control Po migration ingypsum stacks would be to enhance the activity of SRB. Recall in our experimentsthat those columns which were anoxic and had high sulfide levels, did not releaseany significant Po to the column effluent (Figs. 4-3 and 4-6). Interestingly, whennewsprint was added to fresh gypsum, a very active SRB population quicklydeveloped causing the mixture to blacken with FeS. Such SRB activity would notprevent Po from being released by microbes acting directly on the gypsum, but theassociated sulfide would act to effectively scavenge the Po in place.
4-10

BIBLIOGRAPHY
Aieta, E. M., J. E. Singley, A. R. Trussell, K. W. Thorbjarnarson, and M. J. McGuire.1987. Radionuclides in drinking water: An overview. AWWA April, 144-152.
Altschuler, Z.S., RS. Clarke, and E.J. Young, 1958. Geochemistry of uranium in apatiteand phosphorite. U.S. Geological Survey Prof. Paper 314-D, 90p.
Arocena, J.M., P.M. Rutherford, M.J. Dudas, 1994. Heterogeneous distribution of traceelements and fluorine in phosphogypsum by-product. Science of the TotalEnvironment, in press.
Bacon, M. P., R. A. Belastock, M. Tecotzky, K. K. Turekian, and D. W. Spencer. 1988.Lead-210 and polonium-210 in ocean water profiles of the continental shelf andslope south of New England. Cont. Shelf Res., 8, 841-853.
Bagnall, K. W. 1957. Chemistry of the Rare Radioelements, Polonium-Actinium.Academic Press Inc., New York.
Bagnall, K. W., 1966. The Chemistry of Selenium, Tellurium and Polonium. Topics inInorganic and General Chemistry. Vol. 7, Elsevier, Amsterdam, 200 p.
Ballestra, S., D. Vas, J. J. Lopez, and V. Noshkin, 1989. Intercomparison of radionuclidemeasurements in marine sediment sample IAEA-306. International Laboratory ofMarine Radioactivity Report No. IAEA/AL/013, Monaco.
Becker, P., 1989. Phosphates and Phosphoric Acid -- Raw Materials, Technology, andEconomics of the Wet Process, 2nd Edition. Marcel Dekker, Inc., 740 p.
Benoit, G., and H. F. Hemond. 1987. A biochemical mass balance of 2%Po and 21@b inan oligotrophic lake with seasonally anoxic hypolimnion. Geochim. Cosmochim.Acta, 51:1445-1456.
Bolch, W.E., N. Desai, C.E. Roessler, and R.S. Kautz, 1978. Determinants of radon fluxfrom complex media: virgin and reclaimed lands in Florida phosphate region.1693-1681.
Bolze, C., P. G. Malone and J. M. Smith. 1974. Microbial mobilization of barite. Chem.Geol., 13:141-143.
Brookins, D.G., 1988. Eh-pH Diagrams for Geochemistry. Springer-Verlag, New York,176 p.
Brown, L. R., Chandler, W.C., Flavin, C., Jacobson J., Pollock, C., Postel S., Starke, L.,Wolf, E. C. 1987: State of the World. New York: W.W. Norton. 268 p.

Burnett, W. C., 1988. Release of radium and other decay-series isotopes from Floridaphosphate rock. Florida Institute of Phosphate Research Report No. 05-016-059,164 p.
Burnett, W.C., Cowart, J.B., Tai, W.C., and Cable, P., 1991. Investigations of radon andradon daughters in surficial aquifers of Florida. Publ. No. 05-032-093, FloridaInstitute of Phosphate Research, 133 p.
Burnett, W.C., C. Hull, J. Young, and P. Cable, 1993. A simple self-absorption correctionfor gamma-ray counting of soils and sediments (abs.). Proceedings: 39th AnnualConference on Bioassay, Analytical, and Environmental Radiochemistry, ColoradoSprings, Colorado, Oct. 11-15, 1993.
Burnett, W. C., Hull, C. D., Cable P., Cherrier, J., LaRock, P. A. and Hyun J. 1993:Radionuclides in phosphogypsum: migration and bacterial control (abs).Proceedings of the Fourth International Conference on the Chemistry andMigration Behavior of Actinides, Charleston, S.C.
Burnett, W. C., J. B. Cowart, K. Harada, and P. A. Chin, 1987. Polonium in the surficialaquifer of west central Florida. In: Radon, Radium and Other Radioactivity inGroundwater: Hydrogeologic Impact and Application to Indoor AirbourneContamination. Lewis Publ., (ed. B. Graves), 251-269.
Burnett, W. C., LaRock, P. A., Cowart, J. B., and Hull, C .D. 1992: Microbiology andRadiochemistry of Phosphogypsum. Year-2 Report to the Florida Institute ofPhosphate Research, Bartow, FL, 78 p.
Burrous, S. E., and W. A. Wood. 1962. Enzyme distribution in membrane, cytoplasm,and nuclear fractions from Pseudomonas fluorescens. J. Bacteriol., 84, 364-369.
Carter, Jr., 0. C., and B. J. Scheiner, 1992. Investigation of metal and nonmetalmigration through phosphogypsum. In: AIME Proc. on the Sym. on EmergingProcess Technologies for a Cleaner Environment, Feb 24-27, 1992 Phoenix, AZ,(Eds. P.E. Richardson and H. El-Shall), 205-210.
Chao, T. T., 1984. Use of partial dissolution techniques in geochemical exploration.Jour. Geochemical Exploration 20: 101-135.
Cherrier, J., LaRock P. A., and Burnett, W. C. 1994. Uptake and cellular distributionpatterns of polonium by a phosphogypsum bacterial isolate. Submitted to Jour.Appl. Environ. Microbiology.
Cutshall, N. H., I. L. Larsen, and C. R. Olsen, 1983. Direct analysis of Pb in sedimentsamples: self-absorption corrections. Nuclear Instruments and Methods. 206, 309-312.
52

Cutter, G. A. 1982. Selenium in reducing waters. Science, 217, 829-831.
Cutter, G. A., and K. W. Bruland. 1984. The marine biogeochemistry of selenium: A re-evaluation. Limnol. Oceanogr., 29, 1179-1192.
Deer, W.A., R.A. Howie, and J. Zussman, 1966. An Introduction to the Rock-FormingMinerals. Longman, London, 528 p.
Doyle, R. J., Matthews, T. H., and U. N. Streips. 1980. Chemical basis for selectivity ofmetal ions by Bacillus subtilis cell wall. J. Bacteriol., 143, 471-480.
Ehrlich, L. H. 1990. Geomicrobiology. Marcel Dekker, Inc., New York.
Engineering and Mining Journal, 1993. Phosphate Rock helps feed the world. 194, 2,73.
Fedorak, P. M., D. W. S. Westlake, C. Anders, B. Kratochril, N. Mokosky, W. B.Anderson, and P. M. Huck, 1986. Microbial release of 226Ra2+ from (Ba,Ra)SOJsludges from uranium mine wastes. Appl. Environ. Microbiol., 52: 262-268.
Ferguson, F., Phosphogypsum, Report for the European Economic Commission, FinalReport to the Directorate General: DG XI for the Environmental ConsumerProtection and Nuclear Safety, C/F UNIDO 15/533 I.S., May, 1985,287 p.
Fisher, N. S., K. A. Burns, R. D. Cherry, and M. Heyraud. 1983. Accumulation andcellular distribution of 241Am, ?oPo, and 21oPb in two marine algae. Mar. Ecol.Prog. Ser. , 11, 233-237.
Flynn, W. W., 1968. The determination of low levels of Po-210 in environmentalmaterials. Anal. Chem. Acta, 43: 221-227.
Germain, P., G. Leclerc, and S. Simon, 1992. Distribution of 210Po in Mytilus Edulis andFucus Vesiculosus along the channel coast of France; influence of industrial releasesin the Seine River and estuary. Rad. Proc. Dosimetry, 45, 257-260.
Gottlieb, D., and P. D. Shaw. 1967. In Antibiotics I, mechanism of action, p.307-330.Springer-Verlag Inc., New York.
Gray, G. W., and P. F. Thurman. 1967. A membrane fraction obtained by disintegrationof cells of Pseudomonas aeruginosa . Biochim. Biophys. Acta, 135, 947-958.
Greeman, D. J., Rose, A. W., and Jester, W. A., 1990. Form and behavior of radium andthorium in Central Pennsylvania soils derived from dolomite. GeochemicalResearch Letters 17: 833-836.
5-3

Greenwood, N. N. and Earnshaw, A., 1989. Chemistry of the Elements. PergamonPress. Elmsford, New York, 133p.
Guimond, R.J., 1990. Radium in fertilizers. The Environmental Behaviour of Radium.International Atomic Energy Agency, 113-128.
Guimond, R. J. and S. T. Windham, 1975. Radioactivity distribution in phosphateproducts, by-products, effluents, and wastes. U.S. Environmental ProtectionAgency Technical Note ORP/CSD-75-3,32 p.
Harada, K. and S. Tsunogai, 1985. A practical method for the simultaneousdetermination of Th-234, Ra-226, Pb-210 and Po-210 in seawater. J. Oceanogr. Soc.Japan, 41: 98-104.
Harada, K., W. C. Burnett, J. B. Cowart, and P. A. LaRock, 1989. Polonium in Floridagroundwater and its possible relationship to the sulfur cycle and bacteria.Geochim. Cosmochim. Acta, 53: 143-150.
Hess, C. T., J. Michel, T. R. Horton, H. M. Prichard and W. A. Coniglio. 1985. Theoccurrence of radioactivity in public water supplies in the United States. HealthPhys., 48:553-586.
Heyraud, M. and R D. Cherry. 1983. Correlation of 21oPo and 21oPb enrichments in thesea,-surface microlayer with neuston biomass. Continental Shelf Research, 1, 283-293.
Horton, T. R., R. L. Blanchard, and S. T. Windham, 1988. A study of radon and airborneparticulates at phosphogypsum stacks in central Florida. U.S. EnvironmentalProtection Agency Report No. 520/5-88-021.
Hull, C. D., W. C. Burnett, P. Cable, and C. C. Yeh, 1992. U-series dating usingextraction chromatography (abs.). 38th Annual Conference on Bioassay,Analytical, and Environmental Radiochemistry, Sante Fe, New Mexico, 1-4.
Hurst, F. J. and W. D. Arnold, 1980. Uranium control in phosphogypsum. In:Proceedings of the International Symposium on Phosphogypsum, (eds. D.P. Borrisand P.W. Boody), Lake Buena Vista,, Florida, Florida Institute of PhosphateResearch, 424-441.
Hurst, F. J. and W. D. Arnold, 1982. A discussion of uranium control inphosphogypsum. Hydrometallurgy, 9: 69-82.
Ivanovich, M. and R.S. Harmon, 1982. Uranium-Series Disequilibrium: Applications toEarth, Marine, and Environmental Problems, Oxford University Press.
5-4

Keaton, H., 1987. An assessment of radiological hazards associated with the operationand maintenance of the gypsum filtration system at wet-process phosphoric acidplants. In: Proceedings of the Symposium on Natural Radiation andTechnologically-Enhanced Natural Radiation in Florida; Daytona Beach, Florida.Published by Florida Chapter of the Health and Physics Society, 302-319.
Kennedy, G. A., M. M. Soroczak, S. J. Meischen, J. D. Clayton, and J. L. Driver, 1991.Chemistry of Gypsum Pond Systems. Florida Institute of Phosphate ResearchReport, 67 p.
Key, R. M., Brewer, R. L., Stockwell, J. H., Guinasso, N. L. and Schink, D. R., 1979.Some improved techniques for measuring radon and radium in marine sedimentsand in seawater. Marine Chemistry, 7, 251-264.
Kim, K. H. and W. C. Burnett, 1983. Gamma-ray spectrometric determination ofuranium-series nuclides in marine phosphorites. Anal. Chem., 55: 1796-1800.
Kirby, H. W., and Salutsky, M. L., 1964. The Radiochemistry of Radium. Report ofNational Academy of Science. NAS-NS-3057.
Kiister, H. W., P. A Marwitz, G. W. Berger, A. W. van Weers, P. Hagel, and J.Nieuwenhuize, 1992. 21oP0, 210Pb, 226Ra in aquatic ecosystems and polders,anthropogenic sources, distribution and enhanced radiation doses in theNetherlands. Rad. Proc. Dosimetry; 45, 715-719.
Kouloheris, A. P., 1980. Chemical nature of phosphogypsum as produced by variouswet process phosphoric acid processes. In: Proceedings of the InternationalSymposium on Phosphogypsum, Lake Buena Vista, Florida (eds. D.P. Borris andP.W. Boody), Florida Institute of Phosphate Research, 8-35.
Kraemer, T. F. and P. B. Curwick, 1990. Radium isotopes in the lower Mississippi River.Jour. Geophys. Res., 96, 2797-2806.
Krishnaswami, S., W. C. Graunstein, K. K. Turekian and J. F. Dowd. 1982. Radium,thorium and radioactive lead isotopes in groundwater: Application to the in situdetermination of adsorption-desorption rate constants and retardation factors. J.Water Resour. Res., 18:1633-1675.
Laiche, T.P. and L.M. Scott, 1991. A radiological evaluation of phosphogypsum. HealthPhysics, 60, 691-693.
Lamanna, C., and M. F. Mallette. 1965. Basic Bacteriology, Its Biological and ChemicalBackground, p. 266-275. The Williams and Wilkins Company, Baltimore.
Langmuir, D. and A.C. Riese, 1985. The thermodynamic properties of radium.Geochim. Cosmochim. Acta, 49, 1593-1601.
5-5

LaRock, P.A., Schwartz, J.R., and Hofer, K.G. 1988. Pulse labeling: A method ofmeasuring microbial growth rates in the ocean. J. Microbial Methods, 8: 281-297.
Lardinoye, M.H., K. Weterings and W.B. van der berg, 1982. Unexpected Ra-226buildup in wet phosphoric acid plants. Health Phys., 42, 503-514.
Lindeken, C. L. and D. G. Coles, 1978. The radium-226 content of agricultural gypsums.In: Radioactivity in Consumer Products (eds. A. Moghissi, P. Paras, M. Carter, andR Barker), U.S. Regulatory Commission Report No. NUREG/CP-0001, 369-375.
Luther, S. M. and M. J. Dudas, 1993. Pore water chemistry of phosphogypsum treatedsoil. Jour. Envir. Qual., 22, 103-108.
Luther, S. M., 1991. The mineralogy and chemistry of gypsum based by-products ofphosphate fertilizer production. Unpubl. MS. thesis, Soil Science, Univ. Alberta,Edmonton, AB.
Luther, S. M., M. J. Dudas, and P. M. Rutherford, 1993. Radioactivity and chemicalcharacteristics of Alberta phosphogypsum. Water, Air, and Soil Poll, 69, 277-290.
May, A. and Sweeney, J. W. 1982. Assessment of environmental impacts associatedwith phosphogypsum in Florida. U.S. Bureau of Mines. Report No. 8639. 1-19.
May, A. and Sweeney, J. W. 1983. Evaludation of radium and toxic element leachingcharacteristics of Florida phosphogypsum stockpiles. U.S. Bureau of Mines.Report No. 8776. 1-19.
Mathieu, G.G., P.E. Biscaye, R.A. Lupton, and D.E. Hammond, 1988. System formeasurement of 222Rn at low levels in natural waters. Health Physics, 55, 989-992.
McCready, R. G. L. and H. R. Krouse. 1980. Sulfur isotope fractionation by Desulfovibriovulgaris during metabolism of BaS04. Geomicrobiol. J., 2:55-62.
McDonald, P., G. T. Cook, and M. S. Baxter, 1992. Natural and anthropogenicradioactivity in coastal regions of the UK. Rad. Proc. Dosimetry, 45, 707-710.
McDowell, W. J. and McDowell, B. L.,1993. Liquid Scintillation Alpha Spectrometry,CRC Press, Boca Raton, FL, 184 p.
Miller, R. L. and Sutcliffe, H. 1984. Effects of three phosphate industrial sites ongroundwater quality in central Florida, 1979 to 1980. U.S. Geological Survey WaterResources Investigations Report 83-4256. 160-84.
5-6

Moisset, J. and S. A. Lafarge, 1980. Radium removal from phosphogypsum. In:Proceedings of the International Symposium on Phosphogypsum, Lake BuenaVista, Florida (eds. D.P. Borris and P.W. Boody), Florida Institute of PhosphateResearch, 442-457.
Moisset, J., 1988. Location of radium in phosphogypsum and improved process forremoval of radium from phosphogypsum. In: Proceedings of the SecondInternational Symposium on Phosphogypsum, Miami, Florida; (ed. G.M. Lloyd),Florida Institute of Phosphate Research, 303-318.
Moisset, J., 1990. Complete removal of radium from phosphogypsum. In: Proceedingsof the Third International Symposium on Phosphogypsum, Bartow, Florida (ed.W. F. Chang), Florida Institute of Phosphate Research, 181-196.
Moore, D. G., and Scott, M. R., 1986. Behavior of 226Ra in the Mississippi River mixingzone. Jour. Geophysical Research 91: 14317-14329.
Nakayama, F.S., 1971. Calcium complexing and the enhanced solubility of gypsum inconcentrated sodium-salt solutions. Soil Sci. Soc. Amer. Proc., 35,881-883.
Narita, H., K. Harada, W. C. Burnett, S. Tsunogai and W. J. McCabe, 1989.Determination of 21oPb, 21oBi and 2190 in natural waters and other materials byelectrochemical separation. Talanta, 36: 925-929.
Nifong, G. D., 1988. Environmental aspects of phosphogypsum. Florida Institute ofPhosphate Research, unpublished manuscript, 13 p.
Nifong, G. D., 1993. Environmental monitoring of Polk and Columbia countiesexperimental phophogypsum roads. Florida Institute of Phosphate ResearchPublication No. 05-033-101 manuscript, 120 p.
Pennders, R H. J., H. W. Kiister, and J. F. Lembrechts, 1992. Characteristics of 21?Po and21oPb in efflents from phosphate-producing industries: a first orientation. Rad.Proc. Dosimetry, 45, 737-740.
Reed, M. H., 1982. Calculation of multicomponent chemical equilbria and reactionprocesses in systems involving minerals, gases, and an aqueous phase. Geochem.Cosmochem. Acta, 46, 513-526.
Reed, M. H. and N. F. Spycher, 1984. Calculation of pH and mineral equilibria inhydrothermal waters with application to geothermometry and studies of boilingand dilution. Geochem. Cosmochem. Acta, 48, 1479-1492.
Richmond, D. V., and D. J. Fisher. 1973. The electrophoretic mobility of micro-organisms. Adv. Microb. Physiol., 9, 1-27.
5-7

Riggs, S.R., 1979. Phosphorite sedimentation in Florida - a model phosphogenic system.Economic Geology, 74, 285-314.
Roessler, C.E., J.A. Wethington, and W.E. Bolch, 1978. Radioactivity of lands andassociated structures. Natural Radioactivity Studies, 3, 56-98.
Roessler, C. E., 1984. The radiological aspects of phosphogypsum. In: Proceedings ofthe Seminar on Phosphogypsum, Miami, Florida Institute of Phosphate Research,11-36.
Roessler, C. E., 1988. Radiological assessment of the application of phosphogypsum toagricultural land. In: Proceedings of the Second International Symposium onPhosphogypsum, (ed. G.M. Lloyd), Miami, Florida; Florida Institute of PhosphateResearch, 5-23.
Roessler, C. E., 1990. Control of radium in phosphate mining, benefication, andchemical processing. In: The Environmental Behaviour of Radium, v. 2,International Atomic Energy Agency, Vienna, 270-279.
Rutherford, P.M., Dudas, M. J., and Arocena, J. M., Radioactivity and elementalcomposition of phosphogypsum produced from three phosphate rock sources.Waste Management and Research, in press.
Rutherford, P. M., Dudas, M. J., and Samek, R. A., Environmental impacts ofphosphogypsum, a review. Sci. Total Envir., in press.
Rutherford, P. M., Dudas, M. J., and Arocena, J. M., Radium in phosphogypsumleachates, Jour. Envir. Qual., 24, 1995, 24-42.
Schmiermund, R. L., 1977. Geology and geochemistry of uranium deposits near PennHaven Junction, Carbon County, Pennsylvania, MS Thesis, Pennsylvania StateUniversity. 139p.
Schneider, W. C. 1945. Phosphorus compounds in animal tissues I: Extraction andestimation of deoxypentose nucleic acid and of pentose nucleic acid. J. BiolChem., 161, 293-303.
SENES Consultants, Ltd., 1987. An analysis of the major environmental and healthconcerns of phosphogypsum tailings in Canada and methods for their reduction.Report prepared by SENES consultants Ltd. for the Ontario Ministry of theEnvironment.
Sill, C. W. and D. G. Olson, 1970. Sources and prevention of recoil contamination ofsolid-state alpha detectors. Anal. Chem. 42: 1596-1607.
5-8
Silverman, M. P. and H. L. Ehrlich. 1964. Microbial formation and degradation ofminerals. Adv. in Appl. Microbiol., 6:153-206.
Talbot, R. W., and A. W. Andren. 1984. Seasonal variations of 210Pb and 21?l?oconcentrations in an oligotrophic lake. Geochim. Cosmochim. Acta, 48, 2053-2063.
Upchurch, S. B., C. R. Oural, D. W. Foss, and H. R. Brooker, 1991. Radiochemistry ofuranium-series isotopes in groundwater (Chemical fate of uranium-daughterradio-nuclides in recharge wells, central Florida Phosphate District), FloridaInstitute of Phosphate Research Pub. No. 05-022-092, 131 p.
Urrutia Mera, M., M. Kemper, R. Doyle, and B. J. Beveridge. 1992. The membrane-induced proton motive force influences the metal binding ability of cell walls.App. Env. Microbiol., 58, 3837-3844:
Wagman, D. D., Evans, W. H., Parker, V. B., Schumm, R. H., Halow, I., Bailey, S. M.,Churney, K. L., Buttall, R. L., 1982. The NBS tables of chemical thermodynamicproperties. Selected values for inorganic and Cl and C2 organic substances in SIunits. Jour. Phys Chem Ref Data 11, suppl 2, 392p.
Zajic, J. E. 1969. Microbial Biogeochemistry. Academic Press, New York.
5-9

APPENDIX A
Detailed Sample Descriptions

APPENDIX A Phosphogypsum, phosphate rock, and miscellaneous samples collected from fertilizer companies in Florida. Samples of Gyp-lo, Gyp 53 - 60, Ore-lo/l, Ore-10/2,Ore-53 and 54, and P-53 and P-54 were collected from the Occidental chemical plants in Northern Florida. All other samples of phosphogypsum, phosphate rock, and miscellaneous samples were collected from the Central Florida Phosphate District.
Lab Number Company Sample Notes Date Collected or Received
GYP-1
WP-2
GYP-3
GYP-4
Gyp-5/l
GypW2
Estech
U.S. Agrichemicals Mulberry
IMC New Wales
Farmland
IMC (P-21)
IMC (P-21)
Phosphogypsum Samples
Stack inactive for 10 to 20 years, sample provided by FIPR.
Stack inactive for about 10 years, sample provided by FIPR.
Sample collected - half way up stack in March 1990 and provided by FIPR.
Sample collected by Farmland personnel.
Collected from grey gypsum horizon -2 m below summit on the west flank of the stack.
Collected in the weathered white gypsum horizon near the stack summit -1 m above sample 5 / 1.
l/02/90
11/02/90
11/02/90
01/10/91
01/10/91
01/10/91

APPENDIX A (continued)
Lab Number Company Sample Notes Date Collected or Received
Gyp-6 Royster
GYP-7 Royster
Gyp-8 Royster
GYP-9
Gyp-10
Gyp-l 1
Gyp-12
Gyp-13
Gyp-14
Gyp-15
CF Industries (Bartow)
Occidental
Cargil Fertilizer
Farmland
Farmland
Farmland
Farmland
Collected from south stack; c 2 years old.
Fresh phosphogypsum collected as a slurry.
Collected from the east flank of the north stack; deposited decades ago.
Collected from inactive stack. Deposited - 1989.
Approximately weeks to months old.
Collected from active portion of the stack.
South flank, - 10 m above base of stack.
South flank, - half way up stack.
Fresh gypsum, directly out of discharge line.
Collected near discharge line at summit of the stack; - 1 week old.
02/14/91
02/14/91
02/14/91
03/26/91
04/30/91
06/04/91
11/07/91
11/07/91
11/07/91
11/07/91

APPENDIX A (continued)
Lab Number Company Sample Notes Date Collected or Received
Gyp-16
Gyp-17
Gyp-18
Gyp-19
Gyp-20
Gyp-21
Gyp-22
Gyp-23
Farmland
Farmland
Farmland
Royster
IMC (P-21)
CF Industries (Plant City)
CF Industries (Plant City)
CF Industries (Plant City)
NE corner, -10 m above base of the stack.
North flank -5 m above base of the stack. Believed to be the oldest portion of stack.
Fresh gypsum collected directly from the discharge pipe at the stack summit.
Fresh gypsum collected directly from the discharge pipe at the stack summit.
Collected from near vertical surface -3 m from the top of the old stack.
Fresh gypsum collected directly from the discharge pipe at the stack summit.
Collected next to pool at discharge lines at the stack summit; cl week old.
North side of stack summit; -1 week old.
11/07/92
11/07/91
02/03/92
02/03/92
02/03/92
02/04/92
02/04/92
02/04/92

APPENDIX A (continued)
Lab Number Company Sample Notes Date Collected or Received
Gyp-24
Gyp-25
Gyp-26
Gyp-27
Gyp-28
Gyp-29
Gyp-30
CF Industries (Plant City)
CF Industries (Plant City)
IMC New Wales
IMC New Wales
IMC New Wales
IMC New Wales
IMC New Wales
North flank of stack; -2-3 years old.
Collected behind mobile structure on stack; -20 years old.
Fresh gypsum collected from the “east train” of the reaction line.
Sample deposited at the base of the SW flank of the stack -1975.
Sample collected -25-30 m above the base on the south flank of the stack. Deposited in -1980.
Sample collected -40-45 m above the base on the south flank of the stack. Deposited in -1989.
Sample collected in discharge channel at the stack summit; < 1 week old.
02/04/92
02/04/92
03/27/92
03/27/92
03/27/92
03/27/92
03/27/92

APPENDIX A (continued)
Lab Number Company Sample Notes Date Collected or Received
Gyp-31 CF Industries (Plant City)
Fresh gypsum collected from discharge line onto the stack summit on 3/27/92. Sample provided by CF personnel.
Gyp-32 Seminole Collected from the southwest corner of the north stack -12 m from the base of the stack. Sample is - 23-35 years old.
Gyp-33 Seminole Sample collected from the south side of the summit of the north stack. Sample was discharge within 1 to 2 weeks of the date of collection.
Gyp-34 Seminole Fresh gypsum collected directly from the discharge pipe at the summit of the north stack.
Gyp-35 Seminole Fresh gypsum collected from directly below the discharge pipe on the southwest corner of the summit of the north stack. Sample collected within minutes of discharge.
03/27/92
06/17/92
06/17/92
06/17/92
06/17/92

APPENDIX A (continued)
Lab Number Company Sample Notes Date Collected or Received
Gyp-36
Gyp-37
Gyp-38
Gyp-39
Gyp-40
Seminole
Seminole
Agrico, South Pierce Plant
Agrico, South Pierce Plant
Agrico, South Pierce Plant
Collected from the south stack on the north- west corner where the discharge lines were located. Phosphogypsum is -3 weeks old. Stack temporarily inactive when sampled.
Sample collected from the southwestern corner of the south stack. Phosphogypsum deposited -5-6 years prior to collection.
Fresh gypsum collected directly from the discharge pipe at the summit of the stack. Sample provided by Agrico personnel.
Sample collected from southwestern corner corner of the stack at the summit. Discharge lines have been at this location for -2 years. Sample was -1-2 days old
Sample collected from southwestern corner corner of the stack -20 m below the summit. Sample was -3-4 months old.
06/17/92
06/17/92
06/22/92
06/17/92
06/17/92

APPENDIX A (continued)
Lab Number Company Sample Notes Date Collected or Received
G-41
Gyp42
Gyp43
GYP-44
Gyp45
GYP-46
Agrico, South Pierce Plant
Agrico, South Pierce Plant
U.S. Agrichemicals Fort Meade
U.S. Agrichemicals Fort Meade
U.S. Agrichemicals Fort Meade
U.S. Agrichemicals Fort Meade
Sample collected from the western retaining wall of cooling pond #6 -2 m above the road. Sample was >6 years old.
Sample collected from north side of stack on what is the oldest known surface 20-25 years).
Sample collected from the western side of the stack -4-5 m above the base in the road. Sample is 8-10 years old.
Samples collected at the top of the stack on the NW corner in the discharge channel adjacent to the road. Two bags and a small bucket of phosphogypsum collect.
Sample collected at the NE corner -20 m above the base of the stack. Sample is about 3-4 years old.
Sample collected at the NE corner -14 m above the base of the stack. Sample is 5-6 years old. Large (5 gallon) bucket collected.
06/17/92
06/17/92
09/29/92
09/29/92
09/29/92
09/29/92

APPENDIX A (continued)
Lab Number Company Sample Notes Date Collected or Received
Gyp-47 U.S. Agrichemicals Fresh gypsum collected within the phos- Fort Meade phoric acid plant subsequent to slurrying
the gypsum, but prior to pumping the by- product onto the stack. Ores-47 was being reacted.
Gyp-48 IMC Nichols
Gyp-49 IMC Nichols
Gyp-50 IMC Nichols
Gyp-51 IMC Nichols
09/29/92
Fresh gypsum collected directly from the discharge line on the stack, Dipper used for collection.
01/14/93
Gypsum collected -100 m directly SE of the 01/14/93 discharge lines at the stack summit. Gypsum is 2 - 3 weeks old.
Gypsum collected -15-20 m below the summit on the western flank of the stack. Gypsum has been on the stack - I year.
01/14/93
Gypsum collected on the western flank of the stack -30 m below the summit and 8 m above the base. Gypsum has been on the stack -6-8 years.
01/14/93

APPENDIX A (continued)
Lab Number Company Sample Notes Date Collected or Received
Gyp-52 IMC Nichols
Gyp-53 Occidental
Gyp-54 Occidental
Gyp-55 Occidental
Gyp-56 Occidental
Gyp-57 Occidental
Gypsum collected in the dike wall of the cooling water pond on the SW corner of the stack. Sample collected -2 m above the current water level. Gypsum has been on the stack >25 years.
Fresh gypsum slurry of DH from Suwannee River Complex. Sample of fresh DH was produced on this date. Sample provided by Occidental personnel.
Fresh gypsum produced in Swift Creek HH Comples on this date. Sample pro- vided by Occidental personnel.
Sample collected from HH (Swift Creek) stack. Sample is 0 - 5 years old.
Sample collected from HH (Swift Creek) stack. Sample is 5 - 10 years old.
Sample collected from HH (Swift Creek) stack. Sample is lO+ years old.
01/14/93
01/15/93
01/15/93
01/15/93
01/15/93
01/15/93

APPENDIX A (continued)
Lab Number Company Sample Notes Date Collected or Received
Gyp-58 Occidental Sample collected from Doroliver Stack #1 in Section 1 - Center where gypsum is being harvested for re-sale. Gypsum is 15 - 16 years old.
03/11/93
Gyp-59 Occidental Sample collected from Doroliver Stack #3. Gypsum is 1 to 2 years old.
03/H/93
Gyp-60 Occidental Sample collected from CTC Stack #2 - Section 2. Gypsum is - 30% HH and 70% DH when pumped to stack. Sample collected from stack summit. Stack - 5 - 10 years old.
3/H/93
Phosphate Rock Samples
Ore-10/l Occidental Unconcentrated rock from mine; contains a significant amount of sand.
04/30/91
0x-10/2 Occidental Beneficiated ore rock that was being reacted; Gyp-10 is the resultant by-product.
04/30/91

APPENDIX A (continued)
Lab Number Company Sample Notes Date Collected or Received
ore-14 Farmland
ores-14* Farmland
Ore-18
ores-18
Farmland Ore rock being used to produce Ores-l&
Farmland
Ore-19
ores-19
Ruyster Ore rock being used to produce Ores-19,
Royster
ores-21 CF Industries (Plant City)
Ores-26 IMC New Wales
Beneficiated ore rock used to produce Ores-14*. Sample provided by Farmland,
Ore-14 slurry used in reaction chamber. Gyp-14 is the resultant by-product.
Ore-18 slurry used in reaction chamber. Gyp-18 is the resultant by-product.
Ore-19 slurry used in reaction chamber+ Gyp-19 is the resultant by-product.
Ore-21 slurry used in reaction chamber. Gyp-21 is the resultant by-product. Only an Ores sample of ore was collected.
Ore-26 slurry used in reaction chamber, Ore slurry cullected from “east train “of the reaction line* Gyp-26 is the by-product*
u/07/91
H/07/91
02/03/92
02/03/92
02/04/92
02/04/92
02/04/92
03/27/92

APPENDIX A (continued)
Lab Number Company Sample Notes Date Collected or Received
Ores-31
Ore-34
Ores-38
Ores-47
Ore-48
CF Industries (Plant City)
Seminole
Agrico, South Pierce Plant
U.S. Agrichemicals Fort Meade
IMC Nichols
Ore-31 slurry used in reaction chamber. Gyp-31 is the resultant by-product. Only an Ores sample of ore was collected. Sample provided by CF personnel.
Ore rock blend which was being used on the date of collection. Gyp-34 is the resul- tant by-product produced in the reaction chamber of Phosphoric Acid Plant #4.
Ore-38 slurry used in reaction chamber. Gyp-38 is the resultant by-product. Only an Ores sample of ore was collected. Sample provided by Agrico personnel.
Ore-47 slurry used in reaction chamber. Gyp-47 is the resultant by-product. Two bottles collected.
Ore rock blend which was being used on the date of collection. Gyp-48 is the resul- tant by-product produced in the reaction chamber.
03/27/92
06/17/92
06/22/92
09/29/92
01/14/93

APPENDIX A (continued)
Lab Number Company Sample Notes Date Collected or Received
Ore-53 Occidental
Ore-54 Occidental
GypXl-1 IMC New Wales
Filter #1 CF Industries (Plant City)
Ore rock which was being used at the Suwannee River Complex on the date of collection. Gyp-53 is the DH by-product.
01/15/93
Ore rock which was being used at the Swift Creek Complex on the date of collection. Gyp-54 is the HH by-product.
01/15/93
Miscellaneous Samples
Samples of clear, pseudohexagonal crystals growing in zones of cooling water discharge on the north and south flanks of the stack. The crystals are from cl to -4 cm inlength and grow in aggregates or “mats” in the zones of discharge above drainage channels.
03/27/92
Segment of unwashed polypropaline weave filter screen -28 cm x 70 cm. An appreciable amount of filter cake (scale) remained on the filter screen.
06/B/92

APPENDIX A (continued)
Lab Number Company Sample Notes Date Collected or Received
CC-1 U. S. Bureau of Mines
r-47 U.S. Agrichem. Fort Meade
P-48 IMC Nichols
P-53(a) & (b) Occidental
r-54 Occidental
Split spoon core samples of the CC-lwell drilled through the IMC P-21 stack. Each core sample is from a five foot segment of the well that has a total depth of 40 feet. Eight core samples provided.
06/18/92
Sample of phosphoric acid produced from Ores-47. Gyp-47 is the resultant by-product.
09/29/92
Sample of phosphoric acid produced from Ore-48. Gyp-48 is the resultant by-product.
01/14/93
Samples of phosphoric acid produced from Ore-53. Gyp-53 is the resultant by-product. P-53(a) is the #l Filtrate and P-54(b) is #2 Filtrate produced at the Suwanne River Complex (DH) on this date.
01/15/93
Sample of phosphoric acid produced from 01/15/93 Ore-54. P-54 is the #l Filtrate produced at the Swift Creek (HH) Complex on this date.

APPENDIX A (continued)
Lab Number Company Sample Notes Date Collected or Received
cw-1 IMC Nichols Filter wash water used to slurry phosphogypsum filtrate from the reaction chamber. Gyp-48 slurried with this water on this date.
01/14/93
cw-2
cw-3
Occidental Filter wash water used to slurry dihydrate filtrate from the reaction chamber at the Suwannee River Complex (DH) on this date. Gyp-53 slurried with this water.
Occidental Filter wash water used to slurry dihydrate filterate from the reaction chamber at the Swift Creek Complex (HH) on this date. Gyp-54 slurried with this water.
01/15/93
01/15/93
* S appended to Ore indicates ore rock slurry. Ores samples are beneficated ore rocks which are usually slurried with cooling pond water. pH of ore slurry is raised to ~4 to decrease corrosivity.

APPENDIX B
Radioanalytical Results

APPENDIX B. Radiochemical analyses of bulk phosphogypsum and phosphate rock samples. Replicates of samples have been analyzed when more than one 210Po and 238IJ activity (measured by a spectrometry) is given for a sample. More than one activity given for radionuclides measured by y spectrometry (234Th , 226Ra, and W?b) are recounts of the same sample unless sub-sample numbers are given. Errors are given at the 1 CT level based on counting statistics only.
238~
Company Sample ID c234Th by 7) 226Ra 21?l.‘b 2lOPO 210Pb/226Ra 2%l?o/2%‘b dP%s dpmhs dpm/g dpmk Activity Ratios
Phosphogypsum Samples
Estech Gyp-1
US Agrichem Gyp-2 (Bartow) IMC GYP-3
Farmland GYP-4
IMC (P-21) Gyp-5/l
IMC (P-21) Gyp-5/2
Roys ter Gyp-W) Gyp-W)
Gyp-6(3) Gyp-W) Gyp-6 (Ave.)
3.0ko.3
2.41kO.4
6.3rt0.4
5.8f0.4
8.OkO.5
4.9kO.3
5.1hO.4 4.7kO.4 4.3f0.3 4.7kO.3 4.7kO.3
49.OkO.3 41.2kO.6
64.5kO.4 56.6f0.8
60.9+0.3 57.2Iko.7
64.6kO.8 58.k!zO.8
51.9kO.3 49.4kO.8
41.0f0.2 41.4Iko.5
41.2Iko.3 37.6kO.6 37.7kl.O 40.2Iko.3 38.2kO.7 37.5kO.6 40.3kO.3 38.5f0.7 37.3f0.5 40.6rtO.3 38.9kO.7 38.lf0.7 40.6kO.5 38.3f0.6 37.750.3
43.7fO.7
57.9kl.l
55.5kO.8
58.9kO.9
51.0f0.7 52.1f0.5
42.3kO.7 42.3kO.6
0.84*0.01
0.88*0.01
0.94kO.01
0.9OIfIO.02
0.95+0.02
l.O1fO.O1
0.91f0.02 0.95kO.02 0.96kO.02 0.96kO.02 0.95kO.02
1.06&0.02
l.OtiO.03
0.971!10.02
1.01t0.02
1.031kO.02 1.06zkO.02
1.03+0.02 1.02ko.02
1.00f0.03 0.98IkO.03 0.97kO.02 0.98rtO.03 0.98IkO.01

APPENDIX B (continued)
238~
Company Sample ID c2sTh by $ 226Ra 21%‘b 21OPO 21oPb/226Ra 2@l?o/2*oPb
dpm/g dpmk dPmk dPW$ Activity Ratios
Roy s ter Gyp-6(1&2) 2%J(ct)
5.1kO.2 5.3kO.4
40.3kO.2 37.5kO.4 37.3kO.4
39.820.6
45.3kO.6
56.2kl.O
21.920.4
44.9kO.6
45.3f0.7
46.2k0.6
49.0rto.7
0.93+0.01
1.00+0.02
0.98kO.02
1.2Oko.01
1.27kO.03 1.30*0.04
0.82kO.01
0.95+0.01
1.00~0.01
1.00*0.02
0.99f0.01
1.04kO.02
0.99zkO.02
0.71f0.02
1.06kO.03
0.95kO.02
1.03f0.02
1.03kO.02
1.01-10.02
Royster
Roys ter
Gyp-7 9.2ko.4 38.4kO.3
46.9kO.3
38.4kO.6
45.9ko.7 Gyp-8 ?J(a) 2W(cx)
15.OkO.5 16.2k0.3 17.0k0.6
C. F. Ind. (Bartow) Occidental
Gyp-9
Gyp-10
4.1kO.4 66.3kO.4
16.2kO.2 16.kkO.2
79.6kO.S
20.6kO.4 20.950.5
1.9ko.2 1.7rt0.2 1.7kO.l 2wJ(a)
Cargil
Farmland
Farmland
Gyp-11 4.OkO.4 57.4-Lo.3
46.4kO.3
44.8k0.2
47.2ko.7
44.kko.7
44.7kO.5
GYP-12 5.9ko.4
Gyp-13 238U(cx)
6.0k0.3 6.4kO.l
Farmland 8.1kO.5 48.7kO.3 48.7k0.7 Gyp-14

APPENDIX B (continued)
238~
Company Sample ID (234Th by r) 226Ra ?I’b 2lOPO 21oPb/226Ra 21oPo/21oPb
dPm& dpmk dpmk dPm& Activity Ratios
Farmland
Farmland
Farmland
Farmland
Royster
IMC (P-21) Profile
C. F. Ind. (Plant City)
Gyp-15 5.2ko.3
Gyp-16 2.8k0.4
Gyp-17 7.3kO.5
Gyp-18
2wJ(a) 238U(a)
12.5+0.5* 9.20.7 9.1f0.4 9.x0.3
Gyp-19
238U(a)
10.9*0.4* lO.OkO.5 9.8k0.3
Gyp-20(0-2cm) 3.7k0.3 Gyp-20(2-5cm) 3.3k0.3 Gyp-20(5-8cm) 2.1kO.3 Gyp-20(8-15cm) 2.0k0.3
Gyp-21
238U(a)
9.5f0.6” ll.lf0.8 lO.OYkO.2
39.2ko.3 40.3kO.6
81.2k0.4 60.9kl.O
80.5kO.4 llO.OkO.9
53.5kO.3 49.2zko.7 51.6kO.4 48.9kO.9
32.720.2 33.3kO.3
34.9ko.5 34.5kO.7
42.1kO.3 37.8kO.3 47.9kO.3 49.4kO.3
42.3kO.7 38.5rt0.7 47.9kO.3 45.5kO.8
57.7kO.4 59.6kO.5
60.7kO.8 59.7H.O
36.7k0.6
58.8k0.7
105.9&l .6
54.3kO.9 55.8k0.6
33.9kO.6
42.5zkO.6 40.6kO.6 44.8kO.6 45.720.5
69.1kO.9 71.4zko.9 70.6kO.5
1.03f0.02
0.75f0.01
1.36kO.01
0.93+0.01 0.95kO.02
1.07kO.02 1.04kO.02
1.00+0.02 1.03+0.02 1.0510.02 0.92kO.02
1.05kO.02 1.00~0.02
0.91+0.02
0.97kO.02
0.97kO.02
l.lOrtO.02 1.14kO.02
0.97kO.02
1.00~0.02 1.05rtO.02 0.94-Lo.01 1.01+0.02
1.14kO.02 1.18kO.02 1.16+0.02

10 Feb 93 Analysis APPENDIX B (continued)
62.8k0.5 1.03+0.02
238~
Company Sample ID (234Th by $ 226Ra 2*?l’b 21OPO 21oPb/226Ra 21oPo/21oI’b dpmk dpmh? dpmhs dpmk Activity Ratios
C. F. Ind. (Plant City)
C. F. Ind. (Plant City)
C. F. Ind. (Plant City)
C. F. Ind. (Plant City>
IMC New Wales
IMC New Wales
IMC New
GYP-22 7.5kO.4" 54.6k0.3 7.1f0.6 56.1kO.4
GYP-3 5.OrkO.4" 7.4kO.7
Gyp-24 4.OkO.4"
GYP-3 3.6kO.3
30 Jan 93 PO Analysis
26 Jun 93 PO Analysis
Gyp-26 15.3kO.4" 15.4kO.7
wJ(a) 15.5k0.2
Gyp-27 3.0k0.2
Gyp-28 3.6kO.4
59.1kO.4 60.8rtO.5
55.4kO.3
47.1f0.3
44.2To.2 44.5kO.4
39.kkO.2
56.5kO.3
50.3kO.6 52.2i0.8
53.2ko.7 55.5f0.9
43.8k0.7
40.1f0.7
50.6kO.5 50.8&-0.8
37.4kO.4
50.7zko.7
57.9kO.9
35.8k0.6 38.6f0.6
45.4kO.7 38.9kO.5 39.9f0.5
39.6k0.5 39.8k0.6 38.1kO.4 36.9k0.3 36.7k0.4
51.8f0.4
36.7k0.4
52.8k0.6
0.93+0.01 0.93kO.02
0.90rt0.01 0.91kO.02
0.79zko.01
0.85kO.02
0.96+0.01
0.90+0.01
1.15fO.02
0.67kO.02 0.73rto.01
1.04kO.02 0.61kO.01 0.64kO.01
0.9940.02 0.99kO.02 0.95+0.02 0.92kO.02 0.9tio.01
1.03+0.01
0.98kO.01
1.04kO.02

Wales APPENDIX B (continued)
238~
Company Sample ID (234Th by $ 226Ra 2*%‘b 2EPO ?oPb/226Ra 2?t’o/21ol’b
dPm& dpm/g dPm/tS dPmk Activity Ratios
IMC New Wales
IMC New Wales
C. F. Ind.
Seminole
Seminole
Seminole
Seminole
Gyp-29
Gyp-30
2%J(a> 238U(a)
Gyp-31
wJ(a)
Gyp32
Gyp-33
Gyp-34
*w(a)
Gyp-35
8.2kO.4
9.8kO.5” 8.8kO.5 9.6kO.2 9.0rfio.3
10.8f0.5* 11.1+0.7 10.7kO.l
3.7k0.2
7.3kO.3” 6.lf0.5
9.3kO.3” 9.3k0.6
10.6kO.4
8.0f0.3” 7.4k0.6
49.4kO.3
46.4k0.4 45.OkO.3
72.2k0.4 70.4kO.4
60.0k0.3
49.0k0.2 48.7kO.4
57.8k0.3 55.3-to.4
58.OkO.3 57.5kO.4
51.7kO.7
51.OkO.7 51.0zko.7
62.2kO.8 63.EO.9
44.3kO.5
51.320.4 53.lrtO.8
54.720.5 57.0f0.8
55.3kO.5 56.650.9
48.7k0.6
38.8k0.4
72.6f0.6
45.5f0.5
41.1zko.5
51.9kO.6
58.4k0.8
1.05f0.02
l.lOf0.02 1.13kO.02
0.86zkO.01 0.90Ifr0.01
0.74*0.01
1.05~0.01 1.09*0.01
0.95kO.01 1.03kO.02
0.95kO.01 0.98kO.02
0.94kO.02
0.76kO.01
1.17z!zO.O2
1.03rtO.02
0.80+0.01
0.95kO.01
1.06kO.02

APPENDIX B (continued)
238~
Company Sample ID (234Th by $ 226Ra 21?F’b 21OPO 210F’b/226Ra 2*@?o/2toI’b dpm/g dpm/g dpm/g dPm/g Activity Ratios
Seminole Gyp-36
Seminole Gyp-37
Agrico Gyp-38
238U( a)
Agrico Gyp-39
Agrico Gyp-40
Agrico Gyp-41
Agrico Gyp-42
U. S Agrichem Gyp-43 238U(a)
U. S Agrichem Gyp-44B Gyp-44B
9.2kO.4” 10.5rto.7
3.7kO.2
21.8rt0.6” 19.4kO.5 24.4k0.5
11.9+0.3* 10.2ko.5
8.3kO.4
5.2ko.3
4.2ko.3
2.7k0.3 2.8&O. 1
c21.6fO.S 22.5kO.8
63.3k0.3 62.3kO.4
79.9kO.3
44.8kO.3 49.9kO.2
31.6kO.2 31.OkO.2
49.OkO.3
59.7kO.3
64.8k0.3
65.7k0.2
57.8k0.3 57.3kO.3
55.4kO.5 55.7k0.8
54.920.5
5O.kkO.S 46.5k0.6
36.910.3 37.2kO.6
44.0+0.5
49.5kO.6
53.6kO.6
57.1f0.5
69.6kO.9 67.550.9
61.8k0.9
56.3kO.7
56.5k0.6
26.kkO.7
72.4k0.7
51.7k0.6
53.8k0.9
56.4&l .O
58.4k0.7
0.88~0.01 0.89f0.01
0.69kO.01
l.llf0.02 0.93+0.01
1.17~0.01 1.2OkO.02
0.90f0.01
0.87rtO.01
0.83+0.01
0.87kO.01
1.20f0.02 l.lSkO.02
1.12ko.02
1.03+0.02
1.13kO.02
0.71+0.01
1.65kO.02
1.04kO.02
1.00?0.02
0.99kO.02
034~0.01

APPENDIX B (continued)
238~
Company Sample ID (234Th by y) 226Ra 21oI’b 2*0l?0 210Pb/226Ra 2%‘o/21oPb
dPM?i dPm/g dPm& dpmk Activity Ratios
U. S Agrichem Gyp-45
U. S Agrichem Gyp46 Gyp4W Gyp-4-W Gyp-W3 Gyp-46(4) Gyp-435)
U. S Agrichem Gyp-47B Gyp-47B 2W(a) 2%J(a)
IMC Nichols Gyp-48
2W(a)
IMC Nichols Gyp-49
IMC Nichols Gyp-50
4.9*0.4
6.6kO.5 4.7kO.5 3.9f0.4 4.9kO.4 4.8zkO.5 4.8k0.5
18.2zkO.6 18.8zkO.8 19.8kO.7 17.9&-0.6
17.4+0.7* 18.0f0.8 17.3kO.4
8.9k0.6 7.4k0.6
6.8k0.5
40.4kO.2
57.9f0.3 53.1kO.2 54.5f0.2 53.1f0.2 54.7k0.2 54.4k0.2
66.BO.3 64.9kO.4
68.1kO.3 68.OkO.3
55.9f0.2 55.5f0.3
46.0k0.2
49.2kO.6
49.4zk0.8 50.8&-0.7 49.8k0.6 50.8kO.6 51.3kO.7 50.7kO.7
57.20.6 55.4kO.9
56.5rfr0.8 56.6k0.8
54.7rto.7 54.7kO.8
51.3kO.7
40.7kO.6
49.6kO.6
59.1f0.5
63.kkO.9
47.5kO.6
47.2ko.5
1.220.02
0.85kO.01 0.96+0.01 0.91+0.01 0.96f0.01 0.94kO.01 0.93kO.01
0.86+0.01 0.85f0.01
0.83zkO.01 0.83f0.01
0.98kO.01 0.99kO.02
1.12&-0.01
0.83kO.02
1.ooz!zo.o2
1.03f0.02
1.11+0.02
0.87kO.02
0.92ko.01

APPENDIX B (continued)
238~
Company Sample ID (2BTh by r) 226Ra 21oI’b 21OPO 21oPb/226Ra 2~ol.‘o/2~oI’b dpmk dpmk dpm/g dpm& Activity Ratios
IMC Nichols Gyp-51
IMC Nichols Gyp-52
Occidental Gyp-53
238U( a)
Occidental Gyp-54
238U( a)
Occidental Gyp-55
Occidental GYP-56
Occidental Gyp-57 238U(a>
Occidental Gyp-58
Occidental Gyp-59
5.410.4
6.9kO.8
7.5kO.3 7.eko.5 7.5kO.2
c27.7rtO.5 26.5kO.5 28.1rt0.7
8.6k0.4
8.9LO.4
9.1kO.4 9.0ko.7
2.OkO.l
3.4*0.3
53.3k0.2
74.7kO.3
36.0k0.2 35.7kO.3
34.7zk0.2 34.4k0.2
34.7k0.2
19.4zizO.l
19.4k0.2
26.7kO.l
25.2kO.l
35.OkO.5
77.0k1.2
27.9f0.4 27.8f0.6
33.2ko.5 32.20.5
33.2ko.5
21.3kO.5
23.OzkO.5
27.320.4
24.9kO.4
55.0ko.7
56.1f0.6
30.2ko.5
34.0zko.9
24.6kO.6
21.3kO.3
23.OkO.3
25.7k0.3
24.4k0.3
0.66f0.01
1.03kO.02
0.78IfrO.01 0.78zkO.02
0.96rtO.02 0.9450.02
1.12ko.02
l.lOkO.02
1.19kO.02
1.02ko.02
0.99i-0.02
1.57kO.02
0.73+0.02
1.08+0.02
1.02ko.03
0.85kO.02
1*00+0.03
1.00+0.02
0.94kO.02
0.98zkO.02

Occidental Gyp-60 APPENDIX B (continued)
1.4kO.2 21.8k0.2 24.0k0.5 25.3f0.4 l.lOkO.02 1.05+0.03
238~
Company Sample ID (234Th by $ 226Ra 21oI’b 21OPO 210Pb/ 226Ra 21oPo/21f’Pb
dPm& dPMS dpmk dpm/g Activity Ratios
CF Ind. (Bartow)
Gyp-DI.31) 2.0+0.2 54.2k0.2 44.7kO.4 - 0.82kO.01 Gyp-DT.32) 2.1kO.2 54.4ko.3 46.8f0.5 - 0.86sfrO.01 Gyp-DL3(3) 2.9kO.2 53.7k0.2 46.4f0.4 - 0.86kO.01 Gyp-DI-84 3.1rt0.2 54.2zkO.2 47.x0.5 - 0.87z!zO.O1 Gyp-DL3 Vial 1.6kO.3 53.61t0.5 45.5kl.O - 0.87kO.01 Gyp-DL3 Ave. 2.3kO.2 54.0ko.3 46.1kO.6 - 0.86f0.01
Phosphogypsum Samples from U. S. Bureau of Mines Well
IMC (P-21) CC-l O-5 Ft. 2.2ko.2 55.OkO.3 48.5k0.5
IMC (P-21) CC-1 5-10 Ft. 3.9f0.2 58.6k0.3 53.2ko.5
IMC (P-21) CC-1 lo-15 Ft. 5.3k0.3 55.0f0.3 53.9kO.5
IMC (P-21) CC-1 15-20 Ft. 4.0k0.2 56.20.3 55.3kO.5
IMC (P-21) CC-l 20-25 Ft. 3.3k0.2 59.9zk0.2 55.9f0.5
IMC (P-21) CC-1 25-30 Ft. 3.2k0.2 62.1f0.2 56.2k0.4
IMC (P-21) CC-1 30-35 Ft. 4.7k0.4 58.8zkO.2 63.8k0.8
54.2ko.7 0.88~0.01 1.11+0.02
58.2kO.5 0.91+0.01 1.09kO.01
62.6iO.5 0.98kO.01 1.16+0.01
54.7kO.7 0.98kO.01 0.99kO.02
59.8kO.4 0.93+0.01 1.07*0.01
63.9f0.4 0.90~0.01 1.14kO.01
61.3f0.7 1.09ko.01 0.96f0.02

IMC (P-21) CC-1 35-40 Ft. 24.620.3 APPENDIX B (continued)
30.3kO.2 30.9kO.3 34.OkO.4 1.03+0.01 1.10+0.02
238~
Company Sample ID (234Th by 7) 226Ra 21”I’b 21OPO 21oPb/226Ra ?Po/2%‘b dPmk dPmk dPm/g dpm& Activity Ratios
Occidental Ore-lo/l
Occidental Ore-lo/2 Farmland Ore-14
Farmland
Farmland
Ores-14
Ore-18
Farmland
Roys ter
Ores-1 8
238U( a)
Ore-19
14.5f0.3
34.7kO.5 81.1kO.7
83.2kO.6
74.4+0.6*
80.0f0.8
68.8kO.8” 84.5&l .2 84.3k2.0
44.2f0.6”
Phosphate Rock Samples
13.8-LO.l
35.3kO.2 87.7k0.3
89.2kO.3
79.8k0.3
77.9kO.2
80.9kO.3 79.7kO.3
52.9k0.3
14.4kO.4
35.6f0.6 88.3+1 .o
86.9IfiO.8
75.3&l .l
75.610.8
80.3&l .l 79.9s .l
52.9kl.O
14.3kO.3
36.8k1.3 86.3f2.1 86.21.2 79.2k2.1
87.9k2.4
75.6&l .3 77.5&l -2
77.8&l .4 82.8k2.5
52.3&l .7 55.Ok2.3 53.7kO.5
1.05f0.03
1.01+0.02 1.01+0.01
0.97~0.01
0.94kO.01
0.97kO.01
0.99kO.01 l.OOfO.O1
1.0010.02
0.99zko.04
1.03+0.04 0.98kO.03 0.98zkO.02 0.90-10.03
1.01+0.03
l.OOkO.02 1.03kO.02
0.97kO.02 1.04+0.03
0.99kO.04 1.04~0.05 1.03+0.02

APPENDIX B (continued)
238~
Company Sample ID (234Th by y) 226Ra 2%‘b 210P0 21oPb/226Ra 21oPo/21oPb
dPm/g dPm& dPWS dPm/g Activity Ratios
Roys ter
C. F. Ind. (Plant City)
IMC New Wales
C. F. Ind. (Plant City)
Seminole
Agrico
Ores-1 9 238U(ct)
61.3kO.7 60.4k1.2
56.4k0.2
98.8kO.4 99.120.4
94.3zko.3 91.2rto.4
113.750.4
94.7k0.2 91.7kO.4
69.8k0.2
56.2kO.7 57.8k0.5 54.9+1 .o
93.4B.l 97.8&l .6
1.00+0.02 1.03+0.02 0.98kO.02
0.93kO.02 1.01+0.02
Ores-21 102.621.1 102.0&l .3 102.6k2.5 106.Ok2.2
100.2f1.3 97.kk1.3
1.01+0.01 0.99+0.01
238U(a> 23&J(a)
Ores-26 75.2kO.7” 93.4k1.3 97.21.2
88.8kO.9 91.21.3
88.5k1.6 0.94rto.01 1.00f0.01
1.00+0.02
2w(a)
Ores-31 2wJ(a)
118.8k1.4 111.6fl.l
109.9k1.4 llO.lf1.6 0.97~0.01 1.00+0.02
Ore-34 73.6&O-4* 94.5~1.3” 89.6k2.4
86.7k0.5 91.4k1.3
87.4k0.8 0.92ko.01 1.00+0.01
1.01+0.01
238U(ct)
Ores-38 %J(cx)
77.8kO. 7 81.Ok2.1
80.9kO.8 0.93+0.01 87.4kO.8 1.01+0.01

APPENDIX B (continued)
Company Sample ID (2BTh by y) 226Ra 2%l?b 21OPO 21oPb/226Ra ‘=&‘o/%‘b dpmk dpmk dpm/g dP% Activity Ratios
U.S. Agrichem Ores-47 87.2kO.8 55.0~02 59.4k0.8 61.2kl.l 1.08*0.02 1.03+0.02 238U(a) 90.3&l .6
IMC Nichols Ore-48 23QJ(ff)
111.7rt1.4 97.7kO.4 llO.lf1.6 102.5+1.2 1.13kO.02 0.93kO.02 117.kk2.2
Occidental Ore-53 238U(a)
57.8k0.7 52.OkO.2 58.9k0.7 52611.0 1.01+0.01 0.89kO.02 57.9zk1.6
Occidental Ore-54 58.9kl .O 53.OkO.3 56.7H.0 52.0&l .2 1.07kO.02 0.92ko.03 238U(a) 63.3&l .O
* Activity measured and calculated prior to development of absorption correction for 234Th 7.

APPENDIX C
Chemical Compositions