micro /macro vickers/knoop - test equipment depot · z hardness conversion, correction, and...
TRANSCRIPT
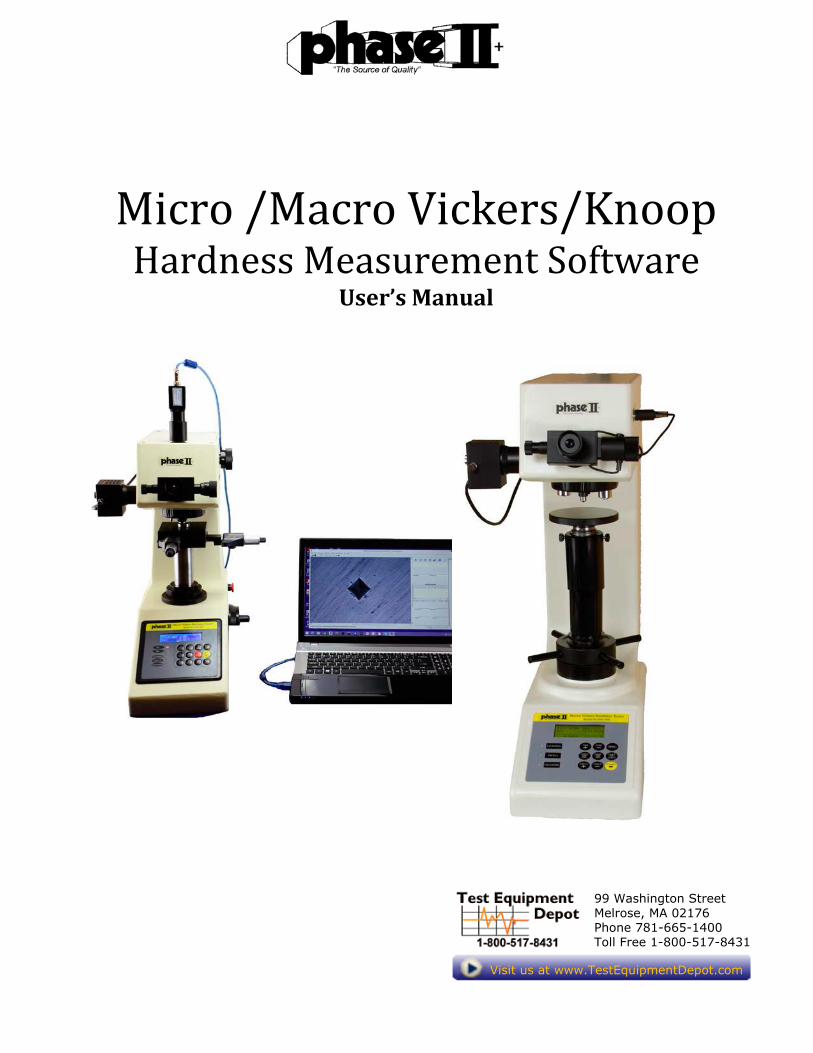
Micro /Macro Vickers/Knoop Hardness Measurement Software
User’s Manual
99 Washington Street Melrose, MA 02176 Phone 781-665-1400Toll Free 1-800-517-8431
Visit us at www.TestEquipmentDepot.com
USER'S MANUAL
TABLE OF CONTENTS
Page #
1.0 GENERAL INFORMATION ...................................................................................................... 1-2
1.1 System Overview..................................................................................................................... 1-2
1.2 System Requirements ............................................................................................................. 1-2
1.3 Main Features ......................................................................................................................... 1-2
1.4 Standard Features .................................................................................................................. 1-3
2.0 SOFTWARE INSTALLATION................................................................................................... 2-2
2.1 Installation Overview ............................................................................................................. 2-2
2.2 Installation Instructions ......................................................................................................... 2-2
3.0 GETTING STARTED .................................................................................................................. 3-1
3.1 Driver installation................................................................................................................... 3-1
3.2 Starting the application.......................................................................................................... 3-1 3.2.1 Graphical User Interface (GUI) setup................................................................................................ 3-1 3.2.2 Camera setup ..................................................................................................................................... 3-3 3.2.3 Camera calibration ............................................................................................................................. 3-4 3.2.4 Calibration management .................................................................................................................... 3-6 3.2.5 Settings .............................................................................................................................................. 3-7 3.2.6 Measurement.................................................................................................................................... 3-12 3.2.7 Utilities ............................................................................................................................................ 3-13 3.2.8 Turret Control .................................................................................................................................. 3-16 3.2.9 Stage Control ................................................................................................................................... 3-17 3.2.10 Set Pattern and Path ......................................................................................................................... 3-19 3.2.11 Automated Test and Measurement .................................................................................................. 3-23 3.2.12 Data Saving and Retrieval ............................................................................................................... 3-23 3.2.13 Reporting ......................................................................................................................................... 3-23
3.3 Appendix: Using the standard features .............................................................................. 3-24 3.3.1 Image/Video capturing .................................................................................................................... 3-24 3.3.2 Camera calibration ........................................................................................................................... 3-24 3.3.3 Calibration management .................................................................................................................. 3-24 3.3.4 Geometry measurement ................................................................................................................... 3-24 3.3.5 Image processing ............................................................................................................................. 3-25 3.3.6 Document entry ............................................................................................................................... 3-25 3.3.7 Album management ......................................................................................................................... 3-25 3.3.8 Data Saving and Retrieval ............................................................................................................... 3-25 3.3.9 Reporting ......................................................................................................................................... 3-26 3.3.10 Printing with magnification ............................................................................................................. 3-26
User’s Manual Page ii
1.0 General Information
User’s Manual Page 1-3
1.0 GENERAL INFORMATION
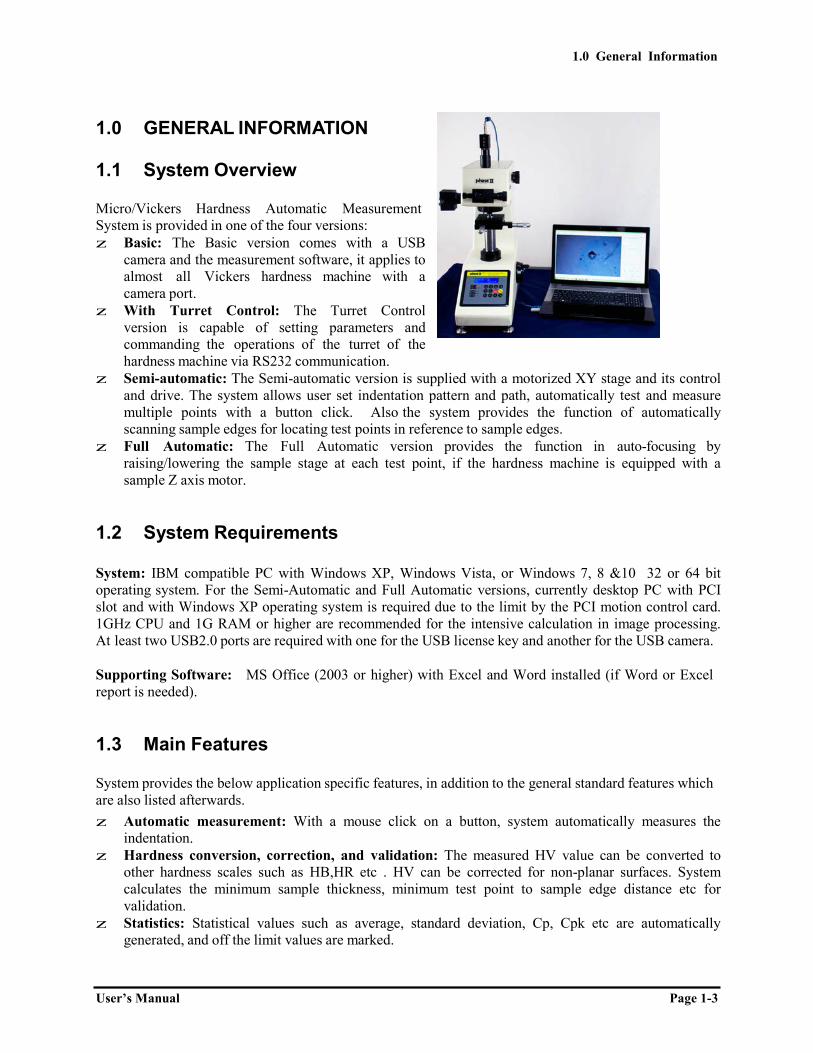
1.1 System Overview
Micro/Vickers Hardness Automatic Measurement System is provided in one of the four versions: z Basic: The Basic version comes with a USB
camera and the measurement software, it applies to almost all Vickers hardness machine with a camera port.
z With Turret Control: The Turret Control version is capable of setting parameters and commanding the operations of the turret of the hardness machine via RS232 communication.
z Semi-automatic: The Semi-automatic version is supplied with a motorized XY stage and its control and drive. The system allows user set indentation pattern and path, automatically test and measure multiple points with a button click. Also the system provides the function of automatically scanning sample edges for locating test points in reference to sample edges.
z Full Automatic: The Full Automatic version provides the function in auto-focusing by raising/lowering the sample stage at each test point, if the hardness machine is equipped with a sample Z axis motor.
1.2 System Requirements
System: IBM compatible PC with Windows XP, Windows Vista, or Windows 7, 8 &10 32 or 64 bit operating system. For the Semi-Automatic and Full Automatic versions, currently desktop PC with PCI slot and with Windows XP operating system is required due to the limit by the PCI motion control card. 1GHz CPU and 1G RAM or higher are recommended for the intensive calculation in image processing. At least two USB2.0 ports are required with one for the USB license key and another for the USB camera.
Supporting Software: MS Office (2003 or higher) with Excel and Word installed (if Word or Excel report is needed).
1.3 Main Features
System provides the below application specific features, in addition to the general standard features which are also listed afterwards. z Automatic measurement: With a mouse click on a button, system automatically measures the
indentation. z Hardness conversion, correction, and validation: The measured HV value can be converted to
other hardness scales such as HB,HR etc . HV can be corrected for non-planar surfaces. System calculates the minimum sample thickness, minimum test point to sample edge distance etc for validation.
z Statistics: Statistical values such as average, standard deviation, Cp, Cpk etc are automatically generated, and off the limit values are marked.
1.0 General Information
User’s Manual Page 1-4
z Data saving and retrieval: System can save and retrieve the hardness measurement data and images in data files.
z Reporting: With a mouse click, the system automatically generates a Microsoft Word or Excel document, with a standard or user provided template, to reports the measurement data, statistical information, the measurement image, and the hardness Case curve.
1.4 Standard Features
z Image/Video capturing: Capture and save images/videos on DirectShow compatible USB cameras.
z Camera calibration: For measurement applications, the camera can be calibrated with a microscope ruler or grid.
z Calibration management: System allows save/manage multiple calibrations, load a calibration, rename a calibration, or unload the current calibration.
z Geometry measurement: System provides the tools to draw and measure common geometric shapes such as lines, angles, rectangles, arcs/circles, ellipses, polygons, point-to-line, and point-to-arc etc.
z Image processing: System provides a rich set of image processing tools for advanced applications, which include adjusting Brightness, Contrast, Gamma, and Histogram Level, and the Sharpen, Smooth, Invert, and Convert to Grey functions. On grey scale images, system provides various advanced tools in filtering and finding edges, as well as some standard tools in morphological operations such as open, close, dilation, erosion, and flood fill, to name a few.
z Document entry: On an image, system provides a document editor to enter/edit documents with contents either in simple plain text format or in advanced HTML format with objects including tables, list, and images.
z Album management: System allows user manage multiple images in an album which can be saved to and opened from an album file. The images can have the standard geometric shapes and the documents as entered by user as described above.
z Data saving and retrieval: System can save and retrieve the geometry measurement data and images in data files.
z Reporting: With a mouse click, system generates a Word document for the geometry measurements. z Printing with magnification: System can print the image with user specified magnification.
3.0 Getting Started
User’s Manual
2.0 SOFTWARE INSTALLATION
2.1 Installation Overview
The installation of the system is simple in that the software and its relevant device drivers all come in one installer file. The software is modular in architecture. It consists of the application platform and upon which the application modules. The following components are installed in the system: 1) Microsoft VC++ redistributable package since the software is developed with MSVC; 2) software platform, a general scriptable graphical user interface with built-in image processing functions; 3) Device drivers including USB camera driver and its DirectShow driver, and the motion control card driver if supplied; 4) HV Measurement application modules.
2.2 Installation Instructions
Double-click the installer file iVision_v1.0.0_TZXXXXXX_installer.exe to start the installation process, and answer at all the prompts in the driver installation, where TZXXXXXX is the USB license key ID. Note to change the drive in installation directory if other than the default D: drive.
3.0 Getting Started
User’s Manual Page 3-1
3.0 GETTING STARTED
3.1 Driver installation
When the USB camera is plugged in at the first time, PC will take a minute to install its driver. If the operating system is Windows XP, when the computer asks to install the device driver either manually or automatically, answer “automatic installation”.
3.2 Starting the application
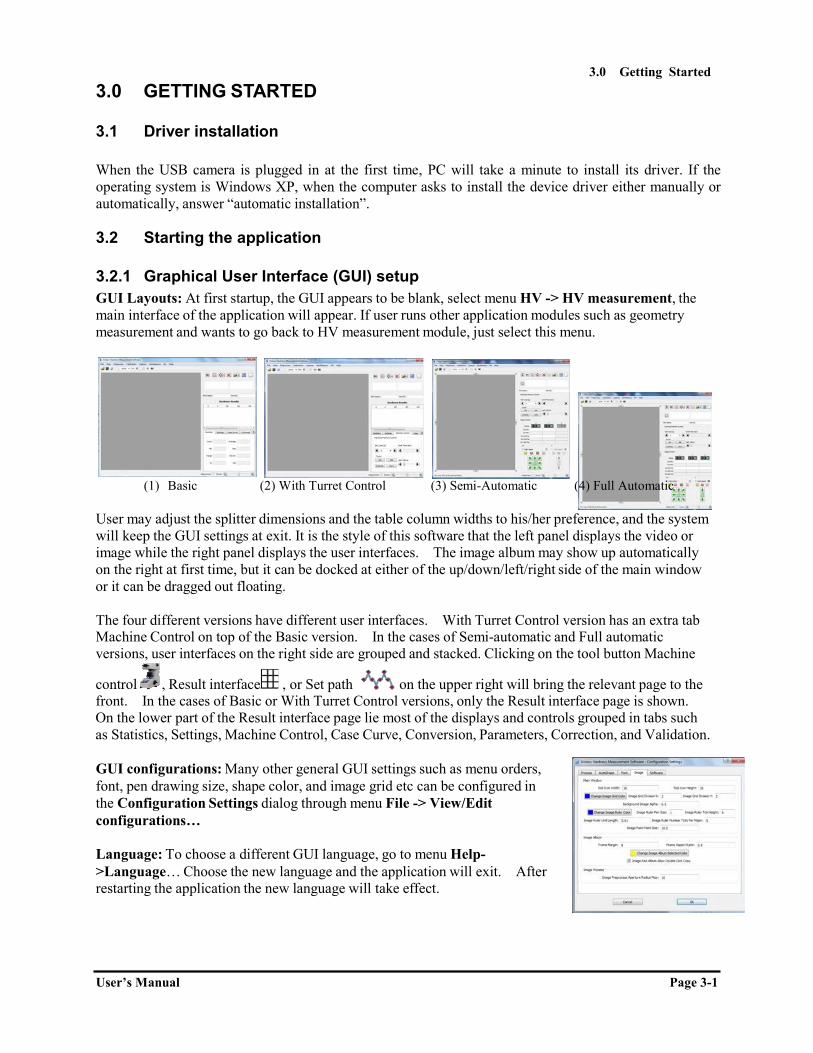
3.2.1 Graphical User Interface (GUI) setup GUI Layouts: At first startup, the GUI appears to be blank, select menu HV -> HV measurement, the main interface of the application will appear. If user runs other application modules such as geometry measurement and wants to go back to HV measurement module, just select this menu.
(1) Basic (2) With Turret Control (3) Semi-Automatic (4) Full Automatic
User may adjust the splitter dimensions and the table column widths to his/her preference, and the system will keep the GUI settings at exit. It is the style of this software that the left panel displays the video or image while the right panel displays the user interfaces. The image album may show up automatically on the right at first time, but it can be docked at either of the up/down/left/right side of the main window or it can be dragged out floating.
The four different versions have different user interfaces. With Turret Control version has an extra tab Machine Control on top of the Basic version. In the cases of Semi-automatic and Full automatic versions, user interfaces on the right side are grouped and stacked. Clicking on the tool button Machine
control , Result interface , or Set path on the upper right will bring the relevant page to the front. In the cases of Basic or With Turret Control versions, only the Result interface page is shown. On the lower part of the Result interface page lie most of the displays and controls grouped in tabs such as Statistics, Settings, Machine Control, Case Curve, Conversion, Parameters, Correction, and Validation.
GUI configurations: Many other general GUI settings such as menu orders, font, pen drawing size, shape color, and image grid etc can be configured in the Configuration Settings dialog through menu File -> View/Edit configurations…
Language: To choose a different GUI language, go to menu Help- >Language… Choose the new language and the application will exit. After restarting the application the new language will take effect.
3.0 Getting Started
User’s Manual Page 3-3
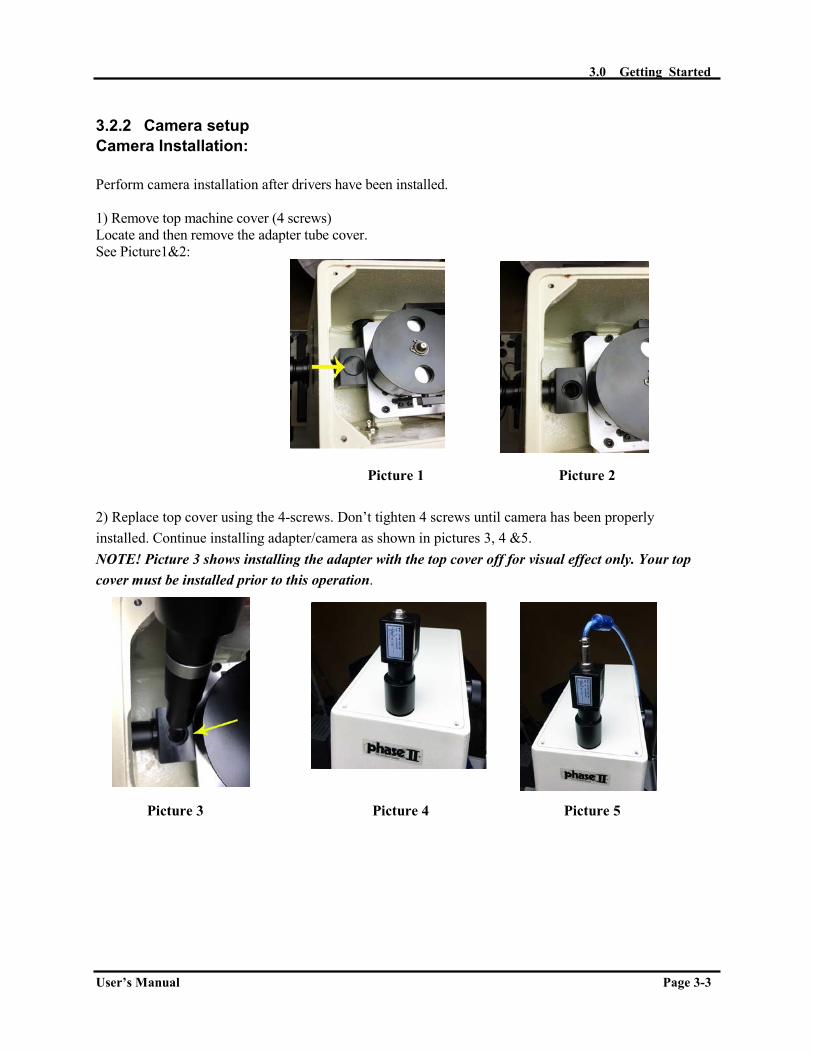
3.2.2 Camera setup Camera Installation:
Perform camera installation after drivers have been installed.
1) Remove top machine cover (4 screws)Locate and then remove the adapter tube cover. See Picture1&2:
Picture 1 Picture 2
2) Replace top cover using the 4-screws. Don’t tighten 4 screws until camera has been properlyinstalled. Continue installing adapter/camera as shown in pictures 3, 4 &5. NOTE! Picture 3 shows installing the adapter with the top cover off for visual effect only. Your top cover must be installed prior to this operation.
Picture 3 Picture 4 Picture 5
3.0 Getting Started
User’s Manual Page 3-4
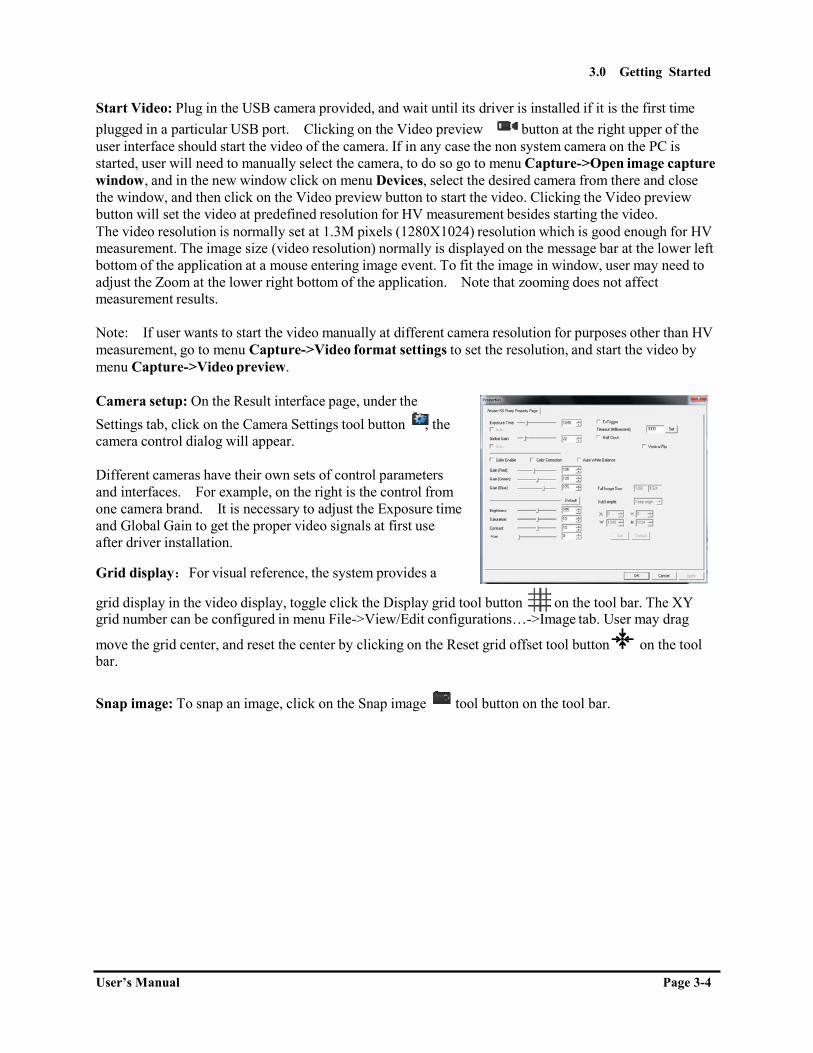
Start Video: Plug in the USB camera provided, and wait until its driver is installed if it is the first time plugged in a particular USB port. Clicking on the Video preview button at the right upper of the user interface should start the video of the camera. If in any case the non system camera on the PC is started, user will need to manually select the camera, to do so go to menu Capture->Open image capture window, and in the new window click on menu Devices, select the desired camera from there and close the window, and then click on the Video preview button to start the video. Clicking the Video preview button will set the video at predefined resolution for HV measurement besides starting the video. The video resolution is normally set at 1.3M pixels (1280X1024) resolution which is good enough for HV measurement. The image size (video resolution) normally is displayed on the message bar at the lower left bottom of the application at a mouse entering image event. To fit the image in window, user may need to adjust the Zoom at the lower right bottom of the application. Note that zooming does not affect measurement results.
Note: If user wants to start the video manually at different camera resolution for purposes other than HV measurement, go to menu Capture->Video format settings to set the resolution, and start the video by menu Capture->Video preview.
Camera setup: On the Result interface page, under the Settings tab, click on the Camera Settings tool button , the camera control dialog will appear.
Different cameras have their own sets of control parameters and interfaces. For example, on the right is the control from one camera brand. It is necessary to adjust the Exposure time and Global Gain to get the proper video signals at first use after driver installation.
Grid display:For visual reference, the system provides a
grid display in the video display, toggle click the Display grid tool button on the tool bar. The XY grid number can be configured in menu File->View/Edit configurations…->Image tab. User may drag
move the grid center, and reset the center by clicking on the Reset grid offset tool button on the tool bar.
Snap image: To snap an image, click on the Snap image tool button on the tool bar.

3.0 Getting Started
User’s Manual Page 3-5
3.2.3 Camera calibration
In order to get quantitative geometry measurement (e.g., indentation diagonals) from the camera image it is necessary to calibrate the camera to obtain the conversion from pixel distances to their physical distances. There are two ways to calibrate the camera in the HV hardness measurement: 1) Calibration with a standard test sample; 2) Calibration on a standard calibration ruler or grid
1) Calibration with a standard test sampleUnload existing calibration: If no calibration is loaded in the system, after a HV measurement, the system will prompt user to enter its HV value for calibration. To recalibrate after a calibration, unload the calibration first, simply go to menu Calibration->Calibration viewer, enter the password if it was set or simply click Ok to pass if no password was set, click button Unload at the calibration viewer dialog. Ensure that the test force is set before the measurement calculation.
Measure: System provides two ways to measure HV on an indentation image: automatic or manual. To
automatically measure, click the Auto measure tool button , the system should find the indentation and mark it with a rectangular box or whatever marking method configured in Settings. To make a manual
measurement, click on the Manual measure tool button to toggle the mouse in manual measure mode with the cursor in cross hair, click on the 4 vertices of the indentation (in any order). After the measurement, system will prompt user to enter the HV value of the test sample. After user enters the HV value and click OK, the system will automatically load and save the calibration with a default name “HVSampleCalibration” or “HVSampleCalibration_1000g” in the case of Basic version, or like “HVSampleCalibration_40X” or “HVSampleCalibration_1000g_40X” in the advanced versions with lens or with lens plus test load at the suffix depending on if “Auto select calibration by test load” is enabled (refer to Settings for this feature). User may opt to click Cancel at the prompt, and mouse drag move the marking lines to fine adjust to match with the indentation vertices, and enter the HV finally.
Rename calibration: To rename a calibration, for example, to distinguish between different lens and different test load in the Basic version, go to menu Calibration->Calibration viewer, select the calibration and click button rename to change the calibration name. For example, change the default calibration name “HVSampleCalibration” to “HVSampleCalibration_10X” or “HVSampleCalibration_40X”. Refer to Calibration management for details.
Re-calibrate with sample average: For better calibration accuracy, the system allows user to re-calibrate with the average of the HV values from the calibration sample. To do so, measure HV values on multiple indentations on the same sample to get the average, click
on the Re-calibrate with sample average button in the Settings tab and enter the sample HV value at the prompt. The calibration loaded is re-calibrated and saved automatically.
2) Calibration on a ruler or gridUser may prefer to calibrate the camera directly with a standard ruler instead of a standard hardness sample, especially when the calibration is used in geometry measurement instead of hardness measurement. The system provides two ways to do calibration with a ruler or grid: a) Manual calibration; b) Automatic calibration.

3.0 Getting Started
User’s Manual Page 3-6
a) Manual calibrationManual calibration simply calculates the linear scale between the pixel distance and the physical distance of two points on image. Place the calibration ruler or grid under the microscope lens, start video preview, move the ruler to make sure the lines are approximately aligned in the XY directions, and snap
an image by pressing the Snap image button on the tool bar. Select menu Calibration -> Manual calibration, hold down the mouse and drag from one the center of one line to another line with adequate separation distance and then release mouse. Enter the physical distance between the two lines and a name for the calibration. This calibration will be saved and be loaded later or immediately.
b) Automatic calibrationAutomatic calibration is much more complex in the algorithms but ironically it is more convenient in usage. It automatically finds the cross points on the grid image, map them to their physically locations and obtain the true 2-D mapping between a physical location and its pixel location via interpolation.
Instead of a calibration ruler, a calibration grid is needed to do the automatic calibration. First select menu Calibration->Auto calibration settings to set up the X&Y line distance, unit etc. If the lines in image will be darker than the background then Invert Image needs to be checked. Snap an image with the grid approximately aligned in XY directions. Select menu Calibration->Automatic calibration, the system will locate and mark most of the cross points of the grid image.
3.0 Getting Started
User’s Manual Page 3-7
3.2.4 Calibration management
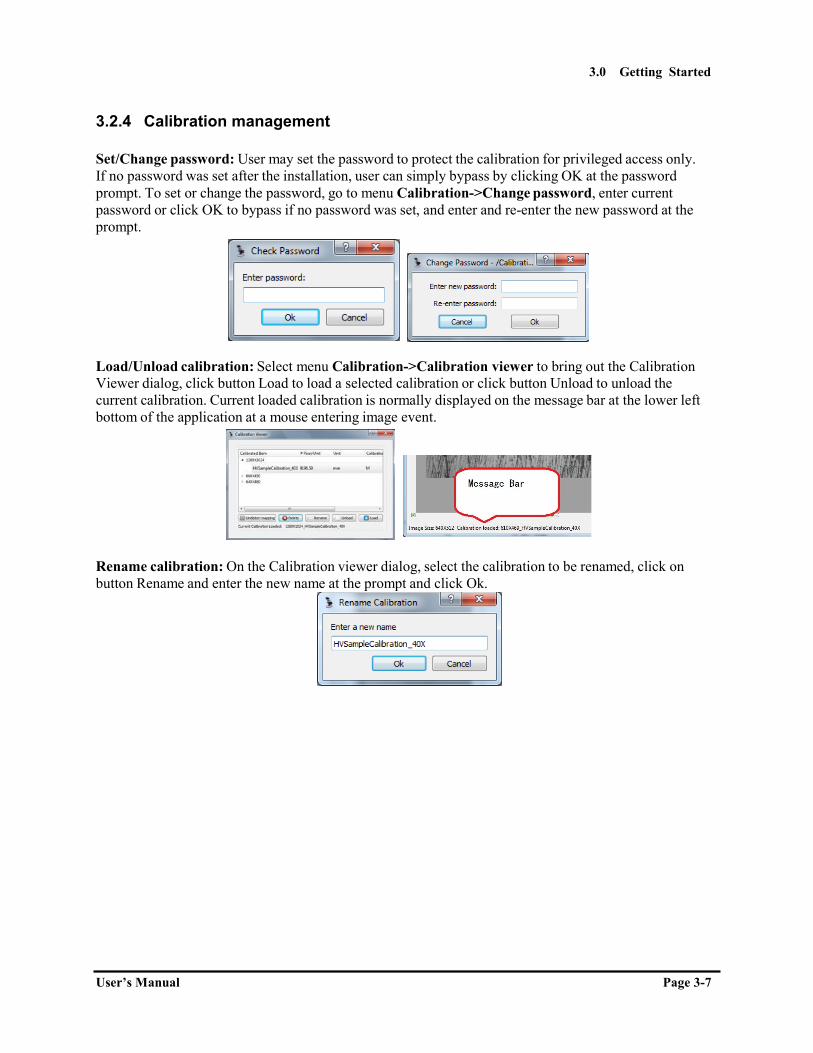
Set/Change password: User may set the password to protect the calibration for privileged access only. If no password was set after the installation, user can simply bypass by clicking OK at the password prompt. To set or change the password, go to menu Calibration->Change password, enter current password or click OK to bypass if no password was set, and enter and re-enter the new password at the prompt.
Load/Unload calibration: Select menu Calibration->Calibration viewer to bring out the Calibration Viewer dialog, click button Load to load a selected calibration or click button Unload to unload the current calibration. Current loaded calibration is normally displayed on the message bar at the lower left bottom of the application at a mouse entering image event.
Rename calibration: On the Calibration viewer dialog, select the calibration to be renamed, click on button Rename and enter the new name at the prompt and click Ok.
3.0 Getting Started
User’s Manual Page 3-8
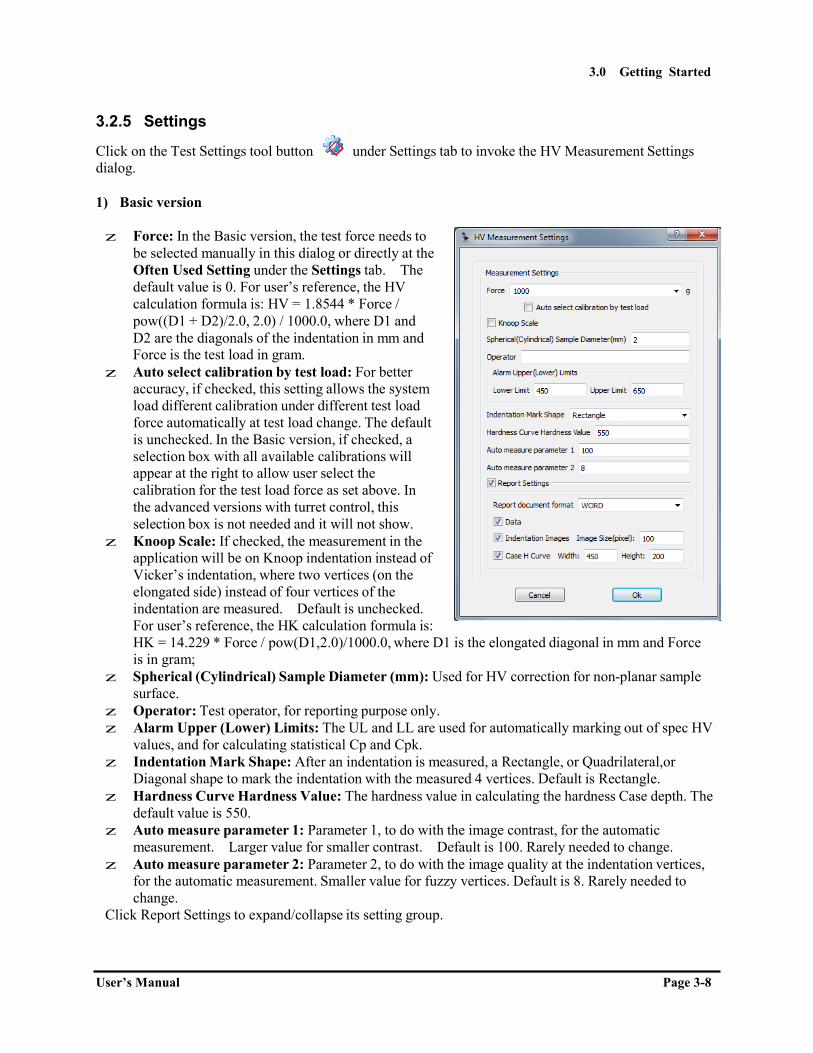
3.2.5 Settings
Click on the Test Settings tool button under Settings tab to invoke the HV Measurement Settings dialog.
1) Basic version
z Force: In the Basic version, the test force needs to be selected manually in this dialog or directly at the Often Used Setting under the Settings tab. The default value is 0. For user’s reference, the HV calculation formula is: HV = 1.8544 * Force / pow((D1 + D2)/2.0, 2.0) / 1000.0, where D1 and D2 are the diagonals of the indentation in mm and Force is the test load in gram.
z Auto select calibration by test load: For better accuracy, if checked, this setting allows the system load different calibration under different test load force automatically at test load change. The default is unchecked. In the Basic version, if checked, a selection box with all available calibrations will appear at the right to allow user select the calibration for the test load force as set above. In the advanced versions with turret control, this selection box is not needed and it will not show.
z Knoop Scale: If checked, the measurement in the application will be on Knoop indentation instead of Vicker’s indentation, where two vertices (on the elongated side) instead of four vertices of the indentation are measured. Default is unchecked. For user’s reference, the HK calculation formula is: HK = 14.229 * Force / pow(D1,2.0)/1000.0, where D1 is the elongated diagonal in mm and Force is in gram;
z Spherical (Cylindrical) Sample Diameter (mm): Used for HV correction for non-planar sample surface.
z Operator: Test operator, for reporting purpose only. z Alarm Upper (Lower) Limits: The UL and LL are used for automatically marking out of spec HV
values, and for calculating statistical Cp and Cpk. z Indentation Mark Shape: After an indentation is measured, a Rectangle, or Quadrilateral,or
Diagonal shape to mark the indentation with the measured 4 vertices. Default is Rectangle. z Hardness Curve Hardness Value: The hardness value in calculating the hardness Case depth. The
default value is 550. z Auto measure parameter 1: Parameter 1, to do with the image contrast, for the automatic
measurement. Larger value for smaller contrast. Default is 100. Rarely needed to change. z Auto measure parameter 2: Parameter 2, to do with the image quality at the indentation vertices,
for the automatic measurement. Smaller value for fuzzy vertices. Default is 8. Rarely needed to change.
Click Report Settings to expand/collapse its setting group.

3.0 Getting Started
User’s Manual Page 3-9
z Report document format: Selection of WORD or EXCEL format for the report. Data, Indentation Images, and the Case H Curve and be checked or unchecked for reporting. Indentation image width and the Case curve width and height in pixels can be specified.
For convenience, in the Basic version, the test load force and the calibration can be selected in the Often Used Settings section under Settings tab. Note that in the advanced versions, force and calibration are automatically loaded in so this Often Used Settings does not show.
2) With Turret Control version
Click Turret Settings to expand/collapse the turret settings. These settings parameters are test machine dependent and vendor dependent, they are normally set once after the system installation. After setting the turret settings, it is required to exit and restart the system.
z Installed Lens: The object lens on the test machine may be 20X or 40X, or another magnification.
3.0 Getting Started
User’s Manual Page 3-10
z Add test load items: In some test machines, setting the test load can be done remotely by the system, and the test load values need to set for all the test load indexes in the system. After check this item, a test load selection box will show to let user specify the test loads. Note the test load items selected need to match with the test load indexes in order.
z Force value sent by index: This is normally used in combination with Add test load items. Check this setting if the machine commands the test load by index instead of its value.
z Write back HV to machine: Some machine accepts HV input for display after the system make a HV measurement.
z Add printing statistics: Some machines are equipped a printer that accepts printing from the system. If checked, a Printer tool button and COM port selection box will show under the Statistics tab.
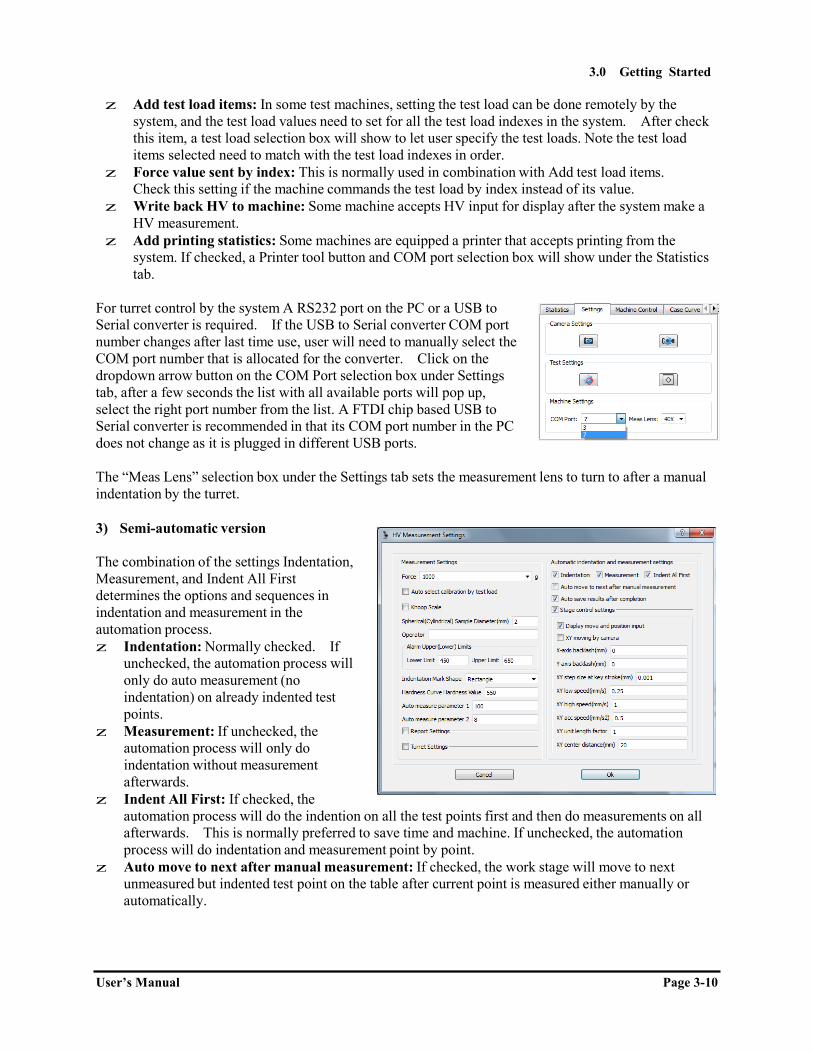
For turret control by the system A RS232 port on the PC or a USB to Serial converter is required. If the USB to Serial converter COM port number changes after last time use, user will need to manually select the COM port number that is allocated for the converter. Click on the dropdown arrow button on the COM Port selection box under Settings tab, after a few seconds the list with all available ports will pop up, select the right port number from the list. A FTDI chip based USB to Serial converter is recommended in that its COM port number in the PC does not change as it is plugged in different USB ports.
The “Meas Lens” selection box under the Settings tab sets the measurement lens to turn to after a manual indentation by the turret.
3) Semi-automatic version
The combination of the settings Indentation, Measurement, and Indent All First determines the options and sequences in indentation and measurement in the automation process. z Indentation: Normally checked. If
unchecked, the automation process will only do auto measurement (no indentation) on already indented test points.
z Measurement: If unchecked, the automation process will only do indentation without measurement afterwards.
z Indent All First: If checked, the automation process will do the indention on all the test points first and then do measurements on all afterwards. This is normally preferred to save time and machine. If unchecked, the automation process will do indentation and measurement point by point.
z Auto move to next after manual measurement: If checked, the work stage will move to next unmeasured but indented test point on the table after current point is measured either manually or automatically.
3.0 Getting Started
User’s Manual Page 3-11
z Auto save results after completion: If checked, after an automation process the system automatically saves the current results to a temporary file which can be retrieved (to retrieve, see Data Saving and Retrieval in standard features).
Click on the Stage control settings checkbox to expand or collapse the display. z Display move and position input: If checked, the set move control and the position display will
show inside the Machine Control tab. This is useful if user needs to enter the move amount of the stage frequently.
z XY moving by camera: Up to user’s preference, this determines whether the stage moves in the same direction or opposite to the arrow buttons on the interface. If checked, for example, when user clicks on the right move arrow, the stage will move to left and the field of view will move to right.
z X-axis backlash (mm): The backlash of the X axis. The stage is normally made with no backlash. Default 0. No need to use.
z Y-axis backlash (mm): The backlash of the Y axis. z XY step size at key stroke (mm): The amount of move at a single arrow key press. Default
0.001mm. z XY low speed (mm/s): XY low speed. Default 0.25mm/s. z XY high speed (mm/s): XY high speed. Default 1.0mm/s. z XY acc speed (mm/s2): XY acceleration speed in going to high speed. Default 0.5mm/s2. Normally
no need to change. z XY unit length factor: Used to correct the pitch of the stage lead screw. Default 1. Normally no
need to change. z XY center distance (mm): The distance from the stage center to the limiting sensors. Default 20.
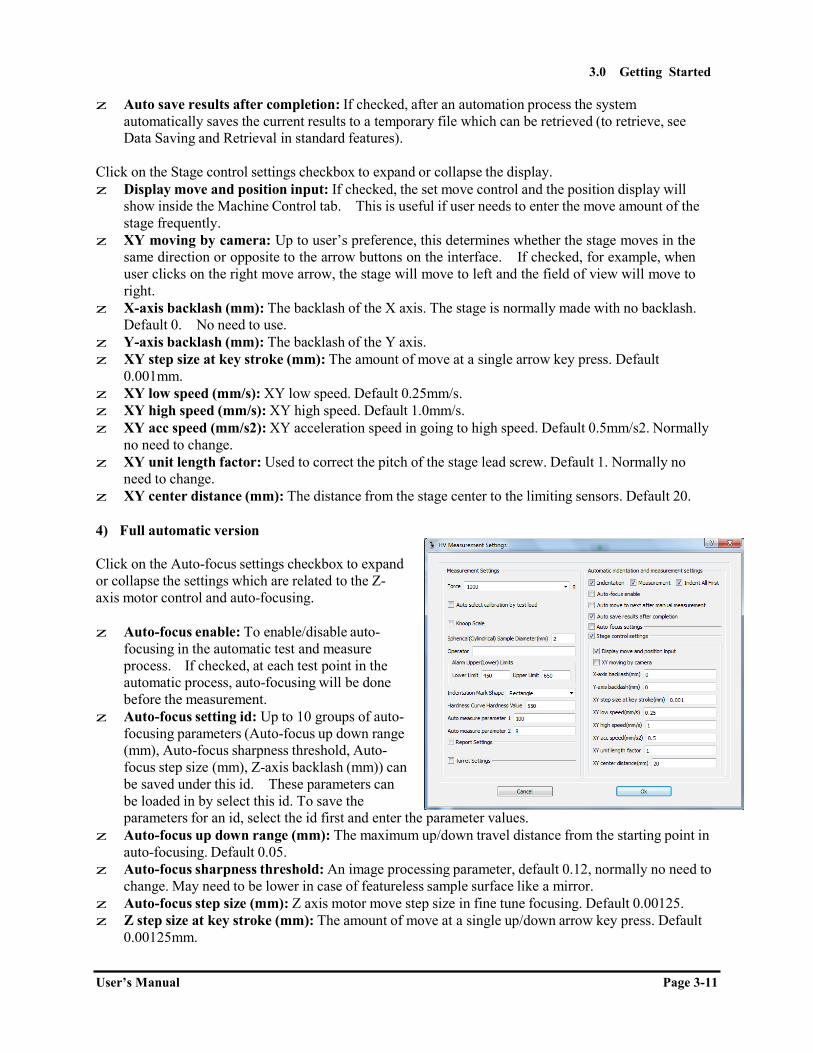
4) Full automatic version
Click on the Auto-focus settings checkbox to expand or collapse the settings which are related to the Z- axis motor control and auto-focusing.
z Auto-focus enable: To enable/disable auto- focusing in the automatic test and measure process. If checked, at each test point in the automatic process, auto-focusing will be done before the measurement.
z Auto-focus setting id: Up to 10 groups of auto- focusing parameters (Auto-focus up down range (mm), Auto-focus sharpness threshold, Auto- focus step size (mm), Z-axis backlash (mm)) can be saved under this id. These parameters can be loaded in by select this id. To save the parameters for an id, select the id first and enter the parameter values.
z Auto-focus up down range (mm): The maximum up/down travel distance from the starting point in auto-focusing. Default 0.05.
z Auto-focus sharpness threshold: An image processing parameter, default 0.12, normally no need to change. May need to be lower in case of featureless sample surface like a mirror.
z Auto-focus step size (mm): Z axis motor move step size in fine tune focusing. Default 0.00125. z Z step size at key stroke (mm): The amount of move at a single up/down arrow key press. Default
0.00125mm.

3.0 Getting Started
User’s Manual Page 3-12
z Z low speed (mm/s): Z low speed. Default 0.0625mm/s. z Z high speed (mm/s): Z high speed. Default 1.0mm/s. z Z acc speed (mm/s2): Z acceleration speed in going to high speed. Default 0.5mm/s2. Normally no
need to change. z Z safety single move (mm): A safety feature to prevent the Z motor from running in continuous
mode in case of communication loss with the system. If set with a positive number, the Z motor will travel at maximum such distance before resuming move. Therefore intermittent stops are observed in raising/lowering the stage. If this parameter is set with zero or a negative number, this safety feature would be disabled. Default is 3.
z Z unit length factor: Used to correct the pitch of the Z shaft lead screw. Default 1. Normally no need to change after set up.
3.0 Getting Started
User’s Manual Page 3-13
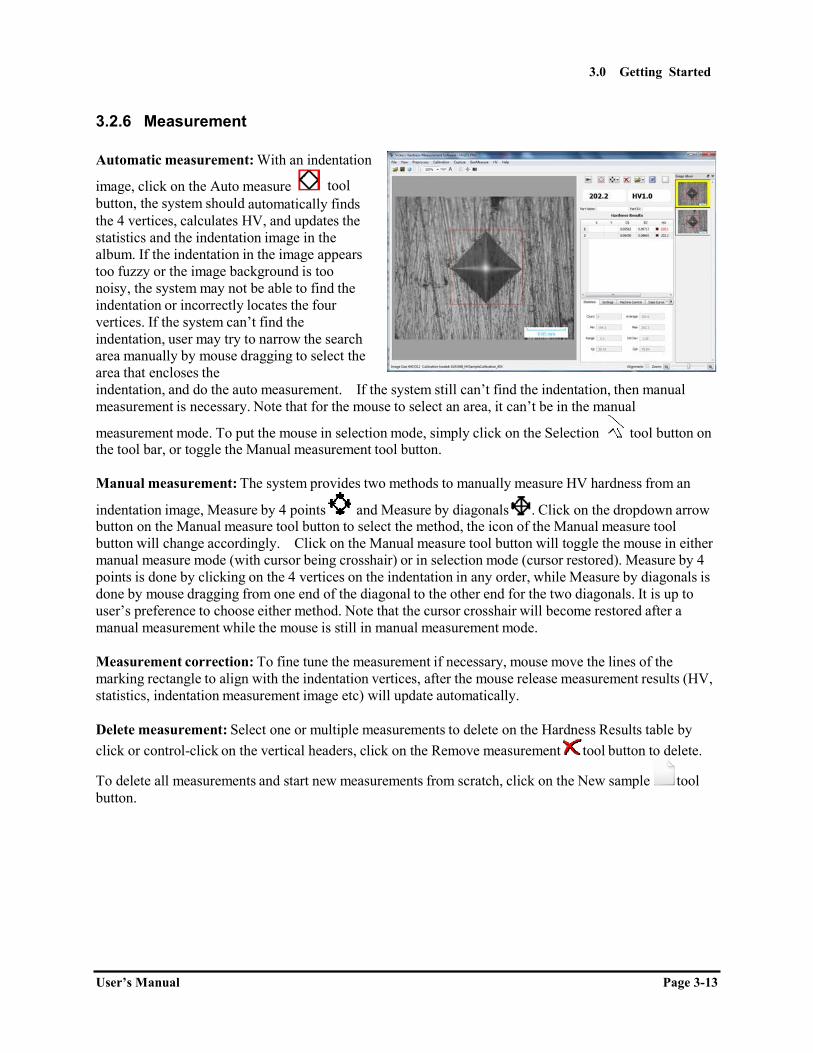
3.2.6 Measurement
Automatic measurement: With an indentation
image, click on the Auto measure tool button, the system should automatically finds the 4 vertices, calculates HV, and updates the statistics and the indentation image in the album. If the indentation in the image appears too fuzzy or the image background is too noisy, the system may not be able to find the indentation or incorrectly locates the four vertices. If the system can’t find the indentation, user may try to narrow the search area manually by mouse dragging to select the area that encloses the indentation, and do the auto measurement. If the system still can’t find the indentation, then manual measurement is necessary. Note that for the mouse to select an area, it can’t be in the manual
measurement mode. To put the mouse in selection mode, simply click on the Selection tool button on the tool bar, or toggle the Manual measurement tool button.
Manual measurement: The system provides two methods to manually measure HV hardness from an
indentation image, Measure by 4 points and Measure by diagonals . Click on the dropdown arrow button on the Manual measure tool button to select the method, the icon of the Manual measure tool button will change accordingly. Click on the Manual measure tool button will toggle the mouse in either manual measure mode (with cursor being crosshair) or in selection mode (cursor restored). Measure by 4 points is done by clicking on the 4 vertices on the indentation in any order, while Measure by diagonals is done by mouse dragging from one end of the diagonal to the other end for the two diagonals. It is up to user’s preference to choose either method. Note that the cursor crosshair will become restored after a manual measurement while the mouse is still in manual measurement mode.
Measurement correction: To fine tune the measurement if necessary, mouse move the lines of the marking rectangle to align with the indentation vertices, after the mouse release measurement results (HV, statistics, indentation measurement image etc) will update automatically.
Delete measurement: Select one or multiple measurements to delete on the Hardness Results table by click or control-click on the vertical headers, click on the Remove measurement tool button to delete.
To delete all measurements and start new measurements from scratch, click on the New sample tool button.

3.0 Getting Started
User’s Manual Page 3-14
3.2.7 Utilities
Statistics: After each measurement, the statistical values displayed under Statistics tab are automatically updated.
User may uncheck RP column to exclude particular test points for statistics and reporting.
For user’s reference: Cp = abs(UL - LL) / 6 / StdDev; Cpk = Cp * (1 - abs(Average - (UL + LL)/2) / abs(UL - LL) * 2). UL and LL are the upper limit and lower limit set in the Settings.
Case Curve: Case Curve is displayed under tab Case Curve. For the Basic version and the With Turret Control version, to plot the hardness Case curve, it is necessary for user to manually enter the depth values for the test points in the X column in the Hardness Results table(Note: Y column is ignored). At each point entry, the curve display is automatically updated. For the Semi-Automatic and Full Automatic versions, the depth values of the test points are automatically entered by the system therefore there is no need for manual entry.
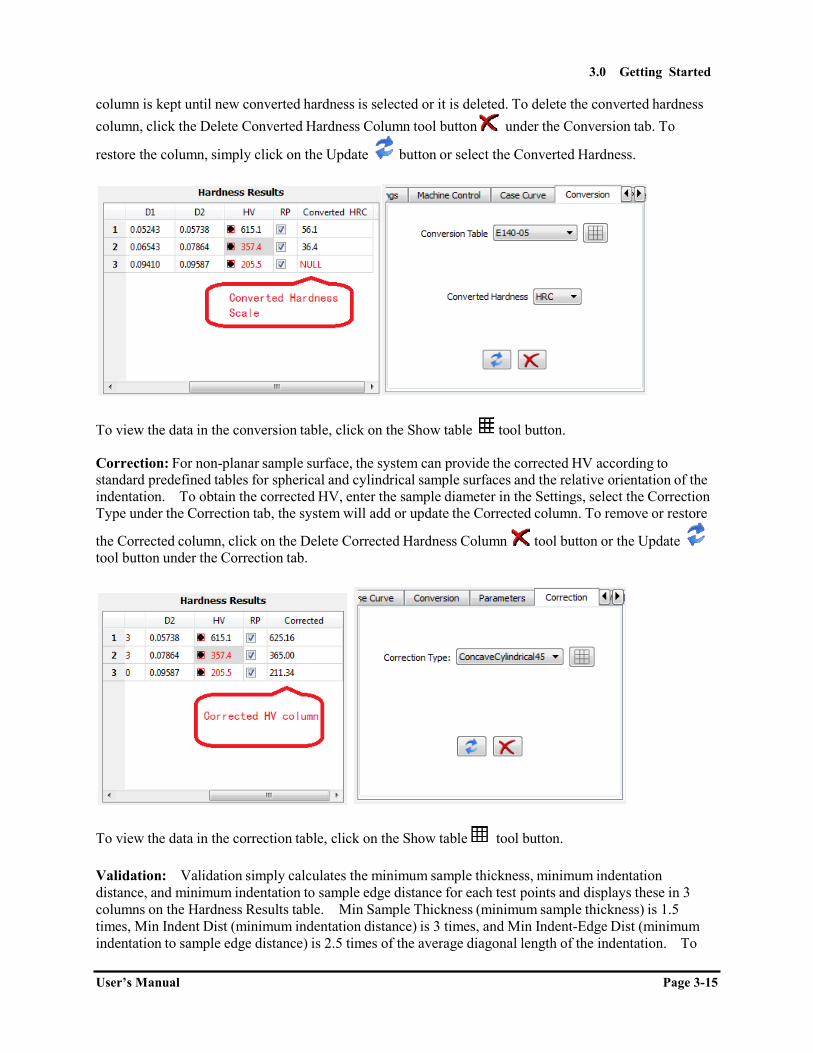
Conversion: Converts HV to other hardness scale. Select the Conversion Table (currently E 140-05 for ASTM, and GB T 1172-1999 for the Chinese standard are entered in the application, others can be easily added in) and the Converted Hardness, system automatically adds a column or updates the column Converted XXX in the Hardness Results table., where XXX is the converted hardness scale. This
3.0 Getting Started
User’s Manual Page 3-15
column is kept until new converted hardness is selected or it is deleted. To delete the converted hardness column, click the Delete Converted Hardness Column tool button under the Conversion tab. To
restore the column, simply click on the Update button or select the Converted Hardness.
To view the data in the conversion table, click on the Show table tool button.
Correction: For non-planar sample surface, the system can provide the corrected HV according to standard predefined tables for spherical and cylindrical sample surfaces and the relative orientation of the indentation. To obtain the corrected HV, enter the sample diameter in the Settings, select the Correction Type under the Correction tab, the system will add or update the Corrected column. To remove or restore
the Corrected column, click on the Delete Corrected Hardness Column tool button or the Update tool button under the Correction tab.
To view the data in the correction table, click on the Show table tool button.
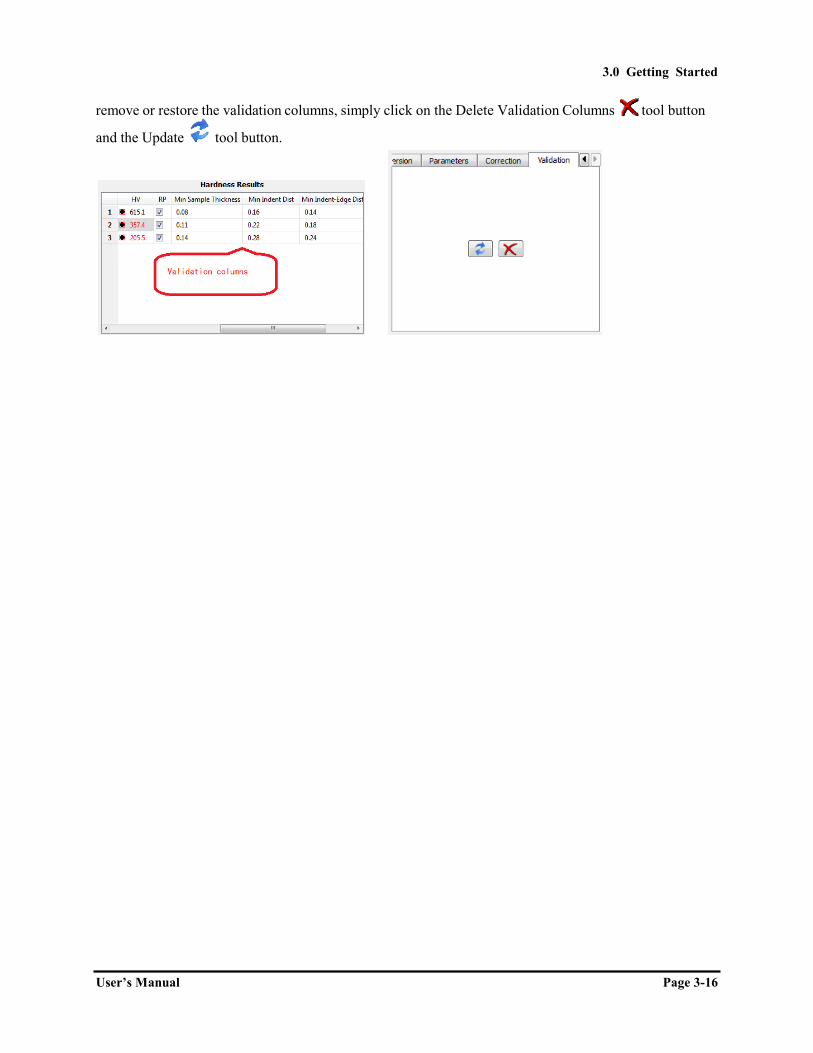
Validation: Validation simply calculates the minimum sample thickness, minimum indentation distance, and minimum indentation to sample edge distance for each test points and displays these in 3 columns on the Hardness Results table. Min Sample Thickness (minimum sample thickness) is 1.5 times, Min Indent Dist (minimum indentation distance) is 3 times, and Min Indent-Edge Dist (minimum indentation to sample edge distance) is 2.5 times of the average diagonal length of the indentation. To
User’s Manual Page 3-16
3.0 Getting Started
remove or restore the validation columns, simply click on the Delete Validation Columns tool button
and the Update tool button.
User’s Manual Page 3-17
3.0 Getting Started
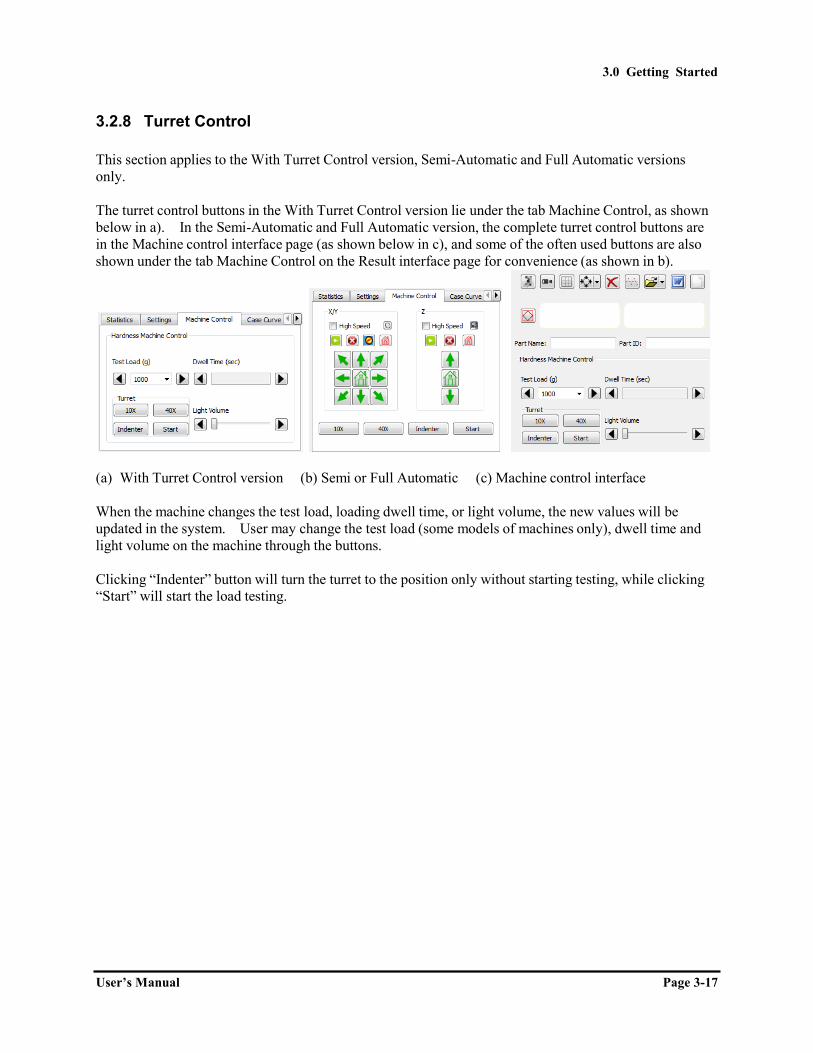
3.2.8 Turret Control
This section applies to the With Turret Control version, Semi-Automatic and Full Automatic versions only.
The turret control buttons in the With Turret Control version lie under the tab Machine Control, as shown below in a). In the Semi-Automatic and Full Automatic version, the complete turret control buttons are in the Machine control interface page (as shown below in c), and some of the often used buttons are also shown under the tab Machine Control on the Result interface page for convenience (as shown in b).
(a) With Turret Control version (b) Semi or Full Automatic (c) Machine control interface
When the machine changes the test load, loading dwell time, or light volume, the new values will be updated in the system. User may change the test load (some models of machines only), dwell time and light volume on the machine through the buttons.
Clicking “Indenter” button will turn the turret to the position only without starting testing, while clicking “Start” will start the load testing.

User’s Manual Page 3-18
3.0 Getting Started
3.2.9 Stage Control
This section applies to the Semi-Automatic and Full Automatic versions only.
1) Sample stage specifications: The XY sample stage is anintegrated platform with two separate linear motions driven by two28 stepping motors (mounted with two manual turning knobs withscales). The standard platform dimensions are 100mm X100mm, with 50mm X 50mm travel range. The linear motionmechanism consists of high precision lead screws with 0.5mmpitch, and stepping motors with standard motion of 1.8° per step.The precision of the stage is normally less than 2µm. Thestationary test load of the standard sample stage is larger than50KG. Non standard stages can be ordered with customized specifications.
2) Sample stage move control: Refer to settings for stage high/low speed setup.
Manual move: To move the sample stage manually by the system, press the direction buttons eitheron the Machine control page, or the little buttons surrounding the main image panel, or the directionbuttons under the Machine Control tab. Check High Speed if to move the stage in high speed,uncheck if in low speed.
Direction buttons on (a) Machine Control interface page; (b) surrounding image panel
Direction buttons under Machine Control tab with the Display move and position input in settings: (a) not set, default; and (b) set

User’s Manual Page 3-19
3.0 Getting Started
Fine move: To move the stage with fine steps, move the mouse over the X/Y control panel and strike the arrow keys on the keyboard. Refer to the Settings section for keystroke step size.
Home: To set current position home (for relative position), click on the red Set Current Position
Home button . To move the stage home, click the green Move to home button .
Set Move: To set the amount of move or set the relative position to move, enter the amout in Set Mov or Set Rel Pos, and click on the Go button to start move.
Reset: Occasionally user will need to reset the stage in absolute position by clicking the Reset
button to let the stage move all the way to touch the XY limiting switches and move to the stage center and reset the absolute position of the stage.
3) Scanning sample edge: The system provides thecapability to automatically move the stage and scanalong the sample edge. First, manually move thesample to make its edge appear in the view. Click theContour Scan button on the stage control panel toshow the scan window, and depending on the scandirection click clockwise or counter-clockwise
button to start scanning. Note that system should be calibrated before scanning. Click the pause/resume
( or ) button to pause/resume. After scanningis stopped, to move the sample stage to a specific location on the sample, hold the Ctrl key andmouse press on the scanned image, the sample stage should move the sample location correspondingto the mouse pressed location.
4) Z axis move and autofocus (Full Automatic version only): The Z axiscontrol and settings are similar to the XY control. User may use thedirection buttons, the arrow keys on the keyboard, or enter the amount onSet Mov or Set Rel Pos to move. To manually start auto-focusing, click
the Auto Focus button and the system will start auto-focusing.
User’s Manual Page 3-20
3.0 Getting Started
3.2.10 Set Pattern and Path
This section applies to the Semi-Automatic and Full Automatic versions only.
Very often it is necessary to set one or more indentation patterns so user can easily set an indentation path for testing. After the pattern is set, user will just need to set the starting point and the indentation line direction for each test, system will automatically generate the test points according to the set pattern.
Currently the system provides 9 pattern types: 1) Line; 2) Line Set; 3) Free Click; 4) Horizontal Line; 5) Vertical Line; 6) Curve Line Sets; 7) Curve Matrices; 8) Click On Arc; and 9) Gear Fillet. Except 3) Free Click and 8) Click On Arc, all others are line oriented, and the Line type provides the basis for all of them. Setting up the Line type is explained in details below, which is a reference to all other types.
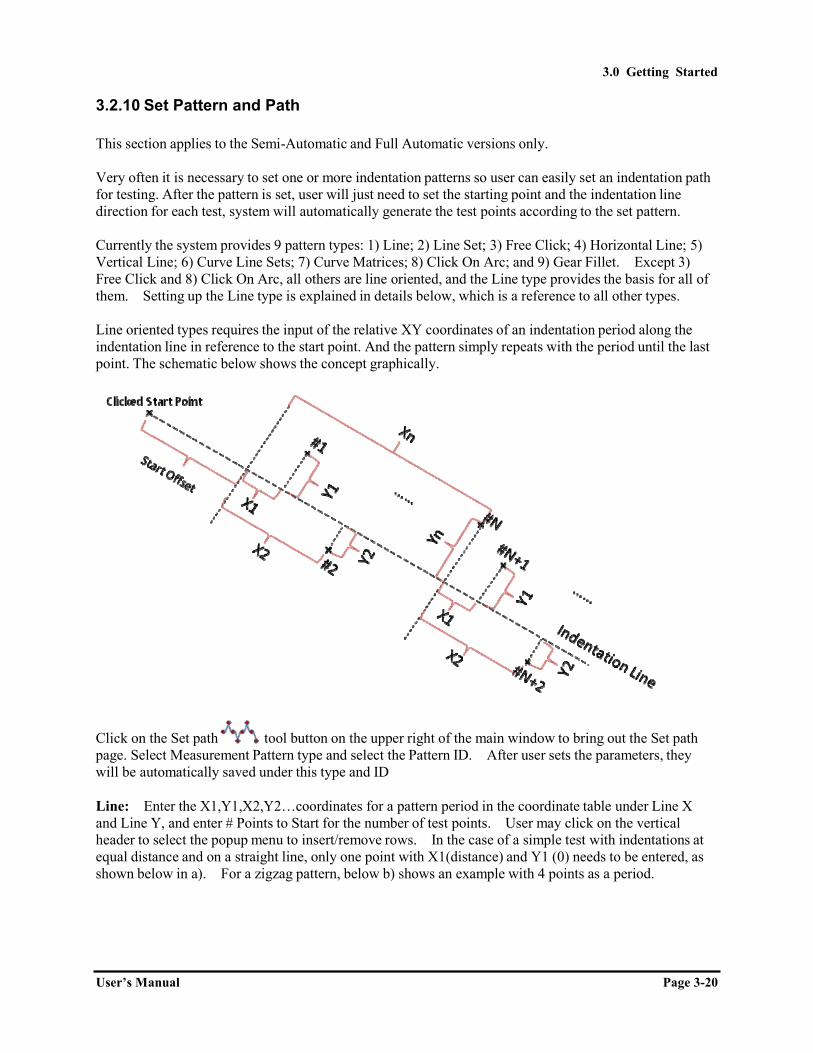
Line oriented types requires the input of the relative XY coordinates of an indentation period along the indentation line in reference to the start point. And the pattern simply repeats with the period until the last point. The schematic below shows the concept graphically.
Click on the Set path tool button on the upper right of the main window to bring out the Set path page. Select Measurement Pattern type and select the Pattern ID. After user sets the parameters, they will be automatically saved under this type and ID
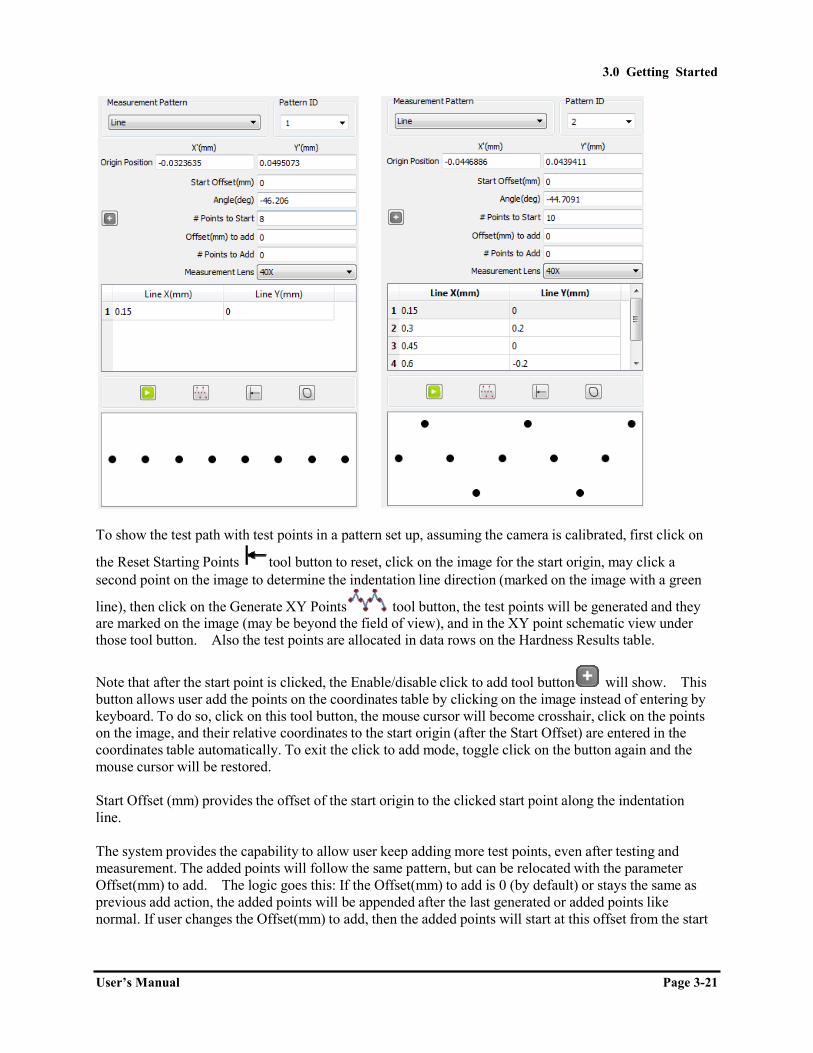
Line: Enter the X1,Y1,X2,Y2…coordinates for a pattern period in the coordinate table under Line X and Line Y, and enter # Points to Start for the number of test points. User may click on the vertical header to select the popup menu to insert/remove rows. In the case of a simple test with indentations at equal distance and on a straight line, only one point with X1(distance) and Y1 (0) needs to be entered, as shown below in a). For a zigzag pattern, below b) shows an example with 4 points as a period.
User’s Manual Page 3-21
3.0 Getting Started
To show the test path with test points in a pattern set up, assuming the camera is calibrated, first click on
the Reset Starting Points tool button to reset, click on the image for the start origin, may click a second point on the image to determine the indentation line direction (marked on the image with a green
line), then click on the Generate XY Points tool button, the test points will be generated and they are marked on the image (may be beyond the field of view), and in the XY point schematic view under those tool button. Also the test points are allocated in data rows on the Hardness Results table.
Note that after the start point is clicked, the Enable/disable click to add tool button will show. This button allows user add the points on the coordinates table by clicking on the image instead of entering by keyboard. To do so, click on this tool button, the mouse cursor will become crosshair, click on the points on the image, and their relative coordinates to the start origin (after the Start Offset) are entered in the coordinates table automatically. To exit the click to add mode, toggle click on the button again and the mouse cursor will be restored.
Start Offset (mm) provides the offset of the start origin to the clicked start point along the indentation line.
The system provides the capability to allow user keep adding more test points, even after testing and measurement. The added points will follow the same pattern, but can be relocated with the parameter Offset(mm) to add. The logic goes this: If the Offset(mm) to add is 0 (by default) or stays the same as previous add action, the added points will be appended after the last generated or added points like normal. If user changes the Offset(mm) to add, then the added points will start at this offset from the start

User’s Manual Page 3-22
3.0 Getting Started
origin. To add points, specify the # Points to Add, click on the Generate XY Points tool button, points will be added and displayed.
Measurement Lens specifies the lens to use to measure after indentation in the automation process.
Line Set: This pattern is normally used in setting the indentation path perpendicular to sample edge. Click
on the Reset Starting Points tool button to reset, click on two points on the sample edge, the indentation line will appear with the specified Angle (default 90°) in the middle. User may still click on
the edge line to specify a new start point. Click on the Generate XY Points tool button to generate the test points.
Free Click: This pattern allows user simply click on the sample image to get the test points. Click on the
Reset Starting Points tool button to reset, the Enable/disable click to add tool button will show, click it and the cursor will become crosshair, click on sample image to add points, and toggle click on the button to exit the click-to-add mode.
Horizontal Line: This is a special case of Line pattern, with the indentation line in the X direction only.
Vertical Line: This is a special case of Line pattern, with the indentation line in the X direction only.
Curve Line Sets: This pattern allows generating multiple line sets on a curve. Click on the Reset
Starting Points tool button to reset, click on the Enable/disable click to add tool button , the mouse cursor will become crosshair, click on two points on a section of curve, click the 3rd point to specify the start point, the indentation line will appear, repeat on other sections of the curve, toggle click on the Enable/disable click to add tool button to exit the click-to-add mode. Click on the Generate XY
Points tool button to generate the test points.
Curve Matrices: Similar to Curve Line Sets, this pattern allows generating multiple parallel line sets
(matrices). Click on the Reset Starting Points tool button to reset, click on the Enable/disable click to
add tool button , the mouse cursor will become crosshair, click on two points on a section of curve, parallel lines with line distance specified will show between the two points, repeat on other sections of the curve, toggle click on the Enable/disable click to add tool button to exit the click-to-add mode. Click on
the Generate XY Points tool button to generate the test points. Note that if the distance between a point to be generated with an existing point is less than the Min Valid Distance, this point will not be generated.
Click On Arc: This pattern lets user draw an arc first, and click on images to add test points. Click on
the Reset Starting Points tool button to reset, click on the center of the arc on the image, if with further clicking, the 2nd click will specify the radius, the 3rd click will specify the start angle, and the 4th
click will specify the span angle. Click on the Enable/disable click to add tool button , the mouse cursor will become crosshair, click on the arc to add test points. Toggle click on the Enable/disable
click to add tool button to exit the click-to-add mode. Click on the Generate XY Points tool button to generate the test points.

User’s Manual Page 3-23
3.0 Getting Started
Gear Fillet: This pattern finds a location relative to the gear fillet along a specified angle from the gear fillet point and with a distance of the maximum of gear module and five times of the hardness depth which can be measured along the path. The gear fillet point should be obtained by scanning the gear edge from the gear top to fillet. The system can automatically find the two gear top points and the gear fillet point in scanning if the “Auto find top and fillet in scanning” option is checked. Or user can manually mark the fillet point in the scan window by clicking the Clear Starting Points first, and followed by clicking the two gear top points, then the system can either automatically mark the gear fillet point or allow user to mark it manually depending on the option “Auto click gear fillet in scan window”. In the measurement process, after the hardness depth is obtained, the system allows user manually correct the measurement and then proceeds with automatically calculating the location, test and measure at the Gear Center position. After the manual correction, user can click on the Generate XY Points tool button to generate the Gear Center point for final testing.
User’s Manual Page 3-24
3.0 Getting Started
3.2.11 Automated Test and Measurement
After the test points are generated, click on the Auto Test Measure button to start the automation process. To pause the automation, mouse click on the image. To resume, click on the Auto Test Measure button.
3.2.12 Data Saving and Retrieval
Click on the dropdown arrow on the Open data file /Save data file tool button to select Open data file or Save data file to save/restore the measurement results. To save, select the path to store and name the data file.
3.2.13 Reporting
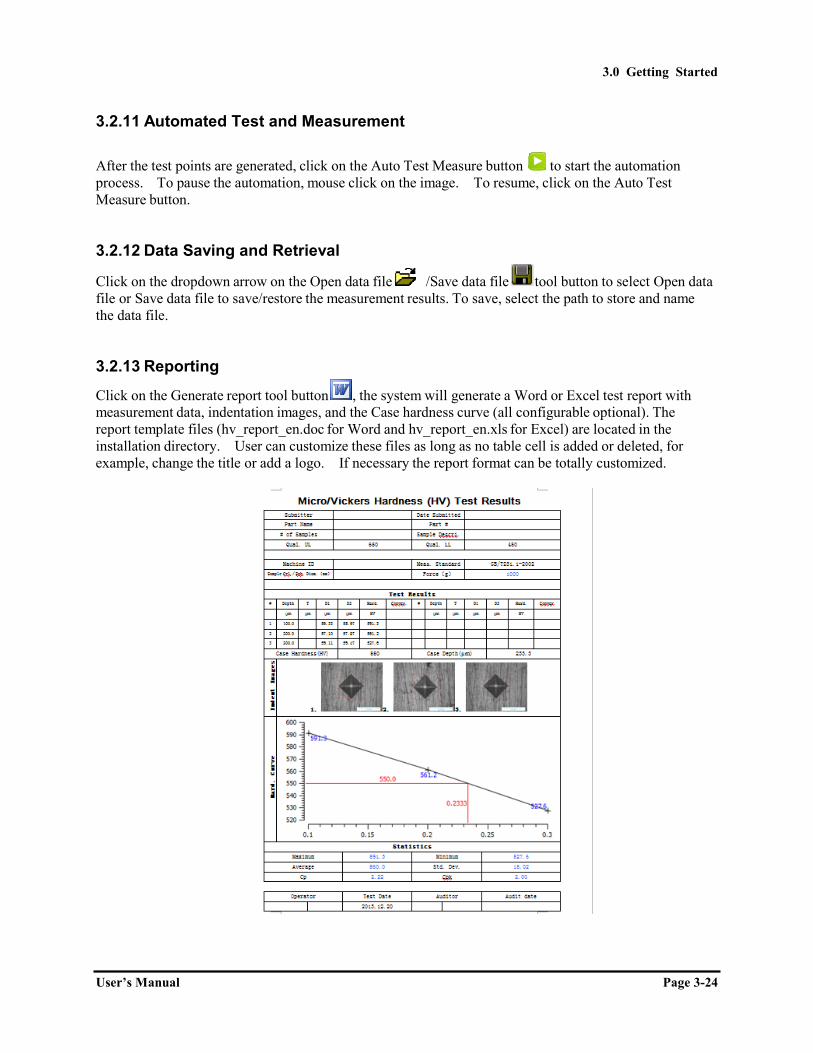
Click on the Generate report tool button , the system will generate a Word or Excel test report with measurement data, indentation images, and the Case hardness curve (all configurable optional). The report template files (hv_report_en.doc for Word and hv_report_en.xls for Excel) are located in the installation directory. User can customize these files as long as no table cell is added or deleted, for example, change the title or add a logo. If necessary the report format can be totally customized.

User’s Manual Page 3-25
3.0 Getting Started
3.3 Appendix: Using the standard features
For details on geometry measurement, refer to user’s manual iVision-PM_UserManual_en.
3.3.1 Image/Video capturing Select menu Capure->Open image capture window, and select the installed camera to use. Start video by
menu by clicking the Video Preview button . To snap a image, click on the Snap Image button . To start and save a video in .avi video format, go to Capure->Open image capture window, select menu Capture->Start Capture AV, enter or select the file name to save and the file size limit, click OK at the
prompt to start, and click on the Stop Capture Image button to stop, the .avi video file is saved automatically.
3.3.2 Camera calibration Place a microscope calibration ruler or grid roughly aligned in the XY direction, start the video, snap the image. Select menu Calibration->Manual calibration, mouse dragging from the center of one line to another with adequate separation, enter the physical distances between the two lines and name the calibration.
3.3.3 Calibration management Go to menu Calibration->calibration viewer, enter password or bypass if no password is set, user can unload the existing calibration, load a calibration, or rename a calibration.
3.3.4 Geometry measurement Select menu GeoMeasure -> GeoMeasure, the main interface of the geometry measurement will appear. Select the type of geometry measurement on the tool bar, and use mouse to draw and measure. User may edit a measurement by click selecting and mouse dragging on one of the control points on the measurement, and the corresponding measurement results and statistics will be automatically updated.

User’s Manual Page 3-26
3.0 Getting Started
3.3.5 Image processing Select menu Preprocess and its sub-menus to access the image processing tools.
3.3.6 Document entry
Click on the Document tool button and then on the image, enter text at the small text entry box. To edit the text or to enter complex HTML format documents, double click on the text to invoke the document editor.
To edit the text in HTML format, select HTML on Text type. To insert table, list, or image, click on the tool buttons at the right bottom. The tool buttons to change font, text color, and text alignment lie at the left bottom.
3.3.7 Album management z To view the album, select menu View->Image Album. To change image display size in album, move
the splitter. Album can be docked in the main window and it can be floated also. z Double-click on the image will copy the image into the album, and conversely double-click on the
image on the album will copy it to the image panel z To open/save album file go to menu File z To reorder the images in album, drag an image with its frame and drop it to position z To remove an image or images on album, click to select and press the Delete key
3.3.8 Data Saving and Retrieval
Click on the dropdown arrow on the Open data file /Save data file tool button to select Open data file or Save data file to save/restore the measurement results. To save, select the path to store and name the data file.

User’s Manual Page 3-27
3.0 Getting Started
3.3.9 Reporting
Click on the Generate report tool button , the system will generate a Word document with the measurement data and measurement images, with the report setting specified under the Reporting Settings tab.
3.3.10 Printing with magnification Connect to the printer first and select menu File->Print… to bring up the printing dialog. Select or enter the desired magnification at the bottom, the image print size will change accordingly in preview. User may enter text (can be in HTML format to include tables,lists,images etc) under user input and the text will be saved for next printing. Analysis result tables and statistics summaries can be checked for printing. And all the above elements to be printed have options in printing locations in either top, bottom,left, and right. The textbox widths can be limited by their width inputs.
99 Washington Street Melrose, MA 02176 Phone 781-665-1400Toll Free 1-800-517-8431
Visit us at www.TestEquipmentDepot.com