micro fluidics next generation life science research
TRANSCRIPT

Chip in a lab: Microfluidics for next generation life science researchAaron M. Streets and Yanyi Huang Citation: Biomicrofluidics 7, 011302 (2013); doi: 10.1063/1.4789751 View online: http://dx.doi.org/10.1063/1.4789751 View Table of Contents: http://scitation.aip.org/content/aip/journal/bmf/7/1?ver=pdfcov Published by the AIP Publishing Advertisement:
This article is copyrighted as indicated in the abstract. Reuse of AIP content is subject to the terms at: http://scitation.aip.org/termsconditions. Downloaded to IP:
189.130.208.153 On: Wed, 16 Oct 2013 19:27:35

Chip in a lab: Microfluidics for next generation life scienceresearch
Aaron M. Streets1,2 and Yanyi Huang1,2,3,a)
1Biodynamic Optical Imaging Center (BIOPIC), Peking University, Beijing 100871, China2College of Engineering, Peking University, Beijing 100871, China3College of Chemistry and Molecular Engineering, Peking University,Beijing 100871, China
(Received 3 December 2012; accepted 14 January 2013; published online 31 January 2013)
Microfluidic circuits are characterized by fluidic channels and chambers with a
linear dimension on the order of tens to hundreds of micrometers. Components of
this size enable lab-on-a-chip technology that has much promise, for example,
in the development of point-of-care diagnostics. Micro-scale fluidic circuits also
yield practical, physical, and technological advantages for studying biological
systems, enhancing the ability of researchers to make more precise quantitative
measurements. Microfluidic technology has thus become a powerful tool in the life
science research laboratory over the past decade. Here we focus on chip-in-a-labapplications of microfluidics and survey some examples of how small fluidic
components have provided researchers with new tools for life science research.VC 2013 American Institute of Physics. [http://dx.doi.org/10.1063/1.4789751]
INTRODUCTION
Integrated microfluidic devices have been used in research labs for over twenty years1 and
within the last decade their use in life science research has increased dramatically in large part
because of the invention of soft lithography2 and microfluidic large scale integration.3 These
technological advances have increased the throughput of device production, improved rapid
prototyping efforts, and have enabled researchers to enhance the complexity and sophistication
of experiments that can be performed on a microfluidic chip. As a result, microfluidic technol-
ogy is beginning to realize its immense potential for research in life science and medicine.
The realm of microfluidic technology is home to a wide variety of embodiments and appli-
cations, but the motivation for its use in medicine and life science research can be reduced to
two essential themes. One reason that microfluidic solutions are desired is because the size of
the device itself is small. The other motivation to use microfluidic technology comes from the
advantages gained from the small size of individual fluidic components. The small device size
makes microfluidic technology the ideal platform for portable, point-of-care diagnostic devices.
In addition to being small, microfluidic devices can be easy to use, cheap to fabricate and
operate, require very little sample, and they can be easily disposed of. For these reasons and
more the handheld diagnostic device has been recognized as a potential killer application of
microfluidics and is the motivation for much of the research effort in microfluidic technology
development.
The commercially available glucose meter, for example, is often regarded as the archetype
for a handheld diagnostic device4 (Figure 1(a)). It is cheap ($10–$20 US), easy to operate,
provides a clear digital readout of blood glucose level, and uses disposable paper strips for sam-
ple delivery. By combining a miniature bio-sensor with a simple and passive microfluidic deliv-
ery system the glucose meter requires only a small drop of blood from a finger prick of the op-
erator. The use of paper in microfluidic device fabrication is emerging as a popular strategy
a)Author to whom correspondence should be addressed. Electronic mail: [email protected].
1932-1058/2013/7(1)/011302/23/$30.00 VC 2013 American Institute of Physics7, 011302-1
BIOMICROFLUIDICS 7, 011302 (2013)
This article is copyrighted as indicated in the abstract. Reuse of AIP content is subject to the terms at: http://scitation.aip.org/termsconditions. Downloaded to IP:
189.130.208.153 On: Wed, 16 Oct 2013 19:27:35

and is a promising format for point-of-care diagnostic devices.5 Microfluidic paper-based ana-
lytical devices or lPADs as coined by Whitesides6 (Figure 1(b)) are not only small, they are
also thin, cheap and disposable and thus would be ideal for healthcare applications in the devel-
oping world. Meanwhile, much work has been done to incorporate microfluidic pumps and
actuators into handheld devices for sophisticated and multifunctional diagnostics. For example,
a consortium headed by Paul Yager developed a prototype device called the DxBox, a handheld
device capable of differential diagnostics of disease specific antigens and antibodies.7 For a
more comprehensive survey of current developments towards point-of-care microfluidic immu-
noassay based diagnostic technology, see the review by Gervais and colleagues.8
While much of the research effort in the development of microfluidic technology has been
driven by the potential to use small “lab-on-a-chip” technology in point-of-care diagnostic appli-
cations, the private sector has yet to reap the full benefits of small microfluidic-based devices.
The small size of the individual fluidic circuit components in microfluidic devices, however, pro-
vides an arsenal of experimental advantages which make microfluidic solutions desirable, particu-
larly in life science research laboratories. Small components enable researchers to perform
experiments which are not possible or practical to execute with more traditional bench top tech-
niques. When evaluating tools of measurement, the size of the probe often determines the
FIG. 1. (a) Illustration of generic hand held digital glucose meter. (b) A microfluidic paper-based analytical device (lPAD)
Reprinted with permission from A. W. Martinez, S. T. Phillips, G. M. Whitesides, and E. Carrilho, Anal. Chem. 82(1),
3–10 (2010). Copyright 2010 American Chemical Society. (c) A microfluidic chip (inset) in a laboratory. The scale bars
are 10 cm and 1 cm (inset).
011302-2 A. M. Streets and Y. Huang Biomicrofluidics 7, 011302 (2013)
This article is copyrighted as indicated in the abstract. Reuse of AIP content is subject to the terms at: http://scitation.aip.org/termsconditions. Downloaded to IP:
189.130.208.153 On: Wed, 16 Oct 2013 19:27:35

resolution and thus precision of the measurement. This is true for physical measurements like
atomic force microscopy which can achieve measurement resolution down to the angstrom scale
because of a probe tip which is sharpened to a single atom, and it is true for optical measure-
ment, where resolution is proportional to the inverse of the wavelength of the probing light. This
concept is also true in biological measurement in many respects. With fluidic components that
approach the cellular scale, microfluidic circuits offer exquisite liquid handling capabilities allow-
ing manipulation of single cells and even single molecules in vitro. The size of the components
of a microfluidic circuit also allows for high density and parallel architecture thereby increasing
the throughput of biological and chemical assays for more precise characterization of heterogene-
ous systems. Additionally, microfluidic devices are compatible with integration into experimental
setups ranging from custom built optical analysis apparatuses to commercial imaging systems
and can execute computer automated protocols increasing the efficiency and reproducibility of
experimentation. Because of these advantages, microfluidic devices have also been increasingly
used not only as a platform for chemical and biological analysis but also as a tool in larger ex-
perimental pipelines which require microfluidic solutions to sample preparation or quantification.
All of these virtues come from micrometer-scale fluidic components which yield an increased
ability to make precise quantitative biological measurements.
These two genres of microfluidic research collectively embody the great potential of micro-
fluidic technology in medicine. On one hand, point-of-care diagnostic device development is
centered on coming up with elegant solutions to practical problems to create accessible technol-
ogy for healthcare applications in resource limited locations. On the other hand, microfluidic
platforms are also routinely used in resource-rich research laboratories to provide innovative
solutions to “non-practical” problems which may yield fundamental insight into human biology.
Here, we focus on this second application of microfluidics and examine the roll of the inte-
grated microfluidic chip in life science research labs or “chip-in-a-lab” applications. Instead of
offering a comprehensive review of the state-of-the-art in microfluidic technology, we survey
some examples of how researchers have been able to exploit the small size of microfluidic
components and incorporate these devices into larger experimental pipelines to make high pre-
cision biological measurements. Here, we focus particularly on the miniaturization of fluidic
manipulation achieved with droplets and valves in devices made of polydimethylsiloxane
(PDMS). There is a large body of work based on electrophoretic manipulation in microfluidic
channels which is not covered here but is reviewed elsewhere.9 This work is organized by the
unique advantages that microfluidic technology offers in order to highlight ways in which
recent microfluidic innovations have revolutionized biology research.
SMALL VOLUMES
Fluidic channels and chambers that are tens to hundreds of micrometers wide are the defin-
ing characteristic of microfluidic devices. The small volume of these fluidic circuit components,
loosely on the order of nanoliters, enables experiments on-chip that have no bench top equiva-
lent. There are not only practical advantages of small reaction volumes in chemical and biologi-
cal analysis but there are also fundamental physical and chemical scaling effects that can be
exploited in microchannels and compartments. This section presents some old and some new
work to summarize the principle advantage of microfluidics.
One of the most basic benefits of performing analysis in small volumes is that very little
sample is needed. Low-sample consumption is one of the heralded virtues of microfluidic appli-
cations and an early demonstration of this was the use of microfluidic devices for protein crys-
tallization screening studies. One of the many challenges of protein crystallization is often the
low yield of protein purification. Many of the most coveted protein structures are in part
unsolved because of the precious little amount of undegraded product which comes off of puri-
fication columns, sometimes with as little as microgram yield for a standard purification proto-
col. Commercial screens, however, which are used to find crystallization conditions, often
require on the order of milligrams of protein to screen hundreds of different potential condi-
tions. Seasoned crystallographers have bags full of tricks to deal with the many obstacles of
011302-3 A. M. Streets and Y. Huang Biomicrofluidics 7, 011302 (2013)
This article is copyrighted as indicated in the abstract. Reuse of AIP content is subject to the terms at: http://scitation.aip.org/termsconditions. Downloaded to IP:
189.130.208.153 On: Wed, 16 Oct 2013 19:27:35

protein crystallization but more often than not brute force is the solution of choice and to com-
bat low purification yield researchers commonly undergo large volume protein preparation pro-
tocols, starting with up to tens of liters of growth media to harvest the bacteria needed for pro-
tein expression. In an early application of microfluidic large scale integration, Hansen et al.demonstrated an elegant solution to this problem by using a microfluidic platform for high-
throughput screening of crystallization reagents.10,11 They used two devices; one was a micro-
fluidic formulation device (Figure 2(a)) based on a ring-shaped mixing chamber which used
peristaltic pumps to actively mix protein and reagent in order to characterize the solubility of
FIG. 2. (a) A microfluidic formulation device for high throughput solubility screening of proteins. The primary element is a
mixing ring. Peristaltic pumps (in red) inject protein and precipitant into ring and yellow pumps mix the contents of the
ring. Reprinted with permission from C. L. Hansen, M. O. A. Sommer, and S. R. Quake, Proc. Natl. Acad. Sci. USA
101(40), 14431–14436 (2004). Copyright 2004 National Academy of Sciences, USA. (b) A free interface diffusion based
mixing array for protein crystal screening similar to the device used in Refs. 11 and 12. (c) A simplified illustration of two
microfluidic valves creating a chamber. Typical channels are on the order of 100 lm. Chambers defined in the flow channel
by two such valves can be on the order of 100 pl. (d) An emulsion generator using cross flow to shear droplets from the
“Y” junction. The two reagents will eventually mix diffusively. (e) A diagram and micrograph showing bacterial confine-
ment in droplets. Green arrows point to bacteria which initiated quorum sensing. Reprinted with permission from J. Q. Boe-
dicker, M. E. Vincent, and R. F. Ismagilov, Angew. Chem., Int. Ed. Engl. 48(32), 5908–5911 (2009). Copyright 2009
Wiley-VCH Verlag GmbH & Co. KGaA, Weinheim. (f) A two-layered microfluidic device for trapping, lysing, and ampli-
fying the genetic material of single cells. Reprinted with permission from Y. Marcy, C. Ouverney, E. M. Bik, T. Losekann,
N. Ivanova, H. G. Martin, E. Szeto, D. Platt, P. Hugenholtz, D. A. Relman, and S. R. Quake, Proc. Natl. Acad. Sci. USA
104(29), 11889–11894 (2007). Copyright 2007 National Academy of Sciences, USA.
011302-4 A. M. Streets and Y. Huang Biomicrofluidics 7, 011302 (2013)
This article is copyrighted as indicated in the abstract. Reuse of AIP content is subject to the terms at: http://scitation.aip.org/termsconditions. Downloaded to IP:
189.130.208.153 On: Wed, 16 Oct 2013 19:27:35

the protein against combinations of various precipitants and buffers.10 With this automated de-
vice thousands of conditions could be coarsely screened with less than 10 ll of protein solution.
The second device (Figure 2(b)) incorporated a passive diffusion-based mixing scheme and was
used to screen high potential conditions identified in the formulation device.11 With less than
three microliters of protein this chip could perform crystal screens on 244 conditions demon-
strating a screening efficiency of over 100-fold better than commercial screens. This paradigm
has been used to solve novel protein structures12 and was appropriated into a commercial crys-
tal screening platform.
This crystallization platform is an example of how micro-chambers separated by microflui-
dic valves can been used for miniature compartmentalization (Figure 2(c)). Another effective
way to achieve small, isolated volumes on chip is with liquid emulsions or droplets (Figure
2(d)). Stable emulsions can be formed when one fluid is sheared into another immiscible fluid,
for example water in oil, using cross flow microfluidic channels.13 These droplets can be used
as miniature reactors by introducing multiphase flow to the immiscible medium.14 Droplet
based microfluidics occupies a large portion of the field and has been used for countless life
science research applications as well as in many commercial laboratory tools, some of which
we discuss in following sections. Zheng et al. demonstrated the droplet equivalent of the pro-
tein crystallization screening chip15 which can screen hundreds of conditions with microliters of
protein. This technology has also evolved into a commercial crystal screening product.16
Droplets created in microfluidic devices, which are most commonly in the range of a few
picoliters to hundreds of nanoliters, provide an important demonstration of how small volume
confinement can effectively amplify the concentration of molecules or cells under investigation.
An elegant example of this is the work by Boedicker et al. on quorum sensing in single bacte-
rial cells.17 When cells reach certain critical density, the concentration of secreted auto inducers
reaches a level that can be detected by neighboring cells and activates quorum sensing. At low
cell density, these auto inducers rapidly diffuse and delocalize. In a small confined volume,
however, the concentration of one or few cells is effectively increased and secreted auto
inducers remain localized in the droplet, initiating quorum sensing with low numbers of cells or
even a single cell (Figure 2(e)).
In this work, droplets were created in a different manner18 than cross flow shearing but the
principle can be extended to any small volume confinement. We will see that variations on this
approach are exploited for a wide variety of applications. Marcy et al. took advantage of nano-
liter compartmentalization in a two-layer valve-based microfluidic chip for genomic amplifica-
tion of single cells. They developed a platform to isolate single cells in a series of chambers
for sequential lysis and genomic amplification using multiple displacement amplification and
used it to sequence the genomes of uncultivated bacteria found in the human oral cavity19 (Fig-
ure 2(f)). They showed that multiple displacement amplification benefits from the 60-nl reaction
chambers, which both increases the effective concentration of genetic material from a single
bacterial cell, and reduces amplification bias.20 Further examples of devices which take advant-
age of this particular small volume asset are discussed later.
The physical properties of fluids change drastically as length scale is reduced and many
microfluidic devices take advantage of the unique fluidic physics in small volumes. These phys-
ical properties are expressed by dimensionless numbers which define ratios between various flu-
idic parameters such as viscosity and buoyancy. For example, the Reynolds number is defined
as the ratio of inertial force to viscous force and is notoriously low in microfluidic channels.
When the Reynolds number is low (�1) viscosity overpowers inertia and thus particles or
molecules, which are not actively set into motion are limited to diffusive movement. The Gra-
shof number relates inertial to viscous forces for buoyancy driven flow and is helpful for under-
standing the extent of advective mixing in two fluids. The low Grashof number in microfluidic
channels is particularly advantageous in the case of protein crystallization on chip. In the pas-
sive protein crystal screening device developed by Hansen et al.,11 the precipitating reagent is
introduced into a micro-chamber containing protein through a process called free-interface dif-
fusion. This is a technique used in bench top crystallography in which protein and precipitant
solution are carefully prepared such that a free interface between the two liquids is created and
011302-5 A. M. Streets and Y. Huang Biomicrofluidics 7, 011302 (2013)
This article is copyrighted as indicated in the abstract. Reuse of AIP content is subject to the terms at: http://scitation.aip.org/termsconditions. Downloaded to IP:
189.130.208.153 On: Wed, 16 Oct 2013 19:27:35

mixing is purely diffusive creating a concentration gradient to form between protein and precip-
itant. In a macro-scale environment, however, advective mixing is only avoided by performing
the crystal reaction in low-gravity settings, or in a vertical capillary creating a horizontal inter-
face, perpendicular to the direction of gravity. Protein crystals nucleate at some specific point
along the chemical gradient but as they gain mass they can fall out of the region conducive to
crystal growth and dissolve. In the low Grashof number environment of microfluidic channels a
vertical free-interface can be created by “dead-end” filling two opposing channels separated by
a microfluidic valve. When the valve is opened, mixing of the two liquids is dominated purely
by diffusion and an ideal configuration for protein crystallization is created. Incidentally it is
the gas permeability of PDMS which allows the channels to be primed in this manner.
In general, small length scale fluid physics gives microfluidic devices unique and unex-
pected characteristics. Sometimes low Reynolds number or low Grashof number poses obstacles
to researchers, particularly when mixing reagents on chip. A significant body of work negotiates
the obstacles imposed by low Reynolds number flow by using surface acoustic waves to drive
transport in microfluidic channels.21 This technique can be used to pump fluid through micro-
channels achieving orders of magnitude increase in flow rates21,22 and has also been used for
active cell sorting applications.23,24 Often times the aspects of small volumes which would oth-
erwise pose obstacles in microfluidic manipulation, such as low Reynolds number, are exploited
for benefits which are unavailable in larger volumes. Cho et al., for example, developed a
clever method for separating motile sperm from a heterogeneous sample in a single layer device
by concentrating passive particles along laminar flow lines and relying on the active cells to
self separate.25 Additionally, Wang et al. exploited the high surface area-to-volume ratio in
microfluidic channels to capture circulating tumor cells with high efficiency.26
Low Reynolds number flow also becomes advantageous when it is necessary to manipulate
fluid in microfluidic channels with high precision. When inertia is negligible, the microfluidic
valve quantizes fluid manipulation the way an electric switch digitizes electronic signals. A single
valve is a three-terminal component in which a pressure level on one terminal, the control line,
determines the binary fluidic current on the flow line—on or off (Figure 2(c)). In this sense, the
valve is much like a transistor in an integrated electronic circuit, offering an added layer of com-
plexity in circuit architecture. With a minimum of three consecutive valves a peristaltic pump
can be created in which a cyclic input signal on the control lines moves discrete amounts of fluid
on the flow lines. The quantum of fluid that can be manipulated in a single pump cycle is related
to the volume beneath the valve. The pump thus offers exquisite metering resolution and can be
used to titrate chemicals with high reproducibility.
In collaboration with the Weiss group, we took advantage of microfluidic chemical metering
to map the conformation of single-stranded DNA molecules in a high density, multi-dimensional
chemical space.27 A microfluidic mixing circuit capable of performing arbitrary combinatorial
reactions of chemical inputs was integrated with a confocal microscope in order to make fluores-
cence resonance energy transfer measurements on single DNA molecules. The mixing circuit,
powered by a peristaltic pump, could perform serial chemical titrations with resolution of tens of
picoliters. With this automated device we constructed two- and three- dimensional conforma-
tional maps of the end-to-end distance of ssDNA in response to changing environmental condi-
tions by performing up to 64 sequential single molecule experiments (Figure 3(a)). On a practical
level, this work demonstrates how microfluidic automation can save a researcher time as well as
many tedious manual pipetting steps. However, it also shows how the advantage of small volume
fluidic manipulation can lead to fundamentally higher precision measurements. While typical
pipetting error can be around 0.5%, or 50 nanoliters for microliter reactions, the peristaltic pump
injection error is about 0.0001% or in this embodiment 10 femtoliters for 10 nanoliter injections.
While the typical valve can be used to define compartments of tens to hundreds of picoli-
ters, femtoliter confinements have also been incorporated into integrated microfluidic devices
using micro-wells fabricated with soft lithography. Our group patterned micro wells of 3 lm
diameter onto a deformable PDMS membrane in order to construct a chip capable of perform-
ing digital polymerase chain reaction in isolated microreactors packed at a density of greater
than 20 000/mm2 (Ref. 28) (Figure 3(b)). Microfluidic digital PCR is an established technique
011302-6 A. M. Streets and Y. Huang Biomicrofluidics 7, 011302 (2013)
This article is copyrighted as indicated in the abstract. Reuse of AIP content is subject to the terms at: http://scitation.aip.org/termsconditions. Downloaded to IP:
189.130.208.153 On: Wed, 16 Oct 2013 19:27:35

in which template DNA is diluted and distributed into independent chambers such that on aver-
age each chamber has either zero or one molecule. The contents of each chamber are then
amplified in parallel by PCR and single starting molecules are quantified by positive amplifica-
tion events detected with fluorescence of a TaqMan probe.29 This technique allows absolute
quantification of the starting genetic material without amplification noise or bias. The 36-fl
reaction chambers are particularly advantageous for digital PCR because the increased effective
concentration of template molecules allows for fewer thermal cycles. Additionally the high re-
actor density yields a quantification dynamic range of almost 105. Microfluidic digital PCR is a
powerful technique for quantitative measurement of genetic material. Some applications and
new approaches will be discussed further in the following sections.
The digital PCR chip is an example of semi-active confinement of femtoliter chambers as
a pneumatic press is used to isolate the microreactors. Femtoliter confinement with two-layer
valves however has recently been demonstrated by Araci and Quake.30 They achieved micro-
fluidic very large scale integration (mVLSI) by fabricating valves as small as 6� 6� 1.5 lm
(Figure 3(c)). Typical microfluidic large scale integration circuits achieve density of thousands
of valves per cm2. mVLSI beats this benchmark by two orders of magnitude approaching
one million valves per cm2. A peristaltic pump fabricated with these valves could achieve
chemical metering with a resolution close to a hundred femtoliters but this has not yet been
demonstrated.
FIG. 3. (a) A microfluidic mixing device for high throughput single molecule measurements (left). FRET labeled single
stranded DNA is mixed with its complimentary molecule or various salts to measure conformational response. A 3D con-
formation map is constructed through sequential titration of reagents and automated data collection (right). Reprinted with
permission from S. Kim, A. M. Streets, R. R. Lin, S. R. Quake, S. Weiss, and D. S. Majumdar, Nat. Methods 8(3), 242–245
(2011). (b) Ultra-high density digital PCR chip with 36-femtoliter microwells. The illustration depicts the experimental
setup for thermal cycling the device. Reprinted with permission from Y. Men, Y. Fu, Z. Chen, P. A. Sims, W. J. Greenleaf,
and Y. Huang, Anal. Chem. 84(10), 4262–4266 (2012). Copyright 2012 American Chemical Society. (c) Optical micro-
graph of microfluidic very large scale integration. These valve arrays are made of channels with cross section of 8 and
6 lm. Reprinted with permission from I. E. Araci and S. R. Quake, Lab Chip 12(16), 2803–2806 (2012). Copyright 2012
by the Royal Society of Chemistry.
011302-7 A. M. Streets and Y. Huang Biomicrofluidics 7, 011302 (2013)
This article is copyrighted as indicated in the abstract. Reuse of AIP content is subject to the terms at: http://scitation.aip.org/termsconditions. Downloaded to IP:
189.130.208.153 On: Wed, 16 Oct 2013 19:27:35

These are some first-order examples of how the small volume of microfluidic chambers
and channels has enabled researchers to develop new types of research tools. In the proceeding
sections, we examine how these elements are compounded, layered, and exploited with inte-
grated microfluidic approaches and used to solve compelling biological questions.
HIGH THROUGHPUT
A natural extension of the small volume advantage is high density. The dense and parallel
architecture of microfluidic circuits is the cornerstone of another marquee attribute of the tech-
nology; high throughput analysis. In some cases, a high throughput microfluidic solution proves
to be a practical advantage, saving a researcher time and resources by scaling up the number of
parallel reactions on chip or incorporating automated protocols. In other cases, the scale of an
experiment can be prohibitive in a bench top setting and a microfluidic solution fundamentally
enables the collection of previously unattainable data. Here, a few examples of the extremely
wide range of high throughput microfluidic technologies are presented in order to give a sense
for the diversity of approaches to high throughput data collection on chip.
Directed evolution is a powerful technique in which researchers harness the fitness optimi-
zation of natural evolution in order to generate potentially useful but unnatural proteins.31
Genetic mutation is artificially induced in cells expressing a protein of potential interest in order
to produce new variants. Then, a criterion is used to select cells which tend towards a desired
phenotype. Cyclic implementation of this strategy can generate new proteins with desired func-
tion. Because natural evolution is an extremely slow process, a necessary quality of directed
evolution experiments is the ability to screen variants in a high throughput fashion. Robotic
screening tools which use micoilter well array plates can perform assays in excess of 100 000
per day. Agresti et al. used a droplet-based microfluidic device to screen 108 assays in about
10 h, a 1000 fold increase over the robotic platforms32 (Figure 4(a)). The device is capable of
rapidly mixing yeast cells with a fluorogenic substrate into uniform, 6 picoliter droplets. The
droplets are packed and stored in a transfer line for incubation. Another device then receives
the droplets, refocuses them to a linear stream, and then sorts them using dielectrophoresis
based on fluorescence which indicates substrate binding.
In general, the high throughput capability of microfluidic platforms is useful for chemical
screening applications. Droplet microfluidics is well suited for ultra high throughput applica-
tions because density and scale limitations of device fabrication are avoided and instead the
“chambers” are produced on the fly. Additionally, there is a variety of robust droplet-based cir-
cuits for screening assays, including combinatorial mixing14 and serial dilution.33
Chemical screening on chip can also take advantage of automation. The rotary mixer10 is a
versatile tool for automated combinatorial mixing of reagents. In addition to the examples men-
tioned above,10,27 the microfluidic mixing circuits have been used in applications ranging from
automated chromatin immunoprecipitation based drug screening34 to in situ click chemistry
screening.35,36
In array based devices, high throughput is attained by minimizing the size of reaction cham-
bers and increasing density. Heyries et al. increased the throughput of valve-based digital PCR
by 100-fold by employing a novel partitioning method to replace the valve in order to achieve a
density of 440 000 reaction chambers per cm2 (Figure 4(b)).37 They performed digital PCR in
1 000 000 ten picoliter chambers to quantify DNA samples with a dynamic range of 107, and
single nucleotide variant detection sensitivity below one copy per 100 000 wild type molecules.
Discovery of monoclonal antibodies is a pursuit which has benefits in both biomedical
research and in medicine. This task involves screening, identifying, and recovering hybridoma
which are cell lines produced by fusing an antibody producing lymphocyte with a myeloma
cell to produce antigen-specific antibodies. Success in finding the desired antibody is propor-
tional to the number of screened hybridoma which must be isolated by rounds of serial dilution
in order to achieve monoclonality using conventional microwell plates. Love et al. developed
a high throughput solution to hybridoma screening and clonal expansion using a PDMS
micro-well array that was used to engrave a microarray of secreted antibodies.38,39 In their
011302-8 A. M. Streets and Y. Huang Biomicrofluidics 7, 011302 (2013)
This article is copyrighted as indicated in the abstract. Reuse of AIP content is subject to the terms at: http://scitation.aip.org/termsconditions. Downloaded to IP:
189.130.208.153 On: Wed, 16 Oct 2013 19:27:35

FIG. 4. (a) Picoliter emulsion generator, transfer line, and sorter. Reprinted with permission from J. J. Agresti, E. Antipov,
A. R. Abate, K. Ahn, A. C. Rowat, J. C. Baret, M. Marquez, A. M. Klibanov, A. D. Griffiths, and D. A. Weitz, Proc. Natl.
Acad. Sci. USA 107(9), 4004–4009 (2010). (b) Megapixel digital PCR array. After chambers are filled, they are isolated
by flowing an immiscible liquid down the connecting fluid lines preventing molecules from diffusing between chambers.
The micrograph shows the imaged array after amplification. Reprinted with permission from K. A. Heyries, C. Tropini,
M. Vaninsberghe, C. Doolin, O. I. Petriv, A. Singhal, K. Leung, C. B. Hughesman, and C. L. Hansen, Nat. Methods 8(8),
649–651 (2011). Copyright 2011 Macmillan Publishers Ltd. (c) Process for microengraving (left). A dilute cell suspen-
sion is dropped onto the microwell array for cell sequestering. This array is used to print secreted antibodies onto a pre-
coated slide. The scanned micrograph displays the resulting microengraved array with fluorescently detected spots (right).
Reprinted with permission from J. C. Love, J. L. Ronan, G. M. Grotenbreg, A. G. van der Veen, and H. L. Ploegh, Nat.
Biotechnol. 24(6), 703–707 (2006). Copyright 2006 Macmillan Publishers Ltd.
011302-9 A. M. Streets and Y. Huang Biomicrofluidics 7, 011302 (2013)
This article is copyrighted as indicated in the abstract. Reuse of AIP content is subject to the terms at: http://scitation.aip.org/termsconditions. Downloaded to IP:
189.130.208.153 On: Wed, 16 Oct 2013 19:27:35

technique, a dilute suspension of a polyclonal mixture of hybridomas was dispensed onto a
PDMS device containing 25 000 arrayed wells of 100-lm diameter. Single cells settled into the
wells, excess media was removed and the device was sealed with a glass slide pretreated with
secondary antibodies (Figure 4(c)). After incubation, secreted antibodies were “engraved” onto
the glass slide creating a microarray which was then stained with fluorescently labeled antigens
and screened for secreted antigen-specific antibody. The cells remained viable in the micro
wells for recovery and clonal expansion.
This technique, termed microengraving, is a powerful tool for characterization and recovery
of cells and has been used for investigation into T cell behavior. Varadarajan et al. used micro-
engraving to demonstrate efficient characterization of clinically obtained T cells requiring up to
1000 times fewer cells than traditional approaches.40 After antigen-specific CD8þ T cells were
identified they could be recovered for further in vitro characterization or to establish monoclo-
nal cell lines. Han et al. used sequential microengraving to measure temporal cytokine secretion
profiles in T cells.41 In a study of stem cells with surface receptors engineered for fluorescent
detection of signaling, microengraving was used to mediate cell-to-cell interactions, and assess
the spatial-temporal characteristics of the probe.42
Recent work from Shi et al. using a single-cell barcoding chip (SCBC)43 provides another
example of how single cell proteomics has and will likely continue to benefit from high
throughput microfluidic solutions. The technique takes advantage of two microfluidic devices.
The first utilized a concept similar to micro-engraving in which a single-layered passive flow
chip was used to pattern a DNA barcode array onto a glass slide.44 The second device, the
SCBC, was then aligned to the glass slide containing the DNA barcode array such that each of
the 120 cell chambers contained a DNA barcode (Figure 5(a)). DNA-antibody conjugates were
flowed through the chip converting the DNA microarray into a multiplexed antibody array.
Single or few cells were then flowed into these chambers, segregated by microfluidic valves,
and lysed via diffusive mixing of a lysis buffer. Quantitative single cell expression profiling
was achieved for nine cytoplasmic proteins via staining with biotinylated detection antibodies
and fluorescent labels43 (Figure 5(a)).
The two nanoliter single cell chambers effectively enhanced the local concentration of cel-
lular protein improving antibody capture efficiency and enabled low abundance expression
profiling. The SCBC chip was scaled up to include 1000 cell chambers and used to quantify
heterogeneity in cytokine secretion levels from clinical samples of cytotoxic T lymphocytes
from both healthy donors and melanoma patients.45
These examples of high throughput microfluidic analysis systems are based on the principle
of a well known and mature high throughput technique; DNA microarrays. Maerkl and Quake
took advantage of this pre-existing technology and coupled a parallel microfluidic circuit with
microarray printing in order to systematically measure transcription factor binding sites.46 The
technique, termed “mechanically induced trapping of molecular interactions” (MITOMI), used a
microfluidic valve like “button” to mechanically immobilize DNA motif-transcription factor
binding events, while unbound molecules were washed away allowing for low background mea-
surement of low affinity interactions (Figure 5(b)). The button unit cell was arrayed so that
2400 combinations of variants of the basic helix-loop-helix transcription factor family and per-
mutations of its typical DNA binding site could be assessed on a single chip. With 17 chips,
they measured 41 000 binding reactions with 464 target DNA sequences. Combining these
measurements with bioinformatic analysis of the yeast genome they predicted the biological
function of two yeast transcription factors.
MITOMI has proven to be a versatile technology. It has since been used to examine the ev-
olutionary plasticity of transcription factors47 and map protein-protein interaction networks.48–50
Einav et al. used MITOMI to discover a binding target for a hepatitis C virus transmembrane
protein.51 And recently Martin et al. demonstrated RNA-MITOMI,52 a systematic approach to
examine the sequence-structure-affinity relationship in RNA-protein interactions.
In an era where proteomics and genomics are handling more and more complex biological
networks, high throughput microfluidic platforms have demonstrated effective solutions to sys-
tems biology investigations. In addition to the increase in experimental efficiency, high
011302-10 A. M. Streets and Y. Huang Biomicrofluidics 7, 011302 (2013)
This article is copyrighted as indicated in the abstract. Reuse of AIP content is subject to the terms at: http://scitation.aip.org/termsconditions. Downloaded to IP:
189.130.208.153 On: Wed, 16 Oct 2013 19:27:35

throughput approaches significantly increase experimental precision. This is in part because
when making measurements of a single value that are subject to random error, the mean of the
measurements approach the actual value of interest as the number of measurements approaches
infinity according to the law of large numbers. However, the measurement precision gained
with the use of microfluidics does not come only from high throughput data collection. In
many instances, the precise liquid handling and technical capabilities of microfluidic circuits
FIG. 5. (a) Single cell barcoding chip (SCBC) (left). The chip is aligned with a pre-printed DNA bar code (not shown). Af-
ter conversion to antibody bar code and incubation with single cells the chip is removed and the bar code array is scanned
(right). Reprinted with permission from C. Ma, R. Fan, H. Ahmad, Q. Shi, B. Comin-Anduix, T. Chodon, R. C. Koya, C. C.
Liu, G. A. Kwong, C. G. Radu, A. Ribas, and J. R. Heath, Nat. Med. 17(6), 738–743 (2011). Copyright 2011 Macmillan
Publishers Ltd. (b) Mechanically induced trapping of molecular interactions (MITOMI) chip (top). Optical micrograph
inset shows the button and incubation chamber pair. The chip preparation pipeline and button action are illustrated below.
Reprinted with permission from S. J. Maerkl and S. R. Quake, Science 315(5809), 233–237 (2007). Copyright 2007
AAAS.
011302-11 A. M. Streets and Y. Huang Biomicrofluidics 7, 011302 (2013)
This article is copyrighted as indicated in the abstract. Reuse of AIP content is subject to the terms at: http://scitation.aip.org/termsconditions. Downloaded to IP:
189.130.208.153 On: Wed, 16 Oct 2013 19:27:35

enable single or few high quality measurements that qualitatively improve upon the type of
experiments that are possible off chip. As we continue, we explore experiments and measure-
ments that are uniquely made possible by microfluidic integration.
INTEGRATION
When conducting on-site measurements in the field, the ideal microfluidic device should be
packaged in as small and simple a platform as possible. Hand-held devices are by definition
self-sufficient with minimal or passive fluid driving mechanisms and integrated detection sys-
tems for easy readout either by eye or by smart phone camera.53 When conducting experiments
in the lab, researchers have access to a gambit of external control options and mature table-top
analysis techniques. The small size and planar format of microfluidic devices combined with
the optical transparency of PDMS makes the technology compatible with many methods of
optical detection including microscopic imaging and spectroscopy. In this sense, a microfluidic
device is not a research end in and of itself but instead should be considered a research tool,
like a pipette or a 96-well plate, to be used in concert with other laboratory technology. As
multi-layer soft lithography has become more routine and computer controlled valving more
accessible via open source web resources,54,55 it is now more common to find microfluidic plat-
forms integrated into sophisticated experimental setups for synchronized protocol execution and
data collection. It has arguably taken some time for this approach to transcend proof of princi-
ple demonstrations, but recently these efforts have begun to bear fruit of scientific significance.
X-ray crystallography is the primary tool for protein structure determination but growing
diffraction quality protein crystals is a challenging task. There have been enormous strides in
high throughput screening technology, x-ray science, and computational approaches to structure
reconstruction from diffraction data. However, the fundamental theory of macromolecule crystal
nucleation and growth is relatively incomplete compared to inorganic crystal growth, and exper-
imental observations are rarely predicted by classical theory. Thus building a complete theory
of protein crystal nucleation and phase behavior is of fundamental and practical interest.56 We
investigated crystal nucleation and growth with multimodal optical analysis of protein crystals
grown in a microfluidic environment. Combing dynamic light scattering and imaging with a
microfluidic free-interface diffusion device (Figure 6(a)) similar to the chip described earlier,11
crystal nucleation and growth were monitored in time, enabling crystal size determination with
a dynamic range of nanometers to hundreds of micrometers.57 This multimodal approach
allowed us to determine for the first time that pre-crystal protein clusters exhibit classical Ost-
wald ripening after the nucleation of a stable protein crystal. This provides one of many exam-
ples of how integration of quantitative analysis with small fluidic components provides an ideal
platform for making physical measurements of biological systems.
Burg et al. built a micro-resonator into a microfluidic chip to make high sensitivity meas-
urements of particle mass in an aqueous environment.58 By suspending an enclosed fluidic
microchannel in a vacuum, their device was able to measure the mass of particle suspensions
in the microchannel with sub-femtogram resolution. Grover et al. used this device, called the
suspended microchannel resonator, to make high throughput measurements of single live cell
density59 which showed significantly less variability than cell mass or volume. Son et al. com-
bined the suspended microchannel resonator with a fluorescent microscope in order to monitor
cell-cycle with an ubiquitination-based cell cycle indicator.60 They measured the mass of single
mammalian cells while monitoring cell cycle progression in order to characterize cell growth.
The microscope is arguably one of the most powerful and ubiquitous research tool in biol-
ogy and it is a fundamental companion of microfluidic devices in the laboratory setting, acting
as the premier chip-to-world mediator. Microfluidic platforms possess a handful of attributes
that enhance microscope capability as well. For one, microfluidic chips often have regular,
arrayed chambers which make automated image collection a very straight forward task. This is
particularly useful for multiplexed time lapsed cellular imaging. Additionally, because micro-
fluidic valves and pumps can be computer controlled, it is possible to incorporate machine
vision based feedback control loops for active fluidic manipulation.
011302-12 A. M. Streets and Y. Huang Biomicrofluidics 7, 011302 (2013)
This article is copyrighted as indicated in the abstract. Reuse of AIP content is subject to the terms at: http://scitation.aip.org/termsconditions. Downloaded to IP:
189.130.208.153 On: Wed, 16 Oct 2013 19:27:35

Two early microfluidic platforms paved the way for automated live cell imaging on a
microfluidic platform. Blagadde et al. constructed a microfluidic bioreactor called the microche-
mostat which could culture and observe bacterial populations for hundreds of hours.61 The de-
vice contained six independently controlled reactors (Figure 6(b)) and actively maintained con-
ditions for bacterial growth by replacing media and maintaining temperature, humidity and
nitrogen levels within the microscope housing. The six colonies were constantly monitored with
automated microscope stage translation and image acquisition, to create time-lapsed images
with single cell resolution. The platform was used to characterize oscillations in cell population
density engineered by a population control signaling circuit.
FIG. 6. (a) Schematic diagram of integrated dynamic light scattering and microscopy for microfluidic-based protein crystal
growth studies from Ref. 57. (b) Photograph of the microchemostat. Reprinted with permission from F. K. Balagadde, L.
You, C. L. Hansen, F. H. Arnold, and S. R. Quake, Science 309(5731), 137–140 (2005). Copyright 2005 AAAS. (c) Photo-
graph of the cell culture chip used in Ref. 62 courtesy of R. Gomez-Sjoberg. (d) Diagram of chip for C. elegan trapping,
imaging, and sorting used in Ref. 64. Reprinted with permission from C. B. Rohde, F. Zeng, R. Gonzalez-Rubio, M. Angel,
and M. F. Yanik, Proc. Natl. Acad. Sci. USA 104(35), 13891–13895 (2007). Copyright 2007 National Academy of Scien-
ces, USA. (e) Optical micrograph of C. elegan immobilization chamber in the device described in Refs. 67 and 68.
Reprinted with permission from K. Chung, M. M. Crane, and H. Lu, Nat. Methods 5(7), 637–643 (2008). Copyright 2008
Macmillan Publishers Ltd.
011302-13 A. M. Streets and Y. Huang Biomicrofluidics 7, 011302 (2013)
This article is copyrighted as indicated in the abstract. Reuse of AIP content is subject to the terms at: http://scitation.aip.org/termsconditions. Downloaded to IP:
189.130.208.153 On: Wed, 16 Oct 2013 19:27:35

Gomez-Sjoberg et al. developed a general platform for microfluidic cell culture.62 The sys-
tem contained 96 independently addressable cell culture chambers to which customized media
and reagents could be delivered at preset schedules (Figure 6(c)). Again time lapse imaging
was incorporated so that the individual chambers could be automatically maintained and moni-
tored for weeks. Tay et al. used this platform to monitor NF-jB signaling dynamics in single
cells responding to TNF-a.63 With active fluidic control, temporal TNF-a stimulation could be
delivered to cell chambers independently. They found that at low levels of TNF-a, single cells
demonstrated a digital response to the signaling molecule based on analogue processing of
parameters like dose intensity or timing.
Whole organism investigation is becoming a growing trend in microfluidic applications as
new strategies to manipulate and probe animals in micro channels are emerging. Rohde et al.developed a suite of devices for manipulating, sorting, and screening Caenorhabditi elegans.64
They first presented a strategy for trapping and then immobilizing single C. elegans using
microfluidic suction channels (Figure 6(d)). The worm was flattened against a suction array so
that they could be analyzed with bright field and fluoresce imaging. From there, the trapped
animal was delivered to an independently addressable incubation chamber where it was again
immobilized with suction for time-lapse imaging. A third device was designed to interface the
screening chip with reagents from a multi-well plate so that drug and RNAi screening could be
carried out in vitro.
There has since been a handful of applications of on-chip C. elegan studies including
long term, live organism monitoring for studies of neurotoxin induced response65 and passive
age-based sorting.66 Other groups have built upon microfluidic C. elegans screening by imple-
menting an automated active sorting scheme67,68 (Figure 6(e)). Crane et al. demonstrate auto-
mated screening of a C. elegan mutant library and identified phenotypes related to synapse
formation.68 In order to achieve completely autonomous screening and sorting they implemented
a machine vision based control loop which operated fluidic valves to introduce a worm into an
imaging chamber, capture a pseudo-three-dimensional image, process the image and classify the
worm as mutant or wild type, then deliver the worm to respective sorting chambers. They
screened worms at a rate of over 220 per hour, out performing manual screening by a factor of
ten. Additionally, they achieved ten-fold higher sensitivity to phenotypic variance by applying a
sophisticated multi-stage machine vision and learning algorithm that could assess an image using
over 30 qualifiers. The platform was robust and has been used to screen up to 40 000 animals
and identify novel phenotypic variants, previously undetected by manual classification.
Manipulation of single cells is the area in which microfluidic technology has arguably made
some of its most notable progress. This is especially true for application in single cell genomic
studies. Cells are particularly easy to handle in microfluidic environments compared to Petri
dishes and well plates because the scale of microfluidic components and their moving parts
approach the size of cells and because the low Reynolds number environment keeps suspended
particles like cells relatively stationary. Handling of cells becomes even more precise when opti-
cal manipulation is applied. Blainey et al. used a laser trap to separate single ammonia-oxidizing
archaea from a bulk sample and sort them into individual micro-chambers69 (Figure 7(a)). They
used a device similar to the one described earlier by Marcy and colleagues19 to lyse the isolated
single cells and amplify their genetic material using MDA (Figure 7(a)). The genetic material
from five single archaea was collected from the chip and sequenced independently. With single
cell genomic data and metagenomic data they assembled a draft genome of this low-salinity
ammonia-oxidizing archaea. The laser sorting single cell platform is critical for species which
cannot be easily cultured in the lab and has been used to assemble a majority of the genome of
Thiovulum sp, an un-cultivated genus of sulfur bacteria and the second fasted bacterium ever
observed.70 The same approach was used to partially assemble the genome of a member of an
un-cultured bacterial lineage labeled candidate division OP11 which are found ubiquitously in
nature but whose ecological interactions are largely unknown.71 This platform has also been
applied to the study of mammalian microbiome. Pamp et al. sequenced the genome of single
segmented filamentous bacterial cells, an intestinal symbiont found in mammals and revealed a
complex interdependent relationship of the microbe and its host.72
011302-14 A. M. Streets and Y. Huang Biomicrofluidics 7, 011302 (2013)
This article is copyrighted as indicated in the abstract. Reuse of AIP content is subject to the terms at: http://scitation.aip.org/termsconditions. Downloaded to IP:
189.130.208.153 On: Wed, 16 Oct 2013 19:27:35

The single cell laser trap-based sorting platform in fact conceptually combines two types of
microfluidic integration. On one hand, the device is integrated into a microscope platform com-
bining laser tweezing with a semi-automated stage for manipulation and imaging. Meanwhile,
these experiments provide an example of systems level integration of microfluidic technology
where the whole apparatus is used as a single tool and integrated into a larger experimental
pipeline. In this case, the microfluidic device is used simply to collect a sample, which is then
FIG. 7. (a) Diagram of laser trap sorting of single cells. This is a two layer “push-up” device and the laser trap drags the
cell past two open valves and then into the lysis chamber. (Below)An optical micrograph of the whole device which was
used in Refs. 69–72. Device was fabricated by the Stanford microfluidic foundry staff. Figure courtesy of P. Blainey. (b)
Device schematic for single chromosome sequencing. Red and blue lines represent the flow channels and green are the con-
trol. Single cells are trapped in the cross-junction, lysed in the following chamber and then chromosomes are separated into
the sequential channels. Optical micrographs (bottom) depict a single metaphase cell in the channel and its chromosomes
after lysis.73 Reprinted with permission from H. C. Fan, J. Wang, A. Potanina, and S. R. Quake, Nat. Biotechnol. 29(1),
51–57 (2011). Copyright 2011 Macmillan Publishers Ltd. (c) Device schematic for the single sperm sequencing chip used
in Ref. 74. Optical micrograph depicts a single sperm cell trapped a flow channel. Reprinted with permission from J. Wang,
H. C. Fan, B. Behr, and S. R. Quake, Cell 150(2), 402–412 (2012). Copyright 2012 Elsevier.
011302-15 A. M. Streets and Y. Huang Biomicrofluidics 7, 011302 (2013)
This article is copyrighted as indicated in the abstract. Reuse of AIP content is subject to the terms at: http://scitation.aip.org/termsconditions. Downloaded to IP:
189.130.208.153 On: Wed, 16 Oct 2013 19:27:35
prepared for high throughput sequencing that yields reads to be further processed by bioinfor-
matic computing resources.
Microfluidic systems level integration has been particularly effective for single cell genome
sequencing studies. Permutations of the single cell isolation and genomic amplification device
developed by Marcy et al. have been used in a variety of single human cell sequencing applica-
tions. Fan et al. sorted individual human metaphase cells and then further separated homolo-
gous copies of chromosomal molecules for amplification and sequencing in order to perform
whole genome personal haplotyping73 (Figure 7(b)). Wang et al. used a similar device to isolate
the genetic material from single human sperm cells for whole-genome sequencing in order to
measure genomic variation caused by recombination and de novo mutation during gametogeni-
sis74 (Figure 7(c)). These works provide a clear indication that microfluidic technology has
much to offer in the field of single cell genomic analysis.
HETEROGENEITY AND STOCHASTICITY
From both a genotypic and phenotypic standpoint, cellular systems display significant cell
to cell variability, even among the same type of cell. In fact, this heterogeneity may not only
be a characteristic of cellular networks but may also be critical to their function.75 In recent
years, microfluidic platforms have emerged as powerful tools for characterizing the nature and
origin of variation in cellular populations through single cell analysis.76–78 Here, we look at a
few such examples of an already large and growing field. For a more comprehensive survey,
see the recent reviews by Lecault et al.76 and Ryan et al.79
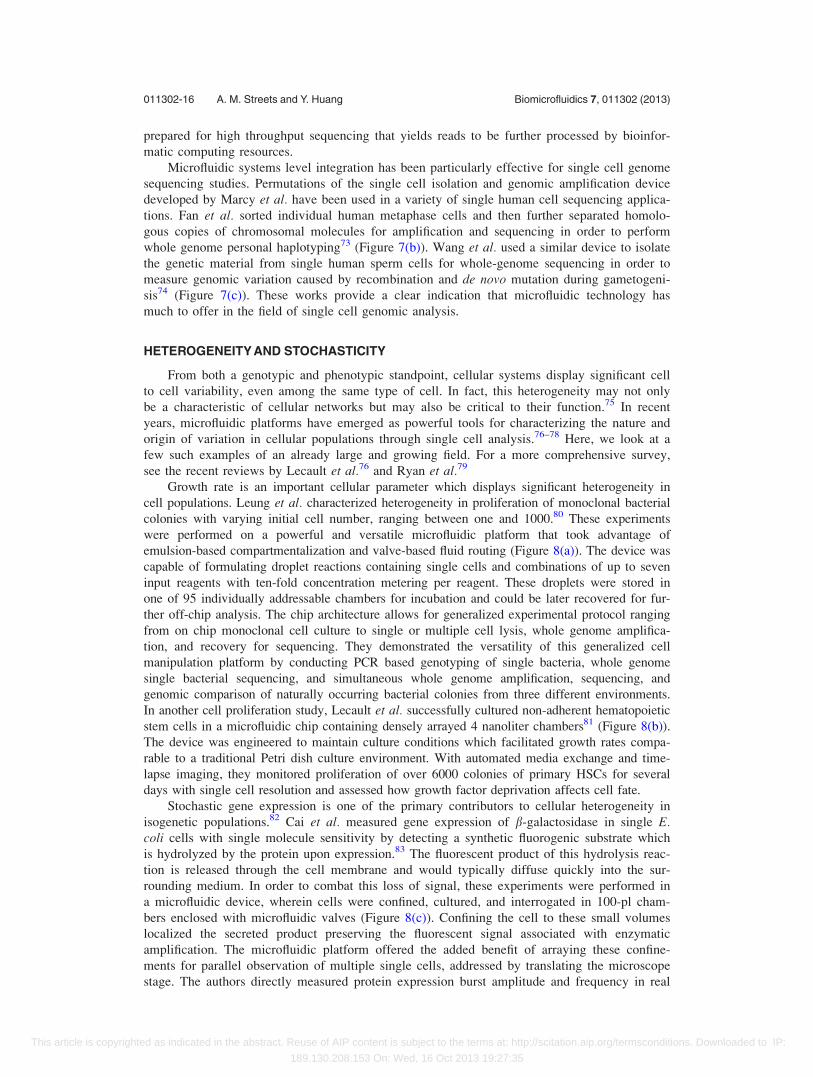
Growth rate is an important cellular parameter which displays significant heterogeneity in
cell populations. Leung et al. characterized heterogeneity in proliferation of monoclonal bacterial
colonies with varying initial cell number, ranging between one and 1000.80 These experiments
were performed on a powerful and versatile microfluidic platform that took advantage of
emulsion-based compartmentalization and valve-based fluid routing (Figure 8(a)). The device was
capable of formulating droplet reactions containing single cells and combinations of up to seven
input reagents with ten-fold concentration metering per reagent. These droplets were stored in
one of 95 individually addressable chambers for incubation and could be later recovered for fur-
ther off-chip analysis. The chip architecture allows for generalized experimental protocol ranging
from on chip monoclonal cell culture to single or multiple cell lysis, whole genome amplifica-
tion, and recovery for sequencing. They demonstrated the versatility of this generalized cell
manipulation platform by conducting PCR based genotyping of single bacteria, whole genome
single bacterial sequencing, and simultaneous whole genome amplification, sequencing, and
genomic comparison of naturally occurring bacterial colonies from three different environments.
In another cell proliferation study, Lecault et al. successfully cultured non-adherent hematopoietic
stem cells in a microfluidic chip containing densely arrayed 4 nanoliter chambers81 (Figure 8(b)).
The device was engineered to maintain culture conditions which facilitated growth rates compa-
rable to a traditional Petri dish culture environment. With automated media exchange and time-
lapse imaging, they monitored proliferation of over 6000 colonies of primary HSCs for several
days with single cell resolution and assessed how growth factor deprivation affects cell fate.
Stochastic gene expression is one of the primary contributors to cellular heterogeneity in
isogenetic populations.82 Cai et al. measured gene expression of b-galactosidase in single E.coli cells with single molecule sensitivity by detecting a synthetic fluorogenic substrate which
is hydrolyzed by the protein upon expression.83 The fluorescent product of this hydrolysis reac-
tion is released through the cell membrane and would typically diffuse quickly into the sur-
rounding medium. In order to combat this loss of signal, these experiments were performed in
a microfluidic device, wherein cells were confined, cultured, and interrogated in 100-pl cham-
bers enclosed with microfluidic valves (Figure 8(c)). Confining the cell to these small volumes
localized the secreted product preserving the fluorescent signal associated with enzymatic
amplification. The microfluidic platform offered the added benefit of arraying these confine-
ments for parallel observation of multiple single cells, addressed by translating the microscope
stage. The authors directly measured protein expression burst amplitude and frequency in real
011302-16 A. M. Streets and Y. Huang Biomicrofluidics 7, 011302 (2013)
This article is copyrighted as indicated in the abstract. Reuse of AIP content is subject to the terms at: http://scitation.aip.org/termsconditions. Downloaded to IP:
189.130.208.153 On: Wed, 16 Oct 2013 19:27:35
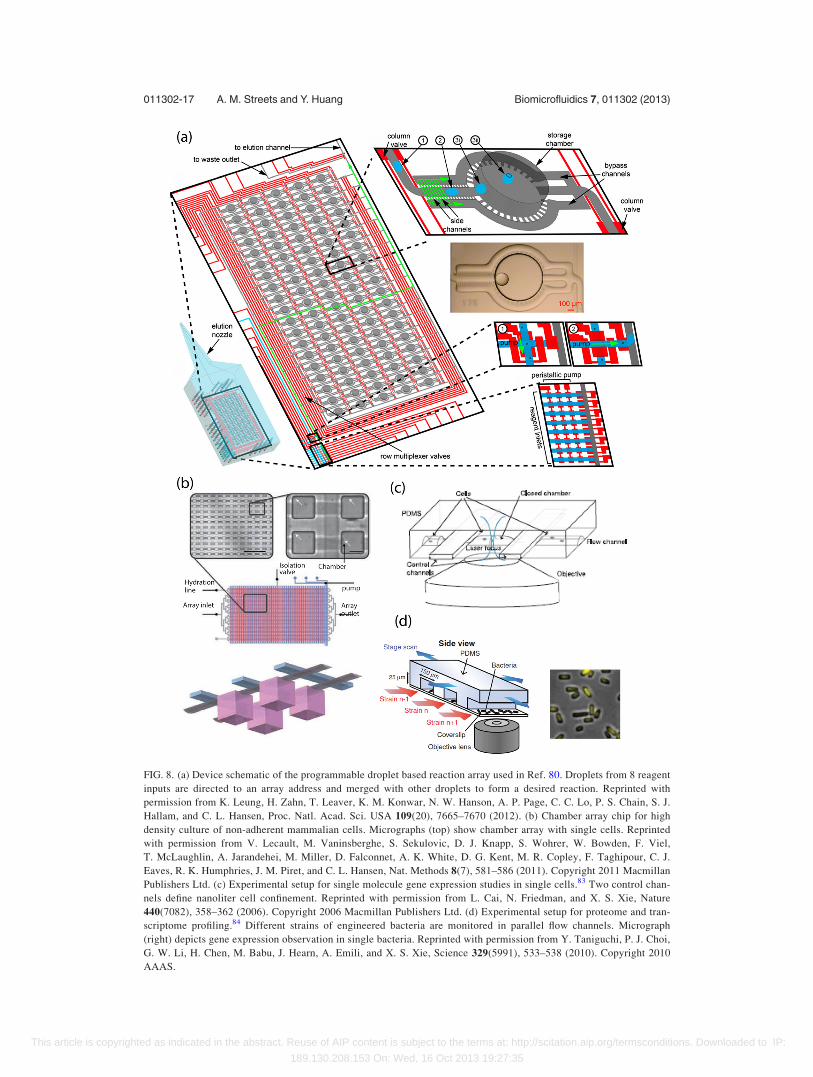
FIG. 8. (a) Device schematic of the programmable droplet based reaction array used in Ref. 80. Droplets from 8 reagent
inputs are directed to an array address and merged with other droplets to form a desired reaction. Reprinted with
permission from K. Leung, H. Zahn, T. Leaver, K. M. Konwar, N. W. Hanson, A. P. Page, C. C. Lo, P. S. Chain, S. J.
Hallam, and C. L. Hansen, Proc. Natl. Acad. Sci. USA 109(20), 7665–7670 (2012). (b) Chamber array chip for high
density culture of non-adherent mammalian cells. Micrographs (top) show chamber array with single cells. Reprinted
with permission from V. Lecault, M. Vaninsberghe, S. Sekulovic, D. J. Knapp, S. Wohrer, W. Bowden, F. Viel,
T. McLaughlin, A. Jarandehei, M. Miller, D. Falconnet, A. K. White, D. G. Kent, M. R. Copley, F. Taghipour, C. J.
Eaves, R. K. Humphries, J. M. Piret, and C. L. Hansen, Nat. Methods 8(7), 581–586 (2011). Copyright 2011 Macmillan
Publishers Ltd. (c) Experimental setup for single molecule gene expression studies in single cells.83 Two control chan-
nels define nanoliter cell confinement. Reprinted with permission from L. Cai, N. Friedman, and X. S. Xie, Nature
440(7082), 358–362 (2006). Copyright 2006 Macmillan Publishers Ltd. (d) Experimental setup for proteome and tran-
scriptome profiling.84 Different strains of engineered bacteria are monitored in parallel flow channels. Micrograph
(right) depicts gene expression observation in single bacteria. Reprinted with permission from Y. Taniguchi, P. J. Choi,
G. W. Li, H. Chen, M. Babu, J. Hearn, A. Emili, and X. S. Xie, Science 329(5991), 533–538 (2010). Copyright 2010
AAAS.
011302-17 A. M. Streets and Y. Huang Biomicrofluidics 7, 011302 (2013)
This article is copyrighted as indicated in the abstract. Reuse of AIP content is subject to the terms at: http://scitation.aip.org/termsconditions. Downloaded to IP:
189.130.208.153 On: Wed, 16 Oct 2013 19:27:35

time and showed that these parameters can also be calculated from steady-state copy number
distribution measurements. They went on to demonstrate the versatility of technique with meas-
urements of low-level expression in yeast and mammalian cells.
Taniguchi et al. measured stochastic variability in gene expression in single E. coli cells at
the transcriptome wide level.84 They used a yellow fluorescent protein fusion library and fluo-
rescence in situ hybridization to count protein and mRNA expression for 1000 genes with sin-
gle molecule sensitivity. A single layer high density microfluidic flow channel array was used
to spatially organize and separate bacterial strains in order to facilitate high throughput image
collection (Figure 8(d)). Coupling the flow cell array with an automated fluorescence excitation
and image acquisition system the authors screened 96 strains per device at a rate of 160 cells/
second per strain. By measuring steady-state population level copy number distributions of pro-
tein and mRNA molecules, they were able to characterize transcription rates and protein expres-
sion burst amplitudes, as demonstrated by Cai et al.,83 with single cell resolution.
Single cell gene expression analysis is especially useful for the study of heterogeneous cell
populations, which is often the case when investigating tissue or environmental samples where
populations do not necessarily contain a single cell type. In such a case population wide gene
expression analysis with single cell resolution is critical for defining subsets of cells or identify-
ing rare cells. In order to differentiate cell type amidst a noisy gene expression profile, many
genes and many cells must be examined and microfluidics offers significant practical advantage
for this task.85 Dalerba et al. used fluorescence activated cell sorting and microfluidic gene
expression arrays to identify distinct subpopulations of cells in colon cancer tissue.86 The micro-
fluidic device used here was a commercial chip sold by Fluidigm Corp. which enables quantita-
tive PCR of 96 target genes in 96 samples. With nanoliter reaction chambers, a low number of
mRNA copies can be quantified allowing for multiplexed expression analysis of material from
single cells. Normal and cancer tumor tissues were dispersed to single cell suspensions and sorted
by flow cytometry based on markers which identify cells of specific lineage, function or location
in the colon epithelial. Expression of up to 53 genes, selected for differential expression from a
pool of over 200 genes was then quantified in hundreds of single cells from these populations
using the microfluidic array. The authors used statistical clustering algorithms to characterize the
transcriptional identity of tumor subpopulations in order to explain the nature of heterogeneity in
cancer tissue.
Microfluidic quantitative PCR has proven to be a powerful tool for characterization of
cellular heterogeneity. Buganim et al. studied gene expression at various stages of cellular
reprogramming and by virtue of the single cell resolution of their approach, revealed two char-
acteristic stages distinguished by transcriptional profile.87 Using microfluidic qPCR, they quanti-
fied expression of 48 genes in 7000 cells and showed that transcription during early stages of
cell reprogramming is a stochastic process, however, in later stages gene activation mechanisms
that lead to pluripotency can follow hierarchical trajectory.
The ability of these platforms to perform experiments in a high throughput and parallel fash-
ion increases both the reproducibility and the quantity of each single measurement. This signifi-
cantly increases measurement precision allowing for more accurate estimation of the variation in
these stochastic systems. These last few examples demonstrated the potential for more regular
application of robust microfluidic platforms in life science laboratories. While it is clear that
microfluidic technology has great potential as a tool for single cell analysis, whether it becomes a
common and practical tool in the research lab depends on the extent to which experimental plat-
forms can develop into robust, user friendly technologies that can be exploited by the larger life
science community. There have been a handful of examples which point towards this paradigm.
In the next section, we look at microfluidic devices which have found their way into commercial
platforms.
CHIP IN A BOX
In the introduction, we discussed how point-of-care diagnostics was identified early on as a
primary commercial application of microfluidic technology. Another area in which microfluidics
011302-18 A. M. Streets and Y. Huang Biomicrofluidics 7, 011302 (2013)
This article is copyrighted as indicated in the abstract. Reuse of AIP content is subject to the terms at: http://scitation.aip.org/termsconditions. Downloaded to IP:
189.130.208.153 On: Wed, 16 Oct 2013 19:27:35

has begun to demonstrate commercial impact is in laboratory research equipment. Many
modern high throughput life science research tools now regularly take advantage of the “small
component” aspect of microfluidic circuits and sell microfluidic platforms powered by highly
engineered control infrastructure and analysis technology, packaged into a black box for the
research scientist end user.
Microfluidic based bench top machines provide a practical alternative to traditional wet lab
protocols. A virtue of many of these products is that they are simple to operate. The user only
has to load their sample and some reagents from a kit and press go while the control machinery
routes the samples through the chip, performs the assay, makes the measurement and then
prints the read out on a screen. In addition to the small component advantages which have been
reviewed, the microfluidic element of these commercial machines is often a disposable
cartridge, thus avoiding contamination between experiments.
Caliper Life Sciences88 offers a series of platforms called the LabChip Systems which per-
form capillary electrophoresis in a microfluidic chip. A robotic sample delivery mechanism
loads a single layer microfluidic device with sample and labeling reagents and then performs
electrophoretic separation in the microfluidic channel detecting bands of protein or nucleic acid
with inline fluorescent excitation and detection. The Agillent 2100 Bioanalyzer is another versa-
tile system for separation, sizing, and quantification of DNA, RNA, and protein. It is a one-box
system which also uses a disposable cartridge with a microfluidic circuit and a reagent kit
designed for electrophoretic quantification and whole cell flow cytometry. Commercial micro-
fluidic machines like these take a variety of traditional wet lab protocols like gel electrophoresis
and reduce them to a single easy-to-use platform and have been used in countless published
works.89,90
Other commercial platforms take advantage of microfluidic technology to present qualita-
tively new approaches to quantifying biological systems. Fluidigm offers a suite of microfluidic
platforms for genetic analysis from high throughput gene expression to sample quantitation and
sequencing preparation. Their BioMark system uses dense microfluidic chamber arrays to per-
form quantitative or digital PCR on small volumes of genetic material. In addition to allowing
densely packed arrays for high throughput analysis, the small volume reaction chambers yield
higher sensitivity enabling detection of single cell sample quantities. A few applications of the
BioMark to single cell gene expression were discussed in the previous section. Digital PCR is
also powerful tool for quantitation of genetic material. Because microfluidics has proved to be
an ideal way to implement the technique,29 the technology has found many uses as a research
tool. The single molecule sensitivity of digital PCR makes for extremely precise counting of
DNA and groups have used the platform for quantitation of viral load,91 viral detection in bac-
terial communities,92 detection of human aneuploidy,93 and as a novel platform for noninvasive
detection of organ transplant rejection,94 to cite a few examples.
Droplet microfluidics presents another elegant solution to digital PCR. Genetic material can
be diluted into droplets contained in an immiscible medium creating microreactors for PCR.
Droplets are created sequentially then sorted into a densely packed storage array where they
undergo thermal cycling. Afterwards, they can be recovered sequentially for sorting or detection
as Agresti et al. demonstrated.32 Two commercial platforms take advantage of this approach to
digital PCR; the QX100TM
Droplet DigitalTM
PCR system from BIO-RAD Laboratories Inc., and
the RainDropTM
Digital PCR system from RainDance technologies. With these platforms,
millions of PCR reactions can be created and analyzed providing a powerful platform for high
throughput DNA quantitation. For example, droplet based PCR has been used for copy number
variant counting in human evolution studies,95 genomic enrichment for targeted sequencing,96
and quantitative detection of rare mutated DNA molecules.97,98
The marketing departments of many of the companies mentioned embrace the microfluidic
components in their machines because incorporation of microfluidic plumbing highlights the
new capacity and capability of these platforms. Indeed, it is the small fluidic components which
make these products useful to researchers in the lab. However, there is a whole class of trans-
formative life science technology which regularly relies on microfluidic components but does
not necessarily need to advertise this aspect in order to sell units. Next generation sequencing
011302-19 A. M. Streets and Y. Huang Biomicrofluidics 7, 011302 (2013)
This article is copyrighted as indicated in the abstract. Reuse of AIP content is subject to the terms at: http://scitation.aip.org/termsconditions. Downloaded to IP:
189.130.208.153 On: Wed, 16 Oct 2013 19:27:35

has revolutionized life science research99 and with the plummeting time and cost required for
DNA sequencing more labs have gained access to this powerful technology. Just about every
next generation sequencing platform on the market incorporates microfluidic technology for rea-
gent handling. A passive microfluidic flow cell array or microwell array is used in most
machines to handle reactions and align the sample with detection optics. Many of the microflui-
dic advantages covered in the preceding sections are exploited in these machines, particularly
low sample consumption, high density compartmentalization, and increased effective concentra-
tion in small volumes. Additionally, there are a handful of commercial sequencing sample prep-
aration devices that also take advantage of microfluidic technology. Table I organizes some no-
table commercial products which incorporate microfluidic technology.
CONCLUSION
The advantages of small fluidic circuit components that have been covered here enable
quantitatively more and qualitatively new measurements of biological systems. For the last dec-
ade, however, the question has been whether microfluidic approaches will have major and last-
ing impact on life science. The integrated circuit analogy is popular in the microfluidic commu-
nity to illustrate the evolution of microfluidic applications. There are of course some aspects of
the respective technologies for which the analogy breaks down, for example, we may be
approaching the valve density limit for integrated microfluidic circuits.30 However, in lieu of
recent applications of the technology, many presented here, it is not clear that this limit will
have the same effect on microfluidic technology development as it is projected to have in
micro-electronics. The analogy between the microfluidic integrated circuit and the microelec-
tronic integrated circuit is still, however, quite insightful and is especially useful for contextual-
izing the potential of microfluidic technology. As electronic components have become smaller
and smaller, consumer electronics have become smaller, cheaper, and more useful. Twenty
years ago not every household had a personal computer but now it seems just about everyone
has a smart phone. Equally, as smaller and more efficient microfluidic elements are successfully
integrated into hand held devices, there is no doubt that we will see the impact all over the
world, from home medical diagnostics to point-of-care diagnostics in the developing world. At
the same time, as computer processors have steadily increased transistor density, large scale
TABLE I. A list of commercial laboratory machines that incorporate microfluidic technology.
Machine Company Application Microfluidic element
URL
Reference
LabChip Caliper/Perkin
Elmer
DNA, RNA, and Protein
quantification
Microchip electrophoresis 89
2100 Bioanalyzer Agilent DNA, RNA, and Protein
quantification
Microchip electrophoresis 90
MPCS Emerald
BioSystems
Protein crystal screening Emulsion generator 16
BioMark Fluidigm Gene expression analysis
Digital PCR
Integrated fluidic circuit 101
C1 Fluidigm Single cell processing Integrated fluidic circuit 101
QX100 ddPCR Bio-Rad Digital PCR Emulsion generator 102
RainDrop RainDance Digital PCR Emulsion generator 103
Mondrain SP Nugen Sequencing sample prep Digital microfluidics 104
One Touch Life technologies Sequencing sample prep Emulsion generator 105
Ion Torrent PGM/Proton Life technologies Next generation Sequencing Microfluidic flowcell/
microwell array
105
Genome Analyzer/HiSeq/
MiSeq
Illumina Next generation Sequencing Microfluidic flowcell 106
Heliscope Helicos Next generation Sequencing Microfluidic flowcell 107
011302-20 A. M. Streets and Y. Huang Biomicrofluidics 7, 011302 (2013)
This article is copyrighted as indicated in the abstract. Reuse of AIP content is subject to the terms at: http://scitation.aip.org/termsconditions. Downloaded to IP:
189.130.208.153 On: Wed, 16 Oct 2013 19:27:35

computational servers with immense computing power are now able to fit into a box the size of
a refrigerator or small room. We now have machines that can process data of a volume and
complexity that was hard to imagine even a decade ago and these machines are revolutionizing
how we manage information and in the case of bioinformatics, changing how we fundamentally
conduct life science research. The same might be said for microfluidic technology. As we have
reviewed here some microfluidic chips are being integrated into commercial and experimental
research tools that are fundamentally changing the way we do science. As the technology
matures these powerful research platforms are slowly being adopted by a wider scope of users.
If six years ago microfluidic technology was adolescent,100 then now it is coming of age in life
science research. The challenge now, as is always the case with growing up, will be how the
field handles new responsibility. For research applications, microfluidic technologies should not
be evaluated anymore on their extensive properties like size, throughput, complexity, etc.
Instead, the technology should be evaluated by its scientific contribution. There will always be
technology developers who can produce impressive machines, but their usefulness will now be
judged by the extent to which they yield new science. This means that developers need to either
become more equipped to assess the needs of life science research and apply their inventions to
real problems, or there should be more and closer collaborations between life science research
labs and technology development labs. Fortunately, this appears to be the trend.
ACKNOWLEDGMENTS
The authors would like to thank Chen Tao for illustrations and helpful discussions. They would
also like to thank Paul Blainey, Rafael Gomez-Sjoberg, Brian Yu, Stephen Quake and the Stanford
microfluidic foundry for images and figures of their microfluidic devices. A.M.S. was supported by
the Whitaker International Biomedical Engineering Fellowship and Y.H. by the Ministry of Science
and Technology of China (2011CB809106), the National Natural Science Foundation of China
(20890020, 91913011, 21222501), and the Fok Ying Tung Education Foundation.
1A. Manz, N. Graber, and H. M. Widmer, Sens. Actuators B 1(1–6), 244–248 (1990).2Y. Xia and G. M. Whitesides, Angew. Chem., Int. Ed. 37(5), 550–575 (1998).3T. Thorsen, S. J. Maerkl, and S. R. Quake, Science 298(5593), 580–584 (2002).4G. M. Whitesides, Lab Chip 13, 11–13 (2013).5X. Li, D. R. Ballerini, and W. Shen, Biomicrofluidics 6(1), 11301–1130113 (2012).6A. W. Martinez, S. T. Phillips, G. M. Whitesides, and E. Carrilho, Anal. Chem. 82(1), 3–10 (2010).7L. Lafleur, D. Stevens, K. McKenzie, S. Ramachandran, P. Spicar-Mihalic, M. Singhal, A. Arjyal, J. Osborn, P. Kauffman,P. Yager, and B. Lutz, Lab Chip 12(6), 1119–1127 (2012).
8L. Gervais, N. de Rooij, and E. Delamarche, Adv. Mater. 23(24), H151–176 (2011).9R. Pethig, Biomicrofluidics 4(2), 022811–022835 (2010).
10C. L. Hansen, M. O. A. Sommer, and S. R. Quake, Proc. Natl. Acad. Sci. USA 101(40), 14431–14436 (2004).11C. L. Hansen, E. Skordalakes, J. M. Berger, and S. R. Quake, Proc. Natl. Acad. Sci. USA 99(26), 16531–16536 (2002).12M. J. Anderson, C. L. Hansen, and S. R. Quake, Proc. Natl. Acad. Sci. USA 103(45), 16746–16751 (2006).13T. Thorsen, R. W. Roberts, F. H. Arnold, and S. R. Quake, Phys. Rev. Lett. 86(18), 4163–4166 (2001).14J. D. Tice, H. Song, A. D. Lyon, and R. F. Ismagilov, Langmuir 19(22), 9127–9133 (2003).15B. Zheng, L. S. Roach, and R. F. Ismagilov, J. Am. Chem. Soc. 125(37), 11170–11171 (2003).16See http://www.emeraldbiosystems.com/t-mpcsplugmaker.aspx for Emerald Biosystems’ Microcapillary Protein Crys-
tallization System.17J. Q. Boedicker, M. E. Vincent, and R. F. Ismagilov, Angew. Chem., Int. Ed. Engl. 48(32), 5908–5911 (2009).18M. C. Park, J. Y. Hur, K. W. Kwon, S.-H. Park, and K. Y. Suh, Lab Chip 6(8), 988–994 (2006).19Y. Marcy, C. Ouverney, E. M. Bik, T. Losekann, N. Ivanova, H. G. Martin, E. Szeto, D. Platt, P. Hugenholtz, D. A. Rel-
man, and S. R. Quake, Proc. Natl. Acad. Sci. USA 104(29), 11889–11894 (2007).20Y. Marcy, T. Ishoey, R. S. Lasken, T. B. Stockwell, B. P. Walenz, A. L. Halpern, K. Y. Beeson, S. M. Goldberg, and
S. R. Quake, PLoS Genet. 3(9), 1702–1708 (2007).21L. Y. Yeo and J. R. Friend, Biomicrofluidics 3(1), 012002–012023 (2009).22S. Girardo, M. Cecchini, F. Beltram, R. Cingolani, and D. Pisignano, Lab Chip 8(9), 1557–1563 (2008).23X. Ding, S.-C. S. Lin, M. I. Lapsley, S. Li, X. Guo, C. Y. Chan, I. K. Chiang, L. Wang, J. P. McCoy, and T. J. Huang,
Lab Chip 12(21), 4228–4231 (2012).24J. Nam, H. Lim, C. Kim, J. Y. Kang, and S. Shin, Biomicrofluidics 6(2), 024120-1–024120-10 (2012).25B. S. Cho, T. G. Schuster, X. Y. Zhu, D. Chang, G. D. Smith, and S. Takayama, Anal. Chem. 75(7), 1671–1675 (2003).26S. Wang, K. Liu, J. Liu, Z. T. F. Yu, X. Xu, L. Zhao, T. Lee, E. K. Lee, J. Reiss, Y.-K. Lee, L. W. K. Chung, J. Huang,
M. Rettig, D. Seligson, K. N. Duraiswamy, C. K. F. Shen, and H.-R. Tseng, Angew. Chem., Int. Ed. 50(13), 3084–3088(2011).
27S. Kim, A. M. Streets, R. R. Lin, S. R. Quake, S. Weiss, and D. S. Majumdar, Nat. Methods 8(3), 242–U283 (2011).28Y. Men, Y. Fu, Z. Chen, P. A. Sims, W. J. Greenleaf, and Y. Huang, Anal. Chem. 84(10), 4262–4266 (2012).
011302-21 A. M. Streets and Y. Huang Biomicrofluidics 7, 011302 (2013)
This article is copyrighted as indicated in the abstract. Reuse of AIP content is subject to the terms at: http://scitation.aip.org/termsconditions. Downloaded to IP:
189.130.208.153 On: Wed, 16 Oct 2013 19:27:35

29E. A. Ottesen, J. W. Hong, S. R. Quake, and J. R. Leadbetter, Science 314(5804), 1464–1467 (2006).30I. E. Araci and S. R. Quake, Lab Chip 12(16), 2803–2806 (2012).31C. J€ackel, P. Kast, and D. Hilvert, Annu. Rev. Biophys. 37(1), 153–173 (2008).32J. J. Agresti, E. Antipov, A. R. Abate, K. Ahn, A. C. Rowat, J. C. Baret, M. Marquez, A. M. Klibanov, A. D. Griffiths,
and D. A. Weitz, Proc. Natl. Acad. Sci. USA 107(9), 4004–4009 (2010).33X. Z. Niu, F. Gielen, J. B. Edel, and A. J. deMello, Nat. Chem. 3(6), 437–442 (2011).34A. R. Wu, T. L. A. Kawahara, N. A. Rapicavoli, J. van Riggelen, E. H. Shroff, L. W. Xu, D. W. Felsher, H. Y. Chang,
and S. R. Quake, Lab Chip 12(12), 2190–2198 (2012).35J. Wang, G. Sui, V. P. Mocharla, R. J. Lin, M. E. Phelps, H. C. Kolb, and H.-R. Tseng, Angew. Chem., Int. Ed. 45(32),
5276–5281 (2006).36Y. Wang, W. Y. Lin, K. Liu, R. J. Lin, M. Selke, H. C. Kolb, N. Zhang, X. Z. Zhao, M. E. Phelps, C. K. Shen, K. F.
Faull, and H. R. Tseng, Lab Chip 9(16), 2281–2285 (2009).37K. A. Heyries, C. Tropini, M. Vaninsberghe, C. Doolin, O. I. Petriv, A. Singhal, K. Leung, C. B. Hughesman, and C. L.
Hansen, Nat. Methods 8(8), 649–651 (2011).38J. C. Love, J. L. Ronan, G. M. Grotenbreg, A. G. van der Veen, and H. L. Ploegh, Nat. Biotechnol. 24(6), 703–707
(2006).39A. O. Ogunniyi, C. M. Story, E. Papa, E. Guillen, and J. C. Love, Nat. Protoc. 4(5), 767–782 (2009).40N. Varadarajan, D. S. Kwon, K. M. Law, A. O. Ogunniyi, M. N. Anahtar, J. M. Richter, B. D. Walker, and J. C. Love,
Proc. Natl. Acad. Sci. USA 109(10), 3885–3890 (2012).41Q. Han, N. Bagheri, E. M. Bradshaw, D. A. Hafler, D. A. Lauffenburger, and J. C. Love, Proc. Natl. Acad. Sci. USA
109(5), 1607–1612 (2012).42W. Zhao, S. Schafer, J. Choi, Y. J. Yamanaka, M. L. Lombardi, S. Bose, A. L. Carlson, J. A. Phillips, W. Teo, I. A.
Droujinine, C. H. Cui, R. K. Jain, J. Lammerding, J. C. Love, C. P. Lin, D. Sarkar, R. Karnik, and J. M. Karp, Nat.Nanotechnol. 6(8), 524–531 (2011).
43Q. Shi, L. Qin, W. Wei, F. Geng, R. Fan, Y. S. Shin, D. Guo, L. Hood, P. S. Mischel, and J. R. Heath, Proc. Natl. Acad.Sci. USA 109(2), 419–424 (2012).
44Y. S. Shin, H. Ahmad, Q. Shi, H. Kim, T. A. Pascal, R. Fan, W. A. Goddard III, and J. R. Heath, ChemPhysChem11(14), 3063–3069 (2010).
45C. Ma, R. Fan, H. Ahmad, Q. Shi, B. Comin-Anduix, T. Chodon, R. C. Koya, C. C. Liu, G. A. Kwong, C. G. Radu,A. Ribas, and J. R. Heath, Nat. Med. 17(6), 738–743 (2011).
46S. J. Maerkl and S. R. Quake, Science 315(5809), 233–237 (2007).47S. J. Maerkl and S. R. Quake, Proc. Natl. Acad. Sci. USA 106(44), 18650–18655 (2009).48D. Gerber, S. J. Maerkl, and S. R. Quake, Nat. Methods 6(1), 71–74 (2009).49M. Meier, R. Sit, W. Pan, and S. R. Quake, Anal. Chem. 84(21), 9572–9578 (2012).50M. Meier, R. V. Sit, and S. R. Quake, Proc. Natl. Acad. Sci. USA 110(2), 477–482 (2013).51S. Einav, D. Gerber, P. D. Bryson, E. H. Sklan, M. Elazar, S. J. Maerkl, J. S. Glenn, and S. R. Quake, Nat. Biotechnol.
26(9), 1019–1027 (2008).52L. Martin, M. Meier, S. M. Lyons, R. V. Sit, W. F. Marzluff, S. R. Quake, and H. Y. Chang, Nat. Methods 9, 1192–1194
(2012).53A. W. Martinez, S. T. Phillips, E. Carrilho, S. W. Thomas III, H. Sindi, and G. M. Whitesides, Anal. Chem. 80(10),
3699–3707 (2008).54See http://www.stanford.edu/group/foundry/ for Stanford Microfluidic Foundry website.55See http://microfluidics.lbl.gov/ for Lawrence Berkeley National Lab Microfluidics Lab website (R. G�omez-Sj€oberg).56P. G. Vekilov and A. A. Chernov, in Solid State Physics, edited by E. Henry and S. Frans (Academic, 2003), Vol. 57,
pp. 1–147.57A. M. Streets and S. R. Quake, Phys. Rev. Lett. 104(17), 178102 (2010).58T. P. Burg, M. Godin, S. M. Knudsen, W. Shen, G. Carlson, J. S. Foster, K. Babcock, and S. R. Manalis, Nature
446(7139), 1066–1069 (2007).59W. H. Grover, A. K. Bryan, M. Diez-Silva, S. Suresh, J. M. Higgins, and S. R. Manalis, Proc. Natl. Acad. Sci. USA
108(27), 10992–10996 (2011).60S. Son, A. Tzur, Y. Weng, P. Jorgensen, J. Kim, M. W. Kirschner, and S. R. Manalis, Nat. Methods 9(9), 910–912
(2012).61F. K. Balagadde, L. You, C. L. Hansen, F. H. Arnold, and S. R. Quake, Science 309(5731), 137–140 (2005).62R. Gomez-Sjoberg, A. A. Leyrat, D. M. Pirone, C. S. Chen, and S. R. Quake, Anal. Chem. 79(22), 8557–8563 (2007).63S. Tay, J. J. Hughey, T. K. Lee, T. Lipniacki, S. R. Quake, and M. W. Covert, Nature 466(7303), 267–271 (2010).64C. B. Rohde, F. Zeng, R. Gonzalez-Rubio, M. Angel, and M. F. Yanik, Proc. Natl. Acad. Sci. USA 104(35),
13891–13895 (2007).65H. Ma, L. Jiang, W. Shi, J. Qin, and B. Lin, Biomicrofluidics 3(4), 044114–044118 (2009).66X. C. i Solvas, F. M. Geier, A. M. Leroi, J. G. Bundy, J. B. Edel, and A. J. deMello, Chem. Commun. 47(35),
9801–9803 (2011).67K. Chung, M. M. Crane, and H. Lu, Nat. Methods 5(7), 637–643 (2008).68M. M. Crane, J. N. Stirman, C. Y. Ou, P. T. Kurshan, J. M. Rehg, K. Shen, and H. Lu, Nat. Methods 9(10), 977–980
(2012).69P. C. Blainey, A. C. Mosier, A. Potanina, C. A. Francis, and S. R. Quake, PLoS ONE 6(2), e16626 (2011).70I. P. Marshall, P. C. Blainey, A. M. Spormann, and S. R. Quake, Appl. Environ. Microbiol. 78(24), 8555–8563 (2012).71N. H. Youssef, P. C. Blainey, S. R. Quake, and M. S. Elshahed, Applied Appl. Environ. Microbiol. 77(21), 7804–7814
(2011).72S. J. Pamp, E. D. Harrington, S. R. Quake, D. A. Relman, and P. C. Blainey, Genome Res. 22(6), 1107–1119 (2012).73H. C. Fan, J. Wang, A. Potanina, and S. R. Quake, Nat. Biotechnol. 29(1), 51–57 (2011).74J. Wang, H. C. Fan, B. Behr, and S. R. Quake, Cell 150(2), 402–412 (2012).75R. S. Lasken, Nat. Rev. Microbiol. 10(9), 631–640 (2012).
011302-22 A. M. Streets and Y. Huang Biomicrofluidics 7, 011302 (2013)
This article is copyrighted as indicated in the abstract. Reuse of AIP content is subject to the terms at: http://scitation.aip.org/termsconditions. Downloaded to IP:
189.130.208.153 On: Wed, 16 Oct 2013 19:27:35

76V. Lecault, A. K. White, A. Singhal, and C. L. Hansen, Curr. Opin. Chem. Biol. 16(3–4), 381–390 (2012).77H. Yin and D. Marshall, Curr. Opin Biotechnol. 23(1), 110–119 (2012).78R. N. Zare and S. Kim, Annu. Rev. Biomed. Eng. 12, 187–201 (2010).79D. Ryan, K. Ren, and H. Wu, Biomicrofluidics 5(2), 021501–021509 (2011).80K. Leung, H. Zahn, T. Leaver, K. M. Konwar, N. W. Hanson, A. P. Page, C. C. Lo, P. S. Chain, S. J. Hallam, and C. L.
Hansen, Proc. Natl. Acad. Sci. USA 109(20), 7665–7670 (2012).81V. Lecault, M. Vaninsberghe, S. Sekulovic, D. J. Knapp, S. Wohrer, W. Bowden, F. Viel, T. McLaughlin, A. Jarandehei,
M. Miller, D. Falconnet, A. K. White, D. G. Kent, M. R. Copley, F. Taghipour, C. J. Eaves, R. K. Humphries, J. M. Piret,and C. L. Hansen, Nat. Methods 8(7), 581–586 (2011).
82G. W. Li and X. S. Xie, Nature 475(7356), 308–315 (2011).83L. Cai, N. Friedman, and X. S. Xie, Nature 440(7082), 358–362 (2006).84Y. Taniguchi, P. J. Choi, G. W. Li, H. Chen, M. Babu, J. Hearn, A. Emili, and X. S. Xie, Science 329(5991), 533–538
(2010).85T. Kalisky and S. R. Quake, Nat. Methods 8(4), 311–314 (2011).86P. Dalerba, T. Kalisky, D. Sahoo, P. S. Rajendran, M. E. Rothenberg, A. A. Leyrat, S. Sim, J. Okamoto, D. M. Johnston,
D. Qian, M. Zabala, J. Bueno, N. F. Neff, J. Wang, A. A. Shelton, B. Visser, S. Hisamori, Y. Shimono, M. van de Weter-ing, H. Clevers, M. F. Clarke, and S. R. Quake, Nat. Biotechnol. 29(12), 1120–1127 (2011).
87Y. Buganim, D. A. Faddah, A. W. Cheng, E. Itskovich, S. Markoulaki, K. Ganz, S. L. Klemm, A. van Oudenaarden, andR. Jaenisch, Cell 150(6), 1209–1222 (2012).
88Recently acquired by PerkinElmer.89See http://www.perkinelmer.com/catalog/category/id/labchip%20systems for PerkinElmer LabChip.90See http://www.genomics.agilent.com for Agilent.91R. A. White III, S. R. Quake, and K. Curr, J. Virol. Methods 179(1), 45–50 (2012).92A. D. Tadmor, E. A. Ottesen, J. R. Leadbetter, and R. Phillips, Science 333(6038), 58–62 (2011).93H. C. Fan and S. R. Quake, Anal. Chem. 79(19), 7576–7579 (2007).94T. M. Snyder, K. K. Khush, H. A. Valantine, and S. R. Quake, Proc. Natl. Acad. Sci. USA 108(15), 6229–6234 (2011).95L. M. Boettger, R. E. Handsaker, M. C. Zody, and S. A. McCarroll, Nat. Genet. 44(8), 881–885 (2012).96R. Tewhey, J. B. Warner, M. Nakano, B. Libby, M. Medkova, P. H. David, S. K. Kotsopoulos, M. L. Samuels, J. B.
Hutchison, J. W. Larson, E. J. Topol, M. P. Weiner, O. Harismendy, J. Olson, D. R. Link, and K. A. Frazer, Nat. Bio-technol. 27(11), 1025–1031 (2009).
97B. J. Hindson, K. D. Ness, D. A. Masquelier, P. Belgrader, N. J. Heredia, A. J. Makarewicz, I. J. Bright, M. Y. Lucero,A. L. Hiddessen, T. C. Legler, T. K. Kitano, M. R. Hodel, J. F. Petersen, P. W. Wyatt, E. R. Steenblock, P. H. Shah,L. J. Bousse, C. B. Troup, J. C. Mellen, D. K. Wittmann, N. G. Erndt, T. H. Cauley, R. T. Koehler, A. P. So, S. Dube,K. A. Rose, L. Montesclaros, S. Wang, D. P. Stumbo, S. P. Hodges, S. Romine, F. P. Milanovich, H. E. White, J. F.Regan, G. A. Karlin–Neumann, C. M. Hindson, S. Saxonov, and B. W. Colston, Anal. Chem. 83(22), 8604–8610(2011).
98D. Pekin, Y. Skhiri, J. C. Baret, D. Le Corre, L. Mazutis, C. B. Salem, F. Millot, A. El Harrak, J. B. Hutchison, J. W.Larson, D. R. Link, P. Laurent-Puig, A. D. Griffiths, and V. Taly, Lab Chip 11(13), 2156–2166 (2011).
99T. P. Niedringhaus, D. Milanova, M. B. Kerby, M. P. Snyder, and A. E. Barron, Anal. Chem. 83(12), 4327–4341 (2011).100G. M. Whitesides, Nature 442(7101), 368–373 (2006).101See http://www.fluidigm.com/ for information about Fluidigm Corporation.102See http://www.bio-rad.com/prd/en/US/LSR/PDP/M9HE3XE8Z/QX100-Droplet-Digital-PCR-System for Bio-Rad QX
100 Droplet Digital PCR system.103See http://raindancetech.com/ for RainDance Technologies website.104See http://www.nugeninc.com/nugen/index.cfm/products/msp/ for Nugen.105See http://www.iontorrent.com/ for Life Technologies iontorrent system.106See http://www.illumina.com/ for Illumina Incorporated website.107See http://www.helicosbio.com/ for Helicos Biosciences corporation website.
011302-23 A. M. Streets and Y. Huang Biomicrofluidics 7, 011302 (2013)
This article is copyrighted as indicated in the abstract. Reuse of AIP content is subject to the terms at: http://scitation.aip.org/termsconditions. Downloaded to IP:
189.130.208.153 On: Wed, 16 Oct 2013 19:27:35