micro and macro scale design and performance of dry covers...
TRANSCRIPT
Micro and Macro Scale Design and Performance of Dry Covers - Waihi, New Zealand
P.J.B. Fransen, J Ruddock, T. Matuschka, S.D. Miller, W.J. Russell
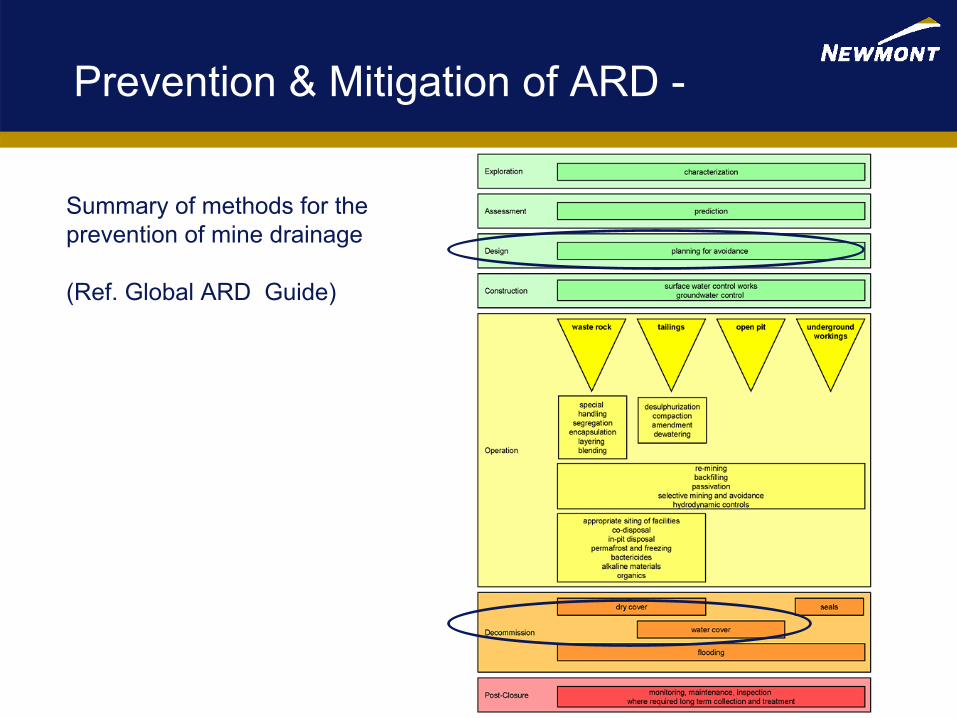
Prevention & Mitigation of ARD -
Summary of methods for the prevention of mine drainage
(Ref. Global ARD Guide)

00/00/00 Place title of presentation here 3
Waihi Climate
Air temperature -5° to 28° CRainfall: 2100 mm a-1
ET: 700 mm a-1
0
50
100
150
200
250
JANUARY
FEBRUARYMARCH
APRIL
MAY
JUNE
JULY
AUGUSTSEPTEMBER
OCTOBERNOVEMBERDECEMBER
mm
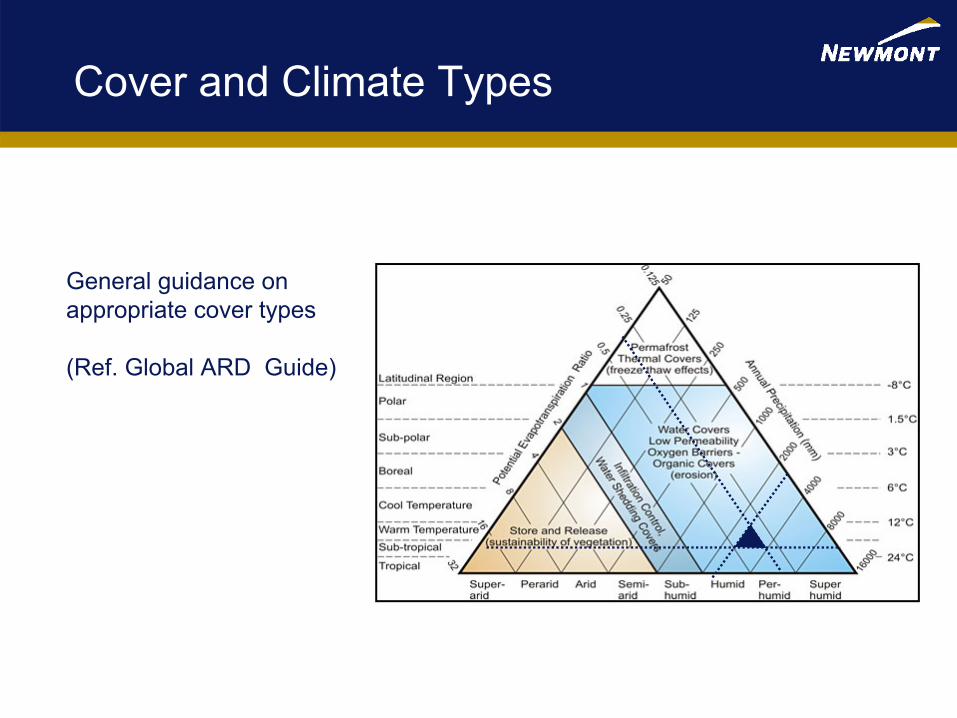
Cover and Climate Types
General guidance on appropriate cover types
(Ref. Global ARD Guide)
00/00/00 Place title of presentation here 5
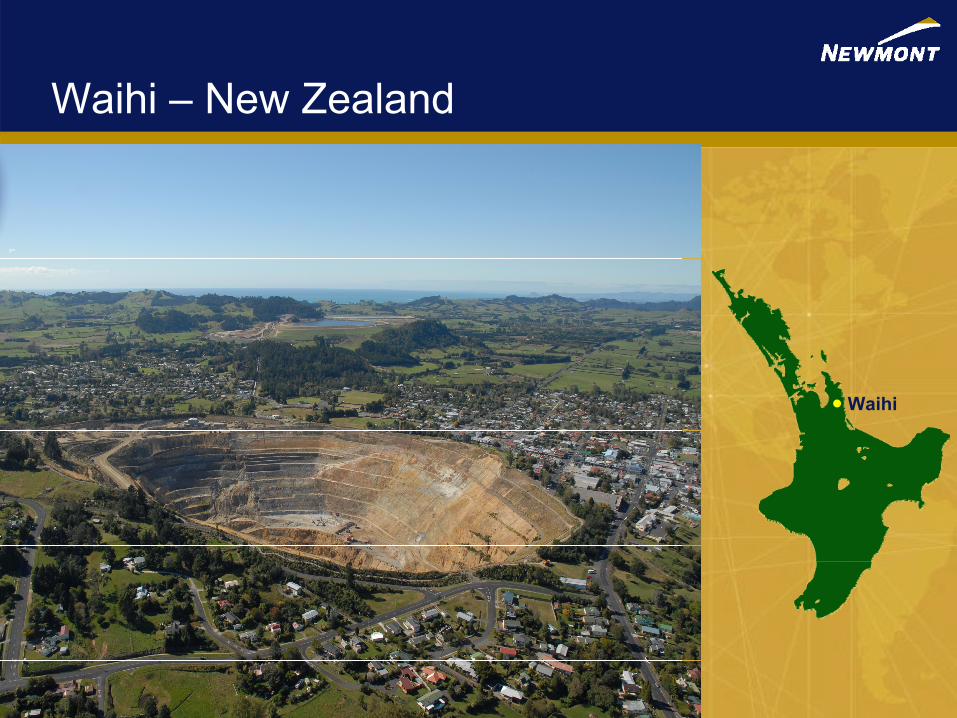
Waihi
Waihi – New Zealand

00/00/00 Place title of presentation here 6
Waihi Tailing Storage Facility
00/00/00 Place title of presentation here 7
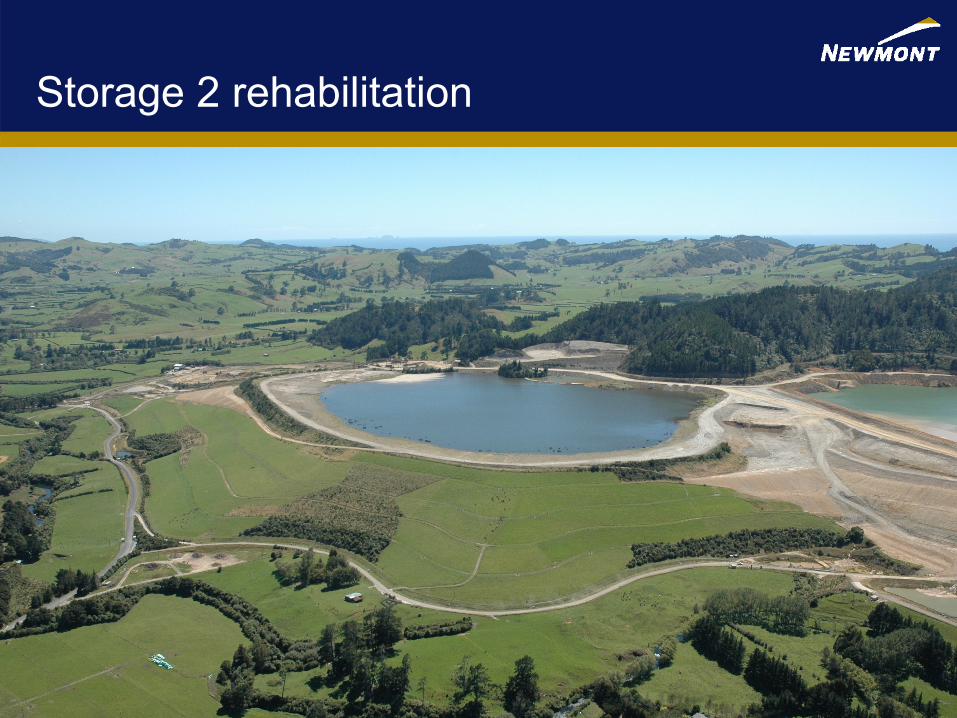
Storage 2 rehabilitation
00/00/00 Place title of presentation here 8
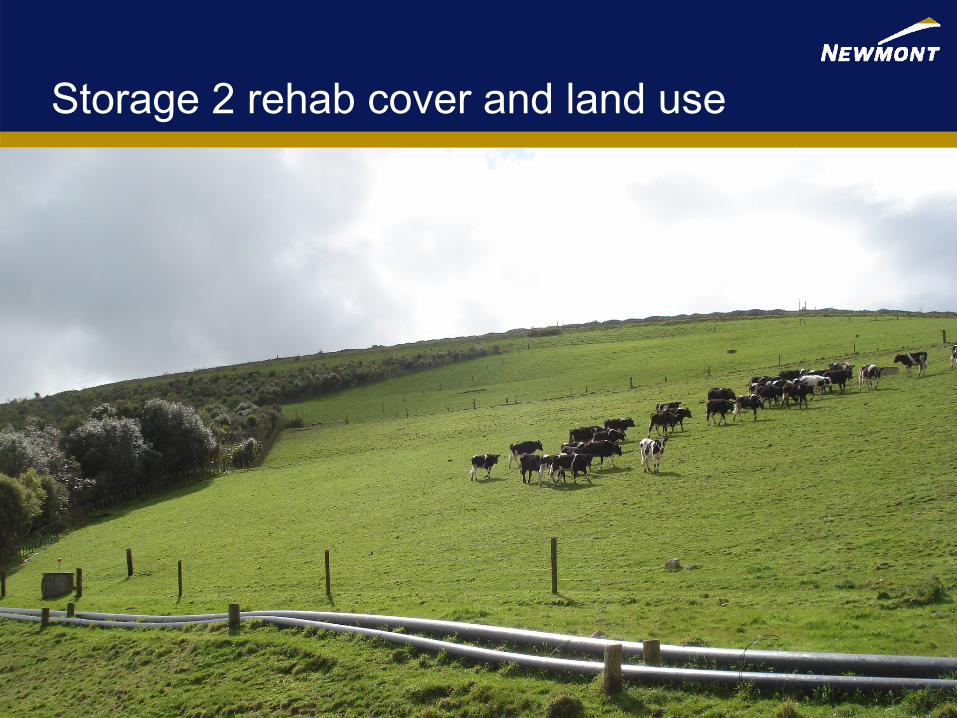
Storage 2 rehab cover and land use
00/00/00 Place title of presentation here 9
Objectives:
1. Restriction on generation of acid drainage in the short and long term
2. Rehabilitation of the downstream shoulder to pasture and native plantings
3. Surface water control to prevent ponding, infiltration and erosion
Achieved by:Multi-layered cover system
1. Sealing layer - oxidation control and geochemical security
2. Soil layer – insulation & vegetation growth medium
Slope geometry – surface runoff and erosion control
Embankment cover design

00/00/00 Place title of presentation here 10
Geochemical objectives & targets
Primary method to achieve these targets is limestone addition to the waste rock
Sealing layer will reduce leachate flow rates
Objectives - minimise risk of adverse water quality effects- minimum after-care and long term geochemical security
TargetsMn – receiving water quality standard in consents is 2 g/m3
Reduction in underdrainage flows rates < 1 L/s
pH = 6 for minimising Mn release and control of Al and Cu
SO4 – 250 g/m3 recommended at closure (c. 10 kg/ha/d = double worst case estimate)
00/00/00 Place title of presentation here 11
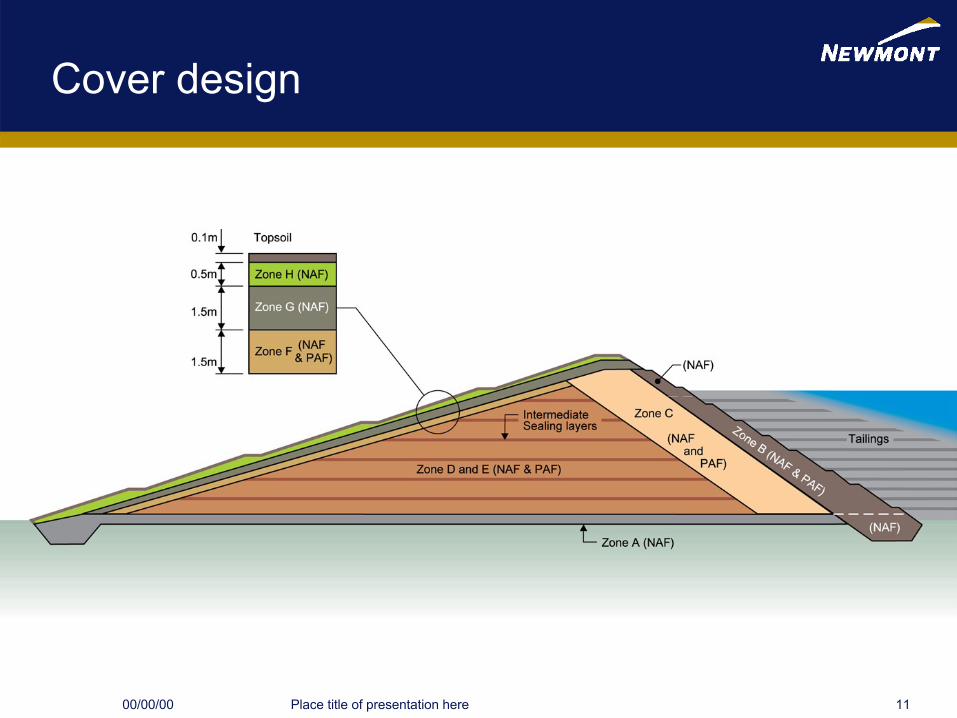
Cover design

Dec 2009 Waihi Dry Covers 12
Storage 2 cover assessment
Diffusion is the dominant O2 transport mechanism in WRDNo advection or convection
Oxygen concentration < 1% at 2m depth from surfaceNo O2 below 5m depth even in areas not covered
No oxidation at depth
Pyrite oxidation is not significant below 1-2m depth in uncovered areas
Some heating during construction of PAF waste areas
Sealing layer diffusion coefficients < 2.1 x 10⁻⁸ m2/s2-orders of magnitude lower than bulk waste rock
Important oxygen barrier
Sulphate generation rate - 93-99.5% reduction (to 5.5 kg/ha/d) with use of cover
ANSTO study in 1994 – oxygen, temperature, and diffusion on waste rock and covers
ANSTO = Australian Nuclear Science & Technology Organisation
00/00/00 Place title of presentation here 13
Zone G – sealing cover specifications
Diffusion coefficient is the critical factor determining the performance of zone G
De - function of moisture content or degree of saturation
90% degree of saturation (81-100% range) @ De = 2.1 x 10⁻⁸ m2/s
zone G permeability < 1 x 10⁻⁸ m/s
Embankment design and material specifications
Construction control - compact waste rock in 250mm thick layers – zone G
Field saturation levels – 85% minimum, 90% median
00/00/00 Place title of presentation here 14
Construction Monitoring
Geotechnical testing of foundations and placed embankment fill
Dry Density
Air Voids
Degree of saturation
Scala Penetrometer
Shear vane
Particle Size Distribution
Permeability – Triaxial Cell – zone G sealing layer
Solid Density of Soil Particles
Failed tests result in re-compaction of finished areas and retesting

00/00/00 Place title of presentation here 15
Sealing layer reduces leachate flows
Prevention of water ingress
Zone B – tails upstream barrier
Zone G – embankment cover
Graph shows performance for Storage 2 – L9 had the highest flows 0.00
0.10
0.20
0.30
0.40
0.50
0.60
0.70
0.80
11-M
ar-97
24-Ju
l-98
6-Dec
-9919
-Apr-
011-S
ep-02
14-Ja
n-04
28-M
ay-05
10-O
ct-06
22-F
eb-08
6-Jul-
0918
-Nov
-10
l/s L1
L5
L9
Expected flows less than 0.25 L/s
Storage 2 zone G – performance

00/00/00 Place title of presentation here 16
Sulphate trends
250 g/m3
recommended at closure
Equiv. 10 kg/ha/d
= double worst case estimate
Zone G – performance
0
1000
2000
3000
4000
5000
6000
Dec-98
Dec-99
Dec-00
Dec-01
Dec-02
Dec-03
Dec-04
Dec-05
Dec-06
Dec-07
Dec-08
Dec-09
Dec-10
SO4
- g/m
3
L1
L2
L3
L4
L5
L6
L8
L9
L11
L12
L13
L14
L15
L16
00/00/00 Place title of presentation here 17
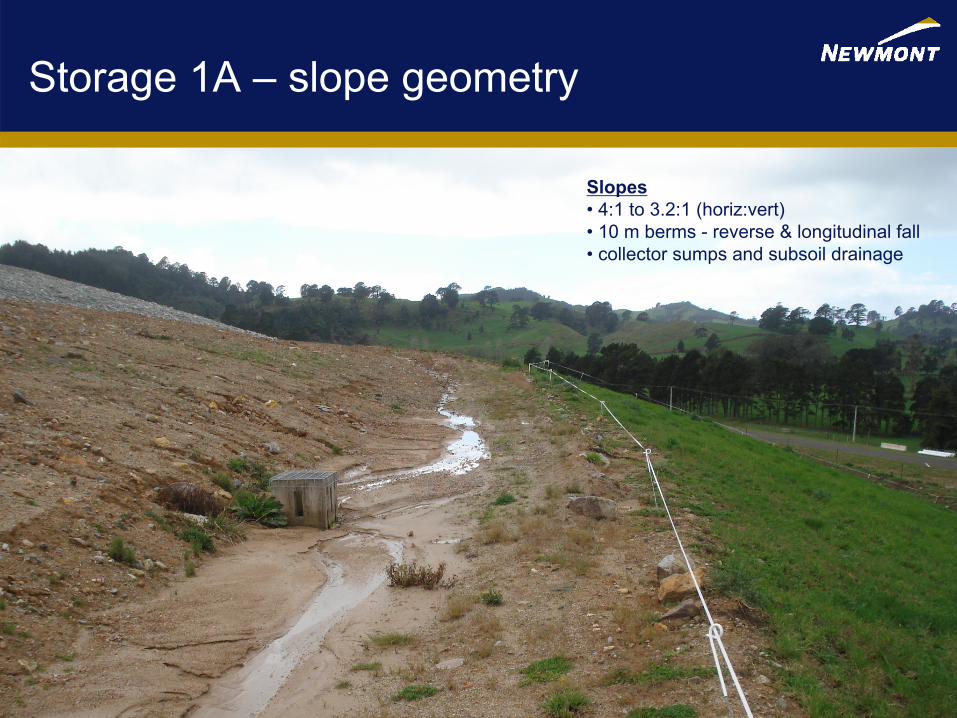
Storage 1A – slope geometry
Slopes• 4:1 to 3.2:1 (horiz:vert)• 10 m berms - reverse & longitudinal fall• collector sumps and subsoil drainage

13 14 15 16 17 18
19
20
2122
7
89101112
1
32
456
302926252728
Pasture Dry Weight Monitoring Locations
2423
TSF2-A
TSF2-B
TSF2-C
TSF1A-D
Con
trol
Pasture Productivity
Storage 2dry matter (grass) production
18 embankment sites
6 control sites-flat alluvials
Average = 15 kg/ha/d (range 9-23 kg/ha/d)
Performance target 80% - met in 2008
00/00/00 Place title of presentation here 19
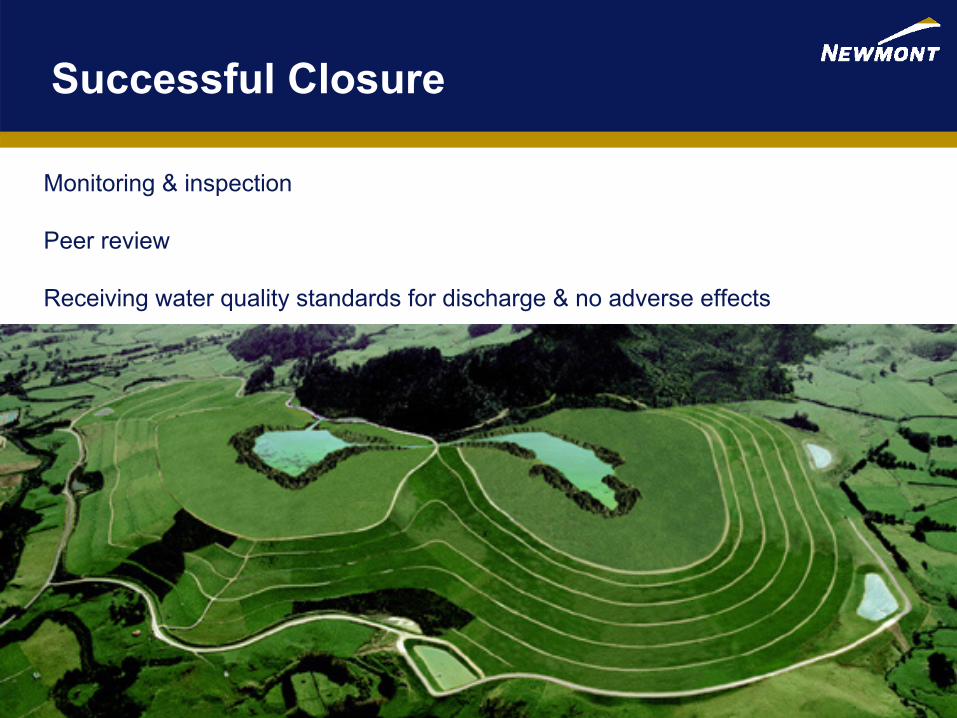
Monitoring & inspection
Peer review
Receiving water quality standards for discharge & no adverse effects
Successful Closure
00/00/00 Place title of presentation here 20
Contributors
Pieter Fransen - Environmental Manager, Newmont Waihi Gold
Jeff Ruddock - Surface Mining Manager, Newmont Waihi Gold
Trevor Matuschka - Geotechnical Engineer, Engineering Geology Ltd, NZ
Stuart Miller - Environmental Geochemistry International Pty Ltd, NSW
Wayne Russell – Groundwater Services Ltd, NZ