michael p. flanagan jennifer m. granholm … m. granholm governor michael p. flanagan superintendent...
TRANSCRIPT

JENNIFER M. GRANHOLM GOVERNOR
MICHAEL P. FLANAGAN SUPERINTENDENT OF
STATE OF MICHIGAN DEPARTMENT OF EDUCATION
LANSING
April 6, 2009
PUBLIC INSTRUCTION
MEMORANDUM TO: Members of the State Board of Education FROM: Michael P. Flanagan, Chairman SUBJECT: Approval of the 2008 Report to the Legislature on Public School Academies Attached is the 2008 Public School Academy Report to the Legislature that has been revised based on the Board’s discussion at its March 17, 2009, meeting. In each case, staff noted the issue and its resolution. Following are the revisions that have been made: (1) The usage and definition of the “host district” comparison has been questioned.
An explanation of the term is now included in the introduction, the text, and in the executive summary document, as well as in the glossary. A discussion of the need to explore alternatives to this comparison for next year’s report is included as well.
(2) More emphasis has been placed on the need for improvement in achievement
among charter high schools. (3) The report and the executive summary now emphasize more fully the point that
there are a number of traditional schools that are “beating the odds” and achieving strong student performance with high-poverty populations.
(4) It is noted in the report and in the executive summary that Public School Academy
(PSA) expenditure comparisons must take into account the fact that many PSAs do not provide transportation services, and also enroll fewer special education pupils.
(5) The report and executive summary now make mention of the idea that the closure
of low-performing PSAs can be an instructive model for traditional schools. (6) The term “service provider” is clarified to reference “management company” more
consistently throughout both documents. Various terms in the glossary were clarified more thoroughly. Once approved, the report will be posted on Michigan Department of Education’s website so that readers have easy electronic access to full-color charts and attachments. It is recommended that the State Board of Education approve the 2008 Report to the Legislature on Public School Academies as attached to the Superintendent’s memorandum dated April 6, 2009, and approve its transmittal to the Legislature.
STATE BOARD OF EDUCATION
KATHLEEN N. STRAUS – PRESIDENT • JOHN C. AUSTIN – VICE PRESIDENT CAROLYN L. CURTIN – SECRETARY • MARIANNE YARED MCGUIRE – TREASURER
NANCY DANHOF – NASBE DELEGATE • ELIZABETH W. BAUER REGINALD M. TURNER • CASANDRA E. ULBRICH
608 WEST ALLEGAN STREET • P.O. BOX 30008 • LANSING, MICHIGAN 48909
www.michigan.gov/mde • (517) 373-3324

Public School Academies (PSAs) are active participants in Michigan’s K-12 educational marketplace. The belief that all parents should have the ability to choose the school that’s best for their child, even if they can’t afford to pay tuition or move to a preferred location, has caused many to view PSAs as an instrument of social justice. In addition, authorizers’ willingness to close schools that do not live up to the terms of their performance contracts has also bolstered the legitimacy of PSAs by ensuring a proper focus on quality. This is not to say that PSAs are without their challenges; growing pains remain and continued attention is needed to ensure academic and operational success. In general, academic performance in charters is below statewide averages for all traditional public schools; if PSAs are truly to be an effective lever for change across the state and not just in specific communities, their overall rate of student achievement must make greater gains. In particular, high school performance requires targeted, intensive focus. Student achievement at the secondary level must be an area of targeted, intensive focus. Sustained leadership and support is necessary to address these issues. However, the results being achieved by PSAs in Michigan point to a sector that is becoming more mature and more fully integrated into Michigan’s educational landscape. A Word About Host Districts In 2007-08, Michigan had 232 PSAs serving more than 100,000 students. These schools continue to be generally clustered in the state’s urban areas. There are 20 urban “host” school districts in Michigan that have three or more PSAs within their boundaries. Roughly 75% of the state’s PSAs are located in these host districts. Whenever possible, charts in this report include data for the host districts as well as PSA and traditional public school statewide aggregates or averages. The host districts comprise a subset of “all traditional public schools” reflecting areas where PSAs are in relatively high demand and it is useful to separate out their data for baseline comparisons. The "host district" comparison has been used in MDE's annual PSA
report to the Legislature since 2005. It offers an additional point of reference for understanding the performance of charter schools, since the student population in host districts approximates that of charter schools more closely than does the statewide average. Neither a pure statewide average nor the host district comparison, however, provides an ideal statistical measure to use in assessing the overall achievement of charter schools in Michigan. During the coming year, MDE will work with stakeholders to review various ways of analyzing and comparing charter school data in preparation for the issuance of the 2008-09 PSA Report to the Legislature. PSA Fundamentals Demographically, PSAs in Michigan tend to look much like their urban host counterparts. More than half of their student populations are African American, and nearly 60% of PSA students are eligible to receive free/reduced-price lunch. PSAs continue to serve a lower percentage of special education students than schools in their host districts. Universities and community colleges continue to be the primary authorizers of PSAs. A majority of PSA boards contract with one of 53 service providers (also known as management companies) to provide school services, which may include facility management, personnel management, payroll and accounting, curriculum development, and professional development services for staff and teachers. Each PSA/service provider agreement is unique. Some PSA boards contract for only one or two services, such as human resources or accounting, whereas others choose to contract for all day-to-day staff functions. Authorizers During the past three years, MDE has conducted on-site visits and reviews for 15 Michigan authorizers. MDE’s findings show authorizers are active in their compliance monitoring efforts and that they have, in many instances, developed a broader menu of tools and resources for supporting the academic and financial performance of the PSAs they oversee. For more information, visit
www.michigan.gov/charters
Michigan Public School Academies At a Glance
Executive Summary of the 2008 PSA Report to the Legislature

Michigan Public School Academies Executive Summary of the 2008 At A Glance PSA Report to the Legislature
Academic Achievement in PSAs MEAP performance data show PSAs and host districts alike lagging behind all traditional public schools; however, students in PSAs performed slightly better than students in urban host districts. Similar results were reflected in nearly all of the demographic subgroups measured, with PSAs outperforming the urban host district but performing less well than the statewide traditional public school average. African-American students in PSAs performed better than African-American students in traditional public schools statewide. PSA high school performance as measured by the Michigan Merit Exam (MME) is generally lower than host districts and all traditional public schools. Academic achievement in secondary charter schools must be an area of concentrated, focused improvement. It is worth noting, however, that 27% of PSA high school pupils are enrolled in PSAs that offer alternative education programs. This percentage is noticeably higher than in traditional public schools, and likely has some effect on aggregated MME scores. In addition, the length of time a PSA high school has been operating has a pronounced effect on student achievement. Schools that have been operating for seven years or more perform significantly better than their younger counterparts. PSAs “Beating the Odds” Studies indicate the single best predictor of student academic performance continues to be socio-economic status. Student achievement generally falls as poverty levels rise. However, there are a number of PSAs and traditional public schools that have begun to beat those odds. This year, MDE identified 52 PSA buildings that succeeded in achieving over 60% proficiency with populations of more than half free and reduced-price lunch. This year’s legislative report explored and identified the strategies being used in the “beating the odds” schools. These included the following:
• Utilization of clear, consistent educational approaches • Effective use of data • Collaborative staff and school leadership • Intentional development of school culture • Consistent approaches to students’ non-academic
challenges • Deliberate efforts to engage parents
Each of the PSAs is gathering data and using staff input to develop as precise a picture as possible of how their pupils are performing and what their academic and personal needs are. Then, keeping their core objectives in mind, each school develops a plan of action for moving their pupils toward success. While implementing these plans, the schools work to maximize communication and accountability among all parties – students, teachers, and parents –
at all times. This approach appears to be generating positive results among some of Michigan’s most at-risk pupils.
A number of traditional school districts are also delivering promising results with high-poverty student populations. The Office of School Improvement is in the process of conducting research into the achievements of traditional school districts in this area and will issue its findings in 2009. Report Cards/Adequate Yearly Progress
PSAs perform better than host districts relative to state and federal accountability programs. PSAs have more schools “not identified for improvement” than host districts, but not as many as traditional public schools. No PSAs were in Phase 6 or above, but seven were in Phase 4 and two in Phase 5. The percentage of PSAs in Phases 4 and 5 was roughly comparable to traditional public schools, but lower than host districts. Authorizer intervention and efforts to provide technical support for PSAs in NCLB sanction phases have so far resulted either in turn-around or in school closure before that point. This type of authorizer intervention may be instructive for those who are working with traditional schools that face performance challenges. Charter schools that received report cards received slightly more A and B grades than host districts, but fewer than traditional public schools. Attendance/Graduation/Dropout Rates In 2007-08, PSAs experienced higher attendance and graduation rates than did host districts, but PSAs had a lower attendance rate than all traditional public schools. PSA dropout rates are mixed. PSA Financial Performance In 2006-07, with an average of $9,402 per-pupil revenues, the PSA average is below traditional public schools by $535/pupil, and below host districts by $1,778. PSA fund balances tend to be lower on average than traditional public schools’ fund balances, tending toward about 5% rather than the 11-15% typically held by traditional public schools. Six PSAs had deficits in the 2007-08 school year. PSAs typically spend a lower percentage of their revenues on instructional activities, primarily because such calculations must consider facility lease and purchase costs that come out of PSA operating expenses. Conversely, most traditional public schools incur expenses for services that many PSAs do not provide, such as transportation, meals, athletics, and co-curricular activities. In addition, PSAs also serve fewer students with special needs. Salaries for PSAs’ teachers in 2006-07 averaged $39,334, $16,192 less than Michigan’s average salary of $55,526 statewide.
2
Michigan Public School Academies Executive Summary of the 2008 At A Glance PSA Report to the Legislature
The opportunities and issues described in this report point to a PSA sector that is becoming more mature and fully integrated into Michigan’s educational landscape. PSA performance continues to make progress and the current statutory framework is capable of delivering solid results. MDE’s recommendations are designed to strengthen the PSA sector still further to ensure greater consistency and quality among all charter schools. The following recommendations, therefore, reflect broad policy and practical suggestions that will hold Michigan’s PSA sector to continued high standards of accountability. Some of these recommendations require continued discussion among policymakers; others are ready for implementation at the MDE staff level. Legislative Action Items PSA Location/Facilities Issues As Michigan’s PSA sector has matured, issues have arisen relative to the establishment and relocation of new charter school sites. Members of the SBE also have questions about how the specific characteristics of various PSA projects, such as school location, can change from the time of charter application to the issuance of a charter contract, and how such contracts can be amended and interpreted after their issuance. The SBE believes that it is necessary and appropriate to develop strong guidelines relative to PSA contractual changes, particularly as they relate to school location and facilities. The Legislature is asked to provide the department charged with overseeing school building approval issues with the authority to promulgate rules that would establish processes and criteria for selecting and developing school locations and sites. MDE Staffing Adequate resources are needed to ensure continued strong monitoring of PSA compliance and performance. SBE recommends the Legislature appropriate $225,000 in additional funds for the purpose of adding 3 FTEs to PSA program staff. As other issues arise that require legislative clarification, the SBE will bring them forward for dialogue and consideration. MDE Action Items School Accountability Accountability and transparency for all public schools is a primary objective for the SBE. MDE staff have been asked to help provide simple, uniform report cards that all schools can provide to students and families. These report cards would compare the performance of a given school to other schools in the geographic region, as well as to statewide averages. Leadership Resources MDE is working to deepen the connection between the charter and traditional school communities through administrative information sharing and support. This type of information sharing and collaboration may be useful in the development of effective school leadership for all public schools. MDE will establish a task force comprised of groups in both the traditional school district and PSA sectors to determine how to bolster communication and make useful information resources available. High School Student Achievement High school student achievement among charter schools continues to need improvement. With the relatively new Michigan Merit Curriculum and constantly rising federal accountability requirements, PSAs and traditional public schools alike need to improve their performance as quickly as possible, lest they fall even further behind. Currently, there are 109 PSAs offering some grades of high school; as their secondary capacity continues to grow it is essential to ensure they have the tools and resources they need to succeed. MDE staff will convene a study group to formulate more specific recommendations relative to improving high school performance.
SBE Recommendations
3

Michigan Public School Academies Executive Summary of the 2008 At A Glance PSA Report to the Legislature Assurances and Verification For several years, Michigan authorizers have voluntarily participated in a pilot “Assurances and Verification” project in which they demonstrate their systems for complying with the requirements set forth in statute. As described in this report, the outcomes of these reviews have been generally positive. MDE staff will formally institutionalize Assurances and Verification and explore appropriate ways of expanding the project. Collaboration between MDE and the Michigan authorizer community has been productive and consistent to date. However, should Michigan’s authorizing community elect not to participate cooperatively in this important MDE initiative, formal criteria may be needed to provide an objective basis for moving forward. In those circumstances, MDE will recommend the Legislature assign to MDE the authority to promulgate rules that establish standards and criteria for authorizer performance. Areas for Future Exploration Service Provider Transparency Many questions have been raised about service providers and how they use their funds. Some interests argue for increased transparency and accountability on the part of service providers, citing legitimate public interest in knowing how much they earn in their work for public schools. Other interests argue that as long as the PSA is performing well, the profit margin for a service provider shouldn’t matter. Fundamental to the issues of accountability and transparency is equity—between PSAs and traditional schools, as well as among private companies working with either or both. No matter the service or product provided by a company, public disclosure may help all preK-12 boards demonstrate the value of their service agreements to the public. Any policies or legislation regarding these issues should provide equitable treatment of all service providers working in preK-12 education, and accurately reflect the relative scope of services being provided. A service provider that exercises greater control over a school’s daily operations, for example, may require a different type of scrutiny than one that is merely providing one or two isolated and discrete services. The SBE will continue to explore and discuss these issues in the coming year, with an eye toward finalizing a policy recommendation for the Legislature’s consideration. Windup and Dissolution Progress is being made on the ongoing issues of windup and dissolution. MDE has worked with authorizers to dissolve the operations of closed charter schools and return all outstanding assets to the state. Authorizers and school leaders are demonstrating their commitment to ensure that closures are handled appropriately. MDE will continue to identify administrative solutions to these issues. Research Concepts to Pursue In the future, MDE will pursue specific research on topics of interest to the State Board of Education and the Legislature. Subjects under consideration for research include: • Tracking of student mobility data and patterns among all public schools • Service provider accountability • Student safety in PSAs • How PSAs are addressing the new high school graduation requirements • Post-graduation trends among PSA students
4

2008 Public School Academy Report to the Legislature

1 2008 PSA Report to the Legislature
Page Statutory Basis ..................................................................................... 2 Introduction ......................................................................................... 3 Public School Academy Fundamentals ...................................................... 5 Academic Achievement in PSAs ............................................................. 15 Report Cards/Adequate Yearly Progress.................................................. 26 PSA Financial Performance ................................................................... 30 Recommendations............................................................................... 38 Appendix A: Glossary Appendix B: “Beating the Odds” Research Findings Appendix C: PSA Proficiency Comparison – by Referent District Appendix D: 2007-08 PSA Update Appendix E: One-Page Profiles of Michigan PSAs
Table of Contents

2 2008 PSA Report to the Legislature
This report is submitted to the Michigan Legislature in fulfillment of the State Board of Education’s responsibilities pursuant to sections 501a and 1311c of 1976 PA 451 (MCL 380.501a and MCL 380.1311c), which state:
380.501a Public school academy; report to legislative committees on education.
Sec. 501a.
Not later than 1 year after the effective date of this section, and at least annually thereafter, the state board shall submit a comprehensive report, with findings and recommendations, to the house and senate committees on education. The report shall evaluate public school academies generally, including, but not limited to, an evaluation of whether public school academies are fulfilling the purposes specified in section 511(1). The report also shall contain, for each public school academy, a copy of the academy's mission statement, attendance statistics and dropout rate, aggregate assessment test scores, projections of financial stability, and number of and comments on supervisory visits by the authorizing body.
380.1311c Strict discipline academy; report; evaluation; contents.
Sec. 1311c.
Not later than 1 year after the effective date of this section, and at least annually thereafter, the state board shall submit a comprehensive report, with findings and recommendations, to the house and senate committees on education. The report shall evaluate strict discipline academies generally, including, but not limited to, an evaluation of whether strict discipline academies are fulfilling the purposes specified in former section 511(1). The report also shall contain, for each strict discipline academy, a copy of the academy's mission statement, attendance statistics and dropout rate, aggregate assessment test scores, projections of financial stability, and number of and comments on supervisory visits by the authorizing body.
The purposes specified in section 511(1) are as follows:
(a) To improve pupil achievement for all pupils, including, but not limited to, educationally disadvantaged pupils, by improving the learning environment.
(b) To stimulate innovative teaching methods. (c) To create new professional opportunities for teachers in a new type of public
school in which the school structure and educational program can be innovatively designed and managed by teachers at the school site level.
(d) To achieve school accountability for pupil educational performance by placing full responsibility for performance at the school site level.
(e) To provide parents and pupils with greater choices among public schools, both within and outside their existing school districts.
(f) To determine whether state educational funds can be more effectively, efficiently, and equitably utilized by allocating funds on a per pupil basis directly to the school rather than through school district administration.
Statutory Basis

3 2008 PSA Report to the Legislature
The continuing evolution of Michigan’s charter public school sector has generated new opportunities for leadership and change. Once regarded as a policy experiment, public school academies (PSAs) continue to earn greater legitimacy in Michigan’s K-12 educational marketplace. This legitimacy has come about as a result of some interesting trends. For example, a number of families and community leaders, particularly those in urban areas, have come to view PSAs as an instrument of social justice. They contend the ability to choose a school for one’s child should not be a privilege that belongs only to those families who can afford to pay tuition or move to a preferred location, but to everyone. In addition, authorizers’ willingness to close schools that do not meet the terms of their performance contracts has bolstered the legitimacy of PSAs. These closures – a total of 38 to date – are evidence that authorizers are holding PSAs accountable, and also are instructive for leaders seeking to address performance issues in traditional K-12 schools. The blending of these two policy ideals – social justice and accountability – brings about an interesting dynamic for Michigan PSAs. They serve a higher percentage of low-income children than their traditional K-12 counterparts, and they simultaneously face serious consequences for low student achievement. PSAs are uniquely positioned to help Michigan reduce the achievement gap between affluent children and children in poverty. An appendix to this report explores the work of 52 individual PSAs across Michigan that are “beating the odds” and achieving favorable academic results with economically disadvantaged student populations. A complementary study focusing on the traditional schools that fall into this category is underway and will be issued later in 2009. This is not to say that PSAs are without their challenges; growing pains remain and continued attention is needed to ensure academic and operational success. In general, academic performance in charters is below statewide traditional public school averages; if PSAs are truly to be an effective lever for change across the state and not just in specific communities, their overall rate of student achievement must make greater gains. In particular, high school performance requires targeted, intensive focus and improvement. Michigan PSAs have experienced challenges with student performance in grades 9-12; additional work is needed to bring up achievement in these grades. Ongoing financial pressures can also result in inadequate PSA budgeting and decision-making at the board level. The development of PSA board leaders is critical to addressing these issues and to the establishment and operation of successful schools. High quality training and leadership development opportunities are needed to prepare the boards for the responsibilities of adopting a quality educational program and delivering positive student results, hiring staff or contracting with a service provider (also known as a management company), entering into lease/purchase agreements, and complying with all applicable aspects of state and federal law. To date, authorizers provide this support once a board member has been screened and appointed, but additional training and outreach may be of benefit. The Michigan Department of Education (MDE) is helping to foster the development of strong, autonomous boards by using a portion of its Federal Charter Schools Program grant funding to help independent grassroots and local community developers understand the importance of the board role before they make important decisions and recommendations.
Introduction

4 2008 PSA Report to the Legislature
Leadership development at the school staff level is also important. PSA teachers often assume greater leadership responsibilities and have greater influence on school management and decision-making than their traditional district counterparts. Small staff sizes result in a broader distribution of administrative tasks, helping PSA teachers grow as school leaders. In some cases, PSAs have begun recognizing leadership potential more quickly and promoting staff from within, raising some intriguing ideas about how PSAs may create smoother paths for teachers to advance professionally. Service provider leadership also needs to be explored in greater depth. A majority of the public charter schools in the state use service providers to provide some level of staffing and support. Despite this volume, little is known about how service providers accomplish their deliverables on a budget that is, on average, $1,778 per pupil lower than the host district average and still manage to retain enough of a profit to maintain their involvement. Ample opportunities for review of various service provider models and their relative effectiveness exist and should be fully explored.
The opportunities and issues described in this report point to a PSA sector that is becoming more mature and more fully integrated into Michigan’s educational landscape. Strategies and expectations for PSAs that are just as high as they are for their traditional K-12 counterparts, while capitalizing fully on the strengths and unique characteristics of PSAs, are bearing fruit. Note: A Word About "Host Districts" Michigan’s public school academies continue to be generally clustered in the state’s urban areas. Twenty school districts have three or more PSAs within their boundaries. For purposes of this report, these districts are referred to as “host districts.” This year’s host districts include: Ann Arbor, Benton Harbor, Dearborn, Detroit, Flint, Grand Rapids, Hamtramck, Highland Park, Holland, Inkster, Jackson, Lansing, Midland, Muskegon, Pontiac, Port Huron, Saginaw, Southfield, Taylor, and Wayne-Westland. Whenever possible, charts in this report include data for the host districts as well as PSA and traditional public school statewide aggregates or averages. The host districts comprise a subset of “all traditional public schools” reflecting areas where PSAs are in relatively high demand and it is useful to separate out their data for baseline comparisons. The "host district" comparison has been used in MDE's annual PSA report to the Legislature since 2005. It offers an additional point of reference for understanding the performance of charter schools, since the student population in host districts approximates that of charter schools more closely than does the statewide average. Neither a pure statewide average nor the host district comparison, however, provides an ideal statistical measure to use in assessing the overall achievement of charter schools in Michigan. During the coming year, MDE will work with stakeholders to review various ways of analyzing and comparing charter school data in preparation for the issuance of the 2008-09 PSA Report to the Legislature. This year's report, however, retains the analytical framework that has been in place since 2005.

5 2008 PSA Report to the Legislature
Demographics Growth in the number of public school academies in Michigan has slowed, but continues despite the cap on the number of public university-authorized Part 6A charter schools. During 2008, the first Urban High Schools authorized under Part 6C of the Revised School Code opened in Detroit. This continued growth, combined with ongoing improvement in academic performance, indicates growing stability in a system that is now thirteen years old and that serves nearly 6% of Michigan schoolchildren. Five closures and seven new PSAs (a detailed list is included in Appendix D) netted an increase of two PSAs for the 2008-09 school year, bringing the total to 232. This small increase reflects a leveling-off of growth since the 2005-06 school year, as Figure 1 shows. Figure 2 (on the following page) shows that the number of students served has continued to grow more steeply than the number of academies. For the 2007-08 school year, the number of students increased by 2,000 pupils.
Public School Academy Fundamentals
Authorizers may establish charter public schools under any of three sections of Michigan law: 1. Part 6A of the Revised School Code (MCLA 380.501 – 508) permits 150 state public university-authorized general PSAs and an unlimited number of PSAs authorized within their geographical boundaries by community colleges, intermediate school districts, or local school districts. 2. Part 6C of the Revised School Code (MCLA 380.521 – 529) permits 15 Urban High School Academies to be authorized within the City of Detroit by state public universities. 3. Public Act 23 of 1999 (MCLA 380.1311b – 1311e) permits an unlimited number of Strict Discipline Academies organized to serve suspended or expelled students, or those placed by a court or juvenile agency.
Figure 1: PSAs Operating by Year
8 5 5 5 7
75
106
171184 188 188
199
216225 229 230 232
4135 32
12191414
343441
138
0
50
100
150
200
250
1995
-199
6
1996
-199
7
1997
-199
8
1998
-199
9
1999
-200
0
2000
-200
1
2001
-200
2
2002
-200
3
2003
-200
4
2004
-200
5
2005
-200
6
2006
-200
7
2007
-200
8
2008
-200
9
Num
ber o
f PSA
s
New Schools Total Schools

6 2008 PSA Report to the Legislature
Geographically, Michigan’s public school academies continue to be generally clustered in the state’s urban areas. Twenty school districts have three or more PSAs within their boundaries. For purposes of this report, these districts are referred to as “host districts.” This year’s host districts include: Ann Arbor, Benton Harbor, Dearborn, Detroit, Flint, Grand Rapids, Hamtramck, Highland Park, Holland, Inkster, Jackson, Lansing, Midland, Muskegon, Pontiac, Port Huron, Saginaw, Southfield, Taylor, and Wayne-Westland. Whenever possible, charts in this report include data for the host districts as well as PSA and traditional public school statewide aggregates or averages. The host districts comprise a subset of “all traditional public schools” reflecting areas where PSAs are in relatively high demand and it is useful to separate out their data for baseline comparisons.
PSAs continue to serve proportionately more students in grades K-5 than either host districts or all traditional public schools. Nearly 60% of PSA students are in these grades, as opposed to 44.4% for host districts, and 43% for all traditional public schools. Statewide, 43.9% of students are in this grade range (see Figures 3 and 4).
Figure 2: PSA Students by Year
11,370
19,628
31,660
44,964
54,039
62,468
68,379
74,425
81,629
91,567
98,667
100,310
4,449
5.9%5.7%
5.3%
4.8%
4.3%
0.3%0.7%
1.2%
1.9%
2.7%
3.2%
3.7%3.9%
0
20,000
40,000
60,000
80,000
100,000
120,000
1995
-199
6
1996
-199
7
1997
-199
8
1998
-199
9
1999
-200
0
2000
-200
1
2001
-200
2
2002
-200
3
2003
-200
4
2004
-200
5
2005
-200
6
2006
-200
7
2007
-200
8
0.0%
1.0%
2.0%
3.0%
4.0%
5.0%
6.0%
7.0%Number of PSA StudentsPercent of Michigan Students
Figure 3: 2007-08 Student Enrollment by Grade Range
57.9
%
24.3
%
17.8
%
44.4
%
22.0
%
33.6
%
43.0
%
22.6
%
34.4
%
43.9
%
22.7
%
33.4
%
0.0%
10.0%
20.0%
30.0%
40.0%
50.0%
60.0%
70.0%
Kindergarten through 5th Grade 6th Grade through 8th Grade 9th Grade through 12th Grade
PSAs Host Districts All Traditional Public Schools State

7 2008 PSA Report to the Legislature
The proportion of middle school and high school students is essentially unchanged this year, although fourteen schools expanded in 2008 by adding a grade in the 6-12 range. Another five schools will be eliminating service in the upper grades.
No schools added elementary grades in fall 2008, but five added pre-K
services, while two discontinued pre-K programs. Figure 5 shows the ethnic make-up of PSAs, host districts, and all traditional public schools. The ethnic mix of PSAs tends to closely mirror that of the 20 urban host districts where 75% of PSAs are located. African-American students make up more than half the population in PSAs and host districts. Caucasian students represent 34% of PSA students and 30% of host district pupils. Both host districts and the PSAs within them have a significantly lower proportion of Caucasian students than traditional public schools, where Caucasian students are 73% of the population; African-American students make up only 18% of the traditional public school student population.
Figure 4: 2007-08 Student Enrollment by Grade
0
20,000
40,000
60,000
80,000
100,000
120,000
140,000
160,000
Kin
derg
arte
n
1st G
rade
2nd
Gra
de
3rd
Gra
de
4th
Gra
de
5th
Gra
de
6th
Gra
de
7th
Gra
de
8th
Gra
de
9th
Gra
de
10th
Gra
de
11th
Gra
de
12th
Gra
de
PSAs Host Districts All Traditional Public Schools
Figure 5: 2007-08 Student Enrollment by Ethnicity
1% 1% 1%2% 2%
57%
58%
18%
0% 0% 0%
34%
30%
73%
5%
8%
5%
1% 1% 1%2%
0%
10%
20%
30%
40%
50%
60%
70%
80%
PSAs Host Districts All Traditional Public Schools
% American Indian % Asian % African American % Hawaiian % White % Hispanic % Multiracial

8 2008 PSA Report to the Legislature
Participation in free and reduced-price lunch programs is a good proxy for economic status. Figures 6-8 show that 57.4% of PSA students participate in these programs, which is lower than the 63.2% in host districts but higher than the 36.2% in traditional public schools statewide.
% Free Meal % Reduced Meal % Not Free/Reduced
% Free Meal % Reduced Meal % Not Free/Reduced
% Free Meal % Reduced Meal % Not Free/Reduced
Figure 6: PSA Average Free/Reduced Lunch Eligibility
49.9%
7.5%
42.7%
Figure 7: Host Districts Average Free/Reduced Lunch Eligibility
57.9%
5.3%
36.9%
Figure 8: All Traditional Public Schools Average Free/Reduced Lunch Eligibility
29.7%
6.5%63.8%

9 2008 PSA Report to the Legislature
Figure 9 shows the wide variation in free and reduced-price lunch eligibility in all schools. PSAs and traditional public schools both include schools with participation as low as under 10% and as high as over 90%.
Because state-wide averages can hide this variation, scatter-plot displays are used in the following academic section of the report. This allows PSAs to be compared to other schools serving similar populations and differentiated from schools serving different populations. As of December 2007, PSAs continue to serve a lower percentage of special education students than schools in their host districts, as Figure 10 shows. Figure 11 (on the following page) divides PSAs, ranked by special education percentage, into ten equal groups. Each group’s overall percentage is displayed to illustrate the wide range within PSAs.
Figure 10: December 2007 Students with Disabilities
5.2%
10.1%
9.4%
3.9%
6.2%5.3%
0.0%
2.0%
4.0%
6.0%
8.0%
10.0%
12.0%
14.0%
16.0%
18.0%
PSAs Host Districts All Traditional Public Schools
Percent Non-LD Special EdPercent with Learning Disabilities
Figure 9: 2007-08 Range of Free/Reduced Lunch Percentages
0.0%
10.0%
20.0%
30.0%
40.0%
50.0%
60.0%
70.0%
80.0%
90.0%
100.0%
PSAs Host Districts All Traditional Public Schools

10 2008 PSA Report to the Legislature
Figures 12-14 show the proportions of students with different disability types for PSAs, hosts, and all traditional public schools. Here, there are no striking differences between the different school populations.
Figure 13: December 2007 Percent of Host District Students by Type of Disability
Figure 14: December 2007 Percent of All Traditional Public School Students
by Type of Disability
Cognitive Impairment Emotional Impairment Hearing Impairment Visual Impairment Physical Impairment Speech & Language Impairment Early Childhood Delay Learning Disabled Severe Multiple Impairments Autism Spectrum Disorder Traumatic Brain Injury
Deaf/Blind
Figure 11: December 2007 Range of PSA Special Education Percentages
4.1%5.4%
6.9%8.1%
9.3% 10.0%11.2%
12.6%
15.1%
26.7%
0.0%
5.0%
10.0%
15.0%
20.0%
25.0%
30.0%
Lowest 10%
Second 10%
Third 10%
Fourth 10%
Fifth 10%
Sixth 10%
Seventh 10%
Eighth 10%
Ninth 10%
Highest 10%
Figure 12: December 2007 Percent of PSA Students by Type of Disability
8.2%
5.2% 0.7%0.3%
0.8%
30.4%
0.7%
43.0%
0.0%2.9%
0.3%0.0%
7.5%
15.3%
6.6%
1.8%
0.4%2.8%
19.8%
3.3%
38.3%
1.8%
3.9%0.2%
0.0%
5.9%10.5%
7.0%
1.4%
0.4%
1.7%
24.8%
2.8%
36.0%
1.7%
5.2%
0.3%
0.0% 8.1%

11 2008 PSA Report to the Legislature
Figure 15 shows that PSAs are serving a higher percentage of students through alternative education programs, particularly at the high school level. There are a number of PSA programs that have been developed as “second-chance” institutions for students that are at risk, including several Strict Discipline Academies. PSA Teachers Nearly 99 percent of teachers in Michigan PSAs meet the definition of “highly qualified” under the Elementary and Secondary Education Act (ESEA), as shown in Figure 16. This total is a full percentage point higher than in traditional public schools, but lower than in host districts.
Figure 15: Spring 2008 Students Participating in Alternative Education Programs
5%3%
12%
9%
4%
27%
0%
5%
10%
15%
20%
25%
30%
PSAs Host Districts All Traditional Public Schools
% of All Students in Alternative Programs % of High School Students in Alternative Programs
Figure 16: December 2007 Highly Qualified Teachers
98.7% 99.2% 97.7%
2.3%0.8%1.3%
0.0%
20.0%
40.0%
60.0%
80.0%
100.0%
120.0%
PSAs Host Districts All Traditional Public Schools
% Highly Qualified % Not Highly Qualified

12 2008 PSA Report to the Legislature
Authorizers Universities and community colleges continue to be the primary authorizers of PSAs. Of the possible 150 provided by statute, 148 PSAs have been authorized by eight universities; 39 by three community colleges; 30 PSAs by 12 Intermediate School Districts (ISDs); and 13 by four local school districts. Figure 17 shows the 2007-08 distribution of PSAs by individual authorizer. PSA authorizers are responsible for all of the following activities under Michigan law: • Reviewing applications and awarding charters to qualified applicants; • Establishing the method of selection and appointment for board members; • Issuing charter contracts that include clear expectations for performance; • Acting as a fiscal agent for state school aid funds; • Gathering and evaluating data related to school compliance and performance; and • Taking action based on a school’s performance relative to the expectations set forth in
the charter contract. In addition to these responsibilities, many Michigan authorizers have developed additional oversight and support functions. Through the Michigan Council of Charter School Authorizers, they have also adopted a common set of oversight and accountability standards, available at www.mccsa.us. In 2005, MDE began developing a pilot “Assurances and Verification” program to examine authorizer practices in Michigan. On a voluntary basis, authorizers provide assurances that they have processes and systems in place to ensure 18 important requirements for the PSAs they charter. During a subsequent verification visit, MDE staff examine the authorizer’s files and records for a sample of PSAs to ensure that the systems are implemented as described.
Figure 17: 2007-08 Number of PSAs by Authorizer
58
37
28
18 17
10 9 8 7 7 6 5 3 2 2 2 1 1 1 1 1 1 1 1 1 1 10
10
20
30
40
50
60
Cen
tral M
ichi
gan
Uni
vers
ity
Bay
Mills
Com
mun
ity C
olle
ge
Gra
nd V
alle
y St
ate
Uni
vers
ityS
agin
aw V
alle
y S
tate
Uni
vers
ity
Ferri
s S
tate
Uni
vers
ity
St. C
lair
ISD
Det
roit
Pub
lic S
choo
lsE
aste
rn M
ichi
gan
Uni
vers
ity
Lake
Sup
erio
r Sta
te U
nive
rsity
Oak
land
Uni
vers
ity
Way
ne R
ESA
Nor
ther
n M
ichi
gan
Uni
vers
ity
Sag
inaw
ISD
Hig
hlan
d Pa
rk C
ity S
choo
ls
Hills
dale
ISD
Mid
land
Co.
ES
A
Alle
gan
ISD
Bay-
Aren
ac IS
D
CO
P IS
DG
rand
Rap
ids
Publ
ic S
choo
ls
Kel
logg
Com
mun
ity C
olle
ge
Mac
omb
ISD
Man
iste
e IS
D
Otta
wa
Area
ISD
Was
hten
aw C
omm
unity
Col
lege
Was
hten
aw IS
D
Wyo
min
g Pu
blic
Sch
ools

13 2008 PSA Report to the Legislature
During the past three years, Assurances and Verification visits have been conducted for 15 Michigan authorizers. MDE’s findings show authorizers are active in their compliance monitoring efforts and that they have, in many instances, developed a broad menu of tools and resources for supporting the academic and financial performance of the PSAs they oversee. Service Providers Michigan law permits PSA boards to contract with service providers (also known as management companies) for various school staffing and support functions, which may include facility management, personnel management, payroll and accounting, curriculum development, and professional development services for staff and teachers. The majority of Michigan PSAs have contracted with one of 53 service providers to provide educational services. Figure 18 shows the number of students served by PSAs using each service provider. Each PSA/service provider agreement is unique. Some PSA boards contract for only one or two services, such as human resources or accounting, whereas others choose to contract for all day-to-day staff functions. The variation in service provider arrangements is broad and difficult to quantify. Some service providers work with only one PSA, while others contract with multiple PSAs in Michigan and across the country. Some service providers act in only a limited capacity, while others offer complete “turn-key” operations. This widely varied approach to PSA contracting has allowed for the creation of a diverse service provider marketplace in Michigan.
Figure 18: 2007-08 Students Served for PSAs Using the Same Service Provider
22,8
0316
,990
7,52
44,
284
3,30
13,
087
3,01
42,
577
2,56
92,
396
2,20
32,
126
2,11
71,
615
1,60
21,
474
1,36
41,
225
1,14
51,
105
1,10
41,
001
1,00
096
596
593
685
878
072
368
966
652
752
548
840
239
938
335
029
928
827
523
822
722
721
721
419
018
116
514
614
413
780
0
5,000
10,000
15,000
20,000
25,000
Nat
iona
l Her
itage
Aca
dem
ies
(35)
Self-
man
aged
(48)
Leon
a G
roup
(16)
Cha
rter S
choo
l Adm
inis
tratio
n Se
rvic
esH
elic
on A
ssoc
iate
s (9
)M
osai
ca E
duca
tion
(11)
Rom
ine
Gro
up (5
)Va
rner
& A
ssoc
iate
s (3
)C
.S. P
artn
ers
(7)
Cho
ice
Sch
ools
Ass
ocia
tes
(8)
Glo
bal E
duca
tiona
l Exc
elle
nce
(5)
Imag
ine
Sch
ools
(5)
Ham
adeh
Edu
catio
nal S
ervi
ces
(3)
Edi
son
Scho
ols
(2)
Inno
vativ
e Te
achi
ng S
olut
ions
(1)
Whi
te H
at M
anag
emen
t (5)
Scho
olho
use
Serv
ices
& S
taffi
ng (3
)N
ew U
rban
Lea
rnin
g (1
)S
olid
Roc
k (1
)M
idw
est M
anag
emen
t Gro
up In
c. (1
)C
harte
r Sch
ool S
ervi
ces
of M
ichi
gan
(1)
Adva
nce
Educ
atio
nal S
ervi
ces
(4)
Smar
t Sch
ools
Man
agem
ent (
1)B
ardw
ell G
roup
(2)
Tech
nica
l Aca
dem
y G
roup
(1)
Flin
t Edu
catio
n M
anag
emen
t (1)
Woo
dbrid
ge G
roup
, Inc
. (2)
Educ
atio
n As
soci
ates
(1)
Sum
mit
Man
agem
ent C
onsu
lting
(1)
SEA
IV, I
nc. (
1)Ev
ans
Solu
tion
Man
agem
ent C
ompa
ny (2
)Tr
ansi
tions
Con
sulta
nts,
LLC
(1)
Amer
ican
Inst
itutio
nal
Man
agem
ent
Edu
catio
n M
anag
emen
t & N
etw
orks
Nat
aki T
alib
ah S
choo
lhou
se (1
)Sy
nerg
y Tr
aini
ng S
olut
ions
, Inc
(2)
Foun
datio
n fo
r Beh
avio
ral R
esou
rces
(2)
Vang
uard
Edu
catio
n D
evel
opm
ent
Cha
tfiel
d M
anag
emen
t Fou
ndat
ion
(1)
Sele
ct M
anag
emen
t, In
c. (1
)N
orth
star
Edu
catio
nal (
2)O
rbis
Man
agem
ent G
roup
(1)
777
Man
agem
ent C
ompa
ny (1
)SV
RC
Indu
strie
s (2
)M
idla
nd C
harte
r Ini
tiativ
e (1
)Ed
ucat
ion
& Tr
aini
ng C
onne
ctio
ns (2
)E
ight
CA
P, In
c (1
)Ed
tec
Cen
tral (
1)Bl
ack
Sta
r Edu
catio
nal M
anag
emen
t (1)
Pro
fess
iona
l Con
tract
Mgm
t. (1
)La
kesh
ore
Edu
catio
nal M
anag
emen
t, In
c.La
kevi
ew P
ublic
Sch
ools
(1)
Cin
cinn
ati E
duca
tion
Man
agem
ent(S
ABIS
)

14 2008 PSA Report to the Legislature
Service providers are accountable to the non-profit PSA boards that hire them. The boards are responsible for setting policy, directing operational and academic performance, and ensuring fiscal stability. Regardless of the type or level of support for which it is contracted, each service provider operates at the direction of the PSA board. PSA Boards PSA board members are public officials that have sworn a constitutional oath of office in Michigan. Each board member undergoes a selection and appointment process established by the PSA’s authorizer before being named by the authorizer’s governing board. Some concerns have been raised about whether or not service providers (also known as management companies) in Michigan are able to name their own governing boards and thus exercise some undue level of influence or control over these boards once a school is established. While Michigan law permits the developer of a new PSA to name the members of an initial governing board, it is up to the authorizer to ensure that those board members are qualified, independent voices on behalf of the PSAs they serve. To ensure procedural consistency across Michigan’s authorizing community, the Michigan Council of Charter School Authorizers has adopted standards for this selection and appointment process. At minimum, these standards presume written application for board appointment, a criminal records check, and a personal interview. The standards also delve into potential conflict of interest issues and recommend the use of a disclosure form to be completed by PSA board members on an annual basis. These procedures are designed to ensure board member quality and autonomy and prevent inappropriate PSA board member/service provider relationships. The Michigan Department of Education In addition to monitoring authorizing practices through its pilot “Assurances and Verification” program, MDE provides direct review of PSA compliance and practice. As part of its general leadership and supervision of all public schools in Michigan, the Department reviews schools’ compliance with statutory and reporting requirements. MDE also offers the same support to PSAs that traditional districts receive under the federal No Child Left Behind law. During 2007-08, MDE staff conducted nearly 200 visits to PSAs in Michigan. These visits were conducted by staff working to provide technical support, monitoring and assistance in a variety of areas. In addition, the Department has fielded hundreds of phone calls from PSA staff, parents and community members. MDE staff members will continue to provide support to and monitoring of PSAs in the same manner they work with all other public schools in Michigan.

15 2008 PSA Report to the Legislature
Most charter and traditional public schools evaluate academic performance in a variety of ways. For many PSAs, authorizers aggregate academic data within their oversight systems and use this research to inform their accountability decisions. In addition to the Michigan Educational Assessment Program (MEAP) and Michigan Merit Examination (MME), several authorizers also require the use of specific standardized assessments (such as Gates-MacGinitie, Iowa Basic, or Scantron Performance Series), which are used to monitor educational progress and in some cases measure annual growth. These assessments are typically funded through the authorizer’s oversight fee and allow comparative analysis within an authorizer’s portfolio. For this report, the fundamental measures used to analyze academic performance are the MEAP and MME, since they are the measures for which data are available for all PSAs and all traditional public schools in the state. The remaining data analyzed in this report combine MEAP’s academic data with other factors to derive: Adequate Yearly Progress (AYP), No Child Left Behind (NCLB) phases of school improvement status, Education YES! School Report Card grades, and attendance and graduation rates. These measures are discussed as individual components within the analysis of academic performance. In each case, the most recent available data are reported. The results used for this report are from fall 2007 elementary and middle school test administration dates and spring 2008 high school testing dates. Test Performance The MEAP test is an annual assessment of student achievement based on the Grade Level Content Expectations (GLCEs) as developed and approved by the State Board of Education (SBE) for English Language Arts (ELA) and Mathematics in grades 3-8. These SBE-approved expectations were developed with participation from Michigan educators, parents, community members, university professors, and other experts within each content area and grade level. The MME consists of three parts: • The American College Testing (ACT) college entrance examination • WorkKeys job skills assessments in reading and mathematics • Michigan assessments in mathematics, science, social studies, and persuasive writing Students expected to graduate in 2010 took the MME in March 2008. The MME assessment measures student learning against Michigan high school standards, benchmarks, and core content expectations. Elementary and Middle School Student Achievement Figure 19 compares Fall 2007 PSA Grade 3-8 performance with that of the 20 host districts and with traditional public schools. For both ELA and mathematics, data have been aggregated for all six grades to give an overview of the school’s performance. This figure shows the percentage of students who met or exceeded state standards. Both PSA and host district performance lagged behind traditional public schools, but students in PSAs performed slightly better than students in urban host districts. A comparison of each PSA to its referent district has been included in Appendix C of this document. This comparison does not include the relative number of pupils being tested in each of the schools, but may lend some additional perspective to the charts on the following pages.
Academic Achievement in PSAs

16 2008 PSA Report to the Legislature
Figures 20-23 compare PSA, traditional public school, and host district performance in ELA and mathematics for several demographic subgroups: economically disadvantaged students, African-American students, Hispanic students, and students with disabilities. Each of these groups was of sufficient size to allow for meaningful comparisons. In the fall of 2007, each of these subgroups showed higher proficiency in PSAs than in urban host districts. African-American students in PSAs performed better than African-American students in all traditional public schools statewide.
Figure 19: Fall 2007 Grade 3-8 MEAP Proficiency
66.4% 67.1%
61.4% 61.2%
78.1% 78.6%
0.0%
10.0%
20.0%
30.0%
40.0%
50.0%
60.0%
70.0%
80.0%
90.0%
100.0%
3-8 ELA 3-8 Math
Perc
ent P
rofic
ient
PSAs
Host Districts
All Traditional Public Schools
Figure 20: Fall 2007 Grade 3-8 MEAP Proficiency for Economically Disadvantaged Students
59.2
%
54.8
%
55.2
%
49.9
%
64.0
%
62.0
%
59.8
%
61.3
%
54.6
%
55.1
% 65.2
%
66.3
%
0.0%
25.0%
50.0%
75.0%
100.0%
PSAs ELA PSAs Math Host DistrictsELA
Host DistrictsMath
All TraditionalPublic Schools
ELA
All TraditionalPublic Schools
Math
Percent Proficient Fall 2006 Percent Proficient Fall 2007

17 2008 PSA Report to the Legislature
Figure 21: Fall 2007 Grade 3-8 MEAP Proficiency for African American Students
59.3
%
51.9
%
55.2
%
47.3
% 57.9
%
50.9
%59.3
%
58.8
%
52.6
%
51.2
% 56.8
%
55.3
%
0.0%
25.0%
50.0%
75.0%
100.0%
PSAs ELA PSAs Math Host DistrictsELA
Host DistrictsMath
All TraditionalPublic Schools
ELA
All TraditionalPublic Schools
Math
Percent Proficient Fall 2006 Percent Proficient Fall 2007
Figure 22: Fall 2007 Grade 3-8 MEAP Proficiency for Hispanic Students
61.4
%
59.8
%
56.2
%
55.3
% 64.4
%
63.8
%
63.1
%
66.0
%
57.3
%
60.6
%
65.7
%
68.7
%
0.0%
25.0%
50.0%
75.0%
100.0%
PSAs ELA PSAs Math Host DistrictsELA
Host DistrictsMath
All TraditionalPublic Schools
ELA
All TraditionalPublic Schools
Math
Percent Proficient Fall 2006 Percent Proficient Fall 2007

18 2008 PSA Report to the Legislature
High School Student Achievement Figure 24 shows that PSA high schools, in the aggregate, did not perform as well as host districts or traditional public schools on the mathematics and ELA portions of the MME. Again, a comparison of each PSA to its referent district has been included in Appendix C of this document. As mentioned, high school performance is an area in need of targeted, intensive improvement. As mentioned on page 11, 27% of all PSA high school pupils are participating in alternative education programs. This percentage is noticeably higher than in traditional public schools, and likely has some effect on the aggregated MME scores reported here.
Figure 23: Fall 2007 Grade 3-8 MEAP Proficiency for Students with Disabilities
35.4
%
37.6
%
24.5
%
28.2
%
39.3
% 45.1
%
33.0
% 40.1
%
27.7
% 33.2
% 41.0
% 47.4
%
0.0%
25.0%
50.0%
75.0%
100.0%
PSAs ELA PSAs Math Host DistrictsELA
Host DistrictsMath
All TraditionalPublic Schools
ELA
All TraditionalPublic Schools
Math
Percent Proficient Fall 2006 Percent Proficient Fall 2007
Figure 24: Spring 2008 High School MME Proficiency
23.1
%
16.2
%
36.8
%
28.3
%
53.1
%
47.0
%
0.0%
10.0%
20.0%
30.0%
40.0%
50.0%
60.0%
ELA Math
Per
cent
Pro
ficie
nt
PSAsHost DistrictsAll Traditional Public Schools

19 2008 PSA Report to the Legislature
The length of time a PSA high school has been operating has a pronounced effect on student achievement. Figure 25 shows this pattern of improvement, with schools that have been operating for seven years or more performing significantly better than their newer counterparts. Subgroup comparisons show that both economically disadvantaged students and African-American students also perform less well in PSA high schools than in host district or traditional public school high schools. Figures 26 and 27 illustrate this.
Figure 25: Spring 2008 MME Proficiency by Age of PSA
12.0
%
25.1
%
17.9
%
8.8%
8.6%
3.0%
0.0%
25.0%
50.0%
75.0%
100.0%
3 Years or Less 4 to 6 Years 7 or More Years
ELA Math
Figure 26: Spring 2008 High School MME Proficiency for Economically Disadvantaged Students
15.4
%
9.6%
22.1
%
14.9
%
32.0
%
26.3
%
0.0%
5.0%
10.0%
15.0%
20.0%
25.0%
30.0%
35.0%
40.0%
45.0%
50.0%
ELA Math
Per
cent
Pro
ficie
nt
PSAsHost DistrictsAll Traditional Public Schools

20 2008 PSA Report to the Legislature
No comparisons can be presented for Hispanic students or students with disabilities because those subgroups were too small at the high school level to provide for statistically reliable analysis. Combining Academic and Socio-economic Analysis Studies indicate the single best predictor of student academic performance continues to be socio-economic status. The charts presented on the following pages blend MEAP and MME achievement results with free and reduced-price lunch data to allow comparison among schools serving similar economic populations. The scatter plots should be read in two steps. Moving horizontally from left to right across the bottom axis, a reader progresses from relatively prosperous student populations to relatively distressed populations. The figures on the bottom scale represent the percentage of students eligible for free/reduced lunch subsidies and range from 0-100%. At any given point on that scale, moving vertically up the chart, the reader encounters one dot for every school in Michigan whose population fits that proportion of students in poverty. A school’s dot is located at the height along the vertical axis at left that indicates the percentage of that school’s students who scored proficient on MEAP. The general pattern of the dot-cluster (falling from left to right) displays a classic negative correlation: the more students in poverty, the fewer MEAP proficiencies. This is true not only for Michigan’s traditional public schools (shown in grey squares) and Michigan PSAs (shown in darker, blue diamonds) but also for students across the nation. When the nation does not leave any children behind, the dot-cluster will level out, meaning that children in poverty succeed at the same rate as relatively well-off students, and then rise so that both populations succeed in higher numbers. NCLB’s goal of 0% failures by 2014 would be represented on a chart like this with all dots lined up at the 100% top edge of the chart.
Figure 27: Spring 2008 High School MME Proficiency for African American Students
14.5
%
6.2%
23.2
%
12.7
%
23.7
%
14.4
%
0.0%
5.0%
10.0%
15.0%
20.0%
25.0%
30.0%
35.0%
40.0%
45.0%
50.0%
ELA Math
Per
cent
Pro
ficie
nt
PSAsHost DistrictsAll Traditional Public Schools

21 2008 PSA Report to the Legislature
Figures 28-31 display the resulting patterns for 3-8 ELA, 3-8 mathematics, High School ELA, and High School mathematics. Each chart is divided into four quadrants by a horizontal and vertical line at the halfway (50%) point. The schools in the upper right quadrant represent extraordinarily interesting successes – they have succeeded in achieving over 50% proficiency with more than half free/reduced lunch populations.
Figure 28: Fall 2007 3-8 ELA MEAP Proficiency vs Poverty Percentage
0.0%
10.0%
20.0%
30.0%
40.0%
50.0%
60.0%
70.0%
80.0%
90.0%
100.0%
0.0% 10.0% 20.0% 30.0% 40.0% 50.0% 60.0% 70.0% 80.0% 90.0% 100.0%
Percent Free and Reduced Lunch
Percen
t Proficient
Non‐PSA PSA Linear (PSA) Linear (Non‐PSA)
Figure 29: Spring 2008 High School ELA MME Proficiency vs Poverty Percentage
0.0%
10.0%
20.0%
30.0%
40.0%
50.0%
60.0%
70.0%
80.0%
90.0%
100.0%
0.0% 10.0% 20.0% 30.0% 40.0% 50.0% 60.0% 70.0% 80.0% 90.0% 100.0%
Percent Free and Reduced Lunch
Percen
t Proficient
Non-PSAs PSAs Linear (PSAs) Linear (Non-PSAs)
22 2008 PSA Report to the Legislature
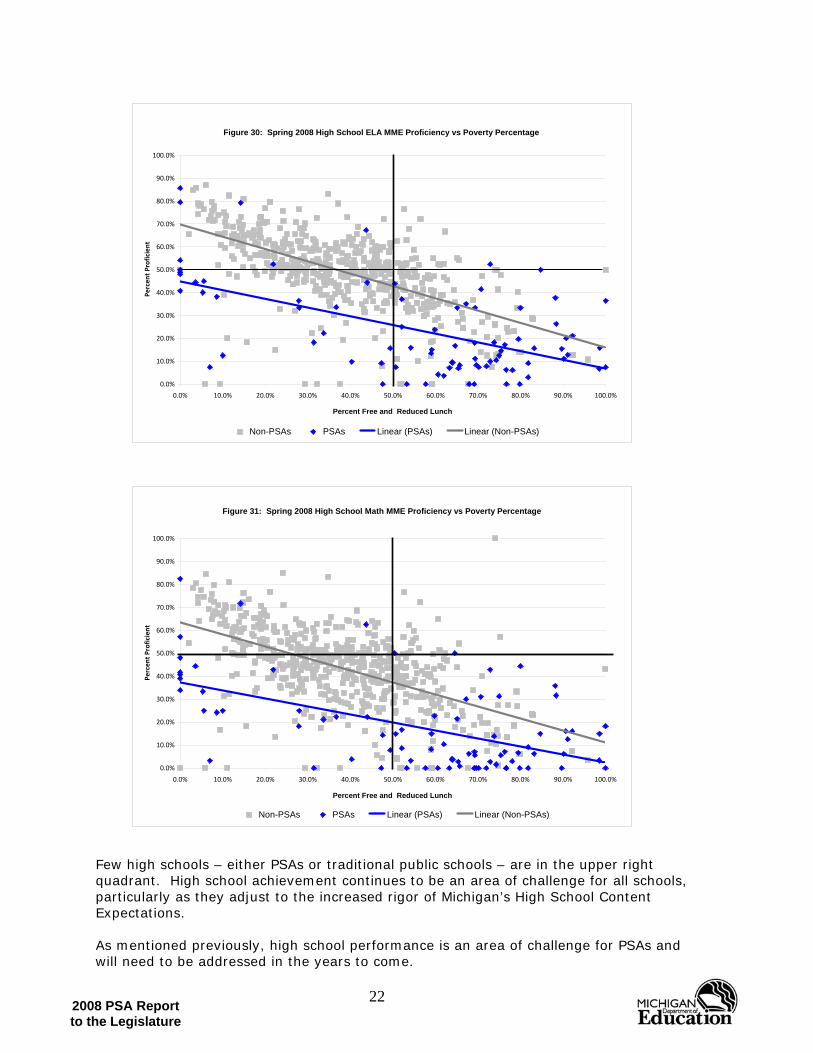
Few high schools – either PSAs or traditional public schools – are in the upper right quadrant. High school achievement continues to be an area of challenge for all schools, particularly as they adjust to the increased rigor of Michigan’s High School Content Expectations. As mentioned previously, high school performance is an area of challenge for PSAs and will need to be addressed in the years to come.
Figure 30: Spring 2008 High School ELA MME Proficiency vs Poverty Percentage
0.0%
10.0%
20.0%
30.0%
40.0%
50.0%
60.0%
70.0%
80.0%
90.0%
100.0%
0.0% 10.0% 20.0% 30.0% 40.0% 50.0% 60.0% 70.0% 80.0% 90.0% 100.0%
Percent Free and Reduced Lunch
Percen
t Proficient
Non-PSAs PSAs Linear (PSAs) Linear (Non-PSAs)
Figure 31: Spring 2008 High School Math MME Proficiency vs Poverty Percentage
0.0%
10.0%
20.0%
30.0%
40.0%
50.0%
60.0%
70.0%
80.0%
90.0%
100.0%
0.0% 10.0% 20.0% 30.0% 40.0% 50.0% 60.0% 70.0% 80.0% 90.0% 100.0%
Percent Free and Reduced Lunch
Percen
t Proficient
Non-PSAs PSAs Linear (PSAs) Linear (Non-PSAs)

23 2008 PSA Report to the Legislature
Figures 32-33 identify the elementary and middle school PSAs that have one or more school buildings with overall student achievement levels in the upper right quadrant in Figures 28-31.
Figure 32: PSAs Serving over 50% Poor Students and Achieving Over 60% 3-8 ELA Proficiency
0.0%
20.0%
40.0%
60.0%
80.0%
100.0%
SAG
INAW
PR
EPA
RA
TOR
Y A
CA
DE
MY
M.L
. KIN
G J
R. E
DU
CA
TIO
N C
EN
TER
BIN
GH
AM
AC
AD
EM
YV
AN
DE
RBI
LT C
HA
RTE
R A
CA
DEM
YE
DIS
ON
PU
BLI
C S
CH
OO
L A
CAD
EM
YYM
CA
SE
RV
ICE
LE
ARN
ING
AC
ADE
MY
DE
TRO
IT M
ERIT
CH
AR
TER
AC
AD
EMY
CO
UN
TRYS
IDE
ACAD
EM
YN
OR
TH S
AG
INA
W C
HA
RTE
R A
CAD
EMY
NAT
AKI
TAL
IBA
H S
CH
OO
LHO
USE
OF
DE
TRO
ARBO
R A
CA
DE
MY
HA
MTR
AM
CK
AC
AD
EMY
THE
DA
VIN
CI I
NS
TITU
TEP
AN
SOPH
IA A
CA
DE
MY
PLYM
OU
TH E
DU
CA
TIO
NA
L C
ENTE
RR
EN
AIS
SAN
CE
PU
BLI
C S
CH
OO
L A
CA
DEM
YW
EST
MI A
CA
DE
MY
OF
EN
VIR
ON
ME
NTA
L SC
NE
W B
RAN
CH
ES S
CH
OO
LST
. CLA
IR C
OU
NTY
LE
ARN
ING
AC
AD
EM
YC
ON
CO
RD
AC
AD
EM
Y: A
NTR
IMW
ALT
ON
CH
ARTE
R A
CA
DE
MY
VIS
TA C
HA
RTE
R A
CA
DE
MY
RID
GE
PA
RK
CH
AR
TER
AC
AD
EMY
INTE
RN
ATIO
NAL
AC
AD
EMY
OF
FLIN
TBU
RTO
N G
LEN
CH
AR
TER
AC
AD
EM
YC
OLE
AC
AD
EM
YM
ARV
IN L
. WIN
AN
S A
CA
DEM
Y O
F P
ERFO
RM
CR
EAT
IVE
LEA
RN
ING
AC
ADE
MY
OF
SCIE
NC
WIL
LIA
M C
. ABN
EY
AC
ADEM
YE
DIS
ON
-OAK
LAN
D P
UB
LIC
SC
HO
OL
STA
R IN
TER
NA
TIO
NA
L AC
AD
EM
YIN
TER
NA
TIO
NA
L A
CAD
EMY
OF
SAG
INAW
DO
VE
AC
ADE
MY
OF
DE
TRO
ITU
NIV
ER
SIT
Y P
RE
PAR
ATO
RY
ACAD
EM
YA
CA
DEM
Y O
F S
OU
THFI
ELD
ACA
DE
MY
OF
FLIN
TD
ETR
OIT
PR
EMIE
R A
CA
DE
MY
WO
OD
MO
NT
ACAD
EM
YN
SO
RO
MA
INST
ITU
TEC
ENTR
AL A
CA
DEM
YD
ISC
OV
ERY
ELE
MEN
TAR
Y S
CH
OO
LD
ETR
OIT
AC
AD
EMY
OF
AR
TS A
ND
SC
IEN
CE
GR
EAT
OA
KS A
CAD
EM
YG
RA
ND
BLA
NC
AC
AD
EMY
WA
RR
EN
DA
LE C
HAR
TER
AC
AD
EM
YAD
VAN
CED
TE
CH
NO
LOG
Y A
CA
DE
MY
LIN
DE
N C
HA
RTE
R A
CAD
EM
YG
EO
RG
E C
RO
CK
ETT
AC
ADEM
YE
L-H
AJJ
MAL
IK E
L-S
HAB
AZZ
AC
ADE
MY
CO
MM
ON
WE
ALT
H C
OM
MU
NIT
Y D
EVE
L.M
US
KEG
ON
TE
CH
NIC
AL A
CA
DE
MY
NE
W B
EGIN
NIN
GS
AC
AD
EM
Y
ELA % Proficient Free and Reduced Lunch %
Figure 33: PSAs Serving Over 50% Poor Students and Achieving Over 60% 3-8 Math Proficiency
0.0%
20.0%
40.0%
60.0%
80.0%
100.0%
INTE
RN
ATI
ON
AL
AC
AD
EM
Y O
F S
AG
INA
WM
.L. K
ING
JR
. ED
UC
ATI
ON
CE
NTE
RS
AG
INA
W P
RE
PA
RA
TOR
Y A
CA
DE
MY
UN
IVE
RS
AL
LEA
RN
ING
AC
AD
EM
YV
AN
DE
RB
ILT
CH
AR
TER
AC
AD
EM
YY
MC
A S
ER
VIC
E L
EA
RN
ING
AC
AD
EM
YE
DIS
ON
PU
BLI
C S
CH
OO
L A
CA
DE
MY
NE
W B
RA
NC
HE
S S
CH
OO
LW
ILLI
AM
C. A
BN
EY
AC
AD
EM
YD
OV
E A
CA
DE
MY
OF
DE
TRO
ITIN
TER
NA
TIO
NA
L A
CA
DE
MY
OF
FLIN
TD
ETR
OIT
ME
RIT
CH
AR
TER
AC
AD
EM
YA
RB
OR
AC
AD
EM
YP
LYM
OU
TH E
DU
CA
TIO
NA
L C
EN
TER
RE
NA
ISS
AN
CE
PU
BLI
C S
CH
OO
L A
CA
DE
MY
PA
NS
OP
HIA
AC
AD
EM
YA
CA
DE
MY
OF
SO
UTH
FIE
LDB
ING
HA
M A
CA
DE
MY
NO
RTH
SA
GIN
AW
CH
AR
TER
AC
AD
EM
YR
IDG
E P
AR
K C
HA
RTE
R A
CA
DE
MY
GR
AN
D R
AP
IDS
CH
ILD
DIS
CO
VE
RY
CE
NTE
RS
TAR
INTE
RN
ATI
ON
AL
AC
AD
EM
YC
OU
NTR
YS
IDE
AC
AD
EM
YE
DIS
ON
-OA
KLA
ND
PU
BLI
C S
CH
OO
L A
CA
DE
MC
OLE
AC
AD
EM
YH
AM
TRA
MC
K A
CA
DE
MY
BU
RTO
N G
LEN
CH
AR
TER
AC
AD
EM
YC
EN
TRA
L A
CA
DE
MY
VIS
TA C
HA
RTE
R A
CA
DE
MY
DIS
CO
VE
RY
ELE
ME
NTA
RY
SC
HO
OL
MA
RV
IN L
. WIN
AN
S A
CA
DE
MY
OF
PE
RFO
RM
AC
AD
EM
Y O
F FL
INT
WA
LTO
N C
HA
RTE
R A
CA
DE
MY
EA
STE
RN
WA
SH
TEN
AW
MU
LTIC
ULT
UR
AL
CO
NC
OR
D A
CA
DE
MY
: AN
TRIM
NA
TAK
I TA
LIB
AH
SC
HO
OLH
OU
SE
OF
DE
TRO
RIC
HFI
ELD
PU
BLI
C S
CH
OO
L A
CA
DE
MY
RIV
ER
SID
E A
CA
DE
MY
GR
EA
T O
AK
S A
CA
DE
MY
WO
OD
MO
NT
AC
AD
EM
YC
RE
ATI
VE
LE
AR
NIN
G A
CA
DE
MY
OF
SC
IEN
CLI
ND
EN
CH
AR
TER
AC
AD
EM
YB
AY
CO
UN
TY P
SA
TIM
BE
RLA
ND
AC
AD
EM
YE
L-H
AJJ
MA
LIK
EL-
SH
AB
AZZ
AC
AD
EM
YW
ES
T M
I AC
AD
EM
Y O
F E
NV
IRO
NM
EN
TAL
SC
GR
AN
D B
LAN
C A
CA
DE
MY
THE
DA
VIN
CI I
NS
TITU
TEH
OP
E O
F D
ETR
OIT
AC
AD
EM
YTH
OM
AS
-GIS
T A
CA
DE
MY
MID
-MIC
HIG
AN
LE
AD
ER
SH
IP A
CA
DE
MY
BR
IDG
E A
CA
DE
MY
MU
SK
EG
ON
TE
CH
NIC
AL
AC
AD
EM
YA
DV
AN
CE
D T
EC
HN
OLO
GY
AC
AD
EM
YC
EN
TER
FO
R L
ITE
RA
CY
AN
D C
RE
ATI
VIT
YV
ICTO
RY
AC
AD
EM
Y C
HA
RTE
R S
CH
OO
LD
ETR
OIT
AC
AD
EM
Y O
F A
RTS
AN
D S
CIE
NC
EA
CA
DE
MY
OF
WE
STL
AN
DA
CA
DE
MY
FO
R B
US
INE
SS
AN
D T
EC
HN
OLO
GY
Math % Proficient Free and Reduced Lunch %

24 2008 PSA Report to the Legislature
Of particular interest are the consistent results being delivered by the schools in this category. Of the 27 PSAs in the upper right quadrant in 2006-07, 24 repeated their accomplishment a second time in a row in 2007-08. Eighteen have appeared on the list every year since 2005-06. These schools seem to have developed systematic approaches to consistently reach economically disadvantaged pupils; a growing number of other Michigan PSAs are doing so as well. A number of traditional school districts are also delivering promising results with high-poverty student populations. However, since the scope of this report is limited to Michigan’s PSA population, the Department’s research and discussion is focused on this group only. The Office of School Improvement is in the process of conducting research into the achievements of traditional school districts in this area and will issue its findings in 2009. To further explore the strategies being used in the “beating the odds” PSAs, MDE contacted all 52 charter schools in this category to request additional information about the programmatic and instructional approaches they have adopted. The Department also sought to identify any commonalities or extrinsic factors that may be impacting the schools’ success in this regard. Through a comprehensive review of school data and records, survey results, staff interviews and site visits, a clearer picture of what is working in these schools has begun to emerge. This information is included in Appendix B of this report.

25 2008 PSA Report to the Legislature
Michigan “Beating the Odds” PSAs
Each of the PSAs listed below has one or more buildings with student populations that are achieving over 60% proficiency with more than half free/reduced lunch populations. A similar list of traditional school districts in this category will be issued during 2009.
Public School Academy Authorizer Date Opened service provider (2007-08)
El-Hajj Malik El-Shabazz Academy CMU 09/05/1995 Self-Managed Saginaw Preparatory Academy SVSU 09/15/1997 Leona Group William C. Abney Academy GVSU 08/01/1998 Leona Group Star International Academy OU 08/24/1998 Hamadeh Educational Services Academy Of Flint CMU 09/01/1999 Varner & Associates Hamtramck Academy Bay Mills 09/08/2003 National Heritage Academies Central Academy CMU 08/26/1996 Global Educational Excellence Detroit Merit Charter Academy GVSU 10/10/2002 National Heritage Academies Marvin L. Winans Academy SVSU 06/02/1997 Solid Rock Pansophia Academy CMU 09/05/1995 Helicon Associates Plymouth Educational Center CMU 09/05/1995 Self-Managed Vista Charter Academy Bay Mills 09/03/1996 National Heritage Academies Advanced Technology Academy LSSU 09/01/2000 Technical Academy Group International Academy Of Flint CMU 09/01/1999 Flint Education Management Edison-Oakland PSA EMU 09/01/1999 Edison Schools International Academy Of Saginaw Bay Mills 09/04/2007 Cincinnati Education Management(Sabis) Countryside Academy CMU 05/30/1997 Self-Managed Walton Charter Academy NMU 09/01/1999 National Heritage Academies Academy Of Southfield CMU 09/25/1995 Charter School Administration Services M.L. King Jr. Education Center Detroit Public Schools 10/01/1995 Self-Managed Muskegon Technical Academy GVSU 09/01/2001 Orbis Management Group Creative Learning Academy SVSU 08/19/1996 Choice Schools Associates North Saginaw Charter Academy CMU 09/01/1999 National Heritage Academies The Da Vinci Institute CMU 08/28/1995 Self-Managed Concord Academy: Antrim LSSU 08/05/1998 Lakeshore Educational Management, Inc. Burton Glen Charter Academy NMU 09/01/1999 National Heritage Academies Bingham Academy Bay Mills 09/07/2004 Mosaica Education YMCA Service Learning Academy LSSU 09/01/1999 Self-Managed Detroit Academy Of Arts And Science OU 09/02/1997 Self-Managed Linden Charter Academy CMU 09/01/1999 National Heritage Academies Ridge Park Charter Academy LSSU 09/18/1998 National Heritage Academies Vanderbilt Charter Academy GVSU 12/02/1996 National Heritage Academies Discovery Elementary School GVSU 09/03/1996 Self-Managed New Branches School CMU 08/29/1995 Self-Managed Cole Academy CMU 08/28/1995 Self-Managed Dove Academy Of Detroit OU 08/25/1997 Schoolhouse Services & Staffing Woodmont Academy Bay Mills 09/08/2004 Imagine Schools Edison Public School Academy OU 09/18/1998 Self-Managed Great Oaks Academy Bay Mills 08/30/2004 National Heritage Academies Grand Blanc Academy EMU 09/01/1999 Mosaica Education Nataki Talibah Schoolhouse Of Detroit CMU 09/05/1995 Nataki Talibah Schoolhouse Renaissance Public School Academy CMU 08/12/1996 Imagine Schools West MI Academy Of Environmental Science CMU 08/28/1995 Choice Schools Associates Arbor Academy GVSU 08/01/1998 Foundation For Behavioral Resources

26 2008 PSA Report to the Legislature
“Adequate Yearly Progress” is defined by the federal No Child Left Behind Act as demonstrating that a school is on track to meet state proficiency standards by 2013-14. Figure 34 shows the percentage of PSAs, host districts, and traditional public schools that made AYP in 2007-08. Charter schools made AYP at a higher rate than host districts. The gap between PSAs and traditional public schools closed by six percentage points over the 2006-07 school year. This reflects an improvement of almost 4% on the part of PSAs and a decline of just over 2% on the part of traditional public schools. If a school does not make AYP for two consecutive years, it is designated by NCLB as needing improvement. Michigan designates these schools “high priority.” If they qualify for Title I funds, they become eligible for additional technical support. If a school continues to not make AYP, its improvement status moves to the next level. As a school moves to each new level, it becomes subject to more stringent requirements and more intensive interventions.
Schools which cannot provide sufficient data on student success are placed in AYP advisory status.
Figure 35 shows that PSAs again perform better than host districts, having more schools “Not Identified for Improvement” than host districts, while traditional public schools statewide performed better still. No charter schools were in Phase 6 or above, but seven were in Phase 4 and two in Phase 5.
To make AYP, schools must meet the following requirements: 1) Attendance rate (elementary and
middle schools) or graduation rate (high schools) must be at a minimum of 80% for all students and subgroups.
2) Participation rate (the percentage of students who are tested using MEAP or MME) must be at a minimum of 95%.
3) The school must meet established proficiency targets in ELA and mathematics for all students. The school can also meet this requirement by reaching “safe harbor,” which is accomplished by reducing the previous year’s percentage of students identified as “not proficient” by 10% in each subgroup.
Report Cards/Adequate Yearly Progress
Figure 34: 2007-08 Schools Making Adequate Yearly Progress
75.8%65.1%
80.1%
24.2%34.9%
19.9%
0%
10%
20%
30%
40%
50%
60%
70%
80%
90%
100%
PSAs Host Districts All Traditional Public Schools
Made AYP Did Not Make AYP

27 2008 PSA Report to the Legislature
The percentage of PSAs in Phases 4 and 5 was roughly comparable to traditional public schools, and lower than host districts. Authorizer efforts at intervention and technical support for PSAs in NCLB sanction phases have so far resulted either in turn-around or in school closure before that point.
Education YES! School Report Card Grades Public Act 25 of 1990 requires that all Michigan public schools receive a report card annually. Currently, that report card is called Education YES!. Schools’ Education YES! reports are published electronically on the MDE website, where they are accessible to parents and students. A number of factors are weighted to calculate each school’s composite grade. About two-thirds of a school’s composite grade is based on achievement scores: ELA and mathematics for elementary schools; and ELA, mathematics, science, and social studies for middle and high schools. Schools complete a self-assessment of 40 performance indicators developed from Michigan’s Comprehensive School Improvement Framework. These indicators include Teaching for Learning, Leadership, Personnel and Professional Learning, School and Community Relations, and Data and Information Management.
Figure 35: 2007-08 NCLB Phases of Improvement
0%
10%
20%
30%
40%
50%
60%
70%
80%
90%
100%
PSAs Host Districts All Traditional Public Schools
No Sanction Phase 1 Phase 2 Phase 3 Phase 4 Phase 5 Phase 6 Phase 7 Phase 8
Figure 36: 2007-08 Education Yes! Report Card Grades
16.2% 16.1%
42.4%
29.8% 26.2%
30.0%31.7%
30.9%
10.6%9.4% 17.4%
4.9%
12.8% 8.2% 11.9%
0.0% 1.1% 0.2%
0%
10%
20%
30%
40%
50%
60%
70%
80%
90%
100%
PSAs Host Districts All Traditional Public Schools
A B C D-Alert No Grade Unaccredited

28 2008 PSA Report to the Legislature
Figure 36 compares 2007-08 Education YES! report cards for PSAs, host districts, and all traditional public schools. Charter schools received slightly more A and B grades than host districts, but fewer than traditional public schools. Attendance, Graduation and Dropout Rates Both federal NCLB criteria and the state law that mandates this annual report to the Legislature specify that attendance and graduation rates should be tracked. Figure 37 provides an analysis of attendance rates for charter schools compared to that of host schools and non-charter public schools for 2007-08. Each district (PSA or traditional public school) was identified within one of four groups:
1. Schools with an attendance rate below 70%. 2. Schools with an attendance rate between 70%-80%. 3. Schools with an attendance rate between 80%-90%. 4. Schools with an attendance rate above 90%.
The schools in each group were counted to calculate percentages. They are not weighted by student count. In 2007-08, PSAs experienced higher attendance rates than did host districts, but PSAs had a lower attendance rate than traditional public schools. Buildings with graduation rates were separated into four groups: those with graduation rates less than 70%; those with graduation rates between 70% and 80%, those with graduation rates between 80% and 90%; and those with graduation rates above 90%.
Figure 37: 2007-2008 Attendance Rates
0.798
0.669
0.892
0.163
0.248
0.0760.0520.031 0.020.015
0.023
0.013
0%
20%
40%
60%
80%
100%
PSAs Host Districts Non-PSAs
>=90.0% 80.0 - 89.9% 70.0 - 79.9% <70.0%
All Traditional Public Schools

29 2008 PSA Report to the Legislature
In the 2007-08 school year, PSAs and host districts both experienced lower graduation rates than traditional public schools. PSAs had higher graduation rates than host districts.
School dropout rates were separated into five
groups: those with dropout rates less than 10%; those with dropout rates between 10% and 20%, those with dropout rates between 20% and 30%; those with dropout rates between 30% and 40%; and those with dropout rates above 40%. As Figure 39 shows, PSAs experienced mixed results in this area during 2007-08.
Figure 38: 2007 On-Time Four-Year Cohort Graduation Rates
13.2% 15.2%
45.9%
31.6%
14.1%
24.2%
7.9%
17.2%
7.5%47.4%
53.5%
22.4%
0%
20%
40%
60%
80%
100%
PSAs Host Districts Non-PSAs
>90.0% 80.0 - 89.9% 70.0 - 79.9% <70.0%
All Traditional Public Schools
Figure 39: 2007 4-Year Cohort Dropout Rates
25.0%15.0%
56.6%
19.7%
25.0%
31.7%
15.8%
40.0%
7.9%
11.8%
15.0%27.6%
5.0%2.7%
1.2%
0%
10%
20%
30%
40%
50%
60%
70%
80%
90%
100%
PSAs Host Districts All Traditional Public Schools
<10% 10.0 - 19.9% 20.0 - 29.9% 30.0 - 39.9% >40.0%

30 2008 PSA Report to the Legislature
Comparisons of financial information are more useful among PSAs than they are between PSAs and other public schools, since PSA revenue and expenses differ from traditional public schools in several ways which make comparisons difficult: 1. Foundation allowance to PSAs are tied to geographic districts, but capped. 2. Since PSAs lack taxing authority to raise funds for capital investments, they finance
facilities from operating funds. 3. Competitive start-up grants are available to PSAs in their first three years of operation. 4. PSAs often offer fewer optional services than traditional districts (e.g., transportation,
meals, nurses, counselors). 5. PSAs that contract with a service provider to hire staff are prohibited from participating
in the Michigan Public School Employees Retirement System and instead fund alternative retirement plans.
The following charts compare PSAs to both host districts and traditional public schools wherever feasible, but these differences in underlying systems should be kept in mind when reviewing information. Revenues Figure 40 compares revenue sources for PSAs with all traditional public schools and with host districts. Both PSAs and traditional public schools receive state-funded foundation grants; PSA foundation grants are tied to the local traditional school district in which they were originally located, but were capped at $7,385 during 2006-07, the most recent year for which data are available. The chart shows weighted averages for each type of school. Each PSA and traditional school district’s foundation grant is multiplied by the number of students to which it applies; the sum is then divided by the total number of pupils involved. The PSA average is $519 below the host districts’ weighted average and $126 below the traditional public school districts’ weighted average.
PSA Financial Performance
Figure 40: 2006-2007 Average Per Pupil Funding Sources
$671
$815
$7,301$7,820
$7,427
$2,101
$2,689
$1,695
$0
$0
$2,000
$4,000
$6,000
$8,000
$10,000
$12,000
PSAs Host Districts All Traditional Public Schools
Debt RevenueAdditional SourcesFoundation Allowance

31 2008 PSA Report to the Legislature
PSAs, like traditional public school districts, are eligible for additional “categorical” and competitive federal, local, and state funds. These funds are for designated purposes such as supporting state at-risk, special needs, early childhood, and bilingual students. Per pupil averages, again weighted by the number of students in each school, are shown, along with host and traditional public school district tax revenue, which these districts can borrow against to finance facilities. In 2006-07, with an average of $9,402 per-pupil revenues, the PSA average is below traditional public schools by $535/pupil, and below host districts by $1,778. Figure 41 shows total state aid to each of the three categories of schools year by year since 2002-03. Fiscal Stability Michigan’s charter school statute requires PSAs to maintain (and directs MDE to report on) “fiscal stability.” While school districts traditionally use fund balance as a proxy for stability, that number is less meaningful for PSAs since substantial startup expenses during the first few years of a PSA’s existence distort those numbers, and since some PSA boards’ contracts with their service providers espouse alternative approaches to fiscal stability that do not rely on fund balance reserves. For instance, boards that hire National Heritage Academies to manage their schools receive a commitment that in exchange for retaining any surpluses (thus reducing fund balances to zero), the management company will absorb any deficits, including startup expenses. On the other hand, boards that decide to own their facility often spend several years amassing larger than traditional fund balances in preparation for construction or purchase. Yet other PSA boards are philosophically committed to not accumulating fund balances, since PSAs’ leaner allowance of per pupil operating funds demands that every available dollar be spent during the year in which it becomes available.
Figure 41: 2006-07 State Aid to Michigan Schools
$0
$2,000
$4,000
$6,000
$8,000
$10,000
$12,000
$14,000
$16,000
2002-2003 2003-2004 2004-2005 2005-2006 2006-2007 2007-2008
In M
illio
ns
PSAs Host Districts All Traditional Public Schools

32 2008 PSA Report to the Legislature
These are some of the reasons PSA fund balances tend to be lower on average than traditional public school districts’ fund balances, at about 5% rather than the 11-15% typically held by traditional public schools (Figure 42). PSAs generally approach more traditional fund balances as they age, as Figure 43 shows for the 144 PSAs over six years old.
Figure 42: 2006-2007 Ratio of PSA Fund Balances to Current Operating Expenditures
2
69
26 25
17
25
10 11
63
1
6 5
11
0
10
20
30
40
50
60
70
80
Neg ‐0%
0‐5% 6‐10% 11‐15% 16‐20% 21‐25% 26‐30% 31‐35% 36‐40% 41‐45% 46‐50% 51‐55% 56‐60% 61+%
Figure 43: 2006-07 Average Fund Balance Ratio by Age of PSA
58.6
%
13.1
% 20.8
%
0.0%
25.0%
50.0%
75.0%
100.0%
PSAs (5) Less Than 3 Years Old PSAs (44) 3 to 6 Years Old PSAs (165) Greater than 6years old

33 2008 PSA Report to the Legislature
Figure 44, showing each school’s fund balance, is a much-reduced version of information that MDE makes available to PSA boards so they can compare their own school to other PSAs in Michigan. Because PSAs face similar financial challenges and conditions, this intra-group comparison can be more helpful to boards than inter-group comparisons with host districts and traditional public schools, providing a basis for productive self-evaluation and for conversation with service providers. Expenses Comparisons of the percentage of current operating expenses devoted to instruction at PSAs and traditional public schools must consider facility lease and purchase costs that come out of PSA operating expenses. Conversely, most traditional public schools incur expenses for services that many PSAs do not provide, such as transportation, meals, athletics, and co-curricular activities. In addition, PSAs also serve fewer students with special needs. For these reasons, direct comparisons must be made cautiously.
Expenditure Categories: • Instruction - including
special education classroom services
• Instructional Support -Support Services, such as speech therapy, counselors, library services, and nurses
• Administrative Support -Support Services, including business operations, facility operations and maintenance
Figure 44: 2006-07 Range of PSA Fund Balances
($500,000)
$0
$500,000
$1,000,000
$1,500,000
$2,000,000
$2,500,000
$3,000,000
$3,500,000
$4,000,000
$4,500,000
$5,000,000
$5,500,000
$6,000,000
$6,500,000
$7,000,000
$7,500,000
$8,000,000
$8,500,000
$9,000,000
$9,500,000
$10,000,000

34 2008 PSA Report to the Legislature
Figure 45 shows that PSAs spend a lower percentage of operating expenses on instruction. Figure 46 is another chart MDE makes available to charter school governance boards to allow each board to see how its use of funds compares with other PSAs; this information can be used as a basis for conversations with service providers and school administrators. This chart is included here to illustrate the wide range in the percentage of operating funds dedicated to instruction among PSAs.
Figure 46: 2006-07 Range of PSA Percentages of Instruction/Operating Expense
$0
$2,000
$4,000
$6,000
$8,000
$10,000
$12,000
$14,000
$16,000
$18,000
$20,000 Per Pupil Other Expenditures
Per Pupil Instructional Support Expenditures
Per Pupil Instruction Expenditures
Figure 45: 2006-07 Percentage of Operating Expenses Spent on Instruction
61.3%57.6%
47.4%
0.0%
10.0%
20.0%
30.0%
40.0%
50.0%
60.0%
70.0%
PSAs Host Districts All Traditional Public Schools

35 2008 PSA Report to the Legislature
Teachers’ Salaries in Public School Academies Salaries for PSAs’ teachers in 2006-07 averaged $39,334, $16,192 less than Michigan’s average salary of $55,526 statewide. Other data suggests that one contributing factor for the discrepancy is that teachers in PSAs are relatively new, rather than veteran, teachers. Figure 47 shows the distribution of salaries at all 232 PSAs.
Figure 47: 2006-2007 Range of PSA Average Teacher Salaries
Statewide Average, $55,526
PSA Average, $39,334
$0
$10,000
$20,000
$30,000
$40,000
$50,000
$60,000
$70,000
$80,000
Service Providers As mentioned previously, PSA boards in Michigan are permitted by statute to contract with service providers (also known as management companies) to purchase services involved in running their schools. A majority of Michigan PSA boards have opted to hire a service provider for portions of their work. These contracts range from facility management to staff and personnel management, accounting and payroll, curriculum development, and professional learning services for administrators and/or teachers. As described on page 13 of this report, some service providers offer a full range of day-to-day management and support, while others provide perform only one or two specific functions on behalf of a school. The 53 service providers contracted by Michigan PSAs were presented in Figure 18 on page 13 of this report. A number of questions about these service providers and how they spend their funds have been raised, with some interest in increased accountability and transparency.

36 2008 PSA Report to the Legislature
Many aspects of service provider spending are already reported through their schools’ data submissions to the state. Michigan’s Center for Educational Performance and Information (CEPI) maintains academic, personnel and financial information about each of the service provider-managed schools, just as it does for all other schools. Review of this information presents some initial expenditure and teacher salary data. More research is needed to determine what other findings can be gleaned through a careful analysis of information that has already been reported and made publicly available. Figure 48 displays instructional percentages reported by all schools that hired the same service provider to illustrate the wide range of expense patterns in place.
Figure 49 on the next page displays teacher salaries, sorted into clusters of PSAs whose boards have hired the same service provider. Again, an expanded version of these charts ranks individual PSAs and allows each PSA board to see where it fits in the range of Michigan charter schools. MDE is working to make this information available to PSA board members as a tool for their deliberations as they choose whether to hire a service provider to manage part or all of their operations.
Figure 48: 2007-2008 Instruction as a Percent of Expenses for PSAs Using the Same Service Provider
0%
20%
40%
60%
80%
100%
Lake
view
Pub
lic S
choo
ls (1
)N
orth
star
Edu
catio
nal (
2)P
rofe
ssio
nal C
ontra
ct M
gmt.
(1)
Adva
nce
Edu
catio
nal S
ervi
ces
(4)
Edu
catio
n A
ssoc
iate
s (1
)C
hatfi
eld
Man
agem
ent F
ound
atio
n (1
)La
kesh
ore
Edu
catio
nal M
anag
emen
t, In
c. (1
)W
oodb
ridge
Gro
up, I
nc. (
2)O
rbis
Man
agem
ent G
roup
(1)
Sum
mit
Man
agem
ent C
onsu
lting
(1)
Eva
ns S
olut
ion
Man
agem
ent C
ompa
ny (2
)N
ew U
rban
Lea
rnin
g (1
)S
mar
t Sch
ools
Man
agem
ent (
1)R
omin
e G
roup
(5)
Sel
ect M
anag
emen
t, In
c. (1
)Se
lf-m
anag
ed (5
1)M
idla
nd C
harte
r Ini
tiativ
e (1
)N
atak
i Tal
ibah
Sch
oolh
ouse
(1)
Imag
ine
Scho
ols
(5)
SEA
IV, I
nc. (
1)C
harte
r Sch
ool S
ervi
ces
of M
ichi
gan
(1)
Eigh
tCA
P, In
c (1
)B
lack
Sta
r Edu
catio
nal M
anag
emen
t (1)
Syne
rgy
Trai
ning
Sol
utio
ns, I
nc (2
)C
hoic
e Sc
hool
s A
ssoc
iate
s (8
)G
loba
l Edu
catio
nal E
xcel
lenc
e (5
)Fo
unda
tion
for B
ehav
iora
l Res
ourc
es (2
)Ba
rdw
ell G
roup
(2)
Van
guar
d Ed
ucat
ion
Dev
elop
men
t Con
sorti
um, L
LCEd
ucat
ion
& T
rain
ing
Con
nect
ions
(2)
Flin
t Edu
catio
n M
anag
emen
t (1)
C.S
. Par
tner
s (7
)S
olid
Roc
k (1
)Sc
hool
hous
e Se
rvic
es &
Sta
ffing
(3)
Hel
icon
Ass
ocia
tes
(9)
Tech
nica
l Aca
dem
y G
roup
(1)
Var
ner &
Ass
ocia
tes
(3)
SVR
C In
dust
ries
(2)
Mos
aica
Edu
catio
n (1
1)H
amad
eh E
duca
tiona
l Ser
vice
s (3
)M
idw
est M
anag
emen
t Gro
up In
c. (1
)Ed
ison
Sch
ools
(2)
777
Man
agem
ent C
ompa
ny (1
)N
atio
nal H
erita
ge A
cade
mie
s (3
4)Le
ona
Gro
up (1
5)C
harte
r Sch
ool A
dmin
istra
tion
Serv
ices
(10)
Inno
vativ
e Te
achi
ng S
olut
ions
(1)
Amer
ican
Inst
itutio
nal
Man
agem
ent S
ervi
ces
(1)
Edu
catio
n M
anag
emen
t & N
etw
orks
(EM
ANS
) (1)
Whi
te H
at M
anag
emen
t (5)
Tran
sitio
ns C
onsu
ltant
s, L
LC (1
)
% Other% Inst Support% Instruction

37 2008 PSA Report to the Legislature
Figure 49: 2006-2007 Average Teacher Salaries for PSAs Using the Same Service Provider
$70,
437
$47,
571
$45,
605
$45,
596
$45,
057
$43,
002
$42,
421
$40,
629
$40,
183
$40,
088
$39,
853
$39,
564
$39,
358
$38,
212
$37,
767
$36,
910
$36,
600
$35,
346
$34,
619
$34,
594
$34,
446
$34,
417
$30,
166
$23,
390
$40,
810
$37,
872
$0
$10,000
$20,000
$30,000
$40,000
$50,000
$60,000
$70,000E
vans
Sol
utio
n M
anag
emen
t Com
pany
(2)
Edu
catio
n &
Trai
ning
Con
nect
ions
(2)
Nor
thst
ar E
duca
tiona
l (2)
Ham
adeh
Edu
catio
nal S
ervi
ces
(3)
Glo
bal E
duca
tiona
l Exc
elle
nce
(5)
Sch
oolh
ouse
Ser
vice
s &
Sta
ffing
(3)
Adva
nce
Educ
atio
nal S
ervi
ces
(4)
Sel
f-man
aged
(44)
Edi
son
Sch
ools
(2)
Leon
a G
roup
(15)
Nat
iona
l Her
itage
Aca
dem
ies
(34)
Bard
wel
l Gro
up (2
)
Syn
ergy
Tra
inin
g S
olut
ions
, Inc
(2)
Cha
rter S
choo
l Adm
inis
tratio
n Se
rvic
es (9
)
Whi
te H
at M
anag
emen
t (5)
Sin
gle
Clie
nt (2
5)
Rom
ine
Gro
up (5
)
SVR
C In
dust
ries
(2)
Varn
er &
Ass
ocia
tes
(3)
Imag
ine
Scho
ols
(5)
Mos
aica
Edu
catio
n (1
1)
Hel
icon
Ass
ocia
tes
(9)
Woo
dbrid
ge G
roup
, Inc
. (2)
C.S
. Par
tner
s (7
)
Cho
ice
Scho
ols
Ass
ocia
tes
(8)
Foun
datio
n fo
r Beh
avio
ral R
esou
rces
(2)
Figure 50 shows a list of the PSAs that had financial deficits in 2007-08. PSA represented six of the 27 Michigan schools in this category. In general, their deficits were smaller than traditional public schools, totaling $231,404 on average compared to the traditional public school average of $7,975,406.
Figure 50: PSAs with Deficits Reported for 2007-08
School Authorizer service provider Balance Hillsdale Preparatory School Hillsdale ISD CS Partners -$6,282.30 Walden Green Montessori Central Michigan University Advance Educational Services -$115,769.00 Victory Academy Charter School Bay Mills Community College Global Educational Excellence -$28,340.00 West Village Academy Central Michigan University Transitions Consultants, LLC -$624,656.15 Discovery Arts & Technology PSA Bay Mills Community College Mosaica Education -$428,269.93
Northpointe Academy Highland Park City Schools Evans Solutions Management Company -$185,109.00
-$1,388,426.38

38 2008 PSA Report to the Legislature
The opportunities and issues described in this report point to a PSA sector that is becoming more mature and fully integrated into Michigan’s educational landscape. While overall performance and quality still need to improve - particularly at the high school level - PSA performance continues to make progress and the current statutory framework is capable of delivering solid results. As a sector, PSAs in Michigan are making strong advancements relative to educating both economically disadvantaged and minority students and generally offer positive alternatives to families seeking a choice. MDE’s recommendations are designed to strengthen the PSA sector still further to ensure greater consistency and quality among all charter schools. The results produced to date indicate a limited need for statutory revisions; the law appears to be working well to support school and student achievement. The following recommendations, therefore, reflect broad policy and practical suggestions that will hold Michigan’s PSA sector to continued high standards of accountability. Recommendations to the Legislature
PSA Location/Facilities Issues As Michigan’s PSA sector has matured, issues have arisen relative to the establishment and relocation of new charter school sites. Some PSAs have moved out of the communities in which they were originally established, raising both practical and policy concerns about how site decisions are made. Members of the SBE also have questions about how the specific characteristics of various PSA projects, such as school location, can change from the time of charter application to the issuance of a charter contract, and how such contracts can be amended and interpreted after their issuance. There is a strong interest in ensuring that such changes are adopted only after careful consideration of their impact on local communities, families and students. The SBE believes that it is necessary and appropriate to develop strong guidelines relative to PSA contractual changes, particularly as they relate to school location and facilities. The Legislature is asked to provide the department charged with overseeing school building approval issues with the authority to promulgate rules that would establish processes and criteria for selecting and developing school locations and sites. MDE Staffing Adequate resources are needed to ensure continued strong monitoring of PSA compliance and performance. Enhanced staffing capacity is also necessary to ensure continued MDE compliance with federal regulations for Charter School Program grant recipients. Additional GF/GP support will allow for appropriate monitoring of charter schools, proactive leadership, and effective administration of the state’s PSA program.
Recommendations

39 2008 PSA Report to the Legislature
An additional allocation of $225,000 would support a 3.0 FTE equivalent staffing enhancement. These three positions would be at the analyst/specialist level and would leverage existing staff relative to all of the following efforts and activities:
PSA support, monitoring and site visits Authorizer dialogue and site visits Grant administration Research projects Other new activities described in this report (see “MDE Action Items” below).
The SBE wishes this item to be considered in the FY 2010 budget. As other issues arise that require legislative clarification, the SBE will bring them forward for dialogue and consideration.
MDE Action Items The following action items will be accomplished at the MDE staff level, to the extent possible. Additional financial resources will help ensure the effective implementation of each recommended action item.
School Accountability Accountability and transparency for all public schools is primary objective for the SBE. MDE staff have been asked to help provide simple, uniform report cards that all schools can provide to students and families. These report cards would compare the performance of a given school to other schools in the geographic region, as well as to statewide averages. The SBE recommends that parental input be sought into the design of these documents. Leadership Resources MDE is working to deepen the connection between the charter and traditional school communities through administrative information sharing and support. This type of information sharing and collaboration may be useful in the development of effective school leadership for all public schools. MDE will establish a task force comprised of groups in both the traditional school district and PSA sectors to determine how to bolster communication among the two sectors and what types of information resources would be most helpful. In particular, the task force will help finalize and distribute a toolkit for traditional public schools that are considering chartering as a potential restructuring alternative for buildings in advanced stages of NCLB sanctions. By the end of this year, MDE will issue materials and resources to help school leaders determine if this is a viable option to pursue. High School Student Achievement High school student achievement among charter schools continues to need improvement. With the relatively new Michigan Merit Curriculum and constantly rising federal accountability requirements, PSAs and traditional public schools alike need to improve their performance as quickly as possible, lest they fall even further behind. Currently, there are 109 PSAs offering some grades of high school; as their secondary capacity continues to grow it is essential to ensure they have the tools and resources they need to succeed.

40 2008 PSA Report to the Legislature
The knowledge gained through a review of the “beating the odds” schools identified in this report may drive school improvement efforts at the secondary level. However, more work is needed to identify strategies for high school success. MDE staff will convene a study group to formulate more specific recommendations relative to improving high school performance. Assurances and Verification For several years, Michigan authorizers have voluntarily participated in a pilot “Assurances and Verification” project in which they demonstrate their systems for complying with the requirements set forth in statute. As described in this report, the outcomes of these reviews have been generally positive. At this time, the Assurances and Verification project needs to move past its pilot stage and develop into a lasting system for ensuring authorizer quality. MDE staff will formally institutionalize Assurances and Verification and explore appropriate ways of expanding the project. For instance, exploring precisely how Michigan authorizers are accomplishing their oversight and support objectives may show how different approaches to this work can enhance school and student achievement. Collaboration between MDE and the Michigan authorizer community has been productive and consistent to date. However, should Michigan’s authorizing community elect not to participate cooperatively in this important MDE initiative, formal criteria may be needed to provide an objective basis for moving forward. In those circumstances, MDE will recommend the Legislature assign to MDE the authority to promulgate rules that establish standards and criteria for authorizer performance. Areas for Future Exploration Service Provider Transparency As mentioned previously, many questions have been raised about service providers (also known as management companies) and how they use their funds. Some interests argue for increased transparency and accountability on the part of service providers, citing legitimate public interest in knowing how much they earn in their work for public schools. Other interests argue that as long as the PSA is performing well, the profit margin for a service provider shouldn’t matter. Still others contend that private firms providing either PSAs or traditional public schools with services and products, such as janitorial or food services, are not expected to report their profit margins and question why service providers should be singled out for public reporting. Fundamental to the issues of accountability and transparency is equity—between PSAs and traditional schools, as well as among private companies working with either or both. No matter the service or product provided by a company, public disclosure may help all preK-12 boards demonstrate the value of their service agreements to the public. Any policies or legislation regarding these issues should provide equitable treatment of all service providers working in preK-12 education, and accurately reflect the relative scope of services being provided. A service provider that exercises greater control over a school’s daily operations, for example, may require a different type of scrutiny than one that is merely providing one or two isolated and discrete services.

41 2008 PSA Report to the Legislature
The SBE will continue to explore and discuss these issues in the coming year, with an eye toward finalizing a policy recommendation for the Legislature’s consideration. Windup and Dissolution Progress is being made on the ongoing issues of windup and dissolution. MDE has worked with authorizers to dissolve the operations of closed charter schools and return all outstanding assets to the state. Authorizers and school leaders are demonstrating their commitment to ensure that closures are handled appropriately. MDE will continue to identify administrative solutions to these issues.
Research Concepts to Pursue In the future, MDE will pursue specific research on topics of interest to the State Board of Education and the Legislature. Subjects under consideration for research include:
• Tracking of student mobility data and patterns among all public schools • Service provider accountability • Student safety in PSAs • How PSAs are addressing the new high school graduation requirements • Post-graduation trends among PSA students

42 2008 PSA Report to the Legislature
Appendix A
Glossary

43 2008 PSA Report to the Legislature
Alternative Education Program Alternative education is a program operated as a subdivision of the regular K-12 program. It is designed for students who can be better served in an alternative delivery system. Alternative education pupils are funded under the K-12 foundation rate. Students served include those who have special needs and are lacking sufficient credit to graduate with their class. Alternative education programs often include expanded services from the regular program such as counseling, childcare, and transportation. Attendance Rate The percentage of total school days that students in a school or district are present in school. Authorizer A public institution identified in Michigan statute as able to issue a contract to organize and operate one or more public school academies. Michigan law recognizes local school districts, intermediate school districts, community colleges, and public universities as authorizers. Adequate Yearly Progress (AYP) The measure specified in the Elementary and Secondary Education Act (ESEA) for use in holding schools and districts responsible for student achievement in English language arts and mathematics. AYP is based on Michigan Educational Assessment Program (MEAP) test results, participation rates in MEAP testing, and attendance or graduation rates. Categorical Funding Support from the state and federal governments that is targeted for particular categories of children or families, special programs and special purposes. This money is granted in addition to school districts' general purpose revenue, and it almost always has restrictions on its use. The Center for Educational Performance and Information (CEPI) Michigan state agency in DMB charged with collecting and reporting data about Michigan's K-12 public schools. Dropout Rate Total number of students who left high school permanently at any time during the four-year cohort period, or whose whereabouts are unknown EducationYES! The state accountability system used in Michigan to determine how well a school is performing based on MEAP results and other school characteristics. Each school is graded on its MEAP achievement and MEAP improvement, as well as 11 other performance indicators, such as engagement, instructional quality and learning opportunities. ELA Acronym for English Language Arts Elementary and Secondary Education Act (ESEA) The principal federal law affecting K-12 education, sometimes referred to a “No Child Left Behind” or “NCLB” during the administration of George W. Bush.
Glossary

44 2008 PSA Report to the Legislature
Foundation Grant State-funded revenues received by schools on a per-pupil basis. The foundation grant is the basic amount allocated by the State to local education agencies and PSAs through the State School Aid Act. PSA foundation grants are tied to the local traditional school district in which they were originally located, but were capped at $7,385 during 2006-07, the most recent year for which data are available. Free/Reduced Price Lunch (FRL) Children whose families have income of 130% or less of the Federal poverty guideline as well as those who receive food stamps or Temporary Assistance for Needy Families (TANF) are eligible for free lunch. Those whose families have incomes from 131% to 185% of the poverty guideline are eligible for reduced-price meals. For purposes of this report, FRL is used as a proxy for economic status. FTE An individual pupil's pro rata share of school membership pursuant to the State School Aid Act. In no case may a pupil generate more than 1.00 FTE. The total number of FTEs in a school is used to determine membership for purposes of awarding state aid. Fund Balance An amount of money retained in a PSA or traditional school district’s general operating fund after all expenditures are made. Grade Level Content Expectations (GLCE) The Michigan framework for grade-by-grade assessments in grades K-8, which offers teachers a guide for their instructional and curricular emphases in classrooms. GLCEs provide greater clarity for what students are expected to know and be able to do by the end of each grade. Graduation Rate In order to comply with The No child left Behind (NCLB) Act of 2001 and, as defined in The Michigan Department (MDE) Consolidated State Application Accountability Workbook, the state of Michigan has moved to an accountability system for high schools in which a graduation rate includes only "on-time" graduates who earn diplomas in four years. This calculation aligns with the guidelines provided by the National Governors Association (NGA) Graduation Counts Compact. The "four-year adjusted cohort graduation rate" is calculated by tracking individual students from the time they were enrolled as first-time ninth-graders, with a four-year expected completion rate. The formula accounts for students who leave school and return later, for students retained in a grade and stay in school, and for students who transferred into and out of the public school system. Thus, this is a more accurate measure of the Graduation rate. Students included in building rates must have been reported to the state for two or more count days. Students included in district rates must have been reported to the state for one or more count days. Host District One of the 20 Michigan school districts that have three or more PSAs within their boundaries. This year’s host districts include: Ann Arbor, Benton Harbor, Dearborn, Detroit, Flint, Grand Rapids, Hamtramck, Highland Park, Holland, Inkster, Jackson, Lansing, Midland, Muskegon, Pontiac, Port Huron, Saginaw, Southfield, Taylor, and Wayne-Westland. For purposes of this report, host districts comprise a subset of “all traditional public schools” reflecting areas where PSAs are in relatively high demand and it is useful to separate out their data for baseline comparisons.

45 2008 PSA Report to the Legislature
High School Content Expectations (HSCE) The Michigan framework for grade-by-grade assessments in grades 9-12, which offers teachers a guide for their instructional and curricular emphases in classrooms. HSCEs provide greater clarity for what students are expected to know and be able to do by the end of each grade. Michigan Educational Assessment Program (MEAP) An annual assessment given to students in grades 3-9 based on Michigan Curriculum Framework. Michigan Merit Examination (MME) The 2007-08 Michigan Merit Examination (MME) assessed students in grade 11 and eligible students in grade 12 based on Michigan high school standards. For 2007-08, it consisted of three components:
• ACT Plus Writing® college entrance examination • WorkKeys® job skills assessments in reading and mathematics • Michigan-developed assessments in science, social studies, and writing
Public School Academy (PSA) A PSA is a state-supported public school, also known as a charter school, authorized pursuant to Part 6A of Michigan’s Revised School Code. According to Section 380.504(4), “A public school academy may include any grade up to grade 12 or any configuration of those grades, including kindergarten and early childhood education, as specified in its contract.” School Report Card A public reporting tool utilized as part of Michigan’s EducationYES! accountability program. Each Michigan school is graded on its MEAP achievement and MEAP improvement, as well as 11 other performance indicators. Service Provider (Management Company) A private organization that contracts with a PSA board to deliver various school staffing and support functions, which may include facility management, personnel management, payroll and accounting, curriculum development, and professional development services for staff and teachers. In some instances, a service provider may be used to manage the entire operations of a school. Strict Discipline Academy A Michigan school chartered under Public Act 23 of 1999 to serve suspended, expelled or incarcerated young people. Traditional Public School An elementary or secondary school in the United States supported by public funds and providing free education for children of a community or district. Urban High School A Michigan school chartered under part 6C of the revised school code to operate within Detroit.

46 2008 PSA Report to the Legislature
Appendix B
“Beating the Odds” Research Findings

47 2008 PSA Report to the Legislature
As described beginning on page 18 of this report, 52 PSAs in Michigan have succeeded in achieving over 50% proficiency with more than half free/reduced lunch populations The general characteristics of the 52 schools vary widely. They are located in urban, suburban, and rural areas all across the state, from Detroit to Alpena to Benton Harbor. They use a variety of grade configurations across PK-12 and have student populations that differ in terms of their relative size and demographic makeup. Their philosophies, programming, and instructional approaches are all unique. Some use the services of an service provider, while others are self-managed. Their instructional spending levels and financial circumstances are dissimilar. A broad array of different authorizers is represented. In short, there are few, if any, external circumstances or structural commonalities to which these schools’ success can be immediately attributed. MDE looked for programmatic commonalities to explain which practices are most directly responsible for the success of these schools. These findings are discussed below. Clear, Consistent Approaches The 52 “beating the odds” schools use different theories and practices to guide their teaching and learning. On the surface, explaining how such dissimilar approaches can deliver comparable levels of student success seems difficult. However, each school has carefully developed an instructional program consistent with the unique needs of its student population. Each school demonstrates a clear understanding of the state’s GLCEs and HSCEs and, through a strategic review of relevant data and other staff, parent and student feedback, the school understands its student population thoroughly. These schools have fully and honestly explored their current needs and realities through a careful review of hard data and then developed programming that is deliberative, highly responsive, and effective at transitioning them along the path toward success. These schools do not question that all students are able to attain mastery of these core skills, given the right tools.
Some representative comments from “beating the odds” schools:
• Kids are kids, some just have a better home life with a greater exposure to knowledge. You have to take them from where they are at when they come to you and build on their strengths and work on their weaknesses. (William C. Abney Academy, Grand Rapids)
• One lesson that stands out above the rest is the importance of teachers gaining an understanding of each individual student’s situation (their story) without allowing that situation to lower their behavioral or academic expectations. Instead, that information should be used to fill in the gaps with resources that may be useful in helping the student obtain expected goals. (Hamtramck Academy, Hamtramck)
• … Every child at Arbor Academy is assessed and a service plan developed for each curriculum area. Our systems provide for day by day tracking of every objective in every academic area for each child. Teachers, administrators, and parents can view and review student progress and the special services plan for each student. Each Monday parents review the weekly progress plan for their child and on Friday a weekly accomplishment report is provided to the parent. (Arbor Academy, Battle Creek)
PSAs “Beating the Odds”

48 2008 PSA Report to the Legislature
As student populations vary among these schools, so do the approaches being used. However, each of these schools ensures that teachers and staff understand where their students are, know where they need to go, and do the hard work of getting them there. Each school MDE interviewed is heavily focused on core skills. While special courses are offered in non-core subject areas, they are not emphasized to the same degree and some schools say they will actually require students to drop special courses temporarily if they are failing to perform well in basic subject areas. Additional time may also be provided through an extended school year or through extended study periods in core areas.
• Proficiency has been increased by allowing extended time for ELA and Math. Extra time allows for remedial work as needed. The emphasis on GLCEs ensures that teachers focus on necessary skills. (Academy of Southfield, Southfield)
• The biggest tool we have implemented was in our shift to a balanced school calendar (some would refer to this as year-round). This has enabled us to reduce the period of time each child is out of the classroom, which helps eliminate learning loss from extended periods absent of instruction. (Ridge Park Academy, Kentwood)
The schools have been very intentional about the speed with which they introduce, implement, and discard changes to their programming. They gather considerable evidence before adopting new programmatic elements and work to integrate such research-based elements carefully into their daily activities. They say they evaluate constantly and carefully adjust as evidence dictates, moving with purpose at all times and never taking their eyes off the ball. These successful schools indicate they are not easily distracted by the latest trends in K-12 education and they do not change approaches rapidly; rather, they provide stability and consistency for staff and students through a series of practices they consider tried and true relative to their school populations. New elements may be added over time, but only after considerable strategic deliberation. Some representative comments from schools:
• We don’t change, not really. While we might tinker around the edges in response to other factors, we know we’re doing the right things and it’s in our students’ best interest for us to stay intent on our goals. (Detroit Service Learning Academy, Detroit)
• At the start of each school year, each teacher gets a playbook of what we are going to be doing and when. We stick to that playbook so that everyone knows what to expect. (Dove Academy, Detroit)
• We have worked carefully to develop highly detailed schedules and plans for how each GLCE is going to be introduced, taught and assessed. We have it down to the exact date, so we can be absolutely certain we stay on track with our students. (Vanderbilt Academy, Holland)
This level of relentless consistency appears to be among the most significant elements of the work going on in these schools. Keeping a constant objective in mind and utilizing stable approaches for addressing that objective not only supports strong organizations, but also provides reliability for stakeholders working with the school. The principles of transparency, reliability, and continuity are important not only for the organization itself, but for populations that may face high levels of financial or other uncertainty. Consistent, fair and long-standing objectives and expectations appear to be very helpful in building trust and supporting parents, staff, and school leaders alike as they work to drive strong performance in their students.
49 2008 PSA Report to the Legislature
Effective Utilization of Data Each of the 52 “beating the odds” schools is using student assessment data in intriguing ways. By developing a clear understanding of how each individual pupil is performing, teachers are able to better structure and differentiate their instructional approaches on an ongoing basis. Successful PSAs are doing diagnostic testing and analysis in September so they can better plan, predict, and address each student’s academic development all year long.
• Data is the foundation of our success. By understanding how our students are doing and by examining our instructional delivery we can be more efficient and effective. Formative assessment has been an effective tool, as it allows us to determine what each student needs in order to meet grade level achievement. [We work to] provide each teacher with a better understanding for what lower and upper level peers are teaching, which enables the teacher to adjust their curriculum so it is in line with what their incoming students already know and what they are expected to know in the next grade. (Detroit Merit Charter Academy, Detroit)
• It’s important to determine the initial learning level for each student – it’s difficult to help them improve without knowing where they are starting from. Many disadvantaged students haven’t been exposed to the same experiences as other children, so we need to fill in the basic gaps…to achieve our current level of success, [we must] continue to have students tested before school starts. This will enable us to place students of similar levels together and provide teachers with info they can use to plan ahead of time. (North Saginaw Charter Academy, Saginaw)
• I have my thumb on student data at all times; that level of knowledge makes all the difference in the world for me and for the entire staff. (International Academy of Flint, Flint)
How this early assessment is conducted varies among schools. In some cases, the PSA authorizer provides leadership and funding for student assessment and data tracking; in others, the schools have developed their own tools. How these schools respond to and utilize their data is similar. Once they have diagnostic assessment results in hand, they combine the scores with staff feedback, parent insights, and all other available information to develop a clear picture of where each student is performing. Teachers and specialists then plan and provide a program of instruction that is designed to help address the unique needs of each pupil. Some of the “beating the odds” PSAs group students together by ability; others schedule special interventions for pupils in need of extra help.
• Detroit Merit Charter Academy groups students based on assessment results and teacher feedback. Pupils are placed into three different groups according to their academic performance and may move among classes as their skill levels change. Teachers encourage students to move to the highest-performing group, while students who are already in the top class may move out to get extra help if necessary. This approach appears to be effective in motivating students while differentiating instruction more readily.
• New Branches Academy in Grand Rapids uses individualized reading and math interventions to provide extra help to children in need of academic support. Assessment data provide diagnostic information that is then used to offer targeted support. The school has a room filled with small individual cubicles, instructional tools, and qualified staff who are prepared to interact with students one-on-one so they can improve their performance more rapidly.

50 2008 PSA Report to the Legislature
This strong emphasis on data is offering schools an ability to have greater certainty about the instructional approaches they use, both on a global and individual basis. Schools are able to evaluate programs quickly and change direction as needed. For teachers, good data can be a powerful tool in planning and differentiating their lessons.
• Assessment results are thoroughly reviewed and shared by all members of the
staff. Action and improvement plans are immediately put in place to ensure that areas of improvement are addressed, the high priority items are reflected upon, and planning is in place to address those areas and meet our students’ needs. Assessment results are disaggregated by our Coordinator of Assessments and administrators and shared with teachers to impact the teaching in the classroom. Professional development is also provided to all instructional staff to ensure their ability to read and understand the assessment results and use them to positively impact teaching and learning. (Star International Academy, Dearborn Heights)
• We do have a strong sense of how our students are doing, and we keep abreast of how other schools in our area are performing, too. It helps us know what our strengths are and where we need to push. (International Academy of Flint, Flint)
In addition, data are also being used to provide merit pay for teachers. At Detroit Merit Charter Academy, for example, a growth model is used to determine how much progress each student made in a given year. The goal for staff is 1.4 years of progress in a single academic year. Most staff members attain this goal and receive financial benefit for their efforts. Without this type of disaggregated data in hand, such performance pay programs would be far more difficult to administer. Leadership When asked what they do to help support their high-poverty populations, school leaders in the “beating the odds” PSAs almost unanimously reply, “Whatever it takes.” The work of assessing, analyzing, and improving student performance cuts across the entire school organization, but requires particular leadership at the classroom level. MDE survey responses from these schools ranked instructional delivery and instructional leadership as the most important factors in their schools’ success with high-poverty students. One administrator told MDE that “the days of closing the door to your classroom and becoming king or queen of your own empire are over.” Teachers in these schools appear to be building strong connections with each other and with their administration to share ideas, discuss areas of concern, and develop solutions as problems arise. Staff members working in the same grade level or subject area meet often (weekly or more) to ensure they are on track with each student’s overall progress. What’s more, teachers often share ideas among grade levels to ensure continuity in the curriculum and bolster instructional success. For example, a seventh grade teacher will receive comments from a colleague working in the eighth grade regarding student performance trends so that the seventh grade program can be strengthened down the road.
• Our Principal and Academic Coordinator monitor all areas of instruction to ensure that the teachers and students are working as a group to bring a quality education to all. Mentoring and peer observation are part of the school culture. Regular grade level meetings are scheduled so teachers discuss their instruction and how it can be tailored to meet students’ individual needs. … During these meetings we look at data, discuss new strategies, talk about our students, and share best practices. As a K-12 building our staff also meet with content level teachers. This not only made the whole staff cohesive and able to work as a team, but also used the very rich resources in every teacher in the school and made them look at each other as experts in different areas. (Central Academy, Ann Arbor)

51 2008 PSA Report to the Legislature
• Our solutions team has provided our economically disadvantaged students with an assembly of educational professionals made up of the leadership team, office of special education, and teaching staff to analyze the situation of each student brought to it. This group provides problem-solving opportunities, resource suggestions, a plan of action as well as the critical follow-up opportunity for each student and parent referred to this body. (Detroit Academy of Arts and Sciences, Detroit)
• I have staff members in my office daily asking questions about how we can help a particular student grasp a concept a little better. Part of my role is to help problem-solve from behind the scenes without getting in the way, and I think the teachers here appreciate having that extra level of support. (International Academy of Saginaw, Saginaw)
Teachers in these schools are accountable to each other as well as to the students they serve. They have a strong ownership in the school’s overall mission and are aware of their role in its future success. Organizationally, this shared leadership and transparency within the classroom are making a difference in how teachers approach their work. They bear a strong sense of responsibility for being the ultimate delivery mechanism for high-quality instruction. Teachers also appear to be empowered to recommend changes and offer suggestions for fine-tuning instructional delivery. Empowerment provides teachers with additional opportunities to respond to student needs and become involved in school leadership.
• Teachers have a structured curriculum – but one that is flexible and not micro-managed. …the staff feels it is very important to incorporate instruction that caters to all of the different learning styles of our children. (Conner Creek Academy East, Roseville)
• Our staff is very active in recommending ideas that will help improve teaching and learning. If one teacher is struggling in a particular area, they have a group of willing colleagues standing by to provide ideas and support. (International Academy of Saginaw, Saginaw)
Teachers in these schools often take on additional leadership responsibilities (e.g., literacy coach, curriculum specialist) to support the overall mission of the school. Even in cases where this has not occurred, teachers in each of these 52 schools volunteer their time outside the school day for extra help, tutoring, and parent outreach in support of their students’ performance objectives.
• Teachers hold after school tutoring for students every day after school to assist them with their academic needs and ensure that continuous support is available. (Star International Academy, Dearborn Heights)
Many of the schools use paraprofessional staff to support their Title I pupils more effectively. This allows for more personalized attention for students in need of extra help and helps build strong staff connections and relationships. As paraprofessional staff members become certified teachers, they are frequently hired by the school to serve in this capacity. Schools say this helps foster staff continuity and ensures new teachers can “hit the ground running” relative to school programming and expectations.

52 2008 PSA Report to the Legislature
Many of the administrators have also taught at the schools they are now leading. They appear to have strong histories with the school and are cognizant of their part in maintaining a strong core vision and strategic approach. Working at Culture The “beating the odds” PSAs emphasize the need for a solid school culture. They describe very deliberate and effective efforts in this area and rank it as the third most significant element in their success with high-poverty pupils. One of the chief indicators of school effectiveness in this regard is the frequency with which staff report, “You can tell the new students when they come in, as it takes them some time to adjust to our expectations and culture. They stick out for a while.” School leaders appear to be weaving disciplinary, social, and academic expectations together to create a school culture that fosters student success.
• All students are truly accepted for who they are, by both staff and fellow students. This translates into a safe and caring environment that students value and defend vigorously. Consequently, the negative variable of economic status is neutralized and even the lowest performing students begin to realize their potential. (Da Vinci Institute, Jackson)
• We have learned that learning requires a safe, secure and nurturing environment. We try to provide a family atmosphere…our school culture is open, accepting, warm, upbeat and achievement focused. Staff are hired to reflect the composition of the student population as closely as possible with respect to race and the language spoken in the home. Next, staff are trained to be sensitive to and respectful of the norms of various groups. (Academy for Business and Technology, Dearborn)
• Administration as well as staff members have been able to establish the culture that we are here for one objective; it is to meet the need of the child. A visit to the school in the early morning while students are coming off the bus or from their parents’ cars would be a very good example to show that students look forward to meeting the staff and administration. When they run out of the car to hug the principal or greet him, it shows that they ARE aware of the caring culture that has been established for them. (Central Academy, Ann Arbor)
• You must understand and accept the culture of the students you are teaching. Building a relationship with each student is important to not only teaching, but also to reaching them. (Vista Charter Academy, Wyoming)
Expectations appear to be very high for students, families, and teachers alike. These schools report that they allow no excuses for low performance; every child can learn given the right tools. Using sound data and clear, consistent approaches, these schools are working to make it happen. By developing a healthy, supportive school culture, they are able to communicate this fact to all stakeholders in their community every day. Addressing Non-Academic Challenges How schools help economically disadvantaged students set aside their personal concerns so that they are ready to begin learning is an enormous area of inquiry. The “beating the odds” PSAs handle this challenge in different ways.

53 2008 PSA Report to the Legislature
Some PSAs believe that they must first address the personal, non-academic concerns of their pupils in a direct, specific way so students are better equipped to learn. These schools provide personal tools to students to give them a strong belief in themselves, help them respond to tough situations outside of school (e.g., homelessness, incarceration of a parent), and drive them to a future that includes postsecondary education.
• We serve high numbers of kids whose fathers are in jail or who may be homeless.
We spend a lot of time trying to help these students deal with these issues so they can be ready to learn. In one recent case, we took a staff collection to help keep a boy and his mother off the streets when they were evicted from a shelter. The students and their parents know us, they trust us, and we work to get involved and help them wherever we can. (William C. Abney Academy, Grand Rapids)
• We have to meet their physical and psychological needs first…Letting students
know they are cared for. [We are] very aware of their background and what they are coming to school with. (Cesar Chavez Academy, Detroit)
• We have learned that “relationships” are key for students who come from poverty and thus place emphasis on creating warm, welcoming, inviting and supportive - while at the same time challenging - relationships with our students and their families. Once the relationship is in place, we can focus on the rigor and relevance that are also critically important. (Waypoint Academy, Muskegon)
Other PSAs recognize their students’ personal challenges but choose not to single them out, believing that a laser-like focus on academics is more appropriate to achieving success. They still focus on physical and psychological needs and give students the tools they need to succeed in school and in life, but their approach is less deliberate.
• We believe in the research that suggests a minimal role for the economic status in students’ achievement. Instead of focusing on this disadvantage, we establish the culture in the school that ALL children will learn; however, we need to work with them based on their individual need regardless where they are economically. We cannot have enough of any programs that can help students in the classroom or one on one. What we would avoid all the time is to keep referring to the students’ economic background or status and FOCUS on meeting their individual needs whatever they are. (Central Academy, Ann Arbor)
• What makes our school successful is that the adults are in charge. Kids get to be kids. It doesn’t matter if you had to get up this morning, dress yourself and your younger siblings, make your own breakfast, find your own way to school – you are a child here. We will care for you and work with you as we work with all our children, to help you learn and grow as you should. We will not treat you any differently because of where you came from, but we will give you the tools all children need to succeed. (Detroit Service Learning Academy, Detroit)
• Our culture of learning is all inclusive of our community members. All students are made to feel their work here is important. They feel safe to question or ask for help when necessary. (Plymouth Educational Center, Detroit)
How a school responds to the non-academic needs of disadvantaged students seems to come back to consistency of approach and a clear understanding of the needs of the student population being served. It is evident that the approach must be unwavering and reliable so that students have a high degree of trust in the school and know what to expect on a daily basis. Inclusiveness, caring, warmth, and positive relationships are all essential to building trust and, ultimately, to achieving academic success.

54 2008 PSA Report to the Legislature
The Challenge of Parent Involvement Achieving high levels of parental involvement is an area of concern for all schools, regardless of the composition of their student bodies. The “beating the odds” PSAs have not completely solved the challenge of parental involvement, but they have made strides. By working to understand the students and families they serve, these schools are using targeted strategies that they know will prove most effective.
• Realizing that for many adults who live in poverty that school was not a ‘safe’ or friendly place for them, first and foremost, we focus our efforts on creating a warm, welcoming, service-oriented environment throughout our building and program. (Waypoint Academy, Muskegon)
• Many parents might choose not to be involved not because they don’t care about their children but simply because they (parents) believe that they don’t have as big of a role to play in their child’s life. They don’t feel qualified to partner with the teacher. Therefore, teachers send a very clear message from the first day that parents’ role is crucial and without their help, the school would not be able to help the child. We make them feel that we need their help as the most knowledgeable about their child, they are the experts who are going to help us lead their child to success. We acknowledge the cultural differences, do a lot of parental education and always celebrate their involvement. (Central Academy, Ann Arbor)
• At the beginning of each year, we host an orientation program for students and parents. During this meeting, we lay out what we expect of them and what they can expect of us. This helps build a level of trust, as well as a positive and structured school climate that gives order to the school day. Students feel secure and can focus all of their attention on learning, while parents have a greater understanding of their role in their child’s academic development. (Vista Charter Academy, Wyoming)
• It is important for us to make sure the strategies we use are appropriate to our population. What good would it do, for example, to use an online newsletter when we have 14 homeless families in our population? We have to make choices that make sense. (William C. Abney Academy, Grand Rapids)
While these schools have developed approaches that allow them to communicate effectively with parents, many acknowledge it is an ongoing challenge. More must be done to help all schools support high levels of parental involvement and, ultimately, student success. Managing Regulatory and Financial Issues The 52 schools that are achieving well with high-poverty populations have the same compliance responsibilities as all public school districts in the state, as well as the financial pressures associated with their capped per-pupil foundation allowance. Managing these issues poses a challenge for these schools; however, they appear to have developed effective strategies for addressing them without losing focus on their primary objectives relative to student achievement. Many of the schools indicate that they receive compliance help from their authorizer in the form of reporting calendars, reminders, and technical support. Those that use the services of an service provider say the management assistance they receive helps them stay focused on student results.
55 2008 PSA Report to the Legislature
When asked what they would change about their financial and regulatory environments, school leaders indicate less paperwork would always be helpful. They do not express a need for more dollars, though they say any future increases or windfalls received would be welcomed and immediately used to offset instructional expenditures.
• We think compliance is necessary for struggling schools. Schools like ours should not be burdened down with meaningless time consuming paperwork that hinders a leader’s time to be in the classroom. (Renaissance Public School Academy, Mount Pleasant)
• Teachers would always choose to focus on students instead of paperwork. (Cesar Chavez Academy, Detroit)
Summary of Findings
In his landmark management book Good to Great, author Jim Collins writes that, “You must maintain unwavering faith that you can and will prevail in the end, regardless of the difficulties, AND at the same time, have the discipline to confront the most brutal facts of your current reality, whatever they might be.” It appears this is what “beating the odds” schools are doing.
Each of the PSAs is gathering data and using staff input to develop as precise a picture as possible of how their pupils are performing and what their academic and personal needs are. Keeping their core objectives in mind, each school develops a plan of action for moving their pupils toward success. While implementing these plans, the schools work to maximize communication and accountability among all parties – students, teachers, and parents – at all times.
This approach appears to be generating positive results among some of Michigan’s most at-risk pupils.

56 2008 PSA Report to the Legislature
Appendix C
PSA Proficiency Comparison By Referent District

57 2008 PSA Report to the Legislature
The following pages summarize PSA performance on statewide MEAP and MME assessments, and compare that performance to the local school district in which the PSA is located (known as the “referent” district). FRL information for each district and PSA is also provided. Referent districts that are highlighted in black are considered host districts for purposes of the data presented in this report.
PSA Proficiency Comparison

District NamePercent
Proficient Proficiency Status % Difference FRL FRL Status % Difference
ALLEGAN COUNTY
FENNVILLE PUBLIC SCHOOLS 69.0 57.0DISCOVERY ELEMENTARY SCHOOL 62.9 Below District 6.1 60.4 Above District 3.4
ALLEGAN PUBLIC SCHOOLS 80.0 42.7OUTLOOK ACADEMY 33.3 Below District 46.7 78.6 Above District 35.9
ALPENA COUNTY
ALPENA PUBLIC SCHOOLS 82.0 45.0BINGHAM ACADEMY 84.3 Above District 2.3 64.3 Above District 19.3
ANTRIM COUNTY
ALBA PUBLIC SCHOOLS 78.6 66.2CONCORD ACADEMY: ANTRIM 71.4 Below District 7.2 64.6 Below District 1.6
ELK RAPIDS SCHOOLS 86.0 26.4WOODLAND SCHOOL 90.9 Above District 4.9 10.5 Below District 15.9
BAY COUNTY
BAY CITY SCHOOL DISTRICT 76.0 46.5BAY COUNTY PSA 59.3 Below District 16.7 66.1 Above District 19.6
Fall 2007 3-8 MEAP ELA Proficiency v. Percent FRL - By School Building
MEAP_ELA Page 1 of 16 4/7/20098:29 AM

District NamePercent
Proficient Proficiency Status % Difference FRL FRL Status % Difference
Fall 2007 3-8 MEAP ELA Proficiency v. Percent FRL - By School Building
BERRIEN COUNTY
BENTON HARBOR AREA SCHOOLS 47.0 93.6COUNTRYSIDE ACADEMY 78.0 Above District 31.0 71.0 Below District 22.6BENTON HARBOR CHARTER SCHOOL 52.7 Above District 5.7 34.4 Below District 59.2MILDRED C. WELLS PREPARATORY ACADEM 29.7 Below District 17.3 99.0 Above District 5.4
BRANCH COUNTY
COLDWATER COMMUNITY SCHOOLS 74.0 47.7PANSOPHIA ACADEMY 72.3 Below District 1.7 75.0 Above District 27.3
CALHOUN COUNTY
LAKEVIEW SCH. DISTRICT (CALHOUN) 80.0 30.7ARBOR ACADEMY 75.4 Below District 4.6 50.0 Above District 19.3
BATTLE CREEK PUBLIC SCHOOLS 65.0 75.9ENDEAVOR CHARTER ACADEMY 80.8 Above District 15.8 46.2 Below District 29.7
MARSHALL PUBLIC SCHOOLS 85.0 19.6MARSHALL ACADEMY 75.9 Below District 9.1 13.6 Below District 6.0
CHARLEVOIX COUNTY
BOYNE FALLS PUBLIC SCHOOL DISTRICT 84.6 43.1CONCORD ACADEMY:BOYNE 88.8 Above District 4.2 3.6 Below District 39.5
CHARLEVOIX PUBLIC SCHOOLS 86.0 32.9NORTHWEST ACADEMY 75.0 Below District 11.0 47.6 Above District 14.7
MEAP_ELA Page 2 of 16 4/7/20098:29 AM

District NamePercent
Proficient Proficiency Status % Difference FRL FRL Status % Difference
Fall 2007 3-8 MEAP ELA Proficiency v. Percent FRL - By School Building
CHIPPEWA COUNTY
SAULT STE. MARIE AREA SCHOOLS 77.0 44.8JOSEPH P. LUMSDEN BAHWETING ANISHNA 78.2 Above District 1.2 44.6 Below District 0.2
BRIMLEY AREA SCHOOLS 84.0 41.5OJIBWE CHARTER SCHOOL 50.0 Below District 34.0 69.3 Above District 27.8
DELTA COUNTY
BARK RIVER-HARRIS SCHOOL DISTRICT 78.0 39.4NAH TAH WAHSH PUBLIC SCHOOL ACADEMY 67.2 Below District 10.8 44.0 Above District 4.6
EATON COUNTY
EATON RAPIDS PUBLIC SCHOOLS 78.0 31.9ISLAND CITY ACADEMY 85.0 Above District 7.0 33.5 Above District 1.6
EMMET COUNTY
PUBLIC SCHOOLS OF PETOSKEY 87.0 28.1CONCORD ACADEMY - PETOSKEY 91.3 Above District 4.3 0.0 Below District 28.1
GENESEE COUNTY
GRAND BLANC COMMUNITY SCHOOLS 88.0 19.5WOODLAND PARK ACADEMY 71.4 Below District 16.6 38.1 Above District 18.6GRAND BLANC ACADEMY 62.0 Below District 26.0 52.3 Above District 32.8
MEAP_ELA Page 3 of 16 4/7/20098:29 AM

District NamePercent
Proficient Proficiency Status % Difference FRL FRL Status % Difference
Fall 2007 3-8 MEAP ELA Proficiency v. Percent FRL - By School Building
FLINT CITY SCHOOL DISTRICT 49.0 75.9NORTHRIDGE ACADEMY 38.7 Below District 10.3 99.1 Above District 23.2INTERNATIONAL ACADEMY OF FLINT 68.7 Above District 19.7 72.1 Below District 3.8CENTER ACADEMY 55.2 Above District 6.2 90.9 Above District 15.0RICHFIELD PUBLIC SCHOOL ACADEMY 59.0 Above District 10.0 75.7 Below District 0.2
WESTWOOD HEIGHTS SCHOOLS 62.0 77.7ACADEMY OF FLINT 65.7 Above District 3.7 86.0 Above District 8.3LINDEN CHARTER ACADEMY 61.5 Below District 0.5 63.9 Below District 13.8
ATHERTON COMMUNITY SCHOOLS 72.0 58.5BURTON GLEN CHARTER ACADEMY 68.3 Below District 3.7 64.6 Above District 6.1
BENDLE PUBLIC SCHOOLS 68.0 39.0MADISON ACADEMY 69.1 Above District 1.1 49.3 Above District 10.3
GLADWIN COUNTY
BEAVERTON RURAL SCHOOLS 76.0 40.2CREATIVE LEARNING ACADEMY OF SCIENC 68.2 Below District 7.8 65.8 Above District 25.6
GRAND TRAVERSE COUNTY
TRAVERSE CITY AREA PUBLIC SCHOOLS 86.0 33.8GRAND TRAVERSE ACADEMY 83.1 Below District 2.9 21.9 Below District 11.9
MEAP_ELA Page 4 of 16 4/7/20098:29 AM

District NamePercent
Proficient Proficiency Status % Difference FRL FRL Status % Difference
Fall 2007 3-8 MEAP ELA Proficiency v. Percent FRL - By School Building
HILLSDALE COUNTY
HILLSDALE COMMUNITY SCHOOLS 75.0 51.2HILLSDALE PREPARATORY SCHOOL 84.2 Above District 9.2 27.0 Below District 24.2WILL CARLETON CHARTER SCHOOL ACADEM 88.4 Above District 13.4 5.6 Below District 45.6
INGHAM COUNTY
LANSING PUBLIC SCHOOL DISTRICT 65.0 68.0COLE ACADEMY 68.3 Above District 3.3 57.2 Below District 10.8EL-HAJJ MALIK EL-SHABAZZ ACADEMY 61.2 Below District 3.8 95.3 Above District 27.3MID-MICHIGAN LEADERSHIP ACADEMY 53.7 Below District 11.3 86.2 Above District 18.2CAPITAL AREA ACADEMY 47.7 Below District 17.3 73.0 Above District 5.0NEW CITY ACADEMY 46.2 Below District 18.8 63.5 Below District 4.5
LESLIE PUBLIC SCHOOLS 74.0 35.3WHITE PINE ACADEMY 63.7 Below District 10.3 15.4 Below District 19.9
WAVERLY COMMUNITY SCHOOLS 74.0 41.2WINDEMERE PARK CHARTER ACADEMY 85.6 Above District 11.6 32.4 Below District 8.8
IOSCO COUNTY
TAWAS AREA SCHOOLS 85.0 46.5SUNRISE EDUCATION CENTER 48.6 Below District 36.4 69.4 Above District 22.9
MEAP_ELA Page 5 of 16 4/7/20098:29 AM

District NamePercent
Proficient Proficiency Status % Difference FRL FRL Status % Difference
Fall 2007 3-8 MEAP ELA Proficiency v. Percent FRL - By School Building
ISABELLA COUNTY
MT. PLEASANT CITY SCHOOL DISTRICT 83.0 7.9RENAISSANCE PUBLIC SCHOOL ACADEMY 72.0 Below District 11.0 50.7 Above District 42.8MOREY CHARTER SCHOOL 67.5 Below District 15.5 47.3 Above District 39.4
JACKSON COUNTY
JACKSON PUBLIC SCHOOLS 61.0 57.7THE DA VINCI INSTITUTE 74.0 Above District 13.0 75.0 Above District 17.3PARAGON CHARTER ACADEMY 81.4 Above District 20.4 45.7 Below District 12.0JACKSON ARTS AND TECHNOLOGY PSA 39.3 Below District 21.7 82.0 Above District 24.3
KALAMAZOO COUNTY
PORTAGE PUBLIC SCHOOLS 90.0 21.0OAKLAND ACADEMY 92.6 Above District 2.6 20.1 Below District 0.9
KALAMAZOO PUBLIC SCHOOL DISTRICT 60.0 65.7KALAMAZOO ADVANTAGE ACADEMY 48.5 Below District 11.5 92.0 Above District 26.3PARAMOUNT CHARTER ACADEMY 88.2 Above District 28.2 22.7 Below District 43.0
MEAP_ELA Page 6 of 16 4/7/20098:29 AM

District NamePercent
Proficient Proficiency Status % Difference FRL FRL Status % Difference
Fall 2007 3-8 MEAP ELA Proficiency v. Percent FRL - By School Building
KENT COUNTY
GRAND RAPIDS PUBLIC SCHOOLS 78.0 83.9NEW BRANCHES SCHOOL 71.6 Below District 6.4 57.6 Below District 26.3WILLIAM C. ABNEY ACADEMY 67.5 Below District 10.5 89.6 Above District 5.7RIDGE PARK CHARTER ACADEMY 69.5 Below District 8.5 63.2 Below District 20.7GRAND RAPIDS CHILD DISCOVERY CENTER 52.9 Below District 25.1 58.6 Below District 25.3
KENOWA HILLS PUBLIC SCHOOLS 80.0 40.2WEST MI ACADEMY OF ENVIRONMENTAL SC 71.7 Below District 8.3 50.4 Above District 10.2WALKER CHARTER ACADEMY 89.6 Above District 9.6 29.3 Below District 10.9
KENTWOOD PUBLIC SCHOOLS 81.0 47.3EXCEL CHARTER ACADEMY 85.1 Above District 4.1 32.5 Below District 14.8
BYRON CENTER PUBLIC SCHOOLS 90.0 20.0BYRON CENTER CHARTER SCHOOL 82.5 Below District 7.5 5.3 Below District 14.7
CALEDONIA COMMUNITY SCHOOLS 92.0 15.0CROSS CREEK CHARTER ACADEMY 91.4 Below District 0.6 22.2 Above District 7.2
GODWIN HEIGHTS PUBLIC SCHOOLS 78.0 74.8VISTA CHARTER ACADEMY 69.5 Below District 8.5 74.0 Below District 0.8
WYOMING PUBLIC SCHOOLS 77.0 60.1VANGUARD CHARTER ACADEMY 88.7 Above District 11.7 37.7 Below District 22.4
BELDING AREA SCHOOL DISTRICT 77.0 51.8GRATTAN ACADEMY 85.0 Above District 8.0 10.0 Below District 41.8THRESHOLD ACADEMY 42.2 Below District 34.8 91.1 Above District 39.3
MEAP_ELA Page 7 of 16 4/7/20098:29 AM

District NamePercent
Proficient Proficiency Status % Difference FRL FRL Status % Difference
Fall 2007 3-8 MEAP ELA Proficiency v. Percent FRL - By School Building
FOREST HILLS PUBLIC SCHOOLS 94.0 7.1KNAPP CHARTER ACADEMY 86.7 Below District 7.3 45.6 Above District 38.5
CEDAR SPRINGS PUBLIC SCHOOLS 84.0 37.8CREATIVE TECHNOLOGIES ACADEMY 75.6 Below District 8.4 0.0 Below District 37.8
COMSTOCK PARK PUBLIC SCHOOLS 82.0 34.9CHANDLER WOODS CHARTER ACADEMY 93.8 Above District 11.8 23.2 Below District 11.7
LAPEER COUNTY
LAPEER COMMUNITY SCHOOLS 83.0 29.6CHATFIELD SCHOOL 89.2 Above District 6.2 9.0 Below District 20.6
LIVINGSTON COUNTY
HARTLAND CONSOLIDATED SCHOOLS 90.0 10.0CHARYL STOCKWELL ACADEMY 83.9 Below District 6.1 0.0 Below District 10.0
MACOMB COUNTY
ROSEVILLE COMMUNITY SCHOOLS 72.0 52.5CONNER CREEK ACADEMY EAST 66.0 Below District 6.0 57.0 Above District 4.5
UTICA COMMUNITY SCHOOLS 85.0 14.9HURON ACADEMY 78.2 Below District 6.8 33.1 Above District 18.2
WARREN CONSOLIDATED SCHOOLS 78.0 37.1CONNER CREEK ACADEMY 50.0 Below District 28.0 76.6 Above District 39.5BEN ROSS PUBLIC SCHOOL ACADEMY 52.7 Below District 25.3 0.0 Below District 37.1
MEAP_ELA Page 8 of 16 4/7/20098:29 AM

District NamePercent
Proficient Proficiency Status % Difference FRL FRL Status % Difference
Fall 2007 3-8 MEAP ELA Proficiency v. Percent FRL - By School Building
NEW HAVEN COMMUNITY SCHOOLS 68.0 33.4MERRITT ACADEMY 68.6 Above District 0.6 29.8 Below District 3.6
MT. CLEMENS COMMUNITY SCHOOL DISTRI 61.0 73.3MT. CLEMENS MONTESSORI ACADEMY 90.6 Above District 29.6 3.6 Below District 69.7PREVAIL ACADEMY 81.4 Above District 20.4 35.6 Below District 37.7
VAN DYKE PUBLIC SCHOOLS 64.0 72.4ACADEMY OF WARREN 47.1 Below District 16.9 58.3 Below District 14.1
MANISTEE COUNTY
MANISTEE AREA SCHOOLS 80.0 51.1CASMAN ALTERNATIVE ACADEMY 0.0 Below District 80.0 67.9 Above District 16.8
MARQUETTE COUNTY
ISHPEMING PUBLIC SCHOOL DISTRICT 88.0 42.6NORTH STAR ACADEMY 21.7 Below District 66.3 64.0 Above District 21.4
MECOSTA COUNTY
BIG RAPIDS PUBLIC SCHOOLS 79.0 49.4CROSSROADS CHARTER ACADEMY 85.0 Above District 6.0 43.7 Below District 5.7
MEAP_ELA Page 9 of 16 4/7/20098:29 AM

District NamePercent
Proficient Proficiency Status % Difference FRL FRL Status % Difference
Fall 2007 3-8 MEAP ELA Proficiency v. Percent FRL - By School Building
MIDLAND COUNTY
MIDLAND PUBLIC SCHOOLS 89.0 24.1MIDLAND ACADEMY OF ADVANCED AND CR 84.4 Below District 4.6 0.0 Below District 24.1
MONROE COUNTY
BEDFORD PUBLIC SCHOOLS 89.0 15.7NEW BEDFORD ACADEMY 71.1 Below District 17.9 31.3 Above District 15.6
JEFFERSON SCHOOLS (MONROE) 81.0 26.2TRIUMPH ACADEMY 73.7 Below District 7.3 35.7 Above District 9.5
MUSKEGON COUNTY
MUSKEGON CITY SCHOOL DISTRICT 53.0 86.0TRI-VALLEY ACADEMY OF ARTS AND ACAD 36.4 Below District 16.6 98.4 Above District 12.4TIMBERLAND ACADEMY 59.8 Above District 6.8 78.7 Below District 7.3MUSKEGON TECHNICAL ACADEMY 60.0 Above District 7.0 67.2 Below District 18.8THREE OAKS PUBLIC SCHOOL ACADEMY 44.2 Below District 8.8 0.0 Below District 86.0
OAKLAND COUNTY
SOUTHFIELD PUBLIC SCHOOL DISTRICT 70.0 47.4AGBU ALEX-MARIE MANOOGIAN SCHOOL 75.3 Above District 5.3 0.0 Below District 47.4ACADEMY OF SOUTHFIELD 65.8 Below District 4.2 68.8 Above District 21.4ACADEMY OF LATHRUP VILLAGE 56.6 Below District 13.4 68.8 Above District 21.4BRADFORD ACADEMY 58.1 Below District 11.9 48.1 Above District 0.7LAURUS ACADEMY 71.2 Above District 1.2 49.2 Above District 1.8WOODMONT ACADEMY 65.2 Below District 4.8 54.1 Above District 6.7CRESCENT ACADEMY 42.1 Below District 27.9 63.7 Above District 16.3
MEAP_ELA Page 10 of 16 4/7/20098:29 AM

District NamePercent
Proficient Proficiency Status % Difference FRL FRL Status % Difference
Fall 2007 3-8 MEAP ELA Proficiency v. Percent FRL - By School Building
OAK PARK CITY SCHOOL DISTRICT 54.0 65.7ACADEMY OF OAK PARK 43.0 Below District 11.0 63.2 Below District 2.5
PONTIAC CITY SCHOOL DISTRICT 50.0 83.9PONTIAC ACADEMY FOR EXCELLENCE 50.6 Above District 0.6 91.1 Above District 7.2GREAT LAKES ACADEMY 45.6 Below District 4.4 83.3 Below District 0.6WALTON CHARTER ACADEMY 71.2 Above District 21.2 69.1 Below District 14.8ARTS AND TECHNOLOGY ACADEMY OF PONT 42.3 Below District 7.7 83.6 Below District 0.3
FERNDALE PUBLIC SCHOOLS 70.0 49.7EDISON-OAKLAND PUBLIC SCHOOL ACADEM 67.5 Below District 2.5 72.5 Above District 22.8
HOLLY AREA SCHOOL DISTRICT 80.0 31.6HOLLY ACADEMY 93.5 Above District 13.5 0.0 Below District 31.6
FARMINGTON PUBLIC SCHOOL DISTRICT 88.0 13.1OAKLAND INTERNATIONAL ACADEMY 38.0 Below District 50.0 98.6 Above District 85.5
WATERFORD SCHOOL DISTRICT 80.0 29.9ACADEMY OF WATERFORD 56.0 Below District 24.0 71.6 Above District 41.7
LAMPHERE PUBLIC SCHOOLS 78.0 37.8GREAT OAKS ACADEMY 62.7 Below District 15.3 52.8 Above District 15.0
OTTAWA COUNTY
GRAND HAVEN AREA PUBLIC SCHOOLS 90.0 29.0WALDEN GREEN MONTESSORI 92.5 Above District 2.5 0.0 Below District 29.0WEST MI ACADEMY OF ARTS AND ACADEMI 83.5 Below District 6.5 22.7 Below District 6.3
HOLLAND CITY SCHOOL DISTRICT 73.0 55.6BLACK RIVER PUBLIC SCHOOL 89.7 Above District 16.7 14.2 Below District 41.4VANDERBILT CHARTER ACADEMY 84.2 Above District 11.2 62.1 Above District 6.5
WEST OTTAWA PUBLIC SCHOOL DISTRICT 81.0 41.9EAGLE CREST CHARTER ACADEMY 93.8 Above District 12.8 29.9 Below District 12.0
MEAP_ELA Page 11 of 16 4/7/20098:29 AM

District NamePercent
Proficient Proficiency Status % Difference FRL FRL Status % Difference
Fall 2007 3-8 MEAP ELA Proficiency v. Percent FRL - By School Building
SAGINAW COUNTY
SAGINAW CITY SCHOOL DISTRICT 60.0 74.6SAGINAW COUNTY TRANSITION ACADEMY 61.5 Above District 1.5 0.0 Below District 74.6FRANCIS REH PSA 52.9 Below District 7.1 96.1 Above District 21.5NORTH SAGINAW CHARTER ACADEMY 76.3 Above District 16.3 65.6 Below District 9.0
BUENA VISTA SCHOOL DISTRICT 46.0 62.0SAGINAW PREPARATORY ACADEMY 88.1 Above District 42.1 92.9 Above District 30.9
BRIDGEPORT-SPAULDING COMMUNITY SCHO 66.0 69.8INTERNATIONAL ACADEMY OF SAGINAW 66.7 Above District 0.7 71.6 Above District 1.8
ST. CLAIR COUNTY
PORT HURON AREA SCHOOL DISTRICT 78.0 43.6ST. CLAIR COUNTY LEARNING ACADEMY 71.4 Below District 6.6 76.7 Above District 33.1LANDMARK ACADEMY 76.1 Below District 1.9 30.7 Below District 12.9ST. CLAIR COUNTY INTERVENTION ACADE 33.3 Below District 44.7 100.0 Above District 56.4
WASHTENAW COUNTY
ANN ARBOR PUBLIC SCHOOLS 89.0 20.0HONEY CREEK COMMUNITY SCHOOL 89.3 Above District 0.3 16.0 Below District 4.0CENTRAL ACADEMY 64.2 Below District 24.8 80.0 Above District 60.0ANN ARBOR LEARNING COMMUNITY 87.9 Below District 1.1 5.6 Below District 14.4EASTERN WASHTENAW MULTICULTURAL AC 56.8 Below District 32.2 55.6 Above District 35.6
MILAN AREA SCHOOLS 77.0 18.8SOUTH ARBOR CHARTER ACADEMY 94.6 Above District 17.6 17.2 Below District 1.6
MEAP_ELA Page 12 of 16 4/7/20098:29 AM

District NamePercent
Proficient Proficiency Status % Difference FRL FRL Status % Difference
Fall 2007 3-8 MEAP ELA Proficiency v. Percent FRL - By School Building
SCHOOL DISTRICT OF YPSILANTI 64.0 62.9FORTIS ACADEMY 81.7 Above District 17.7 34.1 Below District 28.8VICTORY ACADEMY CHARTER SCHOOL 53.5 Below District 10.5 84.5 Above District 21.6
WAYNE COUNTY
HIGHLAND PARK CITY SCHOOLS 49.0 71.3GEORGE WASHINGTON CARVER ACADEMY 36.8 Below District 12.2 71.9 Above District 0.6BUSINESS ENTREPRENEURSHIP, SCIENCE, 36.3 Below District 12.7 90.6 Above District 19.3NSOROMA INSTITUTE 64.5 Above District 15.5 54.5 Below District 16.8NORTHPOINTE ACADEMY 48.0 Below District 1.0 41.9 Below District 29.4
SCHOOL DISTRICT OF THE CITY OF INKS 68.0 89.4THOMAS-GIST ACADEMY 55.0 Below District 13.0 82.1 Below District 7.3CHERRY HILL SCHOOL OF PERFORMING AR 44.9 Below District 23.1 74.3 Below District 15.1JOY PREPARATORY ACADEMY 46.2 Below District 21.8 73.8 Below District 15.6
WESTWOOD COMMUNITY SCHOOLS 64.0 78.1ACADEMY FOR BUSINESS AND TECHNOLOGY 58.0 Below District 6.0 83.2 Above District 5.1
WAYNE-WESTLAND COMMUNITY SCHOOL D 77.0 50.4GAUDIOR ACADEMY 67.6 Below District 9.4 41.5 Below District 8.9ACADEMY OF WESTLAND 58.7 Below District 18.3 55.9 Above District 5.5DISCOVERY ARTS AND TECHNOLOGY PSA 32.4 Below District 44.6 88.8 Above District 38.4
FLAT ROCK COMMUNITY SCHOOLS 79.0 36.5SUMMIT ACADEMY 70.1 Below District 8.9 35.6 Below District 0.9
REDFORD UNION SCHOOL DISTRICT 65.0 53.0DAVID ELLIS ACADEMY WEST 52.5 Below District 12.5 54.4 Above District 1.4
MEAP_ELA Page 13 of 16 4/7/20098:29 AM

District NamePercent
Proficient Proficiency Status % Difference FRL FRL Status % Difference
Fall 2007 3-8 MEAP ELA Proficiency v. Percent FRL - By School Building
DEARBORN CITY SCHOOL DISTRICT 70.0 61.7ADVANCED TECHNOLOGY ACADEMY 61.6 Below District 8.4 73.8 Above District 12.1DEARBORN ACADEMY 47.9 Below District 22.1 84.3 Above District 22.6WEST VILLAGE ACADEMY 48.0 Below District 22.0 78.7 Above District 17.0RIVERSIDE ACADEMY 55.0 Below District 15.0 90.7 Above District 29.0CLARA B. FORD ACADEMY (SDA) 16.0 Below District 54.0 100.0 Above District 38.3
HURON SCHOOL DISTRICT 79.0 28.1SUMMIT ACADEMY NORTH 79.0 Below District 0.0 39.4 Above District 11.3
VAN BUREN PUBLIC SCHOOLS 70.0 42.9NEW BEGINNINGS ACADEMY 60.0 Below District 10.0 58.6 Above District 15.7KEYSTONE ACADEMY 81.6 Above District 11.6 17.8 Below District 25.1
ROMULUS COMMUNITY SCHOOLS 69.0 62.5METRO CHARTER ACADEMY 80.6 Above District 11.6 47.1 Below District 15.4
PLYMOUTH-CANTON COMMUNITY SCHOOLS 88.0 10.9CANTON CHARTER ACADEMY 93.8 Above District 5.8 9.1 Below District 1.8
TAYLOR SCHOOL DISTRICT 65.0 62.1CREATIVE MONTESSORI ACADEMY 87.8 Above District 22.8 34.1 Below District 28.0TRILLIUM ACADEMY 64.0 Below District 1.0 33.7 Below District 28.4TAYLOR EXEMPLAR ACADEMY 76.7 Above District 11.7 43.6 Below District 18.5
HAMTRAMCK PUBLIC SCHOOLS 61.0 83.7HAMTRAMCK ACADEMY 73.7 Above District 12.7 81.7 Below District 2.0BRIDGE ACADEMY 50.5 Below District 10.5 98.7 Above District 15.0HANLEY INTERNATIONAL ACADEMY 52.8 Below District 8.2 81.9 Below District 1.8FRONTIER INTERNATIONAL ACADEMY 50.5 Below District 10.5 98.5 Above District 14.8
MEAP_ELA Page 14 of 16 4/7/20098:29 AM

District NamePercent
Proficient Proficiency Status % Difference FRL FRL Status % Difference
Fall 2007 3-8 MEAP ELA Proficiency v. Percent FRL - By School Building
LIVONIA PUBLIC SCHOOLS 85.0 16.0AMERICAN MONTESSORI ACADEMY 73.7 Below District 11.3 11.9 Below District 4.1
DEARBORN HEIGHTS SCHOOL DISTRICT #7 75.0 53.2UNIVERSAL LEARNING ACADEMY 58.5 Below District 16.5 77.4 Above District 24.2
ECORSE PUBLIC SCHOOL DISTRICT 65.0 95.8DR. CHARLES DREW ACADEMY 46.6 Below District 18.4 88.4 Below District 7.4
DETROIT CITY SCHOOL DISTRICT 51.0 81.6ACADEMY OF DETROIT-WEST 56.3 Above District 5.3 75.2 Below District 6.4AISHA SHULE/WEB DUBOIS PREP. ACADEM 56.7 Above District 5.7 84.7 Above District 3.1ALLEN ACADEMY 48.0 Below District 3.0 72.0 Below District 9.6BLANCHE KELSO BRUCE ACADEMY 0.0 Below District 51.0 100.0 Above District 18.4CENTER FOR LITERACY AND CREATIVITY 49.4 Below District 1.6 61.1 Below District 20.5CESAR CHAVEZ ACADEMY 50.0 Below District 1.0 88.6 Above District 7.0CHANDLER PARK ACADEMY 55.0 Above District 4.0 76.6 Below District 5.0CHARLOTTE FORTEN ACADEMY 8.7 Below District 42.3 60.6 Below District 21.0COLIN POWELL ACADEMY 51.5 Above District 0.5 80.7 Below District 0.9COMMONWEALTH COMMUNITY DEVEL. ACA 60.6 Above District 9.6 93.5 Above District 11.9DAVID ELLIS ACADEMY 50.5 Below District 0.5 65.9 Below District 15.7DETROIT ACADEMY OF ARTS AND SCIENCE 63.0 Above District 12.0 72.2 Below District 9.4DETROIT COMMUNITY SCHOOLS 37.7 Below District 13.3 65.3 Below District 16.3DETROIT ENTERPRISE ACADEMY 54.3 Above District 3.3 71.2 Below District 10.4DETROIT MERIT CHARTER ACADEMY 79.2 Above District 28.2 79.5 Below District 2.1DETROIT PREMIER ACADEMY 65.7 Above District 14.7 72.5 Below District 9.1DOVE ACADEMY OF DETROIT 66.3 Above District 15.3 55.8 Below District 25.8EATON ACADEMY 58.5 Above District 7.5 50.7 Below District 30.9EDISON PUBLIC SCHOOL ACADEMY 81.1 Above District 30.1 54.1 Below District 27.5FLAGSHIP CHARTER ACADEMY 42.7 Below District 8.3 79.1 Below District 2.5GEORGE CROCKETT ACADEMY 61.3 Above District 10.3 82.6 Above District 1.0HOPE ACADEMY 48.5 Below District 2.5 76.2 Below District 5.4
MEAP_ELA Page 15 of 16 4/7/20098:29 AM

District NamePercent
Proficient Proficiency Status % Difference FRL FRL Status % Difference
Fall 2007 3-8 MEAP ELA Proficiency v. Percent FRL - By School Building
DETROIT CITY SCHOOL DISTRICT (continued) 51.0 81.6HOPE OF DETROIT ACADEMY 52.6 Above District 1.6 92.0 Above District 10.4M.L. KING JR. EDUCATION CENTER 87.9 Above District 36.9 68.0 Below District 13.6MARILYN F. LUNDY ACADEMY 33.8 Below District 17.2 75.4 Below District 6.2MARVIN L. WINANS ACADEMY OF PERFORM 68.0 Above District 17.0 76.3 Below District 5.3MICHIGAN TECHNICAL ACADEMY 55.0 Above District 4.0 73.5 Below District 8.1NATAKI TALIBAH SCHOOLHOUSE OF DETRO 75.4 Above District 24.4 52.1 Below District 29.5OLD REDFORD ACADEMY 55.0 Above District 4.0 73.7 Below District 7.9PIERRE TOUSSAINT ACADEMY 47.9 Below District 3.1 93.4 Above District 11.8PLYMOUTH EDUCATIONAL CENTER 72.3 Above District 21.3 74.4 Below District 7.2ROSS HILL ACADEMY 49.2 Below District 1.8 76.4 Below District 5.2STAR INTERNATIONAL ACADEMY 67.1 Above District 16.1 88.2 Above District 6.6TIMBUKTU ACADEMY OF SCIENCE AND TEC 50.5 Below District 0.5 93.1 Above District 11.5UNIVERSAL ACADEMY 37.0 Below District 14.0 88.4 Above District 6.8UNIVERSITY PREPARATORY ACADEMY 66.0 Above District 15.0 71.7 Below District 9.9VOYAGEUR ACADEMY 46.0 Below District 5.0 79.5 Below District 2.1WARRENDALE CHARTER ACADEMY 61.7 Above District 10.7 65.4 Below District 16.2WESTON TECHNICAL ACADEMY 42.7 Below District 8.3 54.2 Below District 27.4WOODWARD ACADEMY 54.2 Above District 3.2 79.0 Below District 2.6YMCA SERVICE LEARNING ACADEMY 79.6 Above District 28.6 64.2 Below District 17.4
MEAP_ELA Page 16 of 16 4/7/20098:29 AM

District Name % Proficient Proficiency Status % Difference % FRL FRL Status % Difference
ALLEGAN COUNTY
FENNVILLE PUBLIC SCHOOLS 76.0 57.0DISCOVERY ELEMENTARY SCHOOL 69.7 Below District 6.3 60.4 Above District 3.4
ALLEGAN PUBLIC SCHOOLS 83.0 42.7OUTLOOK ACADEMY 33.3 Below District 49.7 78.6 Above District 35.9
ALPENA COUNTY
ALPENA PUBLIC SCHOOLS 76.0 45.0BINGHAM ACADEMY 76.5 Above District 0.5 64.3 Above District 19.3
ANTRIM COUNTY
ALBA PUBLIC SCHOOLS 86.0 66.2CONCORD ACADEMY: ANTRIM 67.1 Below District 18.9 64.6 Below District 1.6
ELK RAPIDS SCHOOLS 84.0 26.4WOODLAND SCHOOL 91.7 Above District 7.7 10.5 Below District 15.9
BAY COUNTY
BAY CITY SCHOOL DISTRICT 79.0 46.5BAY COUNTY PSA 65.2 Below District 13.8 66.1 Above District 19.6
Fall 2007 3-8 MEAP Math Proficiency v. Percent FRL - By School Building
MEAP_Math Page 1 of 16 3/2/20099:28 AM

District Name % Proficient Proficiency Status % Difference % FRL FRL Status % DifferenceBERRIEN COUNTY
BENTON HARBOR AREA SCHOOLS 54.0 93.6COUNTRYSIDE ACADEMY 74.0 Above District 20.0 71.0 Below District 22.6BENTON HARBOR CHARTER SCHOOL 58.4 Above District 4.4 34.4 Below District 59.2MILDRED C. WELLS PREPARATORY ACADE 34.1 Below District 19.9 99.0 Above District 5.4
BRANCH COUNTY
COLDWATER COMMUNITY SCHOOLS 76.0 47.7PANSOPHIA ACADEMY 76.9 Above District 0.9 75.0 Above District 27.3
CALHOUN COUNTY
LAKEVIEW SCH. DISTRICT (CALHOUN) 75.0 30.7ARBOR ACADEMY 78.6 Above District 3.6 50.0 Above District 19.3
BATTLE CREEK PUBLIC SCHOOLS 61.0 75.9ENDEAVOR CHARTER ACADEMY 80.0 Above District 19.0 46.2 Below District 29.7
MARSHALL PUBLIC SCHOOLS 80.0 19.6MARSHALL ACADEMY 70.0 Below District 10.0 13.6 Below District 6.0
CHARLEVOIX COUNTY
BOYNE FALLS PUBLIC SCHOOL DISTRICT 86.6 43.1CONCORD ACADEMY:BOYNE 86.5 Below District 0.1 3.6 Below District 39.5
CHARLEVOIX PUBLIC SCHOOLS 84.0 32.9NORTHWEST ACADEMY 70.8 Below District 13.2 47.6 Above District 14.7
MEAP_Math Page 2 of 16 3/2/20099:28 AM

District Name % Proficient Proficiency Status % Difference % FRL FRL Status % DifferenceCHIPPEWA COUNTY
SAULT STE. MARIE AREA SCHOOLS 83.0 44.8JOSEPH P. LUMSDEN BAHWETING ANISHNA 89.0 Above District 6.0 44.6 Below District 0.2
BRIMLEY AREA SCHOOLS 84.0 41.5OJIBWE CHARTER SCHOOL 52.2 Below District 31.8 69.3 Above District 27.8
DELTA COUNTY
BARK RIVER-HARRIS SCHOOL DISTRICT 76.0 39.4NAH TAH WAHSH PUBLIC SCHOOL ACADEM 52.5 Below District 23.5 44.0 Above District 4.6
EATON COUNTY
EATON RAPIDS PUBLIC SCHOOLS 77.0 31.9ISLAND CITY ACADEMY 85.8 Above District 8.8 33.5 Above District 1.6
EMMET COUNTY
PUBLIC SCHOOLS OF PETOSKEY 88.0 28.1CONCORD ACADEMY - PETOSKEY 85.3 Below District 2.7 0.0 Below District 28.1
GENESEE COUNTY
GRAND BLANC COMMUNITY SCHOOLS 90.0 19.5WOODLAND PARK ACADEMY 68.5 Below District 21.5 38.1 Above District 18.6GRAND BLANC ACADEMY 64.4 Below District 25.6 52.3 Above District 32.8
MEAP_Math Page 3 of 16 3/2/20099:28 AM

District Name % Proficient Proficiency Status % Difference % FRL FRL Status % DifferenceFLINT CITY SCHOOL DISTRICT 51.0 75.9NORTHRIDGE ACADEMY 51.1 Above District 0.1 99.1 Above District 23.2INTERNATIONAL ACADEMY OF FLINT 80.3 Above District 29.3 72.1 Below District 3.8CENTER ACADEMY 55.2 Above District 4.2 90.9 Above District 15.0RICHFIELD PUBLIC SCHOOL ACADEMY 66.4 Above District 15.4 75.7 Below District 0.2
WESTWOOD HEIGHTS SCHOOLS 64.0 77.7LINDEN CHARTER ACADEMY 65.8 Above District 1.8 63.9 Below District 13.8ACADEMY OF FLINT 68.8 Above District 4.8 86.0 Above District 8.3ATHERTON COMMUNITY SCHOOLS 78.0 58.5BURTON GLEN CHARTER ACADEMY 71.8 Below District 6.2 64.6 Above District 6.1
BENDLE PUBLIC SCHOOLS 71.0 39.0MADISON ACADEMY 67.5 Below District 3.5 49.3 Above District 10.3
GLADWIN COUNTY
BEAVERTON RURAL SCHOOLS 80.0 40.2CREATIVE LEARNING ACADEMY OF SCIENC 65.9 Below District 14.1 65.8 Above District 25.6
GRAND TRAVERSE COUNTY
TRAVERSE CITY AREA PUBLIC SCHOOLS 83.0 33.8GRAND TRAVERSE ACADEMY 80.1 Below District 2.9 21.9 Below District 11.9
HILLSDALE COUNTY
HILLSDALE COMMUNITY SCHOOLS 79.0 51.2HILLSDALE PREPARATORY SCHOOL 86.8 Above District 7.8 27.0 Below District 24.2WILL CARLETON CHARTER SCHOOL ACADE 83.0 Above District 4.0 5.6 Below District 45.6
MEAP_Math Page 4 of 16 3/2/20099:28 AM

District Name % Proficient Proficiency Status % Difference % FRL FRL Status % DifferenceINGHAM COUNTY
LANSING PUBLIC SCHOOL DISTRICT 63.0 68.0COLE ACADEMY 72.1 Above District 9.1 57.2 Below District 10.8EL-HAJJ MALIK EL-SHABAZZ ACADEMY 64.9 Above District 1.9 95.3 Above District 27.3MID-MICHIGAN LEADERSHIP ACADEMY 63.6 Above District 0.6 86.2 Above District 18.2CAPITAL AREA ACADEMY 42.5 Below District 20.5 73.0 Above District 5.0NEW CITY ACADEMY 39.4 Below District 23.6 63.5 Below District 4.5
LESLIE PUBLIC SCHOOLS 77.0 35.3WHITE PINE ACADEMY 73.0 Below District 4.0 15.4 Below District 19.9
WAVERLY COMMUNITY SCHOOLS 78.0 41.2WINDEMERE PARK CHARTER ACADEMY 82.7 Above District 4.7 32.4 Below District 8.8
IOSCO COUNTY
TAWAS AREA SCHOOLS 81.0 46.5SUNRISE EDUCATION CENTER 48.6 Below District 32.4 69.4 Above District 22.9
ISABELLA COUNTY
MT. PLEASANT CITY SCHOOL DISTRICT 83.0 7.9RENAISSANCE PUBLIC SCHOOL ACADEMY 77.5 Below District 5.5 50.7 Above District 42.8MOREY CHARTER SCHOOL 73.7 Below District 9.3 47.3 Above District 39.4
JACKSON COUNTY
JACKSON PUBLIC SCHOOLS 60.0 57.7THE DA VINCI INSTITUTE 64.0 Above District 4.0 75.0 Above District 17.3PARAGON CHARTER ACADEMY 86.1 Above District 26.1 45.7 Below District 12.0JACKSON ARTS AND TECHNOLOGY PSA 47.6 Below District 12.4 82.0 Above District 24.3
MEAP_Math Page 5 of 16 3/2/20099:28 AM

District Name % Proficient Proficiency Status % Difference % FRL FRL Status % DifferenceKALAMAZOO COUNTY
PORTAGE PUBLIC SCHOOLS 90.0 21.0OAKLAND ACADEMY 93.6 Above District 3.6 20.1 Below District 0.9
KALAMAZOO PUBLIC SCHOOL DISTRICT 60.0 65.7KALAMAZOO ADVANTAGE ACADEMY 45.8 Below District 14.2 92.0 Above District 26.3PARAMOUNT CHARTER ACADEMY 88.7 Above District 28.7 22.7 Below District 43.0
KENT COUNTY
GRAND RAPIDS PUBLIC SCHOOLS 57.0 83.9NEW BRANCHES SCHOOL 83.8 Above District 26.8 57.6 Below District 26.3WILLIAM C. ABNEY ACADEMY 82.2 Above District 25.2 89.6 Above District 5.7RIDGE PARK CHARTER ACADEMY 74.4 Above District 17.4 63.2 Below District 20.7GRAND RAPIDS CHILD DISCOVERY CENTER 74.3 Above District 17.3 58.6 Below District 25.3
KENOWA HILLS PUBLIC SCHOOLS 79.0 40.2WEST MI ACADEMY OF ENVIRONMENTAL S 64.7 Below District 14.3 50.4 Above District 10.2WALKER CHARTER ACADEMY 90.9 Above District 11.9 29.3 Below District 10.9
KENTWOOD PUBLIC SCHOOLS 80.0 47.3EXCEL CHARTER ACADEMY 86.4 Above District 6.4 32.5 Below District 14.8
BYRON CENTER PUBLIC SCHOOLS 92.0 20.0BYRON CENTER CHARTER SCHOOL 85.4 Below District 6.6 5.3 Below District 14.7
MEAP_Math Page 6 of 16 3/2/20099:28 AM

District Name % Proficient Proficiency Status % Difference % FRL FRL Status % DifferenceCALEDONIA COMMUNITY SCHOOLS 93.0 15.0CROSS CREEK CHARTER ACADEMY 92.4 Below District 0.6 22.2 Above District 7.2
GODWIN HEIGHTS PUBLIC SCHOOLS 78.0 74.8VISTA CHARTER ACADEMY 69.7 Below District 8.3 74.0 Below District 0.8
WYOMING PUBLIC SCHOOLS 81.0 60.1VANGUARD CHARTER ACADEMY 86.8 Above District 5.8 37.7 Below District 22.4
BELDING AREA SCHOOL DISTRICT 81.0 51.8GRATTAN ACADEMY 84.0 Above District 3.0 10.0 Below District 41.8THRESHOLD ACADEMY 48.2 Below District 32.8 91.1 Above District 39.3
FOREST HILLS PUBLIC SCHOOLS 96.0 7.1KNAPP CHARTER ACADEMY 87.0 Below District 9.0 45.6 Above District 38.5
CEDAR SPRINGS PUBLIC SCHOOLS 87.0 37.8CREATIVE TECHNOLOGIES ACADEMY 77.3 Below District 9.7 0.0 Below District 37.8
COMSTOCK PARK PUBLIC SCHOOLS 85.0 34.9CHANDLER WOODS CHARTER ACADEMY 94.3 Above District 9.3 23.2 Below District 11.7
LAPEER COUNTY
LAPEER COMMUNITY SCHOOLS 83.0 29.6CHATFIELD SCHOOL 91.6 Above District 8.6 9.0 Below District 20.6
MEAP_Math Page 7 of 16 3/2/20099:28 AM

District Name % Proficient Proficiency Status % Difference % FRL FRL Status % DifferenceLIVINGSTON COUNTY
HARTLAND CONSOLIDATED SCHOOLS 90.0 10.0CHARYL STOCKWELL ACADEMY 81.1 Below District 8.9 0.0 Below District 10.0
MACOMB COUNTY
ROSEVILLE COMMUNITY SCHOOLS 73.0 52.5CONNER CREEK ACADEMY EAST 65.0 Below District 8.0 57.0 Above District 4.5
UTICA COMMUNITY SCHOOLS 85.0 14.9HURON ACADEMY 83.5 Below District 1.5 33.1 Above District 18.2
WARREN CONSOLIDATED SCHOOLS 80.0 37.1CONNER CREEK ACADEMY 46.0 Below District 34.0 76.6 Above District 39.5BEN ROSS PUBLIC SCHOOL ACADEMY 58.2 Below District 21.8 0.0 Below District 37.1
NEW HAVEN COMMUNITY SCHOOLS 72.0 33.4MERRITT ACADEMY 66.2 Below District 5.8 29.8 Below District 3.6
MT. CLEMENS COMMUNITY SCHOOL DISTR 65.0 73.3MT. CLEMENS MONTESSORI ACADEMY 91.5 Above District 26.5 3.6 Below District 69.7PREVAIL ACADEMY 81.8 Above District 16.8 35.6 Below District 37.7
VAN DYKE PUBLIC SCHOOLS 67.0 72.4ACADEMY OF WARREN 43.8 Below District 23.2 58.3 Below District 14.1
MEAP_Math Page 8 of 16 3/2/20099:28 AM

District Name % Proficient Proficiency Status % Difference % FRL FRL Status % DifferenceMANISTEE COUNTY
MANISTEE AREA SCHOOLS 79.0 51.1CASMAN ALTERNATIVE ACADEMY 11.1 Below District 67.9 67.9 Above District 16.8
MARQUETTE COUNTY
ISHPEMING PUBLIC SCHOOL DISTRICT 82.0 42.6NORTH STAR ACADEMY 26.1 Below District 55.9 64.0 Above District 21.4
MECOSTA COUNTY
BIG RAPIDS PUBLIC SCHOOLS 84.0 49.4CROSSROADS CHARTER ACADEMY 86.0 Above District 2.0 43.7 Below District 5.7
MIDLAND COUNTY
MIDLAND PUBLIC SCHOOLS 88.0 24.1MIDLAND ACADEMY OF ADVANCED AND C 80.7 Below District 7.3 0.0 Below District 24.1
MONROE COUNTY
BEDFORD PUBLIC SCHOOLS 88.0 15.7NEW BEDFORD ACADEMY 67.9 Below District 20.1 31.3 Above District 15.6
JEFFERSON SCHOOLS (MONROE) 80.0 26.2TRIUMPH ACADEMY 78.2 Below District 1.8 35.7 Above District 9.5
MEAP_Math Page 9 of 16 3/2/20099:28 AM

District Name % Proficient Proficiency Status % Difference % FRL FRL Status % DifferenceMUSKEGON COUNTY
MUSKEGON CITY SCHOOL DISTRICT 55.0 86.0TRI-VALLEY ACADEMY OF ARTS AND ACAD 26.7 Below District 28.3 98.4 Above District 12.4TIMBERLAND ACADEMY 65.0 Above District 10.0 78.7 Below District 7.3MUSKEGON TECHNICAL ACADEMY 62.9 Above District 7.9 67.2 Below District 18.8THREE OAKS PUBLIC SCHOOL ACADEMY 47.7 Below District 7.3 0.0 Below District 86.0
OAKLAND COUNTY
SOUTHFIELD PUBLIC SCHOOL DISTRICT 71.0 47.4AGBU ALEX-MARIE MANOOGIAN SCHOOL 81.2 Above District 10.2 0.0 Below District 47.4ACADEMY OF SOUTHFIELD 76.8 Above District 5.8 68.8 Above District 21.4ACADEMY OF LATHRUP VILLAGE 50.0 Below District 21.0 68.8 Above District 21.4BRADFORD ACADEMY 51.1 Below District 19.9 48.1 Above District 0.7LAURUS ACADEMY 68.6 Below District 2.4 49.2 Above District 1.8WOODMONT ACADEMY 66.0 Below District 5.0 54.1 Above District 6.7CRESCENT ACADEMY 36.3 Below District 34.7 63.7 Above District 16.3
OAK PARK CITY SCHOOL DISTRICT 51.0 65.7ACADEMY OF OAK PARK 43.0 Below District 8.0 63.2 Below District 2.5
PONTIAC CITY SCHOOL DISTRICT 51.0 83.9PONTIAC ACADEMY FOR EXCELLENCE 48.8 Below District 2.2 91.1 Above District 7.2GREAT LAKES ACADEMY 52.5 Above District 1.5 83.3 Below District 0.6WALTON CHARTER ACADEMY 68.3 Above District 17.3 69.1 Below District 14.8ARTS AND TECHNOLOGY ACADEMY OF PO 50.9 Below District 0.1 83.6 Below District 0.3
FERNDALE PUBLIC SCHOOLS 75.0 49.7EDISON-OAKLAND PUBLIC SCHOOL ACADE 72.2 Below District 2.8 72.5 Above District 22.8
MEAP_Math Page 10 of 16 3/2/20099:28 AM

District Name % Proficient Proficiency Status % Difference % FRL FRL Status % DifferenceHOLLY AREA SCHOOL DISTRICT 81.0 31.6HOLLY ACADEMY 95.3 Above District 14.3 0.0 Below District 31.6
FARMINGTON PUBLIC SCHOOL DISTRICT 86.0 13.1OAKLAND INTERNATIONAL ACADEMY 57.0 Below District 29.0 98.6 Above District 85.5
WATERFORD SCHOOL DISTRICT 79.0 29.9ACADEMY OF WATERFORD 57.3 Below District 21.7 71.6 Above District 41.7
LAMPHERE PUBLIC SCHOOLS 79.0 37.8GREAT OAKS ACADEMY 66.1 Below District 12.9 52.8 Above District 15.0
OTTAWA COUNTY
GRAND HAVEN AREA PUBLIC SCHOOLS 89.0 29.0WALDEN GREEN MONTESSORI 89.7 Above District 0.7 0.0 Below District 29.0WEST MI ACADEMY OF ARTS AND ACADEM 82.3 Below District 6.7 22.7 Below District 6.3
HOLLAND CITY SCHOOL DISTRICT 75.0 55.6BLACK RIVER PUBLIC SCHOOL 89.7 Above District 14.7 14.2 Below District 41.4VANDERBILT CHARTER ACADEMY 87.7 Above District 12.7 62.1 Above District 6.5
WEST OTTAWA PUBLIC SCHOOL DISTRICT 82.0 41.9EAGLE CREST CHARTER ACADEMY 93.0 Above District 11.0 29.9 Below District 12.0
SAGINAW COUNTY
SAGINAW CITY SCHOOL DISTRICT 61.0 74.6SAGINAW COUNTY TRANSITION ACADEMY 18.8 Below District 42.2 0.0 Below District 74.6FRANCIS REH PSA 57.1 Below District 3.9 96.1 Above District 21.5NORTH SAGINAW CHARTER ACADEMY 74.6 Above District 13.6 65.6 Below District 9.0
MEAP_Math Page 11 of 16 3/2/20099:28 AM

District Name % Proficient Proficiency Status % Difference % FRL FRL Status % DifferenceBUENA VISTA SCHOOL DISTRICT 40.0 62.0SAGINAW PREPARATORY ACADEMY 92.7 Above District 52.7 92.9 Above District 30.9
BRIDGEPORT-SPAULDING COMMUNITY SCH 69.0 69.8INTERNATIONAL ACADEMY OF SAGINAW 100.0 Above District 31.0 71.6 Above District 1.8
ST. CLAIR COUNTY
PORT HURON AREA SCHOOL DISTRICT 75.0 43.6ST. CLAIR COUNTY LEARNING ACADEMY 42.9 Below District 32.1 76.7 Above District 33.1LANDMARK ACADEMY 72.4 Below District 2.6 30.7 Below District 12.9ST. CLAIR COUNTY INTERVENTION ACADE 50.0 Below District 25.0 100.0 Above District 56.4
WASHTENAW COUNTY
ANN ARBOR PUBLIC SCHOOLS 90.0 20.0HONEY CREEK COMMUNITY SCHOOL 92.6 Above District 2.6 16.0 Below District 4.0CENTRAL ACADEMY 70.1 Below District 19.9 80.0 Above District 60.0ANN ARBOR LEARNING COMMUNITY 74.0 Below District 16.0 5.6 Below District 14.4EASTERN WASHTENAW MULTICULTURAL A 67.8 Below District 22.2 55.6 Above District 35.6
MILAN AREA SCHOOLS 79.0 18.8SOUTH ARBOR CHARTER ACADEMY 93.3 Above District 14.3 17.2 Below District 1.6
SCHOOL DISTRICT OF YPSILANTI 64.0 62.9FORTIS ACADEMY 83.8 Above District 19.8 34.1 Below District 28.8VICTORY ACADEMY CHARTER SCHOOL 61.4 Below District 2.6 84.5 Above District 21.6
MEAP_Math Page 12 of 16 3/2/20099:28 AM

District Name % Proficient Proficiency Status % Difference % FRL FRL Status % DifferenceWAYNE COUNTY
HIGHLAND PARK CITY SCHOOLS 44.0 71.3GEORGE WASHINGTON CARVER ACADEMY 37.2 Below District 6.8 71.9 Above District 0.6BUSINESS ENTREPRENEURSHIP, SCIENCE, 43.5 Below District 0.5 90.6 Above District 19.3NSOROMA INSTITUTE 58.0 Above District 14.0 54.5 Below District 16.8NORTHPOINTE ACADEMY 44.4 Above District 0.4 41.9 Below District 29.4
SCHOOL DISTRICT OF THE CITY OF INKS 79.0 89.4THOMAS-GIST ACADEMY 64.0 Below District 15.0 82.1 Below District 7.3CHERRY HILL SCHOOL OF PERFORMING AR 41.5 Below District 37.5 74.3 Below District 15.1JOY PREPARATORY ACADEMY 42.0 Below District 37.0 73.8 Below District 15.6
WESTWOOD COMMUNITY SCHOOLS 64.0 78.1ACADEMY FOR BUSINESS AND TECHNOLOG 60.0 Below District 4.0 83.2 Above District 5.1
WAYNE-WESTLAND COMMUNITY SCHOOL 75.0 50.4GAUDIOR ACADEMY 64.7 Below District 10.3 41.5 Below District 8.9ACADEMY OF WESTLAND 60.6 Below District 14.4 55.9 Above District 5.5DISCOVERY ARTS AND TECHNOLOGY PSA 34.8 Below District 40.2 88.8 Above District 38.4
FLAT ROCK COMMUNITY SCHOOLS 83.0 36.5SUMMIT ACADEMY 79.9 Below District 3.1 35.6 Below District 0.9
REDFORD UNION SCHOOL DISTRICT 62.0 53.0DAVID ELLIS ACADEMY WEST 49.0 Below District 13.0 54.4 Above District 1.4
MEAP_Math Page 13 of 16 3/2/20099:28 AM

District Name % Proficient Proficiency Status % Difference % FRL FRL Status % DifferenceDEARBORN CITY SCHOOL DISTRICT 77.0 61.7ADVANCED TECHNOLOGY ACADEMY 62.2 Below District 14.8 73.8 Above District 12.1DEARBORN ACADEMY 56.2 Below District 20.8 84.3 Above District 22.6WEST VILLAGE ACADEMY 48.0 Below District 29.0 78.7 Above District 17.0RIVERSIDE ACADEMY 66.0 Below District 11.0 90.7 Above District 29.0CLARA B. FORD ACADEMY (SDA) 15.2 Below District 61.8 100.0 Above District 38.3
HURON SCHOOL DISTRICT 78.0 28.1SUMMIT ACADEMY NORTH 76.0 Below District 2.0 39.4 Above District 11.3
VAN BUREN PUBLIC SCHOOLS 68.0 42.9NEW BEGINNINGS ACADEMY 58.9 Below District 9.1 58.6 Above District 15.7KEYSTONE ACADEMY 85.2 Above District 17.2 17.8 Below District 25.1
ROMULUS COMMUNITY SCHOOLS 73.0 62.5METRO CHARTER ACADEMY 82.8 Above District 9.8 47.1 Below District 15.4
PLYMOUTH-CANTON COMMUNITY SCHOOL 91.0 10.9CANTON CHARTER ACADEMY 94.7 Above District 3.7 9.1 Below District 1.8
TAYLOR SCHOOL DISTRICT 66.0 62.1CREATIVE MONTESSORI ACADEMY 75.4 Above District 9.4 34.1 Below District 28.0TRILLIUM ACADEMY 58.9 Below District 7.1 33.7 Below District 28.4TAYLOR EXEMPLAR ACADEMY 81.7 Above District 15.7 43.6 Below District 18.5
HAMTRAMCK PUBLIC SCHOOLS 60.0 83.7HAMTRAMCK ACADEMY 72.0 Above District 12.0 81.7 Below District 2.0BRIDGE ACADEMY 63.2 Above District 3.2 98.7 Above District 15.0HANLEY INTERNATIONAL ACADEMY 55.9 Below District 4.1 81.9 Below District 1.8FRONTIER INTERNATIONAL ACADEMY 49.5 Below District 10.5 98.5 Above District 14.8
MEAP_Math Page 14 of 16 3/2/20099:28 AM

District Name % Proficient Proficiency Status % Difference % FRL FRL Status % DifferenceLIVONIA PUBLIC SCHOOLS 83.0 16.0AMERICAN MONTESSORI ACADEMY 72.3 Below District 10.7 11.9 Below District 4.1
DEARBORN HEIGHTS SCHOOL DISTRICT #7 76.0 53.2UNIVERSAL LEARNING ACADEMY 90.2 Above District 14.2 77.4 Above District 24.2
ECORSE PUBLIC SCHOOL DISTRICT 61.0 95.8DR. CHARLES DREW ACADEMY 41.9 Below District 19.1 88.4 Below District 7.4
DETROIT CITY SCHOOL DISTRICT 50.0 81.6ACADEMY OF DETROIT-WEST 47.4 Below District 2.6 75.2 Below District 6.4AISHA SHULE/WEB DUBOIS PREP. ACADEM 48.7 Below District 1.3 84.7 Above District 3.1ALLEN ACADEMY 54.7 Above District 4.7 72.0 Below District 9.6BLANCHE KELSO BRUCE ACADEMY 25.0 Below District 25.0 100.0 Above District 18.4CENTER FOR LITERACY AND CREATIVITY 62.1 Above District 12.1 61.1 Below District 20.5CESAR CHAVEZ ACADEMY 49.0 Below District 1.0 88.6 Above District 7.0CHANDLER PARK ACADEMY 52.0 Above District 2.0 76.6 Below District 5.0CHARLOTTE FORTEN ACADEMY 8.7 Below District 41.3 60.6 Below District 21.0COLIN POWELL ACADEMY 57.3 Above District 7.3 80.7 Below District 0.9COMMONWEALTH COMMUNITY DEVEL. AC 59.8 Above District 9.8 93.5 Above District 11.9DAVID ELLIS ACADEMY 53.6 Above District 3.6 65.9 Below District 15.7DETROIT ACADEMY OF ARTS AND SCIENCE 61.0 Above District 11.0 72.2 Below District 9.4DETROIT COMMUNITY SCHOOLS 38.8 Below District 11.2 65.3 Below District 16.3DETROIT ENTERPRISE ACADEMY 59.5 Above District 9.5 71.2 Below District 10.4DETROIT MERIT CHARTER ACADEMY 79.8 Above District 29.8 79.5 Below District 2.1DETROIT PREMIER ACADEMY 53.9 Above District 3.9 72.5 Below District 9.1DOVE ACADEMY OF DETROIT 80.8 Above District 30.8 55.8 Below District 25.8EATON ACADEMY 54.7 Above District 4.7 50.7 Below District 30.9EDISON PUBLIC SCHOOL ACADEMY 83.9 Above District 33.9 54.1 Below District 27.5FLAGSHIP CHARTER ACADEMY 34.8 Below District 15.2 79.1 Below District 2.5GEORGE CROCKETT ACADEMY 48.6 Below District 1.4 82.6 Above District 1.0HOPE ACADEMY 48.5 Below District 1.5 76.2 Below District 5.4
MEAP_Math Page 15 of 16 3/2/20099:28 AM

District Name % Proficient Proficiency Status % Difference % FRL FRL Status % DifferenceDETROIT CITY SCHOOL DISTRICT (continued 50.0 81.6HOPE OF DETROIT ACADEMY 64.2 Above District 14.2 92.0 Above District 10.4M.L. KING JR. EDUCATION CENTER 99.1 Above District 49.1 68.0 Below District 13.6MARILYN F. LUNDY ACADEMY 21.7 Below District 28.3 75.4 Below District 6.2MARVIN L. WINANS ACADEMY OF PERFORM 69.0 Above District 19.0 76.3 Below District 5.3MICHIGAN TECHNICAL ACADEMY 49.0 Below District 1.0 73.5 Below District 8.1NATAKI TALIBAH SCHOOLHOUSE OF DETR 66.5 Above District 16.5 52.1 Below District 29.5OLD REDFORD ACADEMY 50.0 Below District 0.0 73.7 Below District 7.9PIERRE TOUSSAINT ACADEMY 40.5 Below District 9.5 93.4 Above District 11.8PLYMOUTH EDUCATIONAL CENTER 78.1 Above District 28.1 74.4 Below District 7.2ROSS HILL ACADEMY 50.8 Above District 0.8 76.4 Below District 5.2STAR INTERNATIONAL ACADEMY 74.1 Above District 24.1 88.2 Above District 6.6TIMBUKTU ACADEMY OF SCIENCE AND TE 47.0 Below District 3.0 93.1 Above District 11.5UNIVERSAL ACADEMY 47.2 Below District 2.8 88.4 Above District 6.8UNIVERSITY PREPARATORY ACADEMY 58.0 Above District 8.0 71.7 Below District 9.9VOYAGEUR ACADEMY 43.0 Below District 7.0 79.5 Below District 2.1WARRENDALE CHARTER ACADEMY 55.6 Above District 5.6 65.4 Below District 16.2WESTON TECHNICAL ACADEMY 42.2 Below District 7.8 54.2 Below District 27.4WOODWARD ACADEMY 48.2 Below District 1.8 79.0 Below District 2.6YMCA SERVICE LEARNING ACADEMY 83.9 Above District 33.9 64.2 Below District 17.4
MEAP_Math Page 16 of 16 3/2/20099:28 AM

District Name % ProficientProficiency
Status % Difference % FRL FRL Status % Difference
ANTRIM COUNTY
Alba Public Schools 31.3 66.2Concord Academy: Antrim 16.7 Below District 14.6 64.6 Below District 1.6
BAY COUNTY
Essexville-Hampton Public Schools 51.5 26.3Bay-Arenac Community High School 36.4 Below District 15.1 27.9 Above District 1.6
BERRIEN COUNTY
Benton Harbor Area Schools 12.6 87.5Countryside Academy 41.4 Above District 28.8 66.4 Below District 21.1
BRANCH COUNTY
Coldwater Community Schools 42.0 38.0Pansophia Academy 12.5 Below District 29.5 75.0 Above District 37.0
CALHOUN COUNTY
Lakeview Sch. District (Calhoun) 47.3 21.5Battle Creek Area Learning Center 3.6 Below District 43.7 62.0 Above District 40.5
Spring 2008 MME ELA Proficiency v. Percent FRL - By School Building
MME_ELA Page 1 of 9 3/2/20099:28 AM

District Name % ProficientProficiency
Status % Difference % FRL FRL Status % Difference
Spring 2008 MME ELA Proficiency v. Percent FRL - By School Building
CHARLEVOIX COUNTY
Boyne Falls Public School District 45.5 43.1Concord Academy:Boyne 44.4 Below District 1.1 3.6 Below District 39.5
Charlevoix Public Schools 65.0 16.0Northwest Academy 0.0 Below District 65.0 47.6 Above District 31.6
CHIPPEWA COUNTY
Brimley Area Schools 65.7 36.6Ojibwe Charter School 33.3 Below District 32.4 69.3 Above District 32.7
DELTA COUNTY
Bark River-Harris School District 42.9 38.1Nah Tah Wahsh Public School Academy 44.4 Above District 1.5 44.0 Above District 5.9
EMMET COUNTY
Public Schools of Petoskey 65.6 19.7Concord Academy - Petoskey 85.7 Above District 20.1 0.0 Below District 19.7
GENESEE COUNTY
Flint City School District 25.0 43.0International Academy of Flint 52.4 Above District 27.4 72.1 Above District 29.1
MME_ELA Page 2 of 9 3/2/20099:28 AM

District Name % ProficientProficiency
Status % Difference % FRL FRL Status % Difference
Spring 2008 MME ELA Proficiency v. Percent FRL - By School Building
GRAND TRAVERSE COUNTY
Traverse City Area Public Schools 63.0 26.0Grand Traverse Academy 52.4 Below District 10.6 21.9 Below District 4.1Traverse City College Preparatory Academy 33.3 Below District 29.7 28.0 Above District 2.0
HILLSDALE COUNTY
Hillsdale Community Schools 53.0 42.0Will Carleton Charter School Academy 45.0 Below District 8.0 5.6 Below District 36.4
ISABELLA COUNTY
Mt. Pleasant City School District 52.0 12.0Morey Charter School 9.1 Below District 42.9 47.3 Above District 35.3
JACKSON COUNTY
Jackson Public Schools 35.0 53.0The da Vinci Institute 33.3 Below District 1.7 54.5 Above District 1.5
KENT COUNTY
Wyoming Public Schools 39.0 50.0Horizons Community High School 15.0 Below District 24.0 59.1 Above District 9.1
Kenowa Hills Public Schools 57.1 23.5West MI Academy of Environmental Science 43.8 Below District 13.3 50.4 Above District 26.9
MME_ELA Page 3 of 9 3/2/20099:28 AM

District Name % ProficientProficiency
Status % Difference % FRL FRL Status % Difference
Spring 2008 MME ELA Proficiency v. Percent FRL - By School Building
Byron Center Public Schools 72.8 16.9Byron Center Charter School 40.0 Below District 32.8 5.3 Below District 11.6
Belding Area School District 41.0 41.0Grattan Academy 12.5 Below District 28.5 7.1 Below District 33.9
Cedar Springs Public Schools 55.0 31.0Creative Technologies Academy 48.0 Below District 7.0 0.0 Below District 31.0
LIVINGSTON COUNTY
Howell Public Schools 56.2 16.9Kensington Woods High School 48.8 Below District 7.4 0.0 Below District 16.9
MACOMB COUNTY
Roseville Community Schools 39.0 42.0Conner Creek Academy East 15.6 Below District 23.4 29.4 Below District 12.6
Warren Consolidated Schools 50.0 32.0Conner Creek Academy 6.3 Below District 43.7 67.1 Above District 35.1
Fraser Public Schools 51.8 19.4Arts Academy in the Woods 38.2 Below District 13.6 8.6 Below District 10.8
MANISTEE COUNTY
Manistee Area Schools 58.4 33.0Casman Alternative Academy 0.0 Below District 58.4 67.9 Above District 34.9
MME_ELA Page 4 of 9 3/2/20099:28 AM
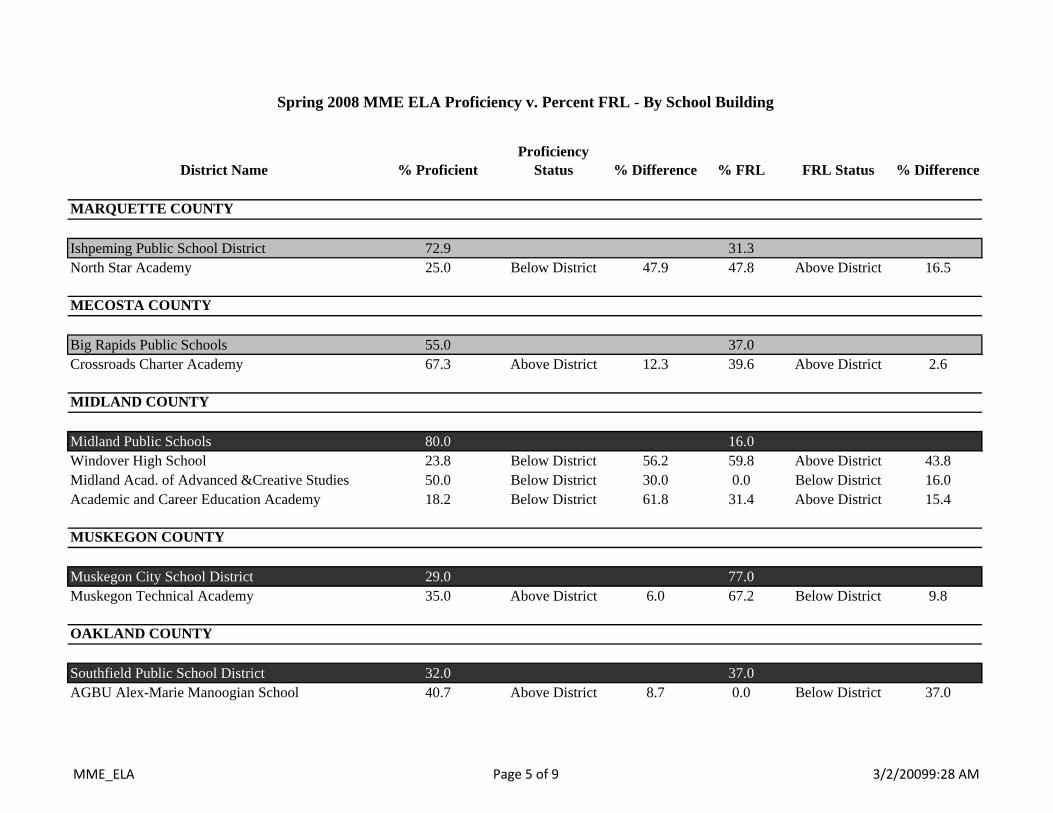
District Name % ProficientProficiency
Status % Difference % FRL FRL Status % Difference
Spring 2008 MME ELA Proficiency v. Percent FRL - By School Building
MARQUETTE COUNTY
Ishpeming Public School District 72.9 31.3North Star Academy 25.0 Below District 47.9 47.8 Above District 16.5
MECOSTA COUNTY
Big Rapids Public Schools 55.0 37.0Crossroads Charter Academy 67.3 Above District 12.3 39.6 Above District 2.6
MIDLAND COUNTY
Midland Public Schools 80.0 16.0Windover High School 23.8 Below District 56.2 59.8 Above District 43.8Midland Acad. of Advanced &Creative Studies 50.0 Below District 30.0 0.0 Below District 16.0Academic and Career Education Academy 18.2 Below District 61.8 31.4 Above District 15.4
MUSKEGON COUNTY
Muskegon City School District 29.0 77.0Muskegon Technical Academy 35.0 Above District 6.0 67.2 Below District 9.8
OAKLAND COUNTY
Southfield Public School District 32.0 37.0AGBU Alex-Marie Manoogian School 40.7 Above District 8.7 0.0 Below District 37.0
MME_ELA Page 5 of 9 3/2/20099:28 AM

District Name % ProficientProficiency
Status % Difference % FRL FRL Status % Difference
Spring 2008 MME ELA Proficiency v. Percent FRL - By School Building
Oak Park City School District 18.3 47.7Academy of Oak Park 9.6 Below District 8.7 73.4 Above District 25.7
Pontiac City School District 14.0 72.0Pontiac Academy for Excellence 12.7 Below District 1.3 91.1 Above District 19.1Life Skills Center of Pontiac 0.0 Below District 14.0 57.7 Below District 14.3
Farmington Public School District 65.0 11.0Oakland International Academy 15.8 Below District 49.2 97.5 Above District 86.5
OTTAWA COUNTY
Holland City School District 59.9 38.4Black River Public School 79.2 Above District 19.3 14.2 Below District 24.2Wavecrest Career Academy 7.4 Below District 52.5 7.0 Below District 31.4
PRESQUE ISLE COUNTY
Onaway Area Community School District 41.0 43.4Presque Isle Academy II 0.0 Below District 41.0 69.1 Above District 25.7
SAGINAW COUNTY
Saginaw City School District 21.0 61.0Saginaw Learn to Earn Academy 7.1 Below District 13.9 63.3 Above District 2.3
MME_ELA Page 6 of 9 3/2/20099:28 AM

District Name % ProficientProficiency
Status % Difference % FRL FRL Status % Difference
Spring 2008 MME ELA Proficiency v. Percent FRL - By School Building
ST. CLAIR COUNTY
Port Huron Area School District 47.0 29.0St. Clair County Learning Academy 0.0 Below District 47.0 76.7 Above District 47.7St. Clair County Intervention Academy 36.4 Below District 10.6 100.0 Above District 71.0
Algonac Community School District 47.9 27.1Blue Water Learning Academy 0.0 Below District 47.9 53.3 Above District 26.2
WASHTENAW COUNTY
Ann Arbor Public Schools 73.0 17.0Central Academy 33.3 Below District 39.7 80.0 Above District 63.0Washtenaw Technical Middle College 79.5 Above District 6.5 0.0 Below District 17.0
WAYNE COUNTY
Dearborn City School District 46.0 49.0Advanced Technology Academy 18.2 Below District 27.8 73.8 Above District 24.8Henry Ford Academy 54.1 Above District 8.1 0.0 Below District 49.0Riverside Academy 20.0 Below District 26.0 92.8 Above District 43.8Clara B. Ford Academy (SDA) 7.4 Below District 38.6 100.0 Above District 51.0
MME_ELA Page 7 of 9 3/2/20099:28 AM

District Name % ProficientProficiency
Status % Difference % FRL FRL Status % Difference
Spring 2008 MME ELA Proficiency v. Percent FRL - By School Building
Detroit City School District 26.0 62.0Casa Richard Academy 6.1 Below District 19.9 78.1 Above District 16.1Aisha Shule/WEB Dubois Prep. Academy 50.0 Above District 24.0 84.7 Above District 22.7Michigan Technical Academy 9.9 Below District 16.1 68.4 Above District 6.4Eaton Academy 7.4 Below District 18.6 50.7 Below District 11.3Michigan Health Academy 13.5 Below District 12.5 59.0 Below District 3.0Cesar Chavez Academy 21.0 Below District 5.0 98.9 Above District 36.9Marvin L. Winans Academy of Performing Arts 17.1 Below District 8.9 74.3 Above District 12.3Detroit Community Schools 8.3 Below District 17.7 65.9 Above District 3.9HEART Academy 37.1 Above District 11.1 52.1 Below District 9.9Detroit Academy of Arts and Sciences 9.4 Below District 16.6 51.2 Below District 10.8Charlotte Forten Academy 4.2 Below District 21.8 60.6 Below District 1.4George Crockett Academy 9.1 Below District 16.9 71.9 Above District 9.9Voyageur Academy 19.7 Below District 6.3 69.7 Above District 7.7Star International Academy 37.7 Above District 11.7 88.2 Above District 26.2Weston Preparatory Academy 15.9 Below District 10.1 54.2 Below District 7.8Ross Hill Academy 8.3 Below District 17.7 54.3 Below District 7.7Universal Academy 26.3 Above District 0.3 88.4 Above District 26.4Allen Academy 7.7 Below District 18.3 72.0 Above District 10.0Old Redford Academy 11.1 Below District 14.9 62.0 Below District 0.0Hope of Detroit Academy 15.4 Below District 10.6 57.6 Below District 4.4Marilyn F. Lundy Academy 14.5 Below District 11.5 75.4 Above District 13.4University Preparatory Academy 18.0 Below District 8.0 65.8 Above District 3.8Blanche Kelso Bruce Academy 0.0 Below District 26.0 67.0 Above District 5.0Life Skills Center of Metropolitan Detroit 6.9 Below District 19.1 65.4 Below District 3.4Covenant House Life Skills Center West 11.1 Below District 14.9 90.2 Above District 28.2Covenant House Life Skills Center East 2.9 Below District 23.1 81.8 Above District 19.8Covenant House Life Skills Center Central 7.4 Below District 18.6 70.2 Above District 8.2
MME_ELA Page 8 of 9 3/2/20099:28 AM

District Name % ProficientProficiency
Status % Difference % FRL FRL Status % Difference
Spring 2008 MME ELA Proficiency v. Percent FRL - By School Building
Huron School District 52.1 20.2Summit Academy North 33.6 Below District 18.5 32.8 Above District 12.6
School District of the City of Inkster 24.5 65.0Cherry Hill School of Performing Arts 10.4 Below District 14.1 74.3 Above District 9.3Academy of Inkster 9.8 Below District 14.7 40.3 Below District 24.7
Taylor School District 30.0 49.0Trillium Academy 22.2 Below District 7.8 33.7 Below District 15.3
Westwood Community Schools 20.0 68.0Academy for Business and Technology 15.6 Below District 4.4 83.1 Above District 15.1
Hamtramck Public Schools 23.3 72.4Frontier International Academy 6.7 Below District 16.6 98.5 Above District 26.1
MME_ELA Page 9 of 9 3/2/20099:28 AM

District Name % ProficientProficiency
Status%
Difference % FRL FRL Status % Difference
ANTRIM COUNTY
Alba Public Schools 25.0 66.2Concord Academy: Antrim 50.0 Above District 25.0 64.6 Below District 1.6
BAY COUNTY
Essexville-Hampton Public Schools 55.9 26.3Bay-Arenac Community High School 18.2 Below District 37.7 27.9 Above District 1.6
BERRIEN COUNTY
Benton Harbor Area Schools 7.4 87.5Countryside Academy 31.0 Above District 23.6 66.4 Below District 21.1
BRANCH COUNTY
Coldwater Community Schools 35.0 38.0Pansophia Academy 31.3 Below District 3.7 75.0 Above District 37.0
CALHOUN COUNTY
Lakeview Sch. District (Calhoun) 40.4 21.5Battle Creek Area Learning Center 10.3 Below District 30.1 62.0 Above District 40.5
Spring 2008 MME Math Proficiency with % Free/Reduced-Price Lunch
MME_Math Page 1 of 9 3/2/20099:32 AM

District Name % ProficientProficiency
Status%
Difference % FRL FRL Status % Difference
Spring 2008 MME Math Proficiency with % Free/Reduced-Price Lunch
CHARLEVOIX COUNTY
Boyne Falls Public School District 50.0 43.1Concord Academy:Boyne 44.4 Below District 5.6 3.6 Below District 39.5
Charlevoix Public Schools 58.0 16.0Northwest Academy 14.3 Below District 43.7 47.6 Above District 31.6
CHIPPEWA COUNTY
Brimley Area Schools 68.6 36.6Ojibwe Charter School 0.0 Below District 68.6 69.3 Above District 32.7
DELTA COUNTY
Bark River-Harris School District 42.9 38.1Nah Tah Wahsh Public School Academy 22.2 Below District 20.7 44.0 Above District 5.9
EMMET COUNTY
Public Schools of Petoskey 58.8 19.7Concord Academy - Petoskey 57.1 Below District 1.7 0.0 Below District 19.7
GENESEE COUNTY
Flint City School District 17.0 43.0International Academy of Flint 42.9 Above District 25.9 72.1 Above District 29.1
MME_Math Page 2 of 9 3/2/20099:32 AM

District Name % ProficientProficiency
Status%
Difference % FRL FRL Status % Difference
Spring 2008 MME Math Proficiency with % Free/Reduced-Price Lunch
GRAND TRAVERSE COUNTY
Traverse City Area Public Schools 59.0 26.0Grand Traverse Academy 42.9 Below District 16.1 21.9 Below District 4.1Traverse City College Preparatory Academy 25.0 Below District 34.0 28.0 Above District 2.0
HILLSDALE COUNTY
Hillsdale Community Schools 48.0 42.0Will Carleton Charter School Academy 25.0 Below District 23.0 5.6 Below District 36.4
ISABELLA COUNTY
Mt. Pleasant City School District 48.0 12.0Morey Charter School 0.0 Below District 48.0 47.3 Above District 35.3
JACKSON COUNTY
Jackson Public Schools 31.0 53.0The da Vinci Institute 21.4 Below District 9.6 54.5 Above District 1.5
KENT COUNTY
Wyoming Public Schools 31.0 50.0Horizons Community High School 15.0 Below District 16.0 59.1 Above District 9.1
Kenowa Hills Public Schools 59.7 23.5West MI Academy of Environmental Science 50.0 Below District 9.7 50.4 Above District 26.9
MME_Math Page 3 of 9 3/2/20099:32 AM

District Name % ProficientProficiency
Status%
Difference % FRL FRL Status % Difference
Spring 2008 MME Math Proficiency with % Free/Reduced-Price Lunch
Byron Center Public Schools 67.1 16.9Byron Center Charter School 33.3 Below District 33.8 5.3 Below District 11.6
Belding Area School District 41.0 41.0Grattan Academy 25.0 Below District 16.0 7.1 Below District 33.9
Cedar Springs Public Schools 55.0 31.0Creative Technologies Academy 48.0 Below District 7.0 0.0 Below District 31.0
LIVINGSTON COUNTY
Howell Public Schools 53.9 16.9Kensington Woods High School 39.0 Below District 14.9 0.0 Below District 16.9
MACOMB COUNTY
Roseville Community Schools 29.0 42.0Conner Creek Academy East 7.8 Below District 21.2 29.4 Below District 12.6
Warren Consolidated Schools 42.0 32.0Conner Creek Academy 0.0 Below District 42.0 67.1 Above District 35.1
Fraser Public Schools 42.6 19.4Arts Academy in the Woods 24.2 Below District 18.4 8.6 Below District 10.8
MME_Math Page 4 of 9 3/2/20099:32 AM

District Name % ProficientProficiency
Status%
Difference % FRL FRL Status % Difference
Spring 2008 MME Math Proficiency with % Free/Reduced-Price Lunch
MANISTEE COUNTY
Manistee Area Schools 41.7 33.0Casman Alternative Academy 6.3 Below District 35.4 67.9 Above District 34.9
MARQUETTE COUNTY
Ishpeming Public School District 64.4 31.3North Star Academy 16.7 Below District 47.7 47.8 Above District 16.5
MECOSTA COUNTY
Big Rapids Public Schools 58.0 37.0Crossroads Charter Academy 62.5 Above District 4.5 39.6 Above District 2.6
MIDLAND COUNTY
Midland Public Schools 77.0 16.0Windover High School 22.7 Below District 54.3 59.8 Above District 43.8Midland Academy of Advanced and Creative Studies 41.7 Below District 35.3 0.0 Below District 16.0Academic and Career Education Academy 0.0 Below District 77.0 31.4 Above District 15.4
MUSKEGON COUNTY
Muskegon City School District 23.0 77.0Muskegon Technical Academy 30.0 Above District 7.0 67.2 Below District 9.8
MME_Math Page 5 of 9 3/2/20099:32 AM

District Name % ProficientProficiency
Status%
Difference % FRL FRL Status % Difference
Spring 2008 MME Math Proficiency with % Free/Reduced-Price Lunch
OAKLAND COUNTY
Southfield Public School District 16.0 37.0AGBU Alex-Marie Manoogian School 40.7 Above District 24.7 0.0 Below District 37.0
Oak Park City School District 7.7 47.7Academy of Oak Park 3.8 Below District 3.9 73.4 Above District 25.7
Pontiac City School District 6.0 72.0Pontiac Academy for Excellence 12.5 Above District 6.5 91.1 Above District 19.1Life Skills Center of Pontiac 0.0 Below District 6.0 57.7 Below District 14.3
Farmington Public School District 56.0 11.0Oakland International Academy 15.0 Below District 41.0 97.5 Above District 86.5
OTTAWA COUNTY
Holland City School District 52.2 38.4Black River Public School 71.7 Above District 19.5 14.2 Below District 24.2Wavecrest Career Academy 3.2 Below District 49.0 7.0 Below District 31.4
MME_Math Page 6 of 9 3/2/20099:32 AM

District Name % ProficientProficiency
Status%
Difference % FRL FRL Status % Difference
Spring 2008 MME Math Proficiency with % Free/Reduced-Price Lunch
PRESQUE ISLE COUNTY
Onaway Area Community School District 43.6 43.4Presque Isle Academy II 0.0 Below District 43.6 69.1 Above District 25.7
SAGINAW COUNTY
Saginaw City School District 14.0 61.0Saginaw Learn to Earn Academy 0.0 Below District 14.0 63.3 Above District 2.3
ST. CLAIR COUNTY
Port Huron Area School District 40.0 29.0St. Clair County Learning Academy 0.0 Below District 40.0 76.7 Above District 47.7St. Clair County Intervention Academy 18.2 Below District 21.8 100.0 Above District 71.0
Algonac Community School District 50.5 27.1Blue Water Learning Academy 0.0 Below District 50.5 53.3 Above District 26.2
WASHTENAW COUNTY
Ann Arbor Public Schools 71.0 17.0Central Academy 44.4 Below District 26.6 80.0 Above District 63.0Washtenaw Technical Middle College 82.4 Above District 11.4 0.0 Below District 17.0
MME_Math Page 7 of 9 3/2/20099:32 AM

District Name % ProficientProficiency
Status%
Difference % FRL FRL Status % Difference
Spring 2008 MME Math Proficiency with % Free/Reduced-Price Lunch
WAYNE COUNTY
Dearborn City School District 41.0 49.0Advanced Technology Academy 13.8 Below District 27.2 73.8 Above District 24.8Henry Ford Academy 33.9 Below District 7.1 0.0 Below District 49.0Riverside Academy 16.0 Below District 25.0 92.8 Above District 43.8Clara B. Ford Academy (SDA) 0.0 Below District 41.0 100.0 Above District 51.0
Detroit City School District 14.0 62.0Casa Richard Academy 2.9 Below District 11.1 78.1 Above District 16.1Aisha Shule/WEB Dubois Prep. Academy School 15.0 Above District 1.0 84.7 Above District 22.7Michigan Technical Academy 2.7 Below District 11.3 68.4 Above District 6.4Eaton Academy 14.8 Above District 0.8 50.7 Below District 11.3Michigan Health Academy 8.1 Below District 5.9 59.0 Below District 3.0Cesar Chavez Academy 16.0 Above District 2.0 98.9 Above District 36.9Marvin L. Winans Academy of Performing Arts 7.1 Below District 6.9 74.3 Above District 12.3Detroit Community Schools 0.8 Below District 13.2 65.9 Above District 3.9HEART Academy 8.6 Below District 5.4 52.1 Below District 9.9Detroit Academy of Arts and Sciences 3.7 Below District 10.3 51.2 Below District 10.8Charlotte Forten Academy 0.0 Below District 14.0 60.6 Below District 1.4George Crockett Academy 9.1 Below District 4.9 71.9 Above District 9.9Voyageur Academy 6.6 Below District 7.4 69.7 Above District 7.7Star International Academy 35.8 Above District 21.8 88.2 Above District 26.2Weston Preparatory Academy 3.2 Below District 10.8 54.2 Below District 7.8Ross Hill Academy 0.0 Below District 14.0 54.3 Below District 7.7Universal Academy 31.6 Above District 17.6 88.4 Above District 26.4Allen Academy 0.0 Below District 14.0 72.0 Above District 10.0
MME_Math Page 8 of 9 3/2/20099:32 AM

District Name % ProficientProficiency
Status%
Difference % FRL FRL Status % Difference
Spring 2008 MME Math Proficiency with % Free/Reduced-Price Lunch
Detroit City School District (continued) 14.0 62.0Old Redford Academy 5.6 Below District 8.4 62.0 Below District 0.0Hope of Detroit Academy 0.0 Below District 14.0 57.6 Below District 4.4Marilyn F. Lundy Academy 5.5 Below District 8.5 75.4 Above District 13.4University Preparatory Academy 7.0 Below District 7.0 65.8 Above District 3.8Blanche Kelso Bruce Academy 0.0 Below District 14.0 67.0 Above District 5.0Life Skills Center of Metropolitan Detroit 2.7 Below District 11.3 65.4 Above District 3.4Covenant House Life Skills Center West 6.1 Below District 7.9 90.2 Above District 28.2Covenant House Life Skills Center East 0.0 Below District 14.0 81.8 Above District 19.8Covenant House Life Skills Center Central 0.0 Below District 14.0 70.2 Above District 8.2
Huron School District 38.9 20.2Summit Academy North 22.2 Below District 16.7 32.8 Above District 12.6
School District of the City of Inkster 13.3 65.0Cherry Hill School of Performing Arts 1.5 Below District 11.8 74.3 Above District 9.3Academy of Inkster 3.8 Below District 9.5 40.3 Below District 24.7
Taylor School District 20.0 49.0Trillium Academy 21.1 Above District 1.1 33.7 Below District 15.3
Westwood Community Schools 14.0 68.0Academy for Business and Technology 6.3 Below District 7.7 83.1 Above District 15.1
Hamtramck Public Schools 18.5 72.4Frontier International Academy 3.3 Below District 15.2 98.5 Above District 26.1
MME_Math Page 9 of 9 3/2/20099:32 AM

58 2008 PSA Report to the Legislature
Appendix D
2007-08 PSA Update

PSA STATUS UPDATE
PSAs Opening Fall 2008
Authorizer PSA Proposed Location
Est. Date of Opening
Grades Offered Status on Authorizing Contract
Dream Academy (Leona) Benton Harbor Fall 2008 9-12 September 2008 opening; district code: 11905 building code: 09912
Bay Mills CC
Vista Meadows (edtec central, LLC)
Dearborn Fall 2008 4-12 September 2008 opening; district code: 82716 building code: 09906
Ferris State University
Lighthouse Academy (SDA—Wedgwood Christian Services)
Grand Rapids Fall 2008 4-12 September 2008 opening; district code: 41922 building code: 09924
University Preparatory Science and Math (New Urban Learning)
Detroit Fall 2008 6-8
Part 6c Urban High School Academy district code: 82701 building code: 09907
Reach Academy (National Heritage Academies)
Roseville Fall 2008 K-5 September 2008 opening; district code: 50912 building code: 09905
Grand Valley State University
University Preparatory Academy (New Urban Learning) not grant eligible
Detroit Fall 2008 K-12 Merger of existing PSA with Public School Academies of Detroit (PSAD) as a Part 6c Urban High School Academy. New district code: 82702 Building codes: 09908 – K-5 09887 – K-5 09888 – 6-8 09889 – 9-12
Kalamazoo RESA
Youth Advancement Academy (SDA) Kalamazoo Fall 2008 9-12 September 2008 opening; district code: 39906 building code: 09913

60 2008 PSA Report to the Legislature
PSAs Intending to Open Fall 2009
Authorizer PSA Proposed Location
Est. Date of Opening
Grades Offered Status on Authorizing Contract
Muskegon Public Schools
International School of Muskegon
Muskegon Fall 2009 K-8
Contract not yet received at MDE
Henry Ford Academy of Creative Studies
Detroit Fall 2009 9-12 Contract not yet received at MDE
Achieve Academy (NHA) Canton Fall 2009 K-8 Contract not yet received at MDE
Grand Valley State University
Michigan Mathematics and Science Academy (Concept Schools)
Metro Detroit Fall 2009 5-7 Contract not yet received at MDE
Oakland University
Four Corners Royal Oak Fall 2009 PreK-8
Contract not yet received at MDE
Location Changes for Fall 2008
District Code
PSA Description of changes
82998 ACE Academy Closing Eliot Center Site (09824) – awaiting contract amendment 63914 Advanced Technology Academy 7265 Calhoun Dearborn 48126 (08707) will retain grades K-8; new site 4800 Oakman Blvd; Dearborn
(awaiting Cert of Occupancy) will house 9-12 47902 Charyl Stockwell Academy Adding new site: 2100 Progressive Drive; Hartland (awaiting contract amendment) 82914 Colin Powell Academy Adding new site: 19360 Harper Avenue; Harper Woods (awaiting contract amendment) 50902 Conner Creek Academy East 16911 Eastland Roseville (08726) will retain grades K-6.;
Grades 7-12 will be housed at new site :13 Mile & Ryan Roads, Warren (awaiting contract amendment.) Closing two sites: 29695 Gratiot Roseville (09310), and 26200 Ridgemont Roseville (09089)
41905 Excel Charter Academy
Adding new site: 624 52nd Street, SE; Kentwood, MI 49548 (awaiting Certificate of Occupancy). Site will be named Grand River Preparatory High School
82997 Flagship Charter Academy New mailing address 13661 Wisconsin, Detroit. (retaining same building code) The academy has not moved from its physical location. – awaiting contract amendment
47901 Kensington Woods High School New mailing address 3700 Cleary Drive, Howell. (retaining same building code) The academy has not moved from its physical location.
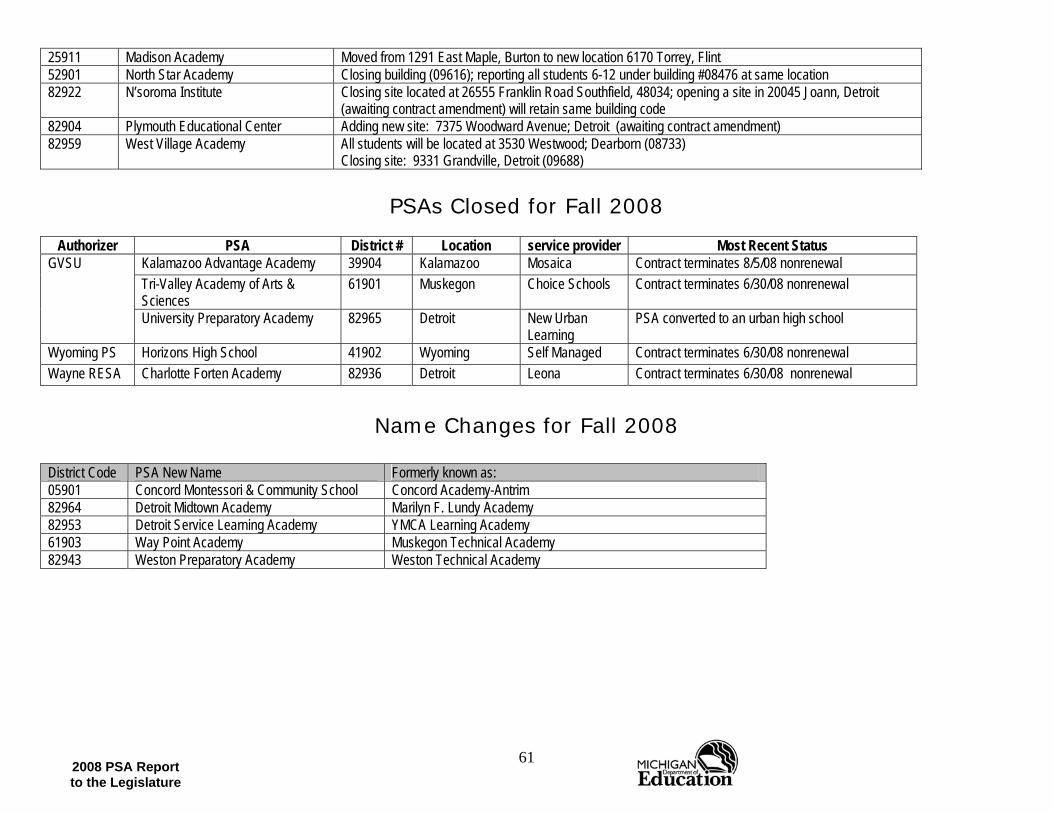
61 2008 PSA Report to the Legislature
25911 Madison Academy Moved from 1291 East Maple, Burton to new location 6170 Torrey, Flint 52901 North Star Academy Closing building (09616); reporting all students 6-12 under building #08476 at same location 82922 N’soroma Institute Closing site located at 26555 Franklin Road Southfield, 48034; opening a site in 20045 Joann, Detroit
(awaiting contract amendment) will retain same building code 82904 Plymouth Educational Center Adding new site: 7375 Woodward Avenue; Detroit (awaiting contract amendment) 82959 West Village Academy All students will be located at 3530 Westwood; Dearborn (08733)
Closing site: 9331 Grandville, Detroit (09688)
PSAs Closed for Fall 2008
Authorizer PSA District # Location service provider Most Recent Status Kalamazoo Advantage Academy 39904 Kalamazoo Mosaica Contract terminates 8/5/08 nonrenewal Tri-Valley Academy of Arts & Sciences
61901 Muskegon Choice Schools Contract terminates 6/30/08 nonrenewal GVSU
University Preparatory Academy 82965 Detroit New Urban Learning
PSA converted to an urban high school
Wyoming PS Horizons High School 41902 Wyoming Self Managed Contract terminates 6/30/08 nonrenewal Wayne RESA Charlotte Forten Academy 82936 Detroit Leona Contract terminates 6/30/08 nonrenewal
Name Changes for Fall 2008
District Code PSA New Name Formerly known as: 05901 Concord Montessori & Community School Concord Academy-Antrim 82964 Detroit Midtown Academy Marilyn F. Lundy Academy 82953 Detroit Service Learning Academy YMCA Learning Academy 61903 Way Point Academy Muskegon Technical Academy 82943 Weston Preparatory Academy Weston Technical Academy

62 2008 PSA Report to the Legislature
Service Provider Changes for Fall 2008
District Code PSA Former Education service provider: New Education service provider: 25908 Academy of Flint Charter School Administrative Services (CSAS) Varner & Associates 82963 George Washington Carver Academy Evans Solutions Transitions Consultants, LLC 82907 Michigan Technical Academy Helicon Associates Midwest Management Group Inc. 82959 West Village Academy American Institutional Management Services Transitions Consultants, LLC
Grade Level Changes for Fall 2008
District Code PSA Name Grade Level Changes Resulting 08-09 Grade Level Offered 63914 Advanced Technology Academy Add PK PK-12 13901 Arbor Academy Delete PK K-6 09902 Bay County Public School Academy Add PK PK-6 82983 Bridge Academy Add PK PK-8 63917 Bradford Academy Add Grade 10 K-10 82923 Chandler Park Academy Add Grade 10 K-10 47902 Charyl Stockwell Academy Add Grade 9 K-9 44901 Chatfield School Add Grades 7 and 8 K-8 41916 Cross Creek Charter Academy Add Grade 9 K-9 54901 Crossroads Charter Academy Add PK PK-12 82925 Detroit Community Schools Add Grade 8 K-12 82964 Detroit Midtown Academy Delete Grade 6 7-12 82988 Discovery Arts & Technology PSA Add Grade 7 K-7 70906 Eagles Crest Charter Academy Add PK PK-8 – awaiting contract amendment 82915 Eaton Academy Add Grade 7 K-7, 9-12 41905 Excel Charter Academy Add Grade 9 K-9 82997 Flagship Charter Academy Add Grade 6 K-6 82986 Hanley International Academy Add Grade 8 K-8 74903 Landmark Academy Add Grade 10 K-10 25911 Madison Academy Add Grade 9 K-9 13903 Marshall Academy Add Grade 11 K-11

63 2008 PSA Report to the Legislature
District Code PSA Name Grade Level Changes Resulting 08-09 Grade Level Offered 50906 Merritt Academy Add Grade 11 K-11 82907 Michigan Technical Academy Add PK PK-12 – awaiting contract amendment 39903 Oakland Academy Delete PK K-6 82904 Plymouth Educational Center Add Grade 9 K-9 25910 Richfield Public School Academy Add PK PK-8 73908 Saginaw Preparatory Academy Add Grade 8 PK-8 61904 Three Oaks Public School Academy Deleting Grades 9-10 K-8 82973 Trillium Academy Add Grade 12 K-12 81907 Victory Academy Charter School Delete Grade 6 K-5 82959 West Village Academy Deleting Grades 9-10 K-8 82943 Weston Preparatory Academy Deleting Grade 8 K-7, 9-12

64 2008 PSA Report to the Legislature
PSAs Opened Fall 2007 Authorizer PSA Location Opening Date Grades Offered Status on Authorizing Contract
International Academy of Saginaw (SABIS) 1944 Iowa Ave, Saginaw, MI 48601
Saginaw Fall 2007 K-3 District Code: 73912 Building Code: 09784
Bay Mills CC
Traverse City College Preparatory Academy (Leona) 1402 Carlisle Road Traverse City, MI 49686
Traverse City Fall 2007 9-12 District Code: 28903 Building Code: 09821
Ferris State University
Clara B. Ford Academy (edtech) Strict Discipline Academy 20651 West Warren Avenue Dearborn Heights, MI 48127
Dearborn Heights
Fall 2007 4-12 District Code: 82996 Building Code: 09787
Flagship Charter Academy (NHA) 8735 Schoolcraft Road Detroit, MI 48238
Detroit (NW)
Fall 2007 K-5 District Code: 82997 Building Code: 09785
Central Michigan University
ACE Academy (SDA) 330 Glendale Ave Highland Park, MI 48203 3500 John R Detroit, MI 48201
Highland Park & Detroit
Fall 2007 6-12 District Code: 82998 Building Codes: 09823 (H Park) 09824 (Detroit)
PSAs Closed for Fall 2007
Authorizer PSA District # Location service provider 2007-08 FTE Enrollment
Most Recent Status
Oakland University
Academy of Michigan 63908 Oak Park CSAS 521 Removed from School Code Master 7/2/07
CMU Sankofa Shule 33903 Lansing Self-managed 82 Removed from School Code Master 7/2/07 Gateway Academy 41913 Grand Rapids Self-managed 126 Removed from School Code Master 7/5/07 GVSU Lakeshore Academy 64901 Hart Self-managed 105 Removed from School Code Master 7/2/07

65 2008 PSA Report to the Legislature
Name Changes for Fall 2007 District Code PSA New Name Formerly known as: 37902 Morey Public School Academy Morey Charter School
Location Changes for Fall 2007 District Code
Building Code PSA Formerly located at: Now located at:
82922 07606 Nsoroma Institute 22180 Parklawn, Oak Park 26555 Franklin Road, Southfield 63912 09830 Oakland International Academy New site 8228 Conant Street, Detroit 73905 08284 Saginaw County Transition Academy 919 Veterans Memorial Parkway, Saginaw 1000 Tuscola Street, Saginaw 82982 09827 Universal Learning Academy New site 24480 George Street, Dearborn Heights 70901 08212 Walden Green Montessori 17771 W Spring Lake Rd, Spring Lake 17339 Roosevelt, Ferrysburg
Service Provider Changes for Fall 2007 District Code
PSA Former Education service provider: New Education service provider:
82981 American Montessori Academy Helicon Associates CS Partners 82984 Dr. Charles Drew Helicon Associates Varner & Associates 63921 Crescent Academy Helicon Associates CS Partners
Grade Level Changes for Fall 2007
District Code PSA Name Grade Level Changes Resulting 07-08 Grade Level Offered 82981 American Montessori Academy Add Grade 6 K-6 04901 Bingham Academy Add Grade 6 K-6 70904 Black River Public School Add Grade K K-12 63917 Bradford Academy Add Grade 9 K-9 82980 Business, Entrepreneurship, Science & Tech Add Grade 8 K-8 82923 Chandler Park Academy Add Grade 9 K-9 82936 Charlotte Forten Academy Deleting Grade 5-6 7-12 82919 Commonwealth Com. Development Acad Add Grade 8 K-8 82925 Detroit Community Schools Add Grade 7 K-7, 9-12 82979 Detroit Enterprise Academy Add Grade 8 K-8 82985 Detroit Premier Academy Add Grade 8 K-8
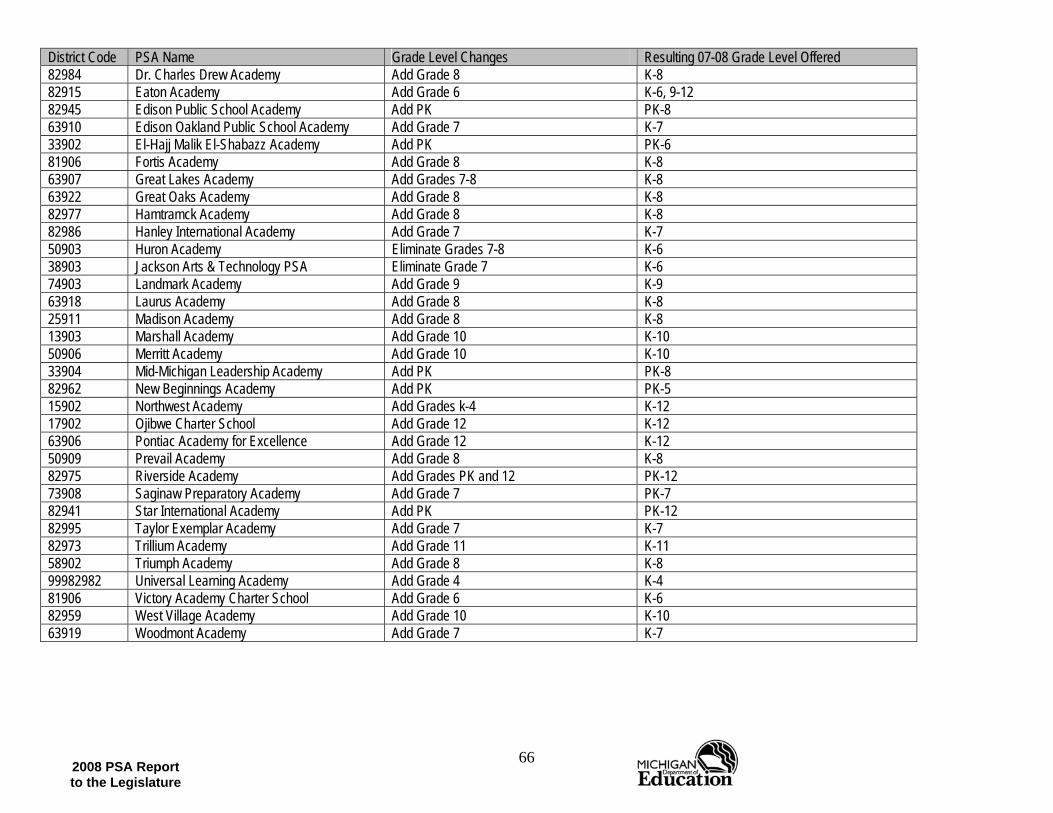
66 2008 PSA Report to the Legislature
District Code PSA Name Grade Level Changes Resulting 07-08 Grade Level Offered 82984 Dr. Charles Drew Academy Add Grade 8 K-8 82915 Eaton Academy Add Grade 6 K-6, 9-12 82945 Edison Public School Academy Add PK PK-8 63910 Edison Oakland Public School Academy Add Grade 7 K-7 33902 El-Hajj Malik El-Shabazz Academy Add PK PK-6 81906 Fortis Academy Add Grade 8 K-8 63907 Great Lakes Academy Add Grades 7-8 K-8 63922 Great Oaks Academy Add Grade 8 K-8 82977 Hamtramck Academy Add Grade 8 K-8 82986 Hanley International Academy Add Grade 7 K-7 50903 Huron Academy Eliminate Grades 7-8 K-6 38903 Jackson Arts & Technology PSA Eliminate Grade 7 K-6 74903 Landmark Academy Add Grade 9 K-9 63918 Laurus Academy Add Grade 8 K-8 25911 Madison Academy Add Grade 8 K-8 13903 Marshall Academy Add Grade 10 K-10 50906 Merritt Academy Add Grade 10 K-10 33904 Mid-Michigan Leadership Academy Add PK PK-8 82962 New Beginnings Academy Add PK PK-5 15902 Northwest Academy Add Grades k-4 K-12 17902 Ojibwe Charter School Add Grade 12 K-12 63906 Pontiac Academy for Excellence Add Grade 12 K-12 50909 Prevail Academy Add Grade 8 K-8 82975 Riverside Academy Add Grades PK and 12 PK-12 73908 Saginaw Preparatory Academy Add Grade 7 PK-7 82941 Star International Academy Add PK PK-12 82995 Taylor Exemplar Academy Add Grade 7 K-7 82973 Trillium Academy Add Grade 11 K-11 58902 Triumph Academy Add Grade 8 K-8 99982982 Universal Learning Academy Add Grade 4 K-4 81906 Victory Academy Charter School Add Grade 6 K-6 82959 West Village Academy Add Grade 10 K-10 63919 Woodmont Academy Add Grade 7 K-7

Michigan State Board of Education
Kathleen N. Straus, President Detroit
John C. Austin, Vice President
Ann Arbor
Carolyn L. Curtin, Secretary Evart
Marianne Yared McGuire, Treasurer
Detroit
Nancy Danhof, NASBE Delegate East Lansing
Elizabeth W. Bauer
Birmingham
Reginald M. Turner Detroit
Casandra Ulbrich Rochester Hills
Governor Jennifer M. Granholm
Ex Officio
Michael P. Flanagan, Chairman Superintendent of Public Instruction
Ex Officio
Sally Vaughn, Ph.D. Deputy State Superintendent/Chief Academic Officer
Betty Underwood, Director
Office of School Improvement