michael durante western reserve 2009 review and 2010 outlook
DESCRIPTION
Michael Durante Western Reserve 2009 review and 2010 outlookTRANSCRIPT
2009 Review & 2010 Outlook January 2010
“The Error of Pessimism is born the Size of a Full-Grown Man…”
- James Grant (via Pigou) Dear Partners, A year ago amid the throws of the financial crisis, we referred to the then existing market opportunity as “once in a career.” It was. The transition to new leadership in Washington created a historic valuation opportunity. This was a function of both procrastination and politicizing on several fronts which exaggerated and magnified uncertainty. We will address just two. First, the Congress having delayed taking action to deal with the absurdity of mark-to-market accounting (MTM) until the spring of 2009 escalated the financial crisis (crisis NOT to be confused with recession). The devastation of MTM on the financial industry and the stock market resulted in trillions of dollars of “unintended” loss as an apparent consequence of necessary delay until after an election. TARP was a direct necessity and function of this delay. The legislature finally took-up the matter in a congressional hearing on March 12, 2009. The stock market bottomed on March 9…the day the House Financial Services Committee announced the hearing. Western Reserve senior advisor Bob McTeer, former President of the Federal Reserve Bank of Dallas, provided key expert testimony to the March 12th event. Secondly, TARP rules were highly politicized in early 2009 and resulted in the “stress test” for larger banks, most of whom, were coerced to take TARP. A market panic ensued immediately over concern that TARP was being abused by the new administration as a “back-door” ploy to nationalize the U.S. financial system. The independent Federal Reserve Board stepped-in and defended it’s “turf” under the Bank Holding Company Act of 1956. The Fed completed the “stress test” and today bank TARP is a smashing success. Other, non bank uses of TARP well… not so much. Financial markets stabilized and now slowly and steadily are convalescing. The architect of TARP has rightfully been named TIME’s Person-of-the-Year, but the psychological damage to the market and the economy (including record cash hoarding economy wide) has left wide open the window of opportunity still. Investment flows into domestic equities remain deficient at best and U.S. financial services stocks remain
2
widely under owned and heavily shorted despite their fundamentals recovering strongly and their valuations remaining compelling. Western Reserve Master Fund (“Fund”) since inception has produced over 20% annualized alpha when compared with any financial services index and has produced profits both long and short. We believe the Fund’s best years lie ahead. The opportunity of a career remains clear and present. For a comprehensive performance summary…See – appendix at the end of this letter. The approach which has dominated our stock selection in 2009 and continues as we enter 2010 incorporates using both strict regulatory analyses (CAMEL e.g.) in assessing which financial firms to invest in as well as good ole fashioned deep value investing. We believe market participants will shift from the liquidity and capital worries that plagued much of 2009 towards earnings power and profit recovery discounting in 2010 and beyond… Our own fundamental research has identified for some time now a consistent escalation in underlying profit power (cash flow) across the financial services sector, while erosion remains far more endemic in more widely owned sectors of the market including manufacturing, commodities and durables. So, high quality U.S. finance and services stocks remain the cheapest stocks found anywhere in the world. There are outstanding opportunities both long and short for fundamentally driven investors as price disparity relative to valuations and fundamentals remain very wide across disparate industries. Financial Crisis Update Miss-priced credit, particularly in the areas of housing and private equity/leveraged loans (LBO’s), fostered our current state of economic malaise. However, it was poorly designed new credit accounting (MTM) and the irrational application therein which created the actual “financial crisis” and with it the multi-decade buying opportunity that we opined was developing over the past year. To the surprise of most investors, the intentionally concentrated home price index – the Case-Schiller 20 City Composite – declined only a modest 3% in 2009. The base-case of the Federal Reserve’s “stress test” called for a 14% decline and the adverse case a 25% decline by comparison. Thus, the current environment is not nearly as bad as the worst-case scenario which was discounted into financial stocks at their lows. Therefore, it is no surprise that financial services stocks have led the rally since the March 2009 lows. The current breather that financial stocks are taking stems mostly from the second wave of TARP repayments and the renewed attacks from the current administration (“banker’s tax” e.g.). This just provides yet another buying opportunity. Credit, on balance, is unquestionably outperforming the once awful assumptions, in large part, because expectations were artificially grim due to MTM. To the Fed’s credit, they told investors that the assumptions in the “stress test” were set too high purposely and few believed them. So, investors should not be shocked at the faster-than-anticipated recovery in credit costs and earnings for banks. If the White House has noticed the
3
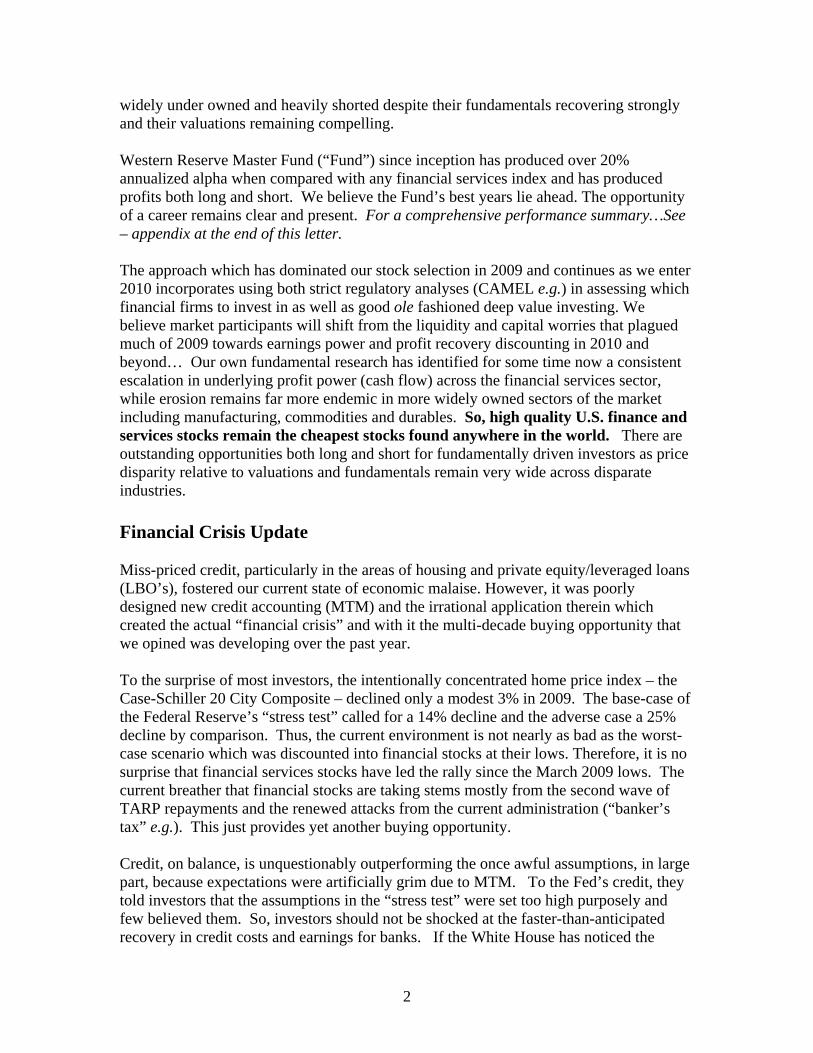
“obscene” profits recovery at banks, then why haven’t more investors? We find that curious to say the least.
Losses on Bank-held Securitized Loans were Artificial High
-$20bn
$0bn
$20bn
$40bn
$60bn
$80bn
$100bn
Oct
-96
Sep-
97
Aug-
98
Jul-9
9
Jun-
00
May
-01
Apr-
02
Mar
-03
Feb-
04
Jan-
05
Dec
-05
Nov
-06
Oct
-07
Sep-
08
Aug-
09
US
Bank
s U
nrea
lized
Sec
uritie
s Lo
sses
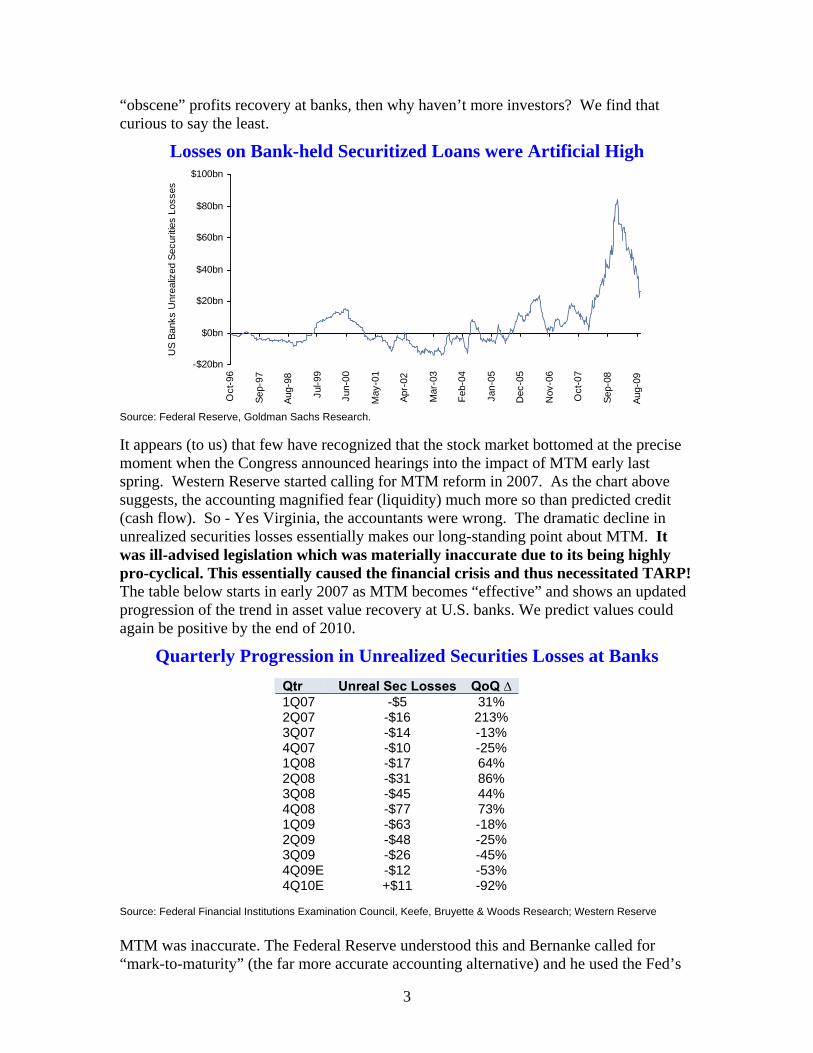
Source: Federal Reserve, Goldman Sachs Research. It appears (to us) that few have recognized that the stock market bottomed at the precise moment when the Congress announced hearings into the impact of MTM early last spring. Western Reserve started calling for MTM reform in 2007. As the chart above suggests, the accounting magnified fear (liquidity) much more so than predicted credit (cash flow). So - Yes Virginia, the accountants were wrong. The dramatic decline in unrealized securities losses essentially makes our long-standing point about MTM. It was ill-advised legislation which was materially inaccurate due to its being highly pro-cyclical. This essentially caused the financial crisis and thus necessitated TARP! The table below starts in early 2007 as MTM becomes “effective” and shows an updated progression of the trend in asset value recovery at U.S. banks. We predict values could again be positive by the end of 2010.
Quarterly Progression in Unrealized Securities Losses at Banks
Qtr Unreal Sec Losses QoQ ∆1Q07 -$5 31% 2Q07 -$16 213% 3Q07 -$14 -13% 4Q07 -$10 -25% 1Q08 -$17 64% 2Q08 -$31 86% 3Q08 -$45 44% 4Q08 -$77 73% 1Q09 -$63 -18% 2Q09 -$48 -25% 3Q09 -$26 -45% 4Q09E -$12 -53% 4Q10E +$11 -92%
Source: Federal Financial Institutions Examination Council, Keefe, Bruyette & Woods Research; Western Reserve MTM was inaccurate. The Federal Reserve understood this and Bernanke called for “mark-to-maturity” (the far more accurate accounting alternative) and he used the Fed’s
4
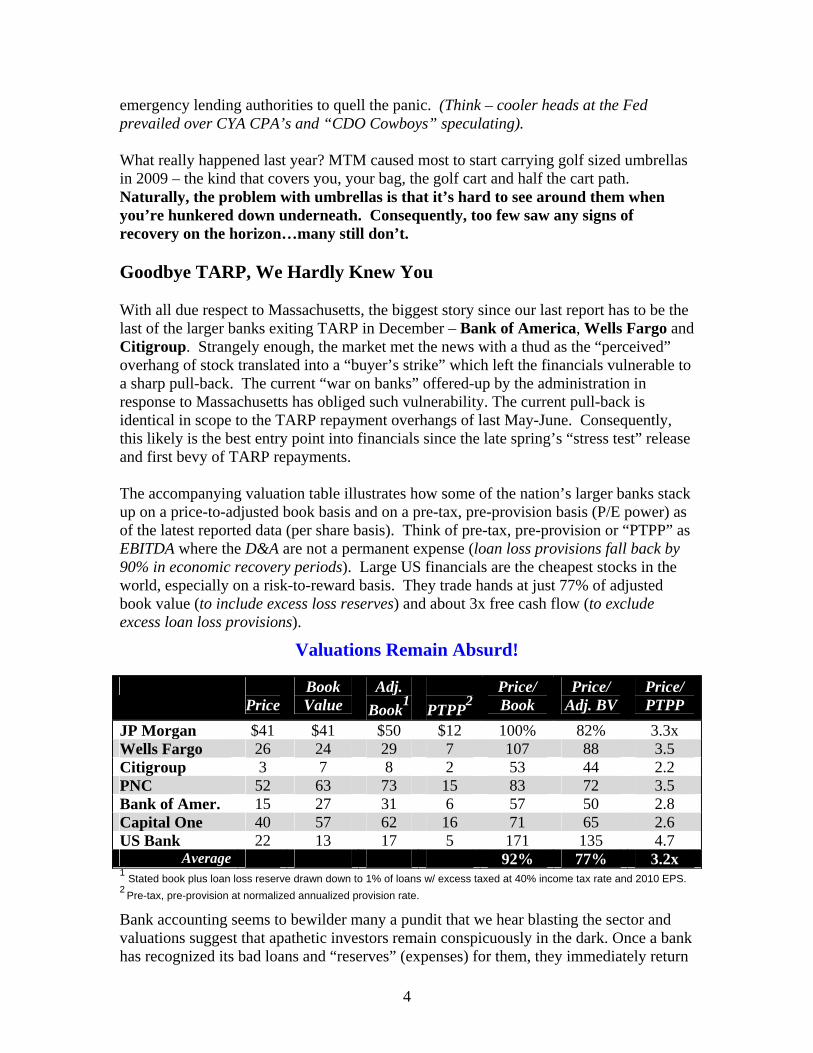
emergency lending authorities to quell the panic. (Think – cooler heads at the Fed prevailed over CYA CPA’s and “CDO Cowboys” speculating). What really happened last year? MTM caused most to start carrying golf sized umbrellas in 2009 – the kind that covers you, your bag, the golf cart and half the cart path. Naturally, the problem with umbrellas is that it’s hard to see around them when you’re hunkered down underneath. Consequently, too few saw any signs of recovery on the horizon…many still don’t. Goodbye TARP, We Hardly Knew You With all due respect to Massachusetts, the biggest story since our last report has to be the last of the larger banks exiting TARP in December – Bank of America, Wells Fargo and Citigroup. Strangely enough, the market met the news with a thud as the “perceived” overhang of stock translated into a “buyer’s strike” which left the financials vulnerable to a sharp pull-back. The current “war on banks” offered-up by the administration in response to Massachusetts has obliged such vulnerability. The current pull-back is identical in scope to the TARP repayment overhangs of last May-June. Consequently, this likely is the best entry point into financials since the late spring’s “stress test” release and first bevy of TARP repayments. The accompanying valuation table illustrates how some of the nation’s larger banks stack up on a price-to-adjusted book basis and on a pre-tax, pre-provision basis (P/E power) as of the latest reported data (per share basis). Think of pre-tax, pre-provision or “PTPP” as EBITDA where the D&A are not a permanent expense (loan loss provisions fall back by 90% in economic recovery periods). Large US financials are the cheapest stocks in the world, especially on a risk-to-reward basis. They trade hands at just 77% of adjusted book value (to include excess loss reserves) and about 3x free cash flow (to exclude excess loan loss provisions).
Valuations Remain Absurd!
Price
Book Value
Adj. Book1
PTPP2
Price/ Book
Price/ Adj. BV
Price/ PTPP
JP Morgan $41 $41 $50 $12 100% 82% 3.3x Wells Fargo 26 24 29 7 107 88 3.5 Citigroup 3 7 8 2 53 44 2.2 PNC 52 63 73 15 83 72 3.5 Bank of Amer. 15 27 31 6 57 50 2.8 Capital One 40 57 62 16 71 65 2.6 US Bank 22 13 17 5 171 135 4.7
Average 92% 77% 3.2x 1
Stated book plus loan loss reserve drawn down to 1% of loans w/ excess taxed at 40% income tax rate and 2010 EPS. 2 Pre-tax, pre-provision at normalized annualized provision rate.
Bank accounting seems to bewilder many a pundit that we hear blasting the sector and valuations suggest that apathetic investors remain conspicuously in the dark. Once a bank has recognized its bad loans and “reserves” (expenses) for them, they immediately return
5
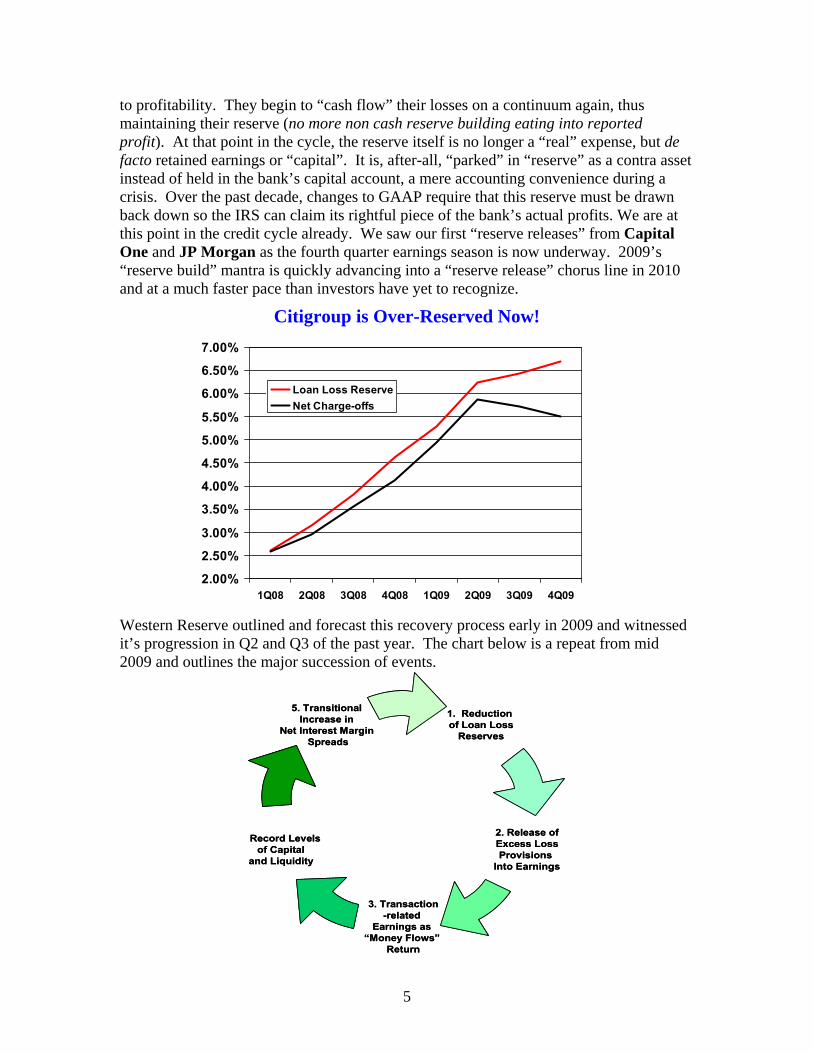
to profitability. They begin to “cash flow” their losses on a continuum again, thus maintaining their reserve (no more non cash reserve building eating into reported profit). At that point in the cycle, the reserve itself is no longer a “real” expense, but de facto retained earnings or “capital”. It is, after-all, “parked” in “reserve” as a contra asset instead of held in the bank’s capital account, a mere accounting convenience during a crisis. Over the past decade, changes to GAAP require that this reserve must be drawn back down so the IRS can claim its rightful piece of the bank’s actual profits. We are at this point in the credit cycle already. We saw our first “reserve releases” from Capital One and JP Morgan as the fourth quarter earnings season is now underway. 2009’s “reserve build” mantra is quickly advancing into a “reserve release” chorus line in 2010 and at a much faster pace than investors have yet to recognize.
Citigroup is Over-Reserved Now!
2.00%
2.50%
3.00%
3.50%
4.00%
4.50%
5.00%
5.50%
6.00%
6.50%
7.00%
1Q08 2Q08 3Q08 4Q08 1Q09 2Q09 3Q09 4Q09
Loan Loss ReserveNet Charge-offs
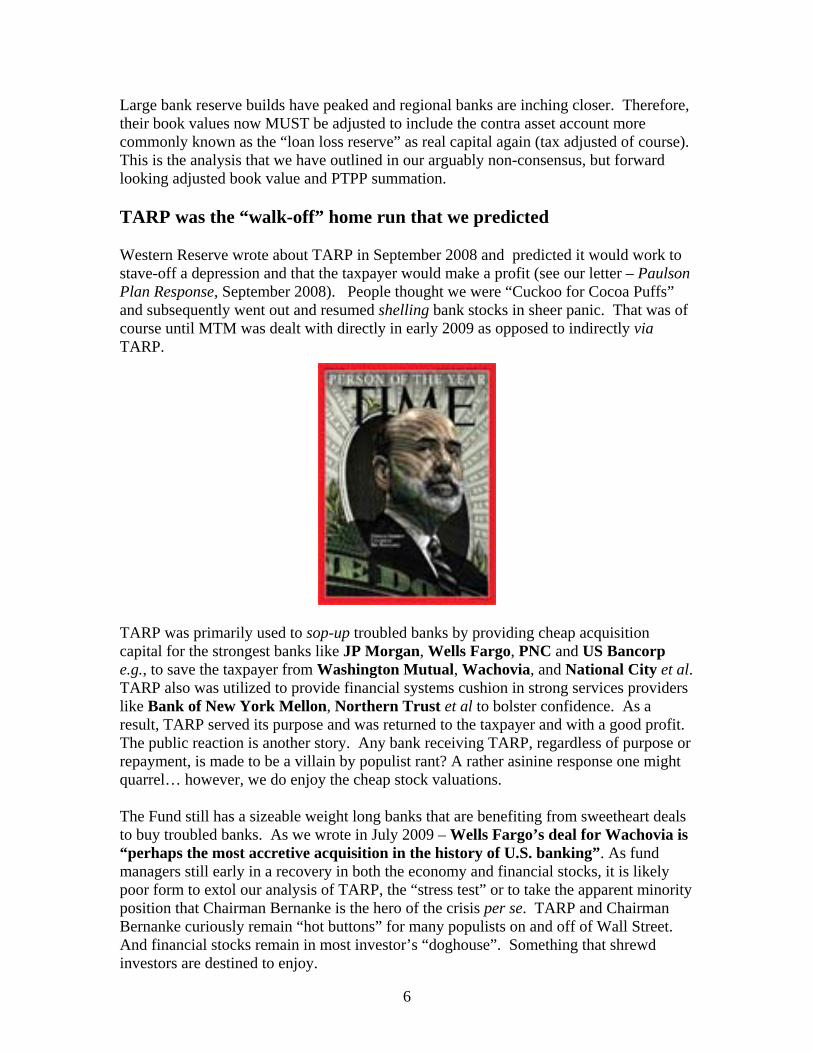
Western Reserve outlined and forecast this recovery process early in 2009 and witnessed it’s progression in Q2 and Q3 of the past year. The chart below is a repeat from mid 2009 and outlines the major succession of events.
1. Reductionof Loan Loss
Reserves
Record Levelsof Capital
and Liquidity
5. TransitionalIncrease in
Net Interest MarginSpreads
2. Release ofExcess Loss Provisions
Into Earnings
3. Transaction-related
Earnings as “Money Flows”
Return
1. Reductionof Loan Loss
Reserves
Record Levelsof Capital
and Liquidity
5. TransitionalIncrease in
Net Interest MarginSpreads
2. Release ofExcess Loss Provisions
Into Earnings
3. Transaction-related
Earnings as “Money Flows”
Return
6
Large bank reserve builds have peaked and regional banks are inching closer. Therefore, their book values now MUST be adjusted to include the contra asset account more commonly known as the “loan loss reserve” as real capital again (tax adjusted of course). This is the analysis that we have outlined in our arguably non-consensus, but forward looking adjusted book value and PTPP summation. TARP was the “walk-off” home run that we predicted Western Reserve wrote about TARP in September 2008 and predicted it would work to stave-off a depression and that the taxpayer would make a profit (see our letter – Paulson Plan Response, September 2008). People thought we were “Cuckoo for Cocoa Puffs” and subsequently went out and resumed shelling bank stocks in sheer panic. That was of course until MTM was dealt with directly in early 2009 as opposed to indirectly via TARP.
TARP was primarily used to sop-up troubled banks by providing cheap acquisition capital for the strongest banks like JP Morgan, Wells Fargo, PNC and US Bancorp e.g., to save the taxpayer from Washington Mutual, Wachovia, and National City et al. TARP also was utilized to provide financial systems cushion in strong services providers like Bank of New York Mellon, Northern Trust et al to bolster confidence. As a result, TARP served its purpose and was returned to the taxpayer and with a good profit. The public reaction is another story. Any bank receiving TARP, regardless of purpose or repayment, is made to be a villain by populist rant? A rather asinine response one might quarrel… however, we do enjoy the cheap stock valuations. The Fund still has a sizeable weight long banks that are benefiting from sweetheart deals to buy troubled banks. As we wrote in July 2009 – Wells Fargo’s deal for Wachovia is “perhaps the most accretive acquisition in the history of U.S. banking”. As fund managers still early in a recovery in both the economy and financial stocks, it is likely poor form to extol our analysis of TARP, the “stress test” or to take the apparent minority position that Chairman Bernanke is the hero of the crisis per se. TARP and Chairman Bernanke curiously remain “hot buttons” for many populists on and off of Wall Street. And financial stocks remain in most investor’s “doghouse”. Something that shrewd investors are destined to enjoy.
7
We thought the Partners might appreciate the perspective of one of the Fund’s senior advisors – Bob McTeer on the matter. The following is a musing from Bob’s National Institute for Policy Analysis (NCPA) blogsite. If you don’t already follow Bob on CNBC or read his blog, we would highly recommend it. He is among the sharpest central banking minds our nation offers and a very “thoughtful” (non partisan) economist.
TARP Thoughts
Dec 17th, 2009 11:24:59 AM By Bob McTeer
A couple of people have mentioned to me that the TARP repayments are all over the news and suggested that I write about it. My response has been that I didn’t know how to avoid saying I told you so. I’ve written and said often that TARP would produce a profit for taxpayers, or only a small loss. However, I could always feel eyes rolling.
While I never bought the idea that TARP purchases of preferred stock was only from banks ALREADY in good condition, I do think it was limited to banks that WOULD BE expected to be in good condition AFTER the purchase. In many cases the government investment was conditional on the raising private capital as well.
For the rest of President McTeer’s comments on the end of TARP see his blogsite home - http://bobmcteer.com/
Inflation - Fed’s Balance Sheet Misconstrued, Needlessly Feared Investor concern about the monetary base is grossly overblown as McTeer and Western Reserve have consistently outlined (see – A Conversation with Bob McTeer, August 2009). Very few have come to this realization. As Bob reminds us, it’s the velocity of money that matters and not the size. We don’t see velocity being a serious problem anytime soon. This buys both the Fed and the economy time to recover naturally and pragmatically. And an environment of a steady unwind by the Fed will be a backdrop which is enormously beneficial to financial firms’ earnings. It is commonly overlooked that about half the Fed’s balance sheet is made-up of voluntary excess member bank reserves. This cash is “parked” there by banks unwilling to lend yet and de facto by the weak demand for loans. This is hardly inflationary. The remainder is in long-term assets and offsetting liabilities necessary for the Fed’s “unusual and exigent” initiatives during the crisis as required by law (see – Federal Reserve Act, Section 13-3). These measures are not monies in circulation and thus cannot be inflationary.
8
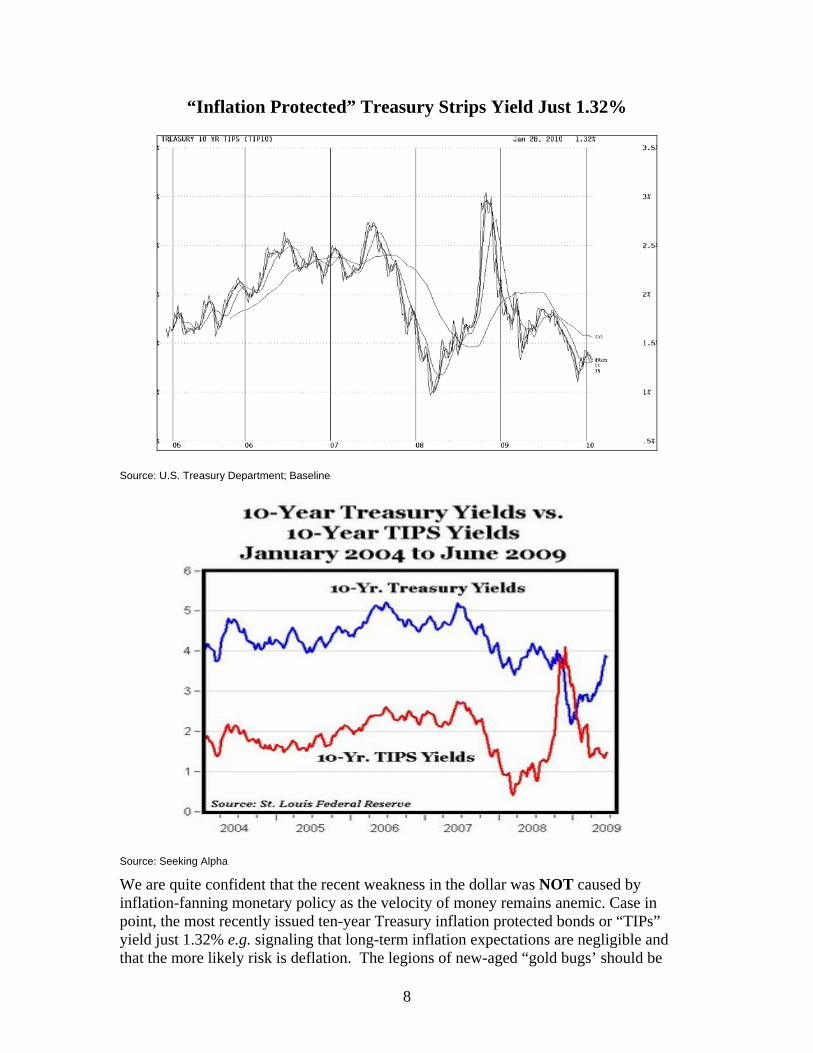
“Inflation Protected” Treasury Strips Yield Just 1.32%
Source: U.S. Treasury Department; Baseline
Source: Seeking Alpha
We are quite confident that the recent weakness in the dollar was NOT caused by inflation-fanning monetary policy as the velocity of money remains anemic. Case in point, the most recently issued ten-year Treasury inflation protected bonds or “TIPs” yield just 1.32% e.g. signaling that long-term inflation expectations are negligible and that the more likely risk is deflation. The legions of new-aged “gold bugs’ should be
9
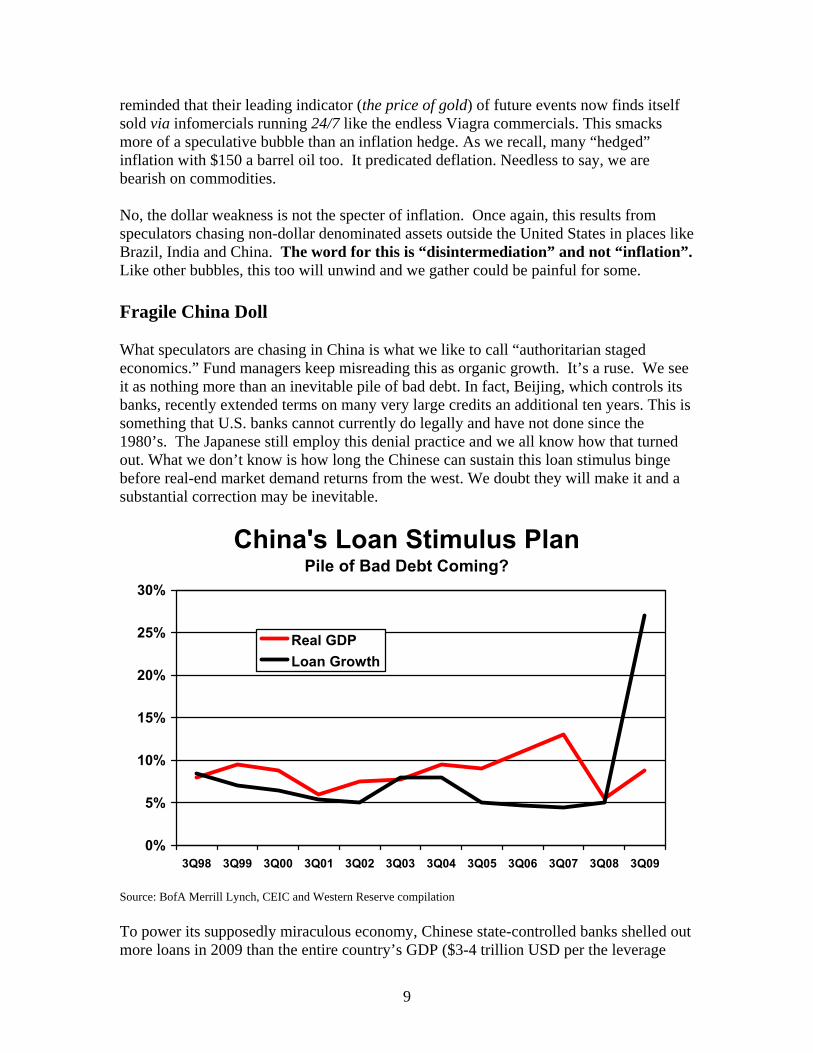
reminded that their leading indicator (the price of gold) of future events now finds itself sold via infomercials running 24/7 like the endless Viagra commercials. This smacks more of a speculative bubble than an inflation hedge. As we recall, many “hedged” inflation with $150 a barrel oil too. It predicated deflation. Needless to say, we are bearish on commodities. No, the dollar weakness is not the specter of inflation. Once again, this results from speculators chasing non-dollar denominated assets outside the United States in places like Brazil, India and China. The word for this is “disintermediation” and not “inflation”. Like other bubbles, this too will unwind and we gather could be painful for some. Fragile China Doll What speculators are chasing in China is what we like to call “authoritarian staged economics.” Fund managers keep misreading this as organic growth. It’s a ruse. We see it as nothing more than an inevitable pile of bad debt. In fact, Beijing, which controls its banks, recently extended terms on many very large credits an additional ten years. This is something that U.S. banks cannot currently do legally and have not done since the 1980’s. The Japanese still employ this denial practice and we all know how that turned out. What we don’t know is how long the Chinese can sustain this loan stimulus binge before real-end market demand returns from the west. We doubt they will make it and a substantial correction may be inevitable.
China's Loan Stimulus PlanPile of Bad Debt Coming?
0%
5%
10%
15%
20%
25%
30%
3Q98 3Q99 3Q00 3Q01 3Q02 3Q03 3Q04 3Q05 3Q06 3Q07 3Q08 3Q09
Real GDPLoan Growth
Source: BofA Merrill Lynch, CEIC and Western Reserve compilation To power its supposedly miraculous economy, Chinese state-controlled banks shelled out more loans in 2009 than the entire country’s GDP ($3-4 trillion USD per the leverage
10
inherent in the Renminbi). In terms of a credit bubble, this would make Americans blush. Chinese banks already are running-up against capital constraints in support of such heady loan growth and this should concern investors about how sustainable a trend this really can be. China has great long-term promise, but at present it’s ‘window dressing’ it’s economy purely on credit overdrive. This excess credit has caused a stockpile of raw materials (largely commodities), which has driven-up prices but has no end-market demand. Many fund managers in the west are chasing these trends believing them to be sustainable and therefore have drained the domestic equity markets to fund this “performance chase”. We see a sharp reversal brewing which will benefit domestic markets, the U.S. dollar and especially local financial stocks. The winds are ripe for this reversal as it is supported firmly by the fundamentals. Many fund managers are not positioned for this correctly. We suspect emerging markets like Dubai and Greece are just an appetizer; and this at a time when more domestic investors are allocating their capital abroad than at any other time in history. Consequently, we are finding many short ideas amid “back-door’ China plays. The near ubiquitous confidence in China by western portfolio managers has resulted in the gross over allocation to industrials and commodities in most portfolios. Meanwhile, excessive pessimism in the U.S. economy and especially in our financial system has created material under allocation to the U.S. financial sector. So, strictly speaking, the odds fantastically favor U.S. financial stocks. Fundamentally, our financial system is in repair mode while China’s system is fragile, bloated and has yet to deal with their credit excesses. Strangely, a strong domestic bank can be had for less than 1x book value while its Chinese counterpart trades at 5x book value. A lay-up in our view… Credit Quality - State of the Recovery in Our Financial System Although some significant “clean-up” work remains, our financial industry has stared into the abyss (with some serious help from non cash-based loss recognition accounting) and has survived. Actually, the recovery has been text book. As we noted in our research late in 2008, liquidity must be restored first and it was. Then capital replenished and it has. Now asset quality is back to “manageable” and has continued to improve. And finally, earnings restoration will follow. And it is here… Credit migration trends tell the story now… Residential Real Estate The result of a study of residential mortgages (by origination year or “vintage”) by the Federal Reserve Bank of Atlanta delineates the current setting. Put simply, we are past the peak in the residential mortgage crisis although very few investors would believe us.
11
Residential Mortgages Are Behind the System
Source: Federal Reserve Bank of Atlanta
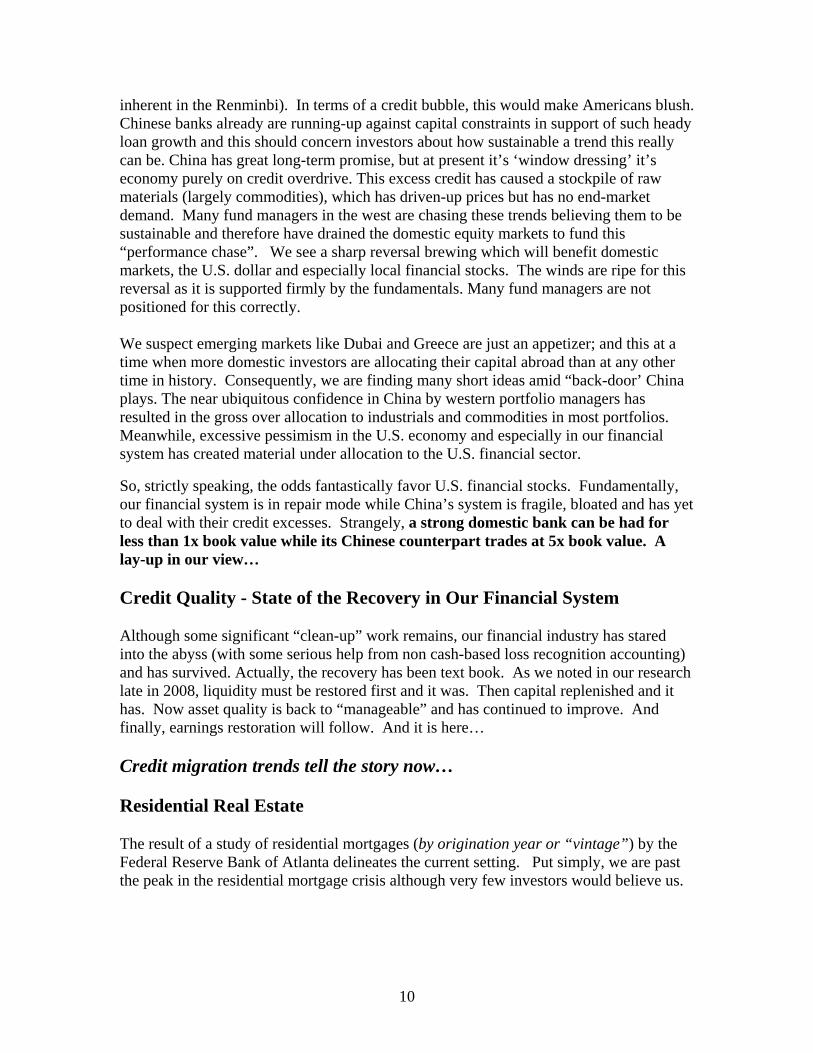
How to interpret this chart: People who bought homes in 2002 experienced much better price gains than those who bought in 2005. At the same time, the credit worthiness of borrowers declined between 2002 and 2005 due to the federal government’s “affordable housing” mandates. These mandates legitimized and subsidized weak underwriting on sub prime e.g. via Fannie Mae and Freddie Mac despite the steady warnings and higher rate targets from the Federal Reserve. The Fed began raising rates in early 2004 and accelerated the process through early 2007.
The blue dotted line shows what would have happened if people who bought homes in 2002 actually experienced 2005 price changes. If foreclosure levels were high, then that would imply that declining standards were the main driver, but that's not what one observes. Quite the opposite actually happened. 2002 underwriting standards were still quite strong. So, the only “updraft” in the analysis came from potential home price changes and those were minimal. So, this “easy money” theory that “economic populists” charge with the cause of the mortgage crisis has no empirical foundation. The Fed had nothing to do with high foreclosure rates. Conversely, the dotted red line shows what would have happened if the better credit quality borrowers from 2002 had actually bought homes in 2005. The fact that foreclosures are much lower in this scenario suggests that while home price changes are a factor, it is overwhelmingly poor lending standards that cause foreclosure risks to “go rogue”.
This should end the debate on the whether the Fed’s perceived “easy money” versus mortgage industry lust (led by the Government Sponsored Enterprises) caused the
12
mortgage bubble. The lesson is obvious – don’t make bad loans and then blame it on monetary policy. Blame it on bad loans and unintended consequences of ill-conceived government subsidies.
In 2009, we have seen home price declines moderate to low single digits per the Case-Shiller Indexes. This is materially below the Fed’s “stress test” metrics as mentioned previously. The residential mortgage crisis has peaked with the worst vintage of any magnitude being 2005. This vintage is seeing foreclosure hazard steadily decline while better underwritten older vintages are at less risk to home price erosion. We actually look to invest in some of the very best mortgage underwriters taking market share, namely Wells Fargo and Bank of America.
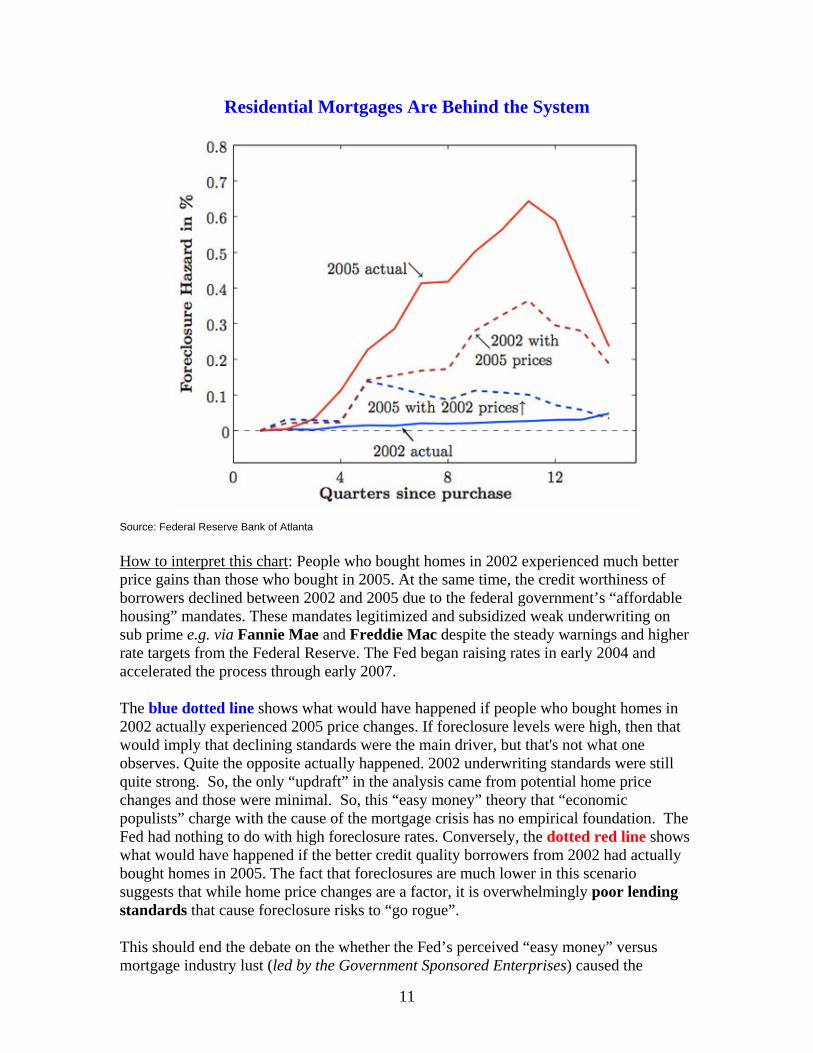
Mortgage “Reset” Risks are Abating Quickly
For investors, the forward looking observation here is that all vintages of residential mortgage credit have seen peak foreclosure incidence and we are now in recovery. It will be a long recovery and we will not see another “housing boom” for some time…maybe decades. But, residential real estate no longer poses systemic risk to the broad financial system. Although some “reset” risks remain in 2010, they drop-off in 2011 and beyond. They also are higher quality mortgages and mortgage rates (for refinancing) remain low, which are material mitigating factors.
13
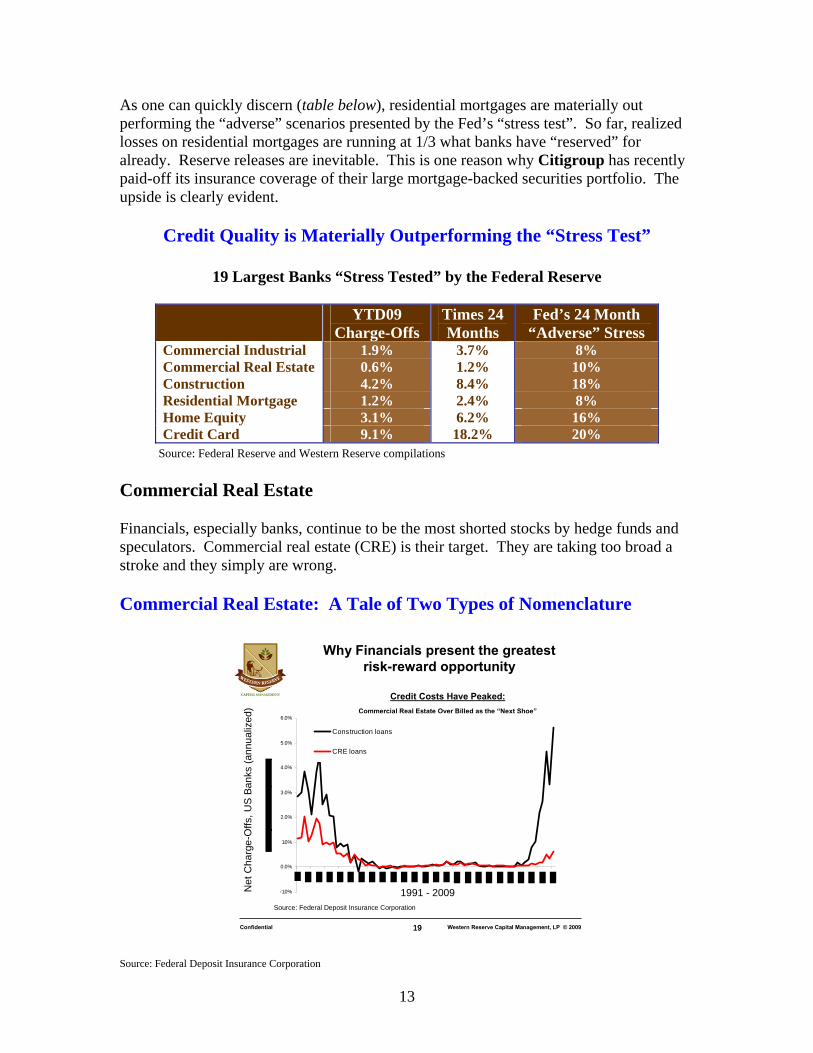
As one can quickly discern (table below), residential mortgages are materially out performing the “adverse” scenarios presented by the Fed’s “stress test”. So far, realized losses on residential mortgages are running at 1/3 what banks have “reserved” for already. Reserve releases are inevitable. This is one reason why Citigroup has recently paid-off its insurance coverage of their large mortgage-backed securities portfolio. The upside is clearly evident.
Credit Quality is Materially Outperforming the “Stress Test”
19 Largest Banks “Stress Tested” by the Federal Reserve
YTD09 Charge-Offs
Times 24 Months
Fed’s 24 Month “Adverse” Stress
Commercial Industrial 1.9% 3.7% 8% Commercial Real Estate 0.6% 1.2% 10% Construction 4.2% 8.4% 18% Residential Mortgage 1.2% 2.4% 8% Home Equity 3.1% 6.2% 16% Credit Card 9.1% 18.2% 20%
Source: Federal Reserve and Western Reserve compilations
Commercial Real Estate
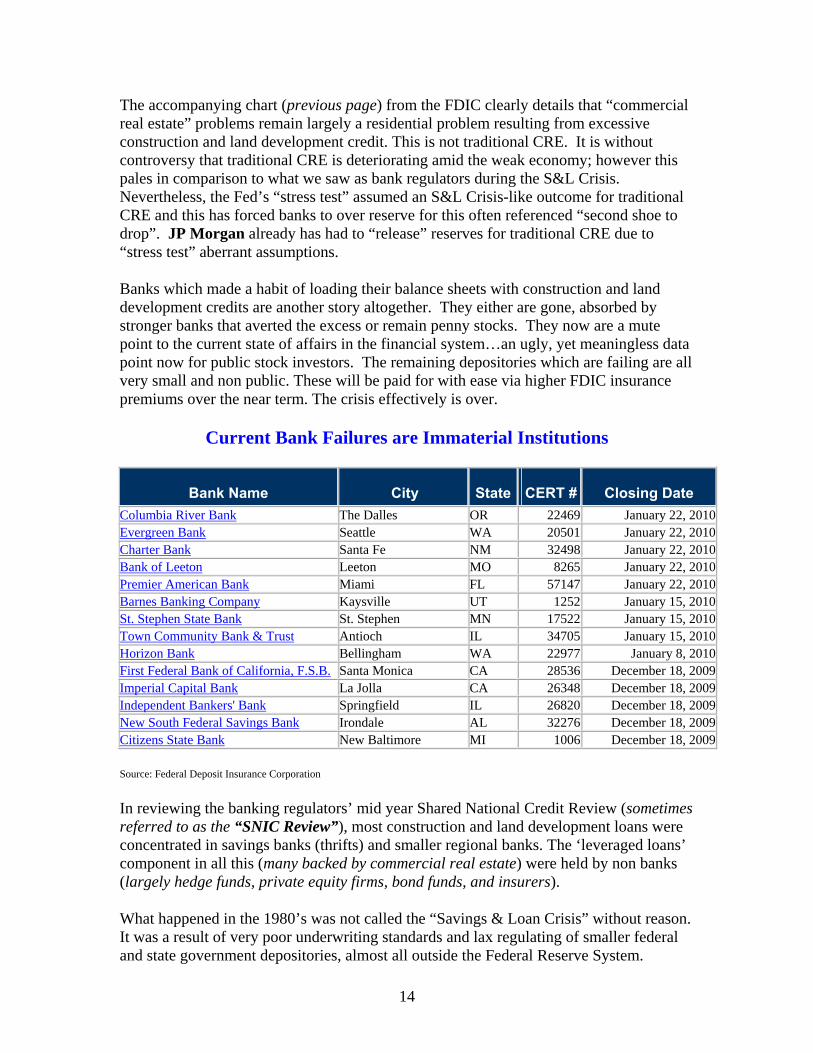
Financials, especially banks, continue to be the most shorted stocks by hedge funds and speculators. Commercial real estate (CRE) is their target. They are taking too broad a stroke and they simply are wrong.
Commercial Real Estate: A Tale of Two Types of Nomenclature
19 Western Reserve Capital Management, LP © 2009Confidential
Why Financials present the greatest risk-reward opportunity
Credit Costs Have Peaked:Commercial Real Estate Over Billed as the “Next Shoe”
19
-1.0%
0.0%
1.0%
2.0%
3.0%
4.0%
5.0%
6.0%
Construction loans
CRE loans
Source: Federal Deposit Insurance Corporation
Net
Cha
rge-
Offs
, US
Ban
ks (a
nnua
lized
)
1991 - 2009
Source: Federal Deposit Insurance Corporation
14
The accompanying chart (previous page) from the FDIC clearly details that “commercial real estate” problems remain largely a residential problem resulting from excessive construction and land development credit. This is not traditional CRE. It is without controversy that traditional CRE is deteriorating amid the weak economy; however this pales in comparison to what we saw as bank regulators during the S&L Crisis. Nevertheless, the Fed’s “stress test” assumed an S&L Crisis-like outcome for traditional CRE and this has forced banks to over reserve for this often referenced “second shoe to drop”. JP Morgan already has had to “release” reserves for traditional CRE due to “stress test” aberrant assumptions.
Banks which made a habit of loading their balance sheets with construction and land development credits are another story altogether. They either are gone, absorbed by stronger banks that averted the excess or remain penny stocks. They now are a mute point to the current state of affairs in the financial system…an ugly, yet meaningless data point now for public stock investors. The remaining depositories which are failing are all very small and non public. These will be paid for with ease via higher FDIC insurance premiums over the near term. The crisis effectively is over.
Current Bank Failures are Immaterial Institutions
Bank Name City State CERT # Closing Date Columbia River Bank The Dalles OR 22469 January 22, 2010Evergreen Bank Seattle WA 20501 January 22, 2010Charter Bank Santa Fe NM 32498 January 22, 2010Bank of Leeton Leeton MO 8265 January 22, 2010Premier American Bank Miami FL 57147 January 22, 2010Barnes Banking Company Kaysville UT 1252 January 15, 2010St. Stephen State Bank St. Stephen MN 17522 January 15, 2010Town Community Bank & Trust Antioch IL 34705 January 15, 2010Horizon Bank Bellingham WA 22977 January 8, 2010First Federal Bank of California, F.S.B. Santa Monica CA 28536 December 18, 2009Imperial Capital Bank La Jolla CA 26348 December 18, 2009Independent Bankers' Bank Springfield IL 26820 December 18, 2009New South Federal Savings Bank Irondale AL 32276 December 18, 2009Citizens State Bank New Baltimore MI 1006 December 18, 2009
Source: Federal Deposit Insurance Corporation
In reviewing the banking regulators’ mid year Shared National Credit Review (sometimes referred to as the “SNIC Review”), most construction and land development loans were concentrated in savings banks (thrifts) and smaller regional banks. The ‘leveraged loans’ component in all this (many backed by commercial real estate) were held by non banks (largely hedge funds, private equity firms, bond funds, and insurers).
What happened in the 1980’s was not called the “Savings & Loan Crisis” without reason. It was a result of very poor underwriting standards and lax regulating of smaller federal and state government depositories, almost all outside the Federal Reserve System.
15
It appears to have been overlooked by many that these types of poorly regulated institutions again are a problem and were NOT allowed to participate in TARP.
Bank examiners we have spoken with in late 2009 have made it abundantly clear that their focus in recent exams has been on commercial real estate. One district Fed Banking Supervision & Regulation head told us that he was “pleasantly surprised” at the underwriting quality of his district member bank’s CRE. This was post the completion of their swat team-like exams.
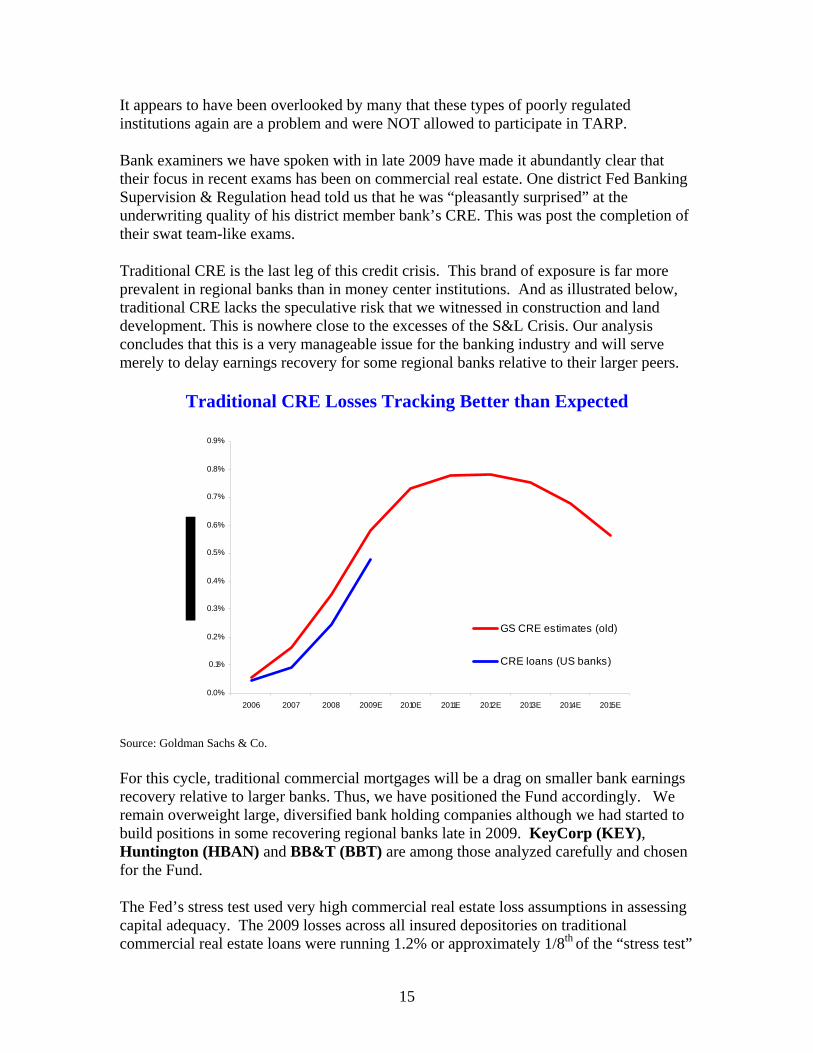
Traditional CRE is the last leg of this credit crisis. This brand of exposure is far more prevalent in regional banks than in money center institutions. And as illustrated below, traditional CRE lacks the speculative risk that we witnessed in construction and land development. This is nowhere close to the excesses of the S&L Crisis. Our analysis concludes that this is a very manageable issue for the banking industry and will serve merely to delay earnings recovery for some regional banks relative to their larger peers.
Traditional CRE Losses Tracking Better than Expected
0.0%
0.1%
0.2%
0.3%
0.4%
0.5%
0.6%
0.7%
0.8%
0.9%
2006 2007 2008 2009E 2010E 2011E 2012E 2013E 2014E 2015E
GS CRE estimates (old)
CRE loans (US banks)
Source: Goldman Sachs & Co.
For this cycle, traditional commercial mortgages will be a drag on smaller bank earnings recovery relative to larger banks. Thus, we have positioned the Fund accordingly. We remain overweight large, diversified bank holding companies although we had started to build positions in some recovering regional banks late in 2009. KeyCorp (KEY), Huntington (HBAN) and BB&T (BBT) are among those analyzed carefully and chosen for the Fund.
The Fed’s stress test used very high commercial real estate loss assumptions in assessing capital adequacy. The 2009 losses across all insured depositories on traditional commercial real estate loans were running 1.2% or approximately 1/8th of the “stress test”
16
formula for adverse outcome through the third quarter. And we actually see delinquency abatement in the early reports of fourth quarter results at banks.
(For a quick refresher on the Fed’s Supervisory Capital Assessment Program “SCAP” test which is more commonly known as the “stress test”… See the detailed discussion in our Credit Update letter dated July, 2009.)
We believe there is a great opportunity in regional bank stocks in 2010. The valuations of these banks are being maliciously maligned via the misperceptions over commercial real estate. In particular, we believe Wells Fargo (WFC), US Bancorp (USB), and PNC Financial (PNC) are well positioned for value expansion.
Credit Cards
No other form of credit more closely mirrors unemployment trends (initially in recession) than unsecured consumer lines of credit, yet it is an imperfect relationship. The one area where SCAP has been very accurate is in unemployment which is now hovering around 10%. And no other form of credit (save commercial real estate) befuddled bank stock shorts in 2009 as much as credit cards. Hum?
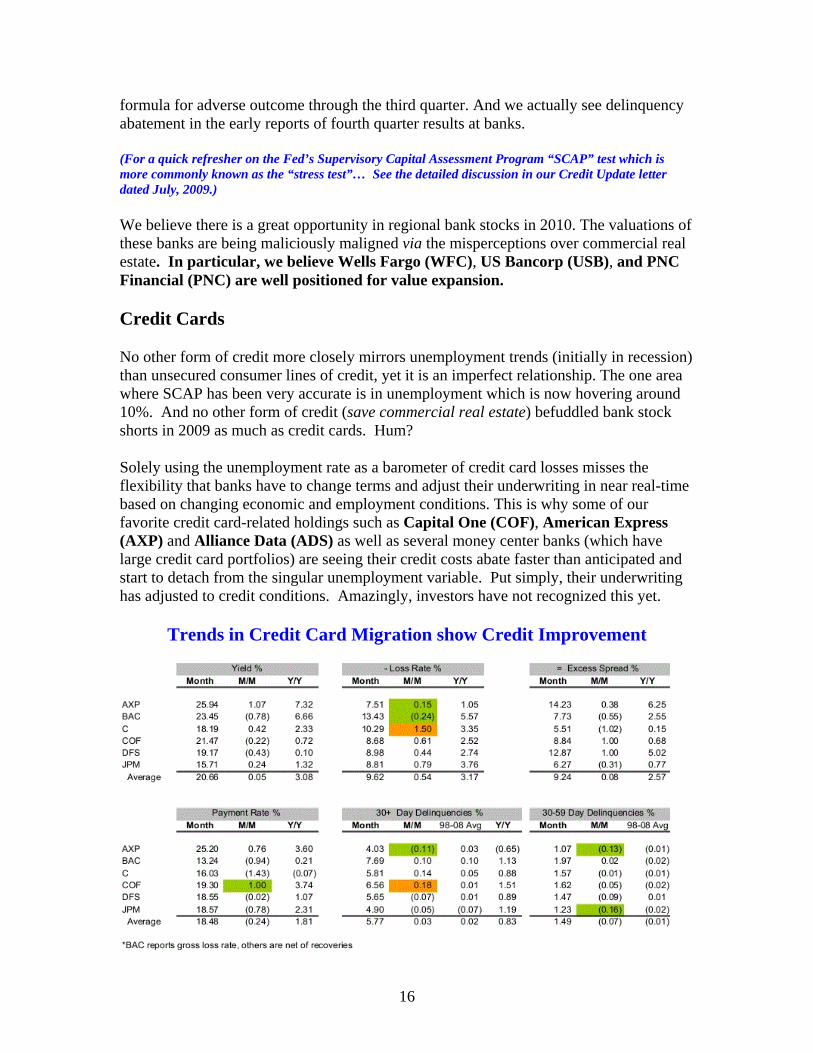
Solely using the unemployment rate as a barometer of credit card losses misses the flexibility that banks have to change terms and adjust their underwriting in near real-time based on changing economic and employment conditions. This is why some of our favorite credit card-related holdings such as Capital One (COF), American Express (AXP) and Alliance Data (ADS) as well as several money center banks (which have large credit card portfolios) are seeing their credit costs abate faster than anticipated and start to detach from the singular unemployment variable. Put simply, their underwriting has adjusted to credit conditions. Amazingly, investors have not recognized this yet.
Trends in Credit Card Migration show Credit Improvement
17
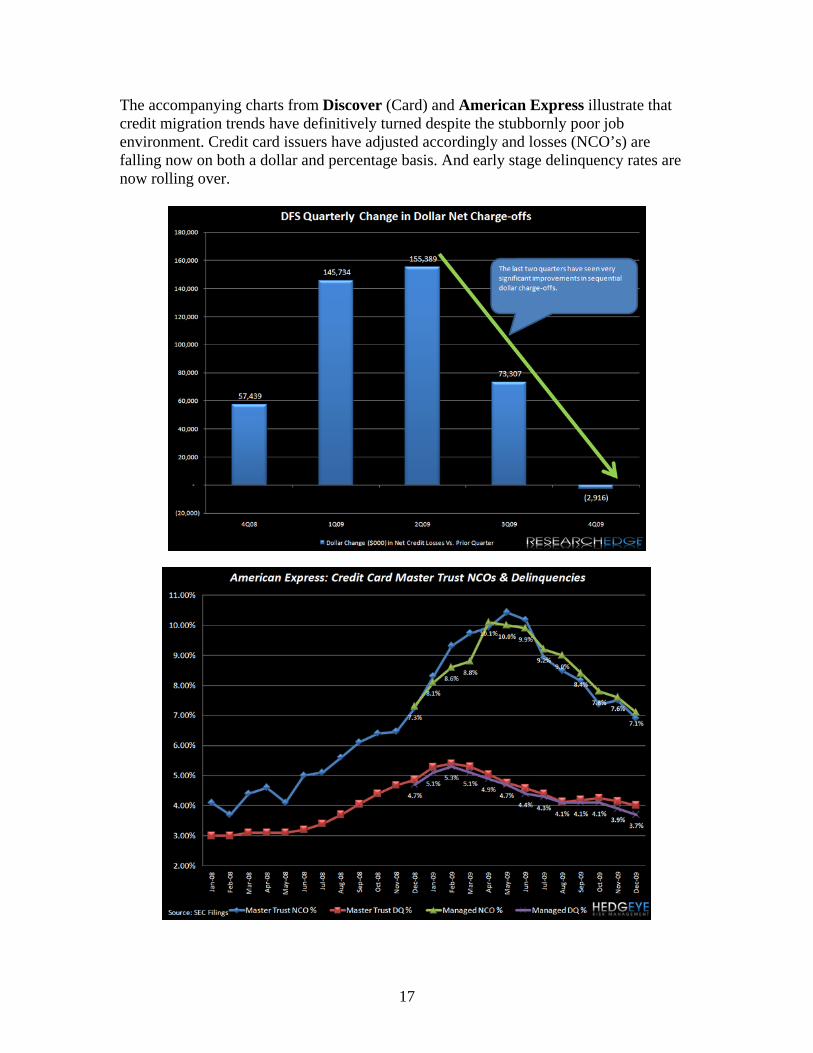
The accompanying charts from Discover (Card) and American Express illustrate that credit migration trends have definitively turned despite the stubbornly poor job environment. Credit card issuers have adjusted accordingly and losses (NCO’s) are falling now on both a dollar and percentage basis. And early stage delinquency rates are now rolling over.
18
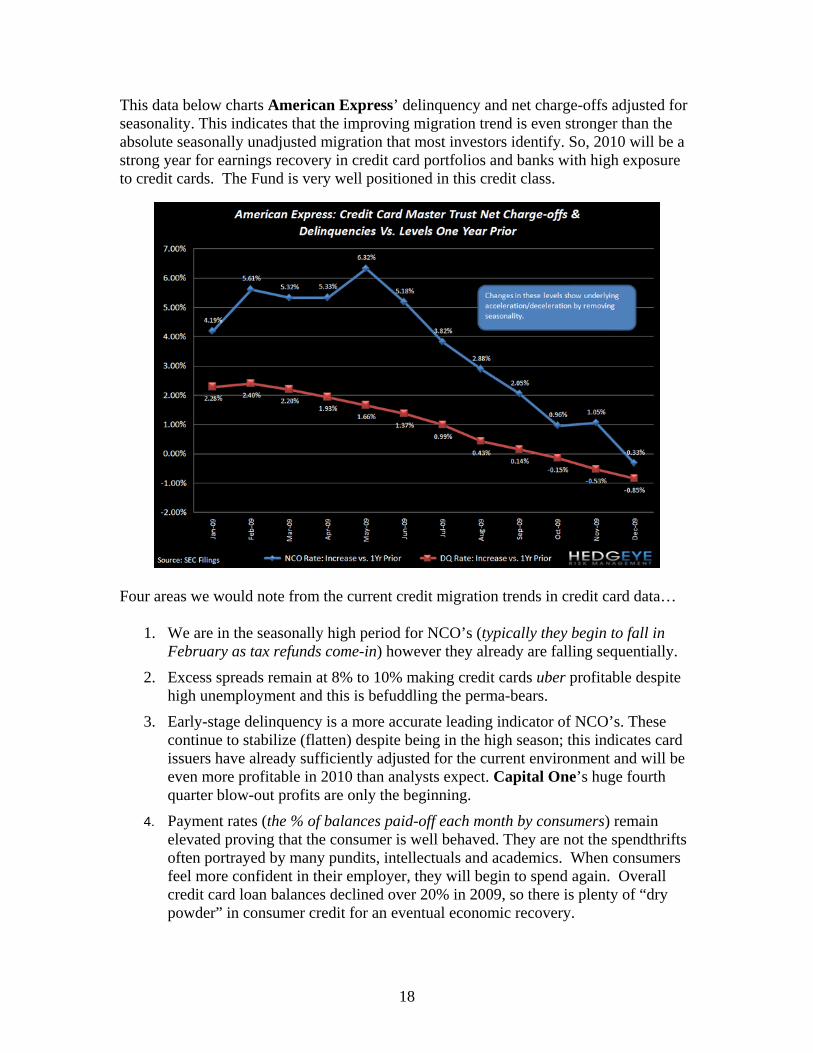
This data below charts American Express’ delinquency and net charge-offs adjusted for seasonality. This indicates that the improving migration trend is even stronger than the absolute seasonally unadjusted migration that most investors identify. So, 2010 will be a strong year for earnings recovery in credit card portfolios and banks with high exposure to credit cards. The Fund is very well positioned in this credit class.
Four areas we would note from the current credit migration trends in credit card data…
1. We are in the seasonally high period for NCO’s (typically they begin to fall in February as tax refunds come-in) however they already are falling sequentially.
2. Excess spreads remain at 8% to 10% making credit cards uber profitable despite high unemployment and this is befuddling the perma-bears.
3. Early-stage delinquency is a more accurate leading indicator of NCO’s. These continue to stabilize (flatten) despite being in the high season; this indicates card issuers have already sufficiently adjusted for the current environment and will be even more profitable in 2010 than analysts expect. Capital One’s huge fourth quarter blow-out profits are only the beginning.
4. Payment rates (the % of balances paid-off each month by consumers) remain elevated proving that the consumer is well behaved. They are not the spendthrifts often portrayed by many pundits, intellectuals and academics. When consumers feel more confident in their employer, they will begin to spend again. Overall credit card loan balances declined over 20% in 2009, so there is plenty of “dry powder” in consumer credit for an eventual economic recovery.
19
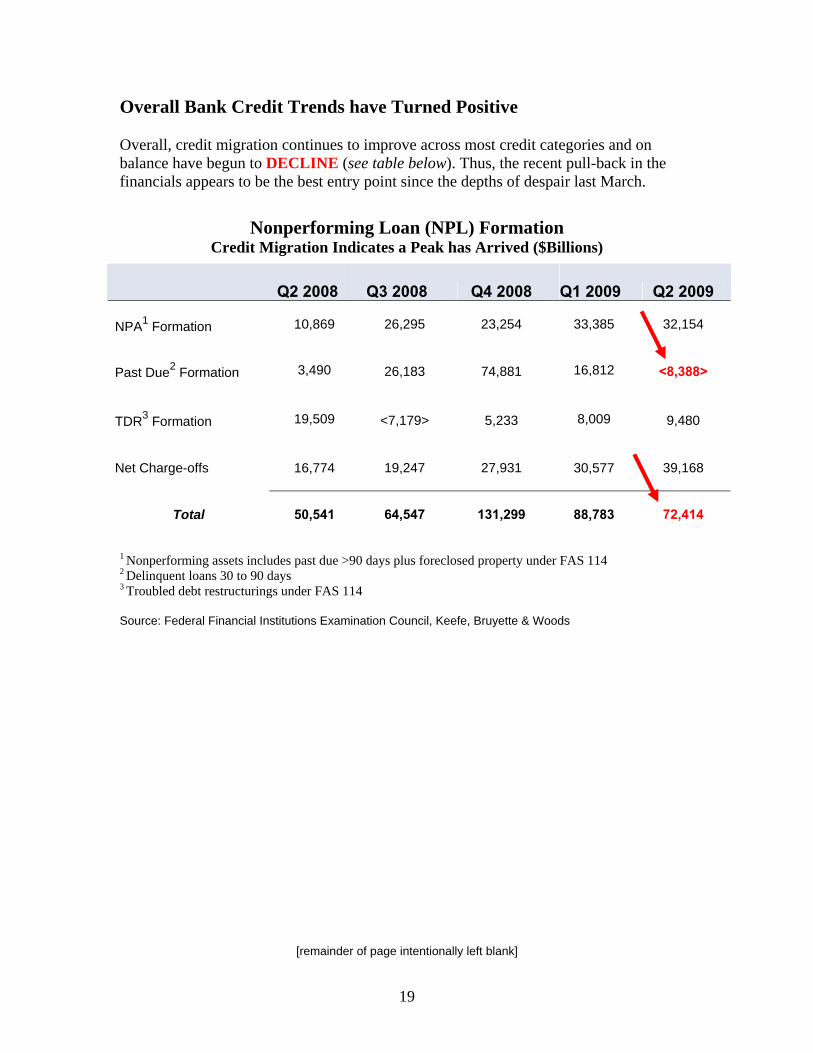
Overall Bank Credit Trends have Turned Positive Overall, credit migration continues to improve across most credit categories and on balance have begun to DECLINE (see table below). Thus, the recent pull-back in the financials appears to be the best entry point since the depths of despair last March.
Nonperforming Loan (NPL) Formation Credit Migration Indicates a Peak has Arrived ($Billions)
Q2 2008 Q3 2008 Q4 2008
Q1 2009 Q2 2009
NPA1 Formation
10,869 26,295
23,254
33,385 32,154
Past Due2 Formation
3,490 26,183 74,881
16,812 <8,388>
TDR3 Formation
19,509 <7,179> 5,233
8,009 9,480
Net Charge-offs
16,774 19,247 27,931
30,577 39,168
Total
50,541 64,547 131,299
88,783 72,414
1 Nonperforming assets includes past due >90 days plus foreclosed property under FAS 114 2 Delinquent loans 30 to 90 days 3 Troubled debt restructurings under FAS 114 Source: Federal Financial Institutions Examination Council, Keefe, Bruyette & Woods
[remainder of page intentionally left blank]
20
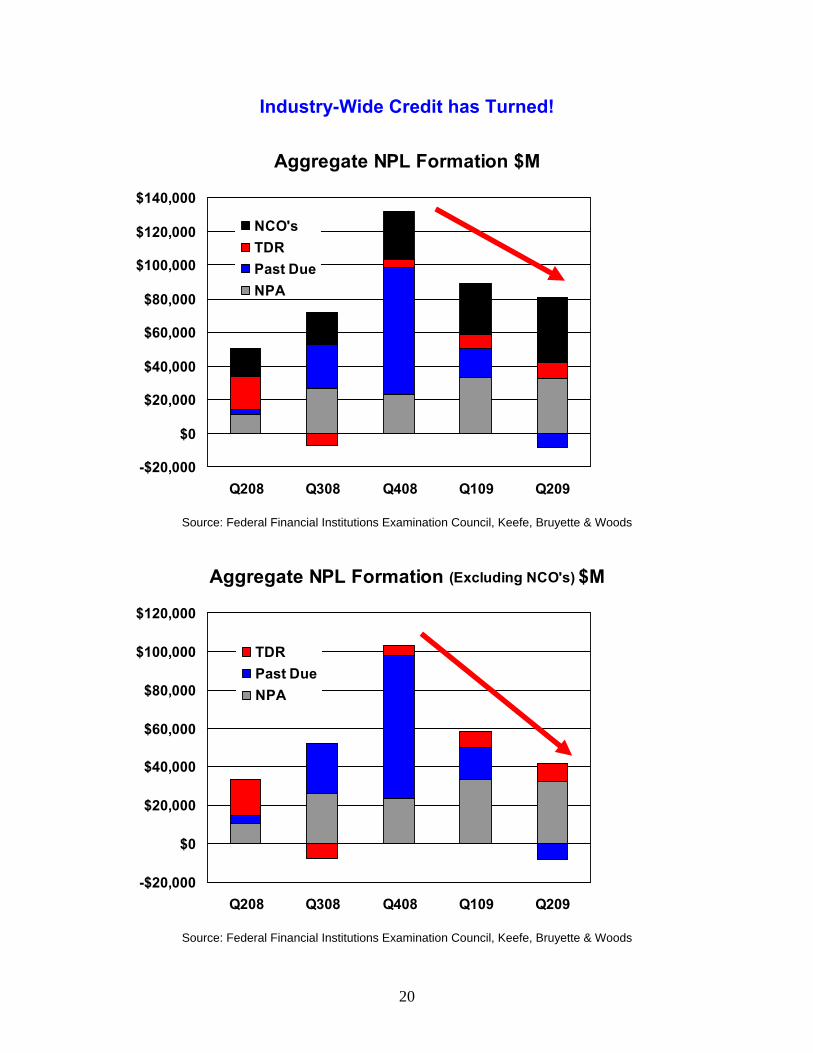
Industry-Wide Credit has Turned!
Source: Federal Financial Institutions Examination Council, Keefe, Bruyette & Woods
Source: Federal Financial Institutions Examination Council, Keefe, Bruyette & Woods
Aggregate NPL Formation $M
-$20,000
$0
$20,000
$40,000
$60,000
$80,000
$100,000
$120,000
$140,000
Q208 Q308 Q408 Q109 Q209
NCO'sTDRPast DueNPA
Aggregate NPL Formation (Excluding NCO's) $M
-$20,000
$0
$20,000
$40,000
$60,000
$80,000
$100,000
$120,000
Q208 Q308 Q408 Q109 Q209
TDRPast DueNPA
21
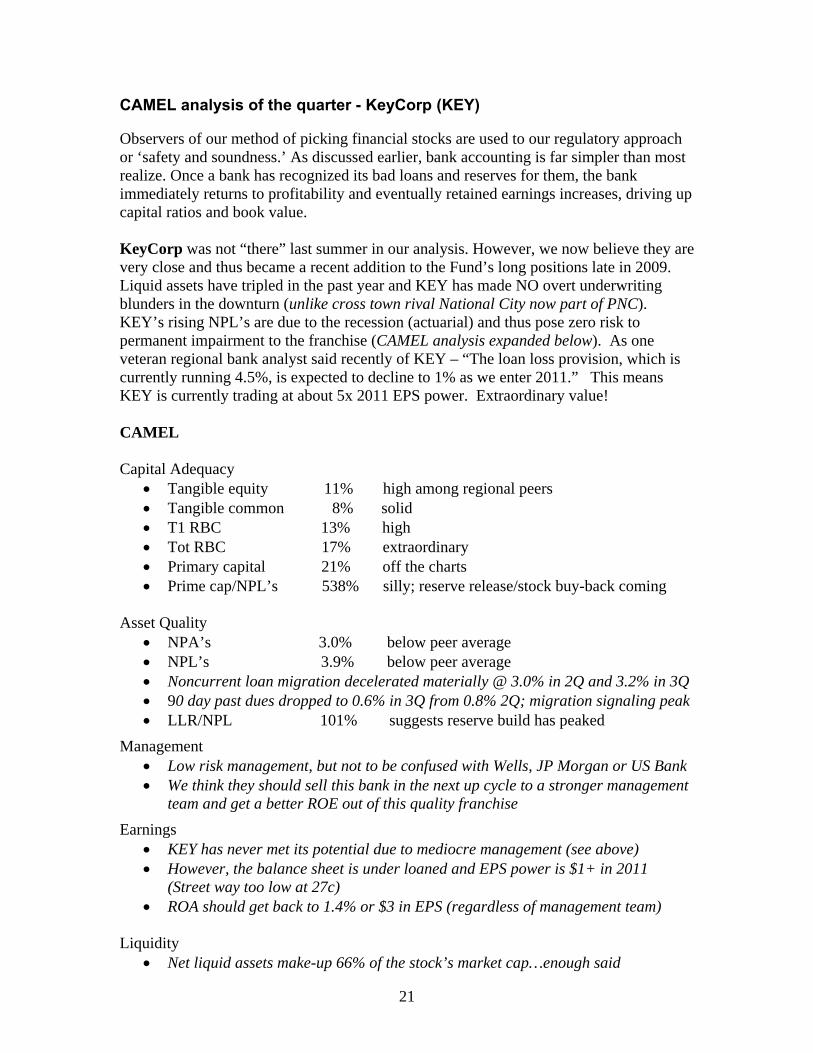
CAMEL analysis of the quarter - KeyCorp (KEY) Observers of our method of picking financial stocks are used to our regulatory approach or ‘safety and soundness.’ As discussed earlier, bank accounting is far simpler than most realize. Once a bank has recognized its bad loans and reserves for them, the bank immediately returns to profitability and eventually retained earnings increases, driving up capital ratios and book value. KeyCorp was not “there” last summer in our analysis. However, we now believe they are very close and thus became a recent addition to the Fund’s long positions late in 2009. Liquid assets have tripled in the past year and KEY has made NO overt underwriting blunders in the downturn (unlike cross town rival National City now part of PNC). KEY’s rising NPL’s are due to the recession (actuarial) and thus pose zero risk to permanent impairment to the franchise (CAMEL analysis expanded below). As one veteran regional bank analyst said recently of KEY – “The loan loss provision, which is currently running 4.5%, is expected to decline to 1% as we enter 2011.” This means KEY is currently trading at about 5x 2011 EPS power. Extraordinary value! CAMEL Capital Adequacy
• Tangible equity 11% high among regional peers • Tangible common 8% solid • T1 RBC 13% high • Tot RBC 17% extraordinary • Primary capital 21% off the charts • Prime cap/NPL’s 538% silly; reserve release/stock buy-back coming
Asset Quality
• NPA’s 3.0% below peer average • NPL’s 3.9% below peer average • Noncurrent loan migration decelerated materially @ 3.0% in 2Q and 3.2% in 3Q • 90 day past dues dropped to 0.6% in 3Q from 0.8% 2Q; migration signaling peak • LLR/NPL 101% suggests reserve build has peaked
Management • Low risk management, but not to be confused with Wells, JP Morgan or US Bank • We think they should sell this bank in the next up cycle to a stronger management
team and get a better ROE out of this quality franchise
Earnings • KEY has never met its potential due to mediocre management (see above) • However, the balance sheet is under loaned and EPS power is $1+ in 2011
(Street way too low at 27c) • ROA should get back to 1.4% or $3 in EPS (regardless of management team)
Liquidity
• Net liquid assets make-up 66% of the stock’s market cap…enough said
22
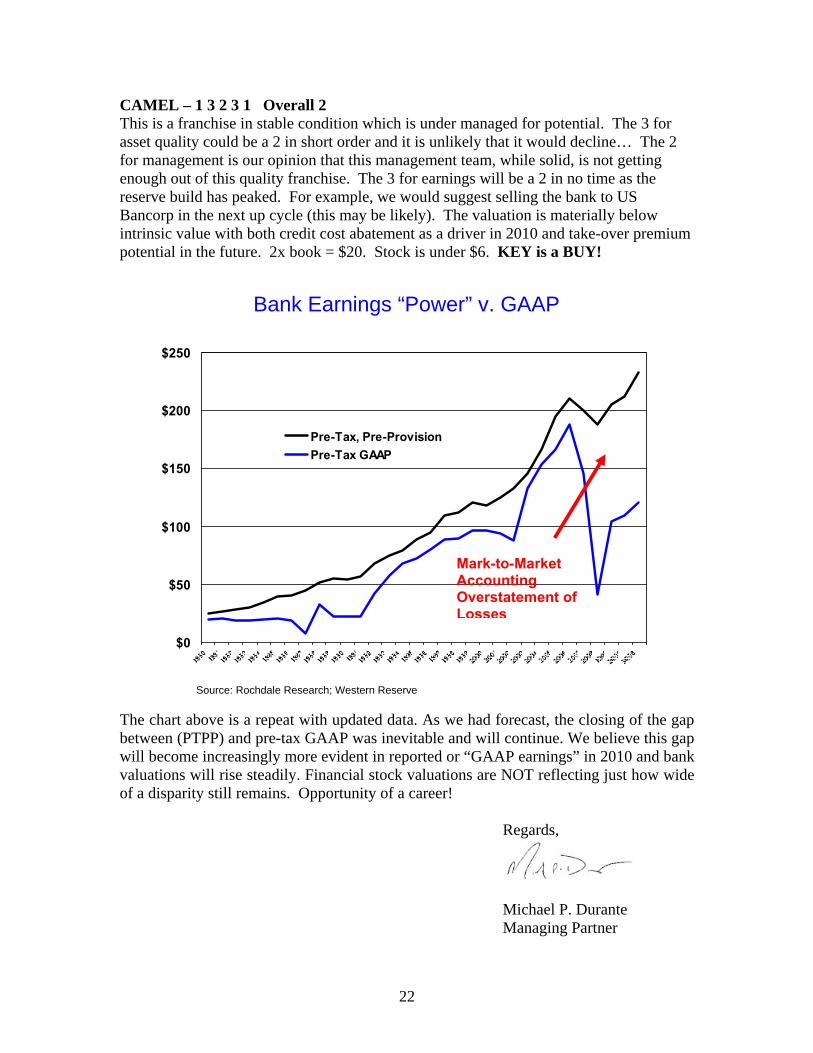
CAMEL – 1 3 2 3 1 Overall 2 This is a franchise in stable condition which is under managed for potential. The 3 for asset quality could be a 2 in short order and it is unlikely that it would decline… The 2 for management is our opinion that this management team, while solid, is not getting enough out of this quality franchise. The 3 for earnings will be a 2 in no time as the reserve build has peaked. For example, we would suggest selling the bank to US Bancorp in the next up cycle (this may be likely). The valuation is materially below intrinsic value with both credit cost abatement as a driver in 2010 and take-over premium potential in the future. 2x book = $20. Stock is under $6. KEY is a BUY!
The chart above is a repeat with updated data. As we had forecast, the closing of the gap between (PTPP) and pre-tax GAAP was inevitable and will continue. We believe this gap will become increasingly more evident in reported or “GAAP earnings” in 2010 and bank valuations will rise steadily. Financial stock valuations are NOT reflecting just how wide of a disparity still remains. Opportunity of a career!
Regards,
Michael P. Durante Managing Partner
$0
$50
$100
$150
$200
$250
Pre-Tax, Pre-ProvisionPre-Tax GAAP
Bank Earnings “Power” v. GAAP
Mark-to-Market Accounting Overstatement of Losses
Source: Rochdale Research; Western Reserve
23
Appendix – Historical Fund Performance
Performance vs. the Financial IndexPerformance vs. the Financial Index
-80.00%-60.00%
-40.00%-20.00%
0.00%20.00%40.00%
60.00%80.00%
100.00%120.00%
2004 2005 2006 2007 2008 2009 CumulativeRtn Since
Incep.
CumulativeAlpha
Perc
enta
ge
Western Reserve Gross Western Reserve Net Financial Composite Index
Western Reserve Gross Western Reserve Net Financial Composite Index
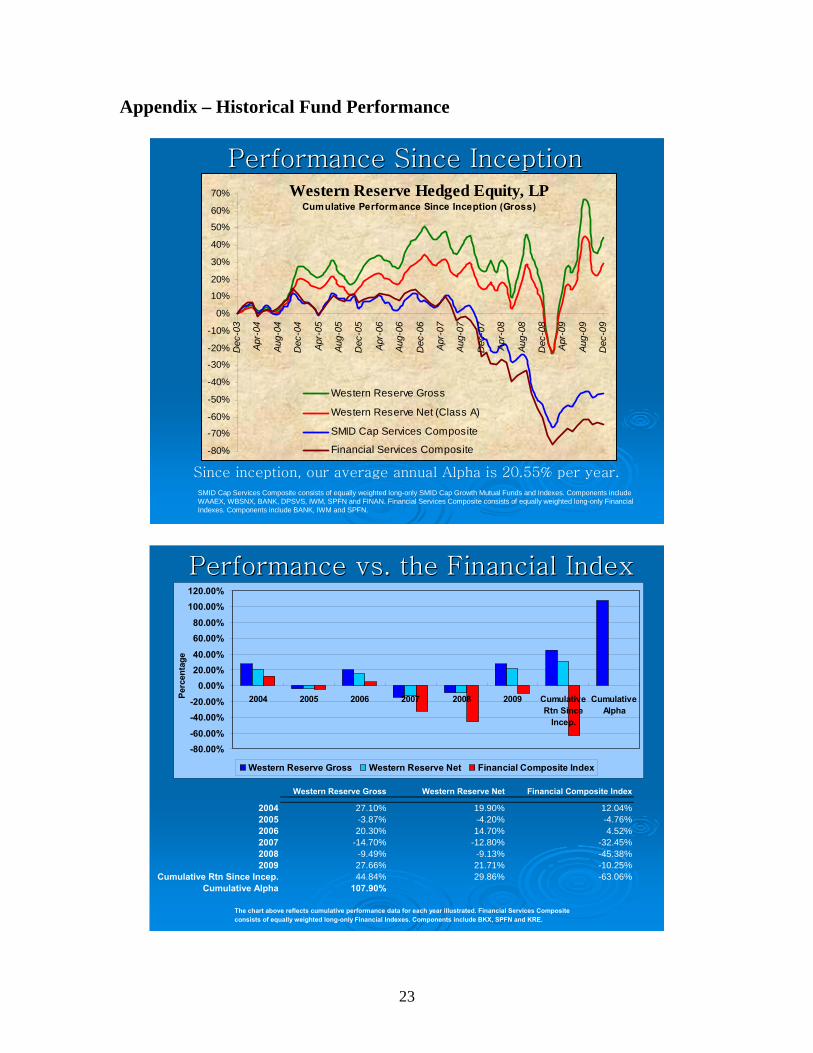
2004 27.10% 19.90% 12.04%2005 -3.87% -4.20% -4.76%2006 20.30% 14.70% 4.52%2007 -14.70% -12.80% -32.45%2008 -9.49% -9.13% -45.38%2009 27.66% 21.71% -10.25%
Cumulative Rtn Since Incep. 44.84% 29.86% -63.06%Cumulative Alpha 107.90%
The chart above reflects cumulative performance data for each year illustrated. Financial Services Composite consists of equally weighted long-only Financial Indexes. Components include BKX, SPFN and KRE.
Performance Since InceptionPerformance Since Inception
SMID Cap Services Composite consists of equally weighted long-only SMID Cap Growth Mutual Funds and Indexes. Components include WAAEX, WBSNX, BANK, DPSVS, IWM, SPFN and FINAN. Financial Services Composite consists of equally weighted long-only Financial Indexes. Components include BANK, IWM and SPFN.
Since inception, our average annual Alpha is 20.55% per year.
Western Reserve Hedged Equity, LP Cumulative Performance Since Inception (Gross)
-80%
-70%
-60%
-50%
-40%
-30%
-20%
-10%
0%
10%
20%
30%
40%
50%
60%
70%
Dec
-03
Apr-
04
Aug-
04
Dec
-04
Apr-
05
Aug-
05
Dec
-05
Apr-
06
Aug-
06
Dec
-06
Apr-
07
Aug-
07
Dec
-07
Apr-
08
Aug-
08
Dec
-08
Apr-
09
Aug-
09
Dec
-09
Western Reserve Gross
Western Reserve Net (Class A)
SMID Cap Services Composite
Financial Services Composite