micafungin klinische studien bei erwachsenen
TRANSCRIPT

MicafunginKlinische Studien bei Erwachsenen
Prof. Oliver A. Cornely, FIDSA
Klinik I für Innere MedizinHämatologie / Onkologie
Klinische Infektiologie / Intensivmedizin
Zentrum für Klinische StudienUniversität zu Köln

Supported by unrestricted grantsfrom Schering-Plough, Astellas Pharma and Gilead Sciences.
www.fungiscope.net
−Free species identification
−Free culture banking
−Free consult
−Moderate compensation
−Co-authorship
−Free drug level analysis

Micafungin – Klinische Studien bei Erwachsenen
1. van Burik JA, Ratanatharathorn V, Stepan DE, et al. Micafungin versusFluconazole for Prophylaxis against Invasive Fungal Infections duringNeutropenia in Patients Undergoing Hematopoietic Stem Cell Transplantation.Clin Infect Dis 2004 Nov 15;39(10):1407-16.
2. de Wet N, Llanos-Cuentas A, Suleiman J, et al. A randomized, double-blind, parallel-group, dose-response study of micafungin compared with fluconazolefor the treatment of esophageal candidiasis in HIV-positive patients. ClinInfect Dis 2004 Sep 15;39(6):842-9.
3. Kuse ER, Chetchotisakd P, da Cunha CA, et al.Micafungin versus liposomal amphotericin B for candidaemia and invasivecandidosis: a phase III randomised double-blind trial. Lancet 2007 May 5;369(9572):1519-27.
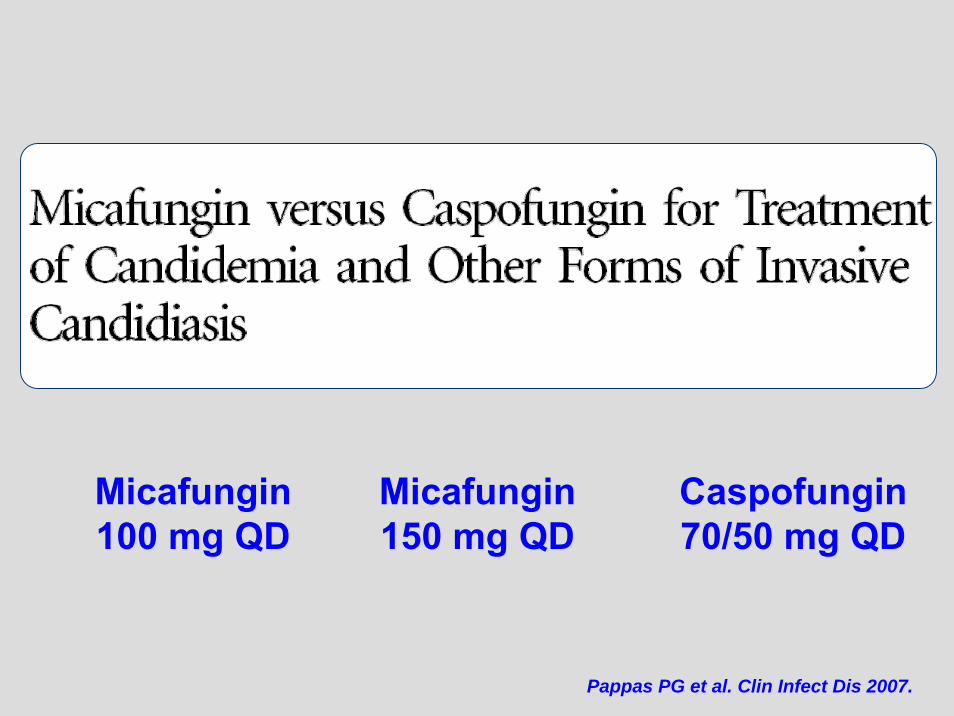
4. Pappas PG, Rotstein CM, Betts RF, et al. Micafungin versus caspofungin for treatment of candidemia and other forms of invasive candidiasis. Clin Infect Dis 2007 Oct 1;45(7):883-93.
Clinical Infectious Diseases 2004; 39:1407–16.

Study Design
• Randomized, double-blind Phase III study• 72 centers in the US and Canada• Patient population:
– HCT candidates ≥ 6 months of age– Autologous HCT for hematologic malignancies only

Statistical Plan and Data Analysis
• Objective: Assess non-inferiority of micafungin tofluconazole over a difference of 10%
• Primary endpoint: “treatment success”– Absence of suspected, proven, or probable invasive fungal
infection through the end of prophylaxis period– Absence of a proven or probable invasive fungal infection through
the end of the 4-week post-treatment period
• Definitions– Suspected: persistent fevers (≥ 100.4°F or ≥ 38°C) during
neutropenia despite 96 hours of broad spectrum antibacterial therapy
– Proven and Probable: criteria established by BAMSG

micafungin(n=425)
253 (60%)
39 (9%)
203 (48%)
220 (52%)
127 (30%)
94 (22%)
fluconazole(n=457)
274 (60%)
45 (10%)
201 (44%)
256 (56%)
152 (33%)
104 (23%)
Male gender
Age < 16 years
Syngeneic/autologous
Allogeneic
High risk
Low risk
Demographics882 patients received at least one dose

micafungin(n=425)
178 (42%)
(n=386)104 (27%)83 (22%)46 (12%)48 (12%)
(n=39)15 (39%)
7 (18%)
fluconazole(n=457)
187 (41%)
(n=412)104 (25%)90 (22%)62 (15%)54 (13%)
(n=45)11 (24%)12 (27%)
Active underlying disease
AdultsNHLMM AMLCML
PediatricALLAML
Underlying Disease

Treatment success
Treatment difference
micafungin
340 / 425 (80%)
+6.5% (95% CI, 0.9% to 12%)
fluconazole
336 / 457 (73.5%)
P=0.03 micafungin compared to fluconazole
Results: Study Endpoints

Use of empirical antifungal therapy
micafungin
64 / 425 (15.1%)
fluconazole
98 / 457 (21.4%)
P=0.018 micafungin compared to fluconazole
Results: Study Endpoints

Breakthrough fungal infection
Aspergillus *
Proven
Probable
Candida
Fusarium
Zygomycetes
Death
Death due to fungal infection
micafungin
7 / 425 (1.6%)
1
0
1
4
1
1
18 / 425 (4.2%)
1 (Zygomycetes)
fluconazole
11 / 457 (2.4%)
7
4
3
2
2
0
26 / 457 (5.7%)
2 (Pulmonaryaspergillosis)
* P=0.07 Micafungin compared to Fluconazole
Results: Study Endpoints
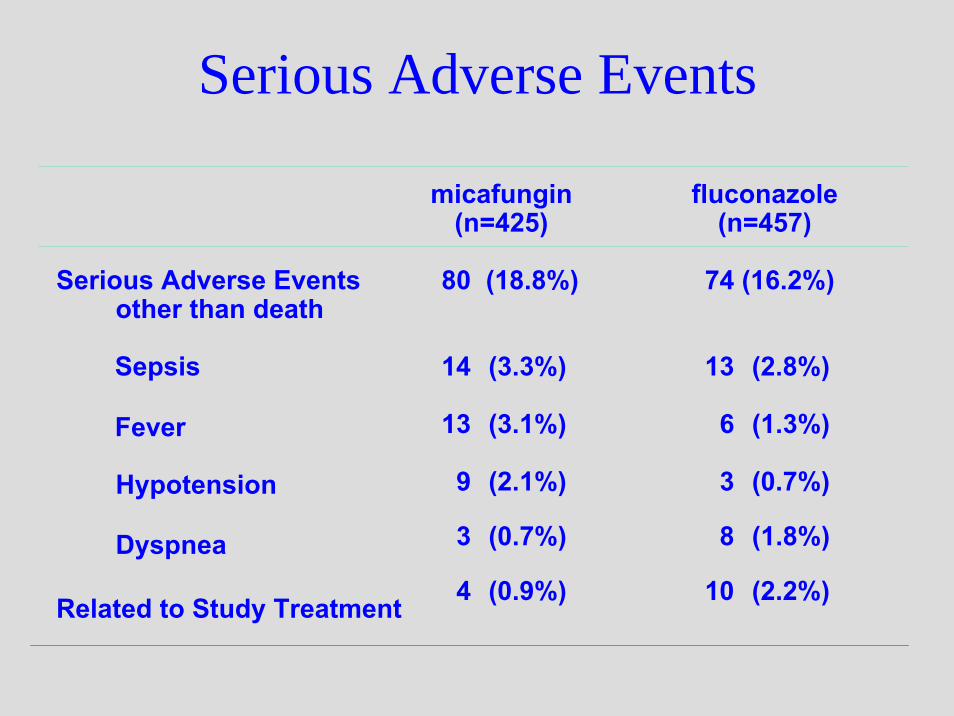
micafungin(n=425)
80 (18.8%)
14 (3.3%)
13 (3.1%)
9 (2.1%)
3 (0.7%)
4 (0.9%)
fluconazole(n=457)
74 (16.2%)
13 (2.8%)
6 (1.3%)
3 (0.7%)
8 (1.8%)
10 (2.2%)
Serious Adverse Eventsother than death
Sepsis
Fever
Hypotension
Dyspnea
Related to Study Treatment
Serious Adverse Events

Prophylaxis Study: Treatment Conclusions• Micafungin demonstrated a greater overall
treatment difference compared with fluconazolefor antifungal prophylaxis during the neutropenicphase of HSCT– Statistically significantly overall higher treatment
success rate– Less empirical antifungal therapy– Fewer breakthrough infections with Aspergillus
• The first randomized clinical trial to demonstrate efficacy of an echinocandin for prophylaxis inneutropenic hosts

Kuse ER et al. Lancet 2007.
Micafungin100 mg QD
LiposomalAmphotericin B
3 mg/kg QD

Patient Characteristics (ITT)Candidaemia ± Invasive Candidiasis MICA 100 QD vs. L-AmB 3 QD
MicafunginN= 264
L-AmBN= 267
ICU 135 (51%) 135 (51%)Respirator 89 (34%) 99 (37%)CVC 223 (85%) 241 (80%)Dialysis 34 (13%) 23 (9%)Neutropenia 34 (13%) 28 (11%)
Kuse ER et al. Lancet 2007.

Overall Survival (ITT)Candidaemia ± Invasive Candidiasis MICA 100 QD vs. L-AmB 3 QD
Micafungin
L-AmB
Prop
ortio
nSu
rviv
ing
1.00
0.75
0.50
0.25
0.00
0 25 50 75 100 125 150 175Day
Kuse ER et al. Lancet 2007.

Overall Treatment Successby Neutropenic Status
Candidaemia ± Invasive Candidiasis MICA 100 QD vs. L-AmB 3 QD
Trea
tmen
t suc
cess
rate
(%)
*Adjusted for neutropenic statusmITT = received at least 1 dose and had confirmed candidiasis
247 247 215 22232 25
Difference in proportions: 4.5% (95% CI: –3.5 to 12.4)* MICA
L-AmB
n =
74.1
59.4
76.369.6
56.0
71.2
0
20
40
60
80
100
Overall Neutropenic Non-neutropenic
Kuse ER et al. Lancet 2007.

Treatment Success by Candida SpeciesCandidaemia ± Invasive Candidiasis MICA 100 QD vs. L-AmB 3 QD
Trea
tmen
t suc
cess
rate
(%)
247 247 102 110 30 19 66 62 42 38 9 10Any
Candidaspecies
C. albicans C. glabrata C. tropicalis C. parapsilosis C. krusei
mITT = received at least 1 dose and had confirmed candidiasis
74.1 76.5
63.372.7
78.6
55.6
69.6 68.263.2 67.7 71.1
60.0
0
20
40
60
80
100 MICA L-AmB
n =
Kuse ER et al. Lancet 2007.

Risk Factors for Failure –Multivariate Logistic Regression
Candidaemia ± Invasive Candidiasis MICA 100 QD vs. L-AmB 3 QD
Horn D et al. ECCMID 2008; Poster 1024.

Glomerular Filtration RateCandidaemia ± Invasive Candidiasis MICA 100 QD vs. L-AmB 3 QD
*p < 0.01** p < 0.001
Micafungin L-AmB
****
*
Kuse ER et al. Lancet 2007.
Baseline Week 1 Week 2 EoT0
20
40
60
80
100
120
140
160
180
ml/m
in*1
.73m
2
*p < 0.01**p < 0.001
** ***
Micafungin100 mg QD
Caspofungin70/50 mg QD
Micafungin150 mg QD
Pappas PG et al. Clin Infect Dis 2007.

Time to Negative Blood CultureCandidaemia ± Invasive Candidiasis MICA 100 QD vs. MICA 150 QD
vs. CAS 70/50 QD
Time on Study (Days)
Prop
ortio
n M
ycol
ogic
ally
Erad
icat
ed (%
)
0
20
40
60
80
100
0 5 10 15 20 25 30 35 40 45 50 55 60
MICAFUNGIN 100 mgMICAFUNGIN 150 mgCASPOFUNGIN
Pappas PG et al. Clin Infect Dis 2007.

Overall MortalityCandidaemia ± Invasive Candidiasis MICA 100 QD vs. MICA 150 QD
vs. CAS 70/50 QD
Time on Study (Days)
Prop
ortio
n Su
rviv
ing
(%)
0
20
40
60
80
100
0 5 10 15 20 25 30 35 40 45 50 55 60 65 70 75 80 85 90 95 100 105 110
MICAFUNGIN 100 mgMICAFUNGIN 150 mgCASPOFUNGIN
Pappas PG et al. Clin Infect Dis 2007.

Overall Treatment Success by Neutropenic StatusCandidaemia ± Invasive Candidiasis
76.481.8
75.771.4
52.9
73.172.363.6
72.9
0
20
40
60
80
100
22 169 18217 11 177Non-neutropenicNeutropenic
Trea
tmen
t suc
cess
rate
(%)
191 199 188Overall
*95% CI –9.3–7.8; †95% CI –4.4–12.3Adjusted for APACHE II score
†
*
n =
MICA 100 MICA 150 CASPO 70→50
Pappas PG et al. Clin Infect Dis 2007.

Treatment Success by Candida Species (mITT)Candidaemia ± Invasive Candidiasis
77.2 75.0
85.7
67.7
75.9 75.069.6 71.6
88.2
60.6
71.4
62.5
73.5 71.166.7
75.0
64.3
75.0
0
10
20
30
40
50
60
70
80
90
100
Trea
tmen
t suc
cess
rate
(%)
C. albicans Any non- C. glabrata C. tropicalis C. parapsilosis C. kruseialbicans
p = NS for all comparisons.
p = 0.07
MICA 100 MICA 150 CASPO 70→50
n = 92 102 83 104102 114 28 34 33 31 33 32 29 21 42 8 8 4
Pappas PG et al. Clin Infect Dis 2007.

Risk Factors for Failure –Multivariate Logistic Regression
Candidaemia ± Invasive Candidiasis MICA 100 QD vs. MICA 150 QD vs. CAS 70/50 QD
Horn D et al. ECCMID 2008; Poster 1024.

Safety

Hepatic function laboratory AEs suspected of being treatment-related
Treatment setting Invasive candidiasis (Pappas et al.)2
Invasive candidiasis(Kuse et al.)3
Treatment group MICA CASP MICA L-AmBDaily dose 100 mg 70/50 mg 100 mg 3 mg/kgPatients, n 200 193 316 321Adverse event (%; adults & children combined)AST increased 0.5 0.5 2.2 0.9ALT increased 0.5 1.6 1.6 0.3
Alk. phos. increased 3.5 2.6 1.9 0.9
Bilirubin increased 0 0 2.5 2.8
Alk. phos.:alkaline phosphatase; CASP: caspofungin; L-Amb: liposomal amphotericin B; MICA: micafungin; ALT: alanine aminotransferase; AST: aspartate aminotransferase
1. Astellas Pharma Europe Ltd. Data on file. February 2008; 2. Pappas PG et al. CID 2007; 45:883–933.. Kuse ER et al. Lancet 2007; 369:1519–27;

Frequency of changes in hepatic lab values: Pooled micafungin clin. database (n = 3,028)
Cornely OA et al. 47th ICAAC (2007)
ALT: alanine aminotransferase; AST: aspartate aminotransferase; EOT: end of treatment ULN: upper limit of normal; normal: ≤ ULN; high > ULNIncrease is measured as ≥ ULN at EOT
Patie
nts
(%)
50
40
30
20
10
01,654 1,654 1,102 1,753 1,753 990
Normal at baseline to > ULN at EOT
Normal at baseline to ≥ 2.5 x ULN at EOTHigh at baseline to normal at EOT
AST ALTn =

Pooled Analysis of Safety for Micafungin
Treatment duration (days to first occurrence)1–14 15–28 29–42 >42 OverallAE
n=3028 n=1341 n=348 n=168 N=3028
Nausea 78 (2.6) 5 (0.4) 0 (0.0) 1 (0.6) 84 (2.8)
Blood AP increased 68 (2.2) 9 (0.7) 4 (1.1) 0 (0.0) 81 (2.7)
Phlebitis 69 (2.3) 5 (0.4) 0 (0.0) 1 (0.6) 75 (2.5)
Vomiting 71 (2.3) 3 (0.2) 1 (0.3) 0 (0.0) 75 (2.5)
AST increased 54 (1.8) 11 (0.8) 4 (1.1) 2 (1.2) 71 (2.3)
Hypokalemia 54 (1.8) 8 (0.6) 1 (0.3) 0 (0.0) 63 (2.1)
Pyrexia 61 (2.0) 2 (0.1) 0 (0.0) 0 (0.0) 63 (2.1)
TRAE (≥2%) by Days of Exposure, n (%)
Cornely OA et al. ECCMID 2008; Poster 1023.

Pooled Analysis of Safety for Micafungin
1–14 15–28 29–42AE
(n = 2,653) (n = 1,067) (n = 156)
Phlebitis 68 (2.6) 5 (0.5) 0 (0.0)
Nausea 65 (2.5) 5 (0.5) 0 (0.0)
Blood Alk. Phos. increased 60 (2.3) 6 (0.6) 3 (1.9)
Vomiting 63 (2.4) 3 (0.3) 0 (0.0)
AST increased 52 (2.0) 9 (0.8) 4 (2.6)
Pyrexia 57 (2.1) 2 (0.2) 0 (0.0)
Rash 53 (2.0) 3 (0.3) 0 (0.0)
Diarrhoea 52 (2.0) 2 (0.2) 1 (0.6)
Leukopenia 52 (2.0) 2 (0.2) 1 (0.6)
TRAE (≥2%) by Days of Exposure, n (%)
Cornely OA et al. ECCMID 2008; Poster 1023.

OverallAdults, non-
elderly(16–64 years)
Adults, elderly (≥ 65 years)
Paediatrics(< 16 years)AE
(n = 2,653) (n = 2,091) (n = 336) (n = 226)Phlebitis 73 (2.8) 64 (3.1) 6 (1.8) 3 (1.3)Nausea 70 (2.6) 62 (3.0) 7 (2.1) 1 (0.4)Blood Alk. Phos. increased 69 (2.6) 56 (2.7) 9 (2.7) 4 (1.8)
Vomiting 66 (2.5) 55 (2.6) 8 (2.4) 3 (1.3)AST increased 65 (2.5) 61 (2.9) 2 (0.6) 2 (0.9)Pyrexia 59 (2.2) 49 (2.3) 7 (2.1) 3 (1.3)Hypokalaemia 58 (2.2) 41 (2.0) 9 (2.7) 8 (3.5)Rash 56 (2.1) 50 (2.4) 2 (0.6) 4 (1.8)Diarrhoea 55 (2.1) 46 (2.2) 6 (1.8) 3 (1.3)Leukopenia 55 (2.1) 53 (2.5) 1 (0.3) 1 (0.4)ALT increased 52 (2.0) 45 (2.2) 3 (0.9) 4 (1.8)
TRAE (≥ 2%) by Age Group
Cornely OA et al. ECCMID 2008; Poster 1023.
Pooled Analysis of Safety for Micafungin
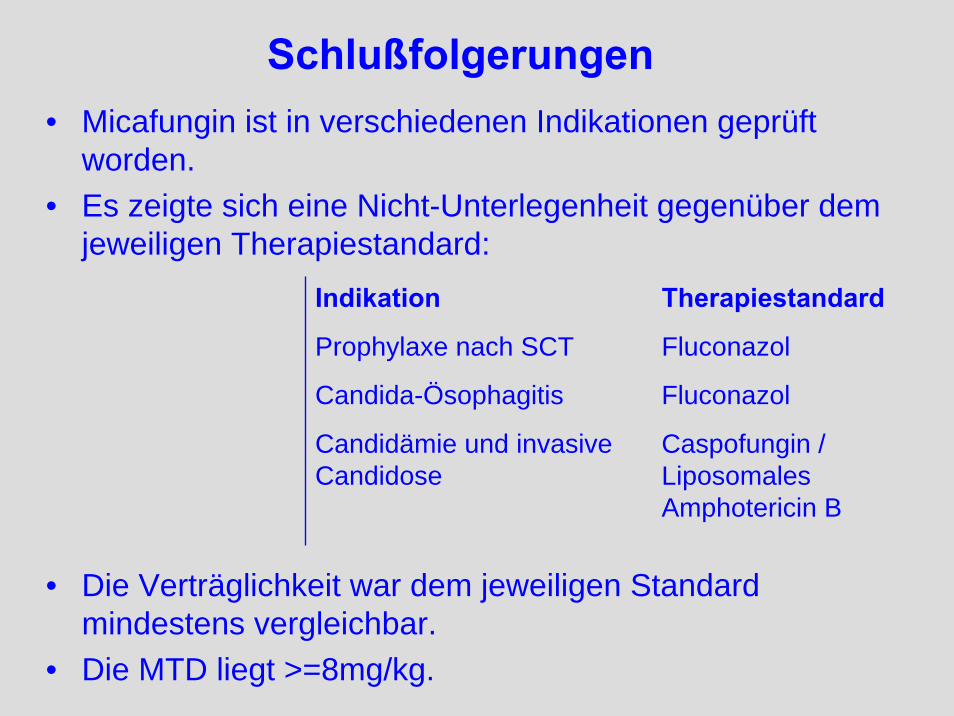
Schlußfolgerungen• Micafungin ist in verschiedenen Indikationen geprüft
worden.• Es zeigte sich eine Nicht-Unterlegenheit gegenüber dem
jeweiligen Therapiestandard:Indikation Therapiestandard
Prophylaxe nach SCT Fluconazol
Candida-Ösophagitis Fluconazol
Candidämie und invasive Candidose
Caspofungin / Liposomales Amphotericin B
• Die Verträglichkeit war dem jeweiligen Standard mindestens vergleichbar.
• Die MTD liegt >=8mg/kg.
