mic nov2012
TRANSCRIPT

November 2012
Macquarie Infrastructure Company LLC
November 2012

Disclaimer
Forward Looking Statements
This presentation by Macquarie Infrastructure Company LLC (MIC) is proprietary and all rights are reserved. Any reproduction, in whole or in part,ith t th i itt t f M i I f t t C i hibit dwithout the prior written consent of Macquarie Infrastructure Company is prohibited.
This presentation is based on information generally available to the public and does not contain any material, non-public information. Thepresentation has been prepared solely for information purposes, it is not a solicitation of any offer to buy or sell any security or instrument.
This presentation contains forward-looking statements. Forward-looking statements in this presentation are subject to a number of risks anduncertainties, some of which are beyond our control. Our actual results, performance, prospects or opportunities could differ materially from thoseexpressed in or implied by the forward-looking statements. A description of known risks that could cause our actual results to differ appears underth ti “Ri k F t ” i F 10 K Additi l i k f hi h t tl ld l t l lt t diffthe caption “Risk Factors” in our Form 10-K. Additional risks of which we are not currently aware could also cause our actual results to differ.
These forward-looking statements are made as of the date of this presentation. We undertake no obligation to publicly update or revise anyforward-looking statements whether as a result of new information, future events or otherwise, except as required by law.
“Macquarie Group” consists of Macquarie Group Limited and its worldwide subsidiaries and affiliates.
MIC is not an authorised deposit-taking institution for the purposes of the Banking Act 1959 (Commonwealth of Australia) and its obligations do notrepresent deposits or other liabilities of Macquarie Bank Limited ABN 46 008 583 542. Macquarie Bank Limited does not guarantee or otherwisep p q q gprovide assurance in respect of the obligations of MIC.
Use of Non-GAAP Measures
MIC has reported EBITDA excluding non-cash items on a consolidated and operating segment basis and reconciled each to the correspondingfinancial statements. EBITDA excluding non-cash items is a metric relied upon by management in evaluating the performance of its businesses andi t t EBITDA l di h it i d fi d i b f i t t t d i ti d ti ti d h itinvestments. EBITDA excluding non-cash items is defined as earnings before interest, taxes, depreciation and amortization and non-cash items,which include impairments, derivative gains and losses and adjustments for other non-cash items reflected in the statement of operations.
MIC also discloses Free Cash flow, as defined by MIC, as a means of assessing the amount of cash generated by its businesses and as asupplement to other information provided in accordance with GAAP. MIC defines Free Cash Flow as cash from operating activities, lessmaintenance capital expenditures and changes in working capital.
MIC believes that EBITDA excluding non-cash items and Free Cash Flow provide additional insight into the performance of its operating businesses,l ti t h th d t i il b i ith t d t it l t t d th i bilit t i d d bt f d it l
2
relative to each other and to similar businesses, without regard to capital structure, and their ability to service or reduce debt, fund capitalexpenditures and/or support distributions to the holding company.

Agendag
SectionSection
1 MIC Opportunity2 Investments3 Approach to Valuationpp4 Appendix: Segment Financial Data
3

11MIC Opportunity
4
MIC Opportunity

MIC OpportunityG th d IGrowth and Income
MIC o ns and in ests in q alit U S infrastr ct re b sinessesMIC owns and invests in quality, U.S. infrastructure businesses
Infrastructure businesses:
Provide essential services– Provide essential services
– Enjoy a preferred position in their respective markets
Provide an inflation hedge– Provide an inflation hedge
Properly capitalized:
Produce above average amounts of distributable cash– Produce above average amounts of distributable cash
– Leverage = approximately 4.2x (debt:TTM EBITDA)1
5
1 Analysis reflects proportionate combination of debt and EBITDA generated by MIC’s businesses and investments at September 30, 2012.

MIC OpportunityG th d IGrowth and Income
MIC distrib tes “s bstantiall all” free cash floMIC distributes “substantially all” free cash flow
MIC expects to:
Generate $3 70 in proportionately combined1 free cash flow in– Generate $3.70 in proportionately combined1 free cash flow in
2012, normalized for swap break fees at Hawaii Gas2
– Distribute $2 75 (annualized) as a cash dividendDistribute $2.75 (annualized) as a cash dividend
Free cash flow increases may be driven by:
– Strong growth drivers in each businessStrong growth drivers in each business
– Effective management of expenses and capital structure
6
1 GAAP earnings alone do not reflect the cash generated by the equity-accounted-for investment in IMTT, MIC’s proportionate share of District Energy or the non-cash expenses (depreciation and amortization) attributable to each of MIC’s businesses.
2 Hawaii Gas incurred $0.19 per share in interest rate swap break fees in the third quarter of 2012 in connection with the refinancing of its debt facilities.

MIC OpportunityG th d IGrowth and Income
C G
ManagementMacquarie GroupLimited
Macquarie Infrastructure Company
MIC is externally managed by Macquarie Group Limited
Services Agreement
Limited
(ASX: MQG)
Company
(NYSE: MIC)
Hawaii GasInternational-Matex
Tank TerminalsDistrict Energy Atlantic Aviation
Tank Terminals100% 50.0% 50.01% 100%
7

MIC OpportunityG th d IGrowth and Income
TTM September 30 2012 Proportionately Combined Free Cash Flow1TTM September 30, 2012 Proportionately Combined Free Cash Flow1
by Segment
International
%2
16%
International-Matex Tank Terminals
Atlantic Aviation39%24%2 Atlantic Aviation
District Energy
41% Hawaii Gas
8
1. Excludes non-operating holding company results. See 3Q’12 earnings press release for reconciliation of net income (loss) to EBITDA, excluding non-cash items and EBITDA excluding non-cash items to free cash flow, by operating segment.
2. Represents MIC’s 50% interest in IMTT and 50.01% interest in District Energy.

22Investments
9
Investments

22aInternational-Matex
10
Tank Terminals
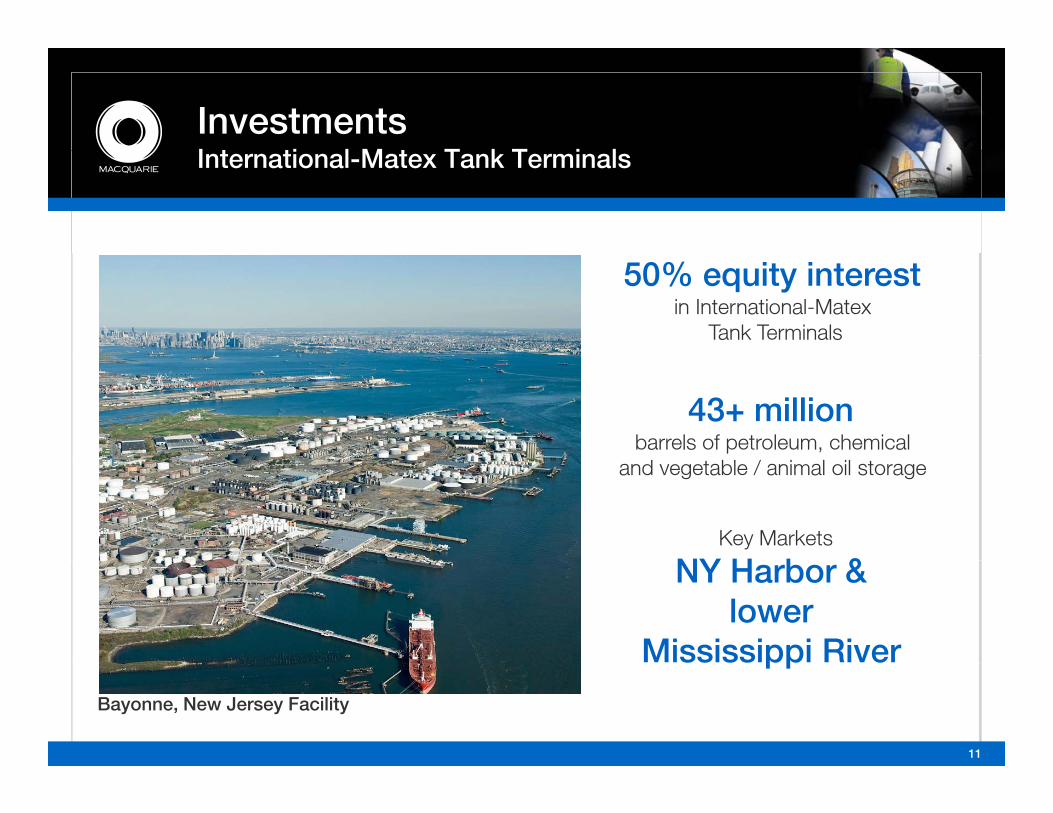
InvestmentsI t ti l M t T k T i lInternational-Matex Tank Terminals
50% equity interestin International-Matex
Tank Terminals
43+ million barrels of petroleum, chemical
and vegetable / animal oil storage
Key Markets
NY H b &NY Harbor & lower
Mississippi River
11
ppBayonne, New Jersey Facility
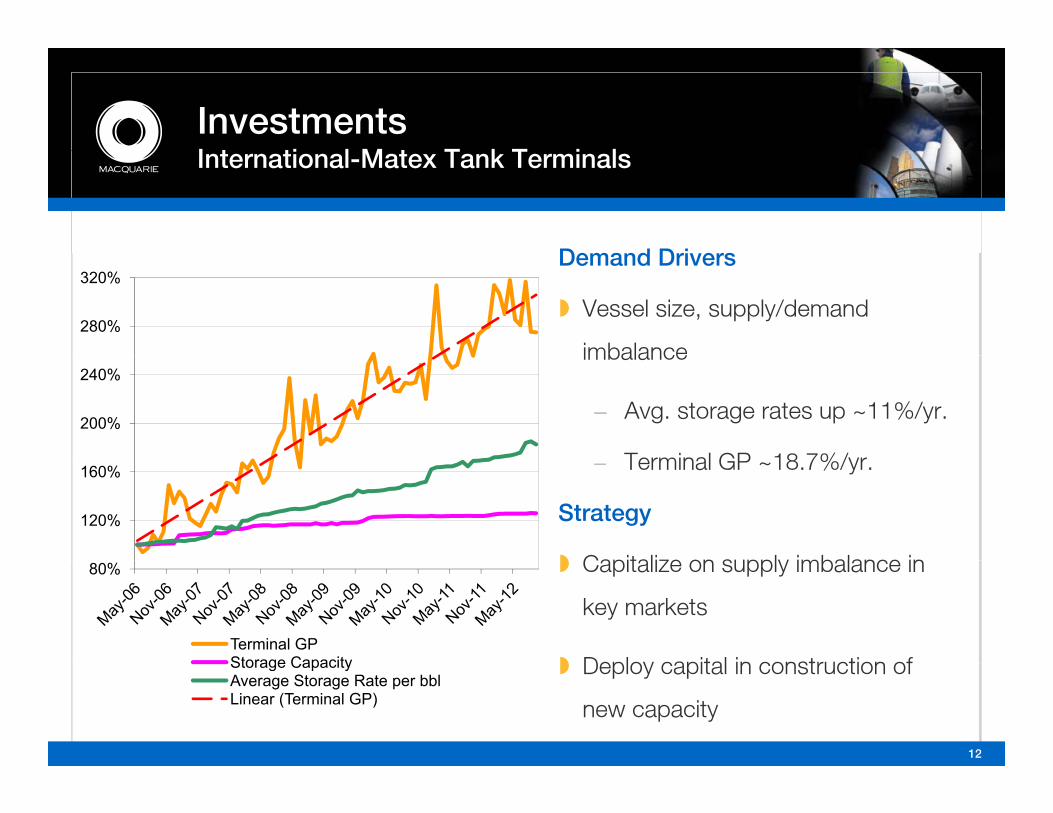
InvestmentsI t ti l M t T k T i lInternational-Matex Tank Terminals
Demand Dri ersDemand Drivers
Vessel size, supply/demand
imbalance280%
320%
imbalance
– Avg. storage rates up ~11%/yr.
Terminal GP 18 7%/yr
200%
240%
– Terminal GP ~18.7%/yr.
Strategy
Capitalize on supply imbalance in
120%
160%
Capitalize on supply imbalance in
key markets
Deploy capital in construction of
80%
Terminal GPStorage Capacity
12
Deploy capital in construction of
new capacity
Storage CapacityAverage Storage Rate per bblLinear (Terminal GP)

2b2bAtlantic Aviation
13
Atlantic Aviation

InvestmentsAtl ti A i tiAtlantic Aviation
Largest US network of Fixed Base Operations (FBO)
Operations at
63 airports63 airports
Providing primarily
fuel-related servicesto general aviation aircraft
14

InvestmentsAtl ti A i tiAtlantic Aviation
Demand DriversDemand Drivers
Utilization of GA aircraftUS Business Jet Flight Movements1
12.0%
14.0%
– Growing volume of fuel sold,
average margin
Strategy6.0%
8.0%
10.0%
Strategy
Operate at some of the popular
destinations in the U.S.(2.0%)
-%
2.0%
4.0%
destinations in the U.S.
Focus on safety(4.0%)
Industry Jet Traffic
15
1 Source: FAA, ETMSC data
Reduce leverage, refinance, unlock
cash flows

22cHawaii Gas
16
Hawaii Gas

InvestmentsH ii GHawaii Gas
Sole gas utility on the islands of Hawaii
Largest distributor of LPG
17

InvestmentsH ii GHawaii Gas
Demand Dri ersDemand Drivers
Recovering economy, high-cost
alternatives70.0
80.0
alternatives
Gas as clean fuel alternative50.0
60.0
70.0
Strategy
Maintain preferred position in local
marketmarket
Implement LNG importation
program
Total Gas Volume Sold (therms, millions)
Total Visitors (millions x 10)
18
program
112 months through June 30, 2012; Source Hawaii DBEDT

2d2dDistrict Energy
19
District Energy

InvestmentsDi t i t EDistrict Energy
Provider of
cooling services to high-rise buildings in
downtown Chicago
Separate operation providing
cooling, h ti dheating and
backup electricityto hotel / casino in Las Vegas
20
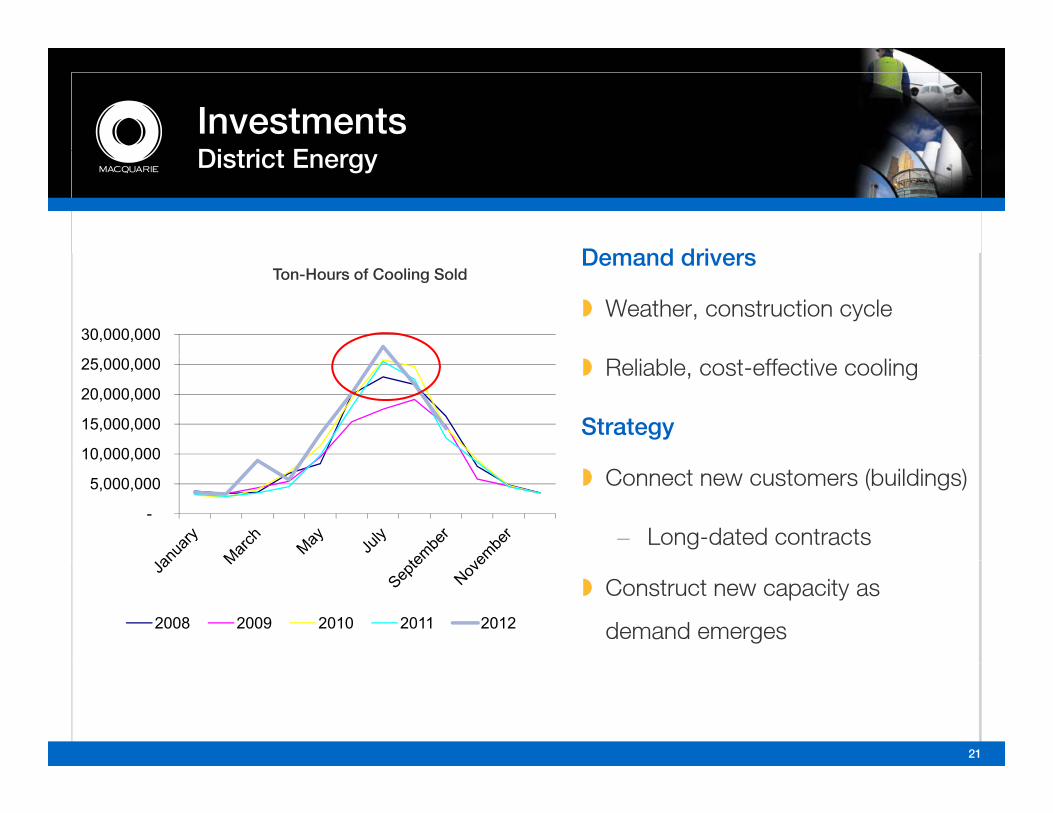
InvestmentsDi t i t EDistrict Energy
Demand dri ersDemand drivers
Weather, construction cycle
Ton-Hours of Cooling Sold
30,000,000
Reliable, cost-effective cooling
Strategy10,000,000
15,000,000
20,000,000
25,000,000
Connect new customers (buildings)
– Long-dated contracts-
5,000,000
10,000,000
Construct new capacity as
demand emerges2008 2009 2010 2011 2012
21

33Approach to Valuation
22
Approach to Valuation

Approach to ValuationC id tiConsiderations
Cash Dri en StorCash Driven Story
Proportionately Combined Free Cash Flow – key reporting measure
Reconciled to EBITDA excluding non cash items and GAAP measuresReconciled to EBITDA excluding non-cash items and GAAP measures
Captures cash from operating entities
Excludes changes in working capitalExcludes changes in working capital
GAAP i l d t fl t th h t d b MIC’GAAP earnings alone do not reflect the cash generated by MIC’s
equity-accounted-for investment in IMTT, MIC’s proportionate share
of District Energy or the non-cash expenses (e.g. depreciation and
23
gy p ( g p
amortization) attributable to each of MIC’s businesses

Approach to ValuationC id tiConsiderations
0.8
0.9
1
9
10
Pro
FreMul
tiple
0.5
0.6
0.7
7
8
oportionately Cee C
ash Flowed L
ever
age
ash
EB
ITD
A)
0.2
0.3
0.46
Com
bined w
($/share)at
ely
Com
bin
Net
Deb
t : C
a
0
0.1
0.2
4
5
Q4 2008 Q2 2009 Q4 2009 Q2 2010 Q4 2010 Q2 2011 Q4 2011 Q2 2012
Pro
port
iona (N
24
LeverageFree Cash FlowProportionately Combined Free Cash Flow (RHS)
Proportionately Combined Leverage (LHS)

Approach to ValuationM th d l iMethodologies
Relati e Val ation Meas resRelative Valuation Measures
Lack of comparables
Price favorable to broader market on free cash flow measuresPrice favorable to broader market on free cash flow measures
25

Approach to ValuationM th d l iMethodologies
S m of the Parts DCFSum-of-the-Parts DCF
Definition of Free Cash Flow
In proportion to MIC’s equity interest in each businessIn proportion to MIC’s equity interest in each business
Good visibility into key components
Debt facilities fixedDebt facilities fixed
Reasonably knowable capex
Tax shield into 2015Tax shield into 2015
26
Approach to ValuationM th d l iMethodologies
Yield / Di idend Disco ntYield / Dividend Discount
Current yield ~6.4%
Implied dividend growth rate 10 0%/yearImplied dividend growth rate ~10.0%/year
27

Summary and Next Stepsy p
SummarySummary
Growth and Income opportunity
Good businesses solid fundamentalsGood businesses, solid fundamentals
Attractive valuation
For additional information contactFor additional information, contact
Jay Davis (212) 231-1825
jay davis@macquarie [email protected]
28

44Appendix –Reconciliation of Segment
29
Reconciliation of Segment Financial Data

Energy Related: IMTTIMTT
Quarter Ended Nine Months Ended
2012 2011 2012 2011$ $ $ % $ $ $ %
RevenueTerminal revenue 111,532 102,794 8,738 8.5 332,316 310,245 22,071 7.1 Environmental response revenue 7,069 11,775 (4,706) (40.0) 18,052 22,105 (4,053) (18.3)
($ In Thousands) (Unaudited)
Quarter Ended September 30,
Nine Months Ended September 30,
Change Favorable/(Unfavorable)
Change Favorable/(Unfavorable)
Total revenue 118,601 114,569 4,032 3.5 350,368 332,350 18,018 5.4 Costs and expensesTerminal operating costs 49,509 46,289 (3,220) (7.0) 141,886 140,459 (1,427) (1.0)Environmental response operating costs 5,913 7,288 1,375 18.9 15,515 16,031 516 3.2
Total operating costs 55,422 53,577 (1,845) (3.4) 157,401 156,490 (911) (0.6)Terminal gross profit 62,023 56,505 5,518 9.8 190,430 169,786 20,644 12.2 Environmental response gross profit 1,156 4,487 (3,331) (74.2) 2,537 6,074 (3,537) (58.2)
Gross profit 63,179 60,992 2,187 3.6 192,967 175,860 17,107 9.7 General and administrative expenses 7,605 7,995 390 4.9 22,405 23,575 1,170 5.0 Depreciation and amortization 16,992 16,052 (940) (5.9) 51,016 48,087 (2,929) (6.1)
Operating income 38,582 36,945 1,637 4.4 119,546 104,198 15,348 14.7 Interest expense, net(1) (10,533) (24,319) 13,786 56.7 (28,914) (45,313) 16,399 36.2 Other income 417 94 323 NM 1,680 1,214 466 38.4 Provision for income taxes (11,631) (5,537) (6,094) (110.1) (37,867) (24,984) (12,883) (51.6)Noncontrolling interest (451) 94 (545) NM (636) 185 (821) NM
Net income 16,384 7,277 9,107 125.1 53,809 35,300 18,509 52.4
30

Energy Related: IMTT (C t )IMTT (Cont.)
Quarter Ended Nine Months Ended
2012 2011 2012 2011$ $ $ % $ $ $ %
($ In Thousands) (Unaudited)
Quarter Ended September 30,
Nine Months Ended September 30,
Change Favorable/(Unfavorable)
Change Favorable/(Unfavorable)
Reconciliation of net income to EBITDA excluding non-cash items:Net income 16,384 7,277 53,809 35,300 Interest expense net(1) 10 533 24 319 28 914 45 313Interest expense, net( ) 10,533 24,319 28,914 45,313 Provision for income taxes 11,631 5,537 37,867 24,984 Depreciation and amortization 16,992 16,052 51,016 48,087 Other non-cash expense (income) 369 (102) 647 (156)EBITDA excluding non-cash items 55,909 53,083 2,826 5.3 172,253 153,528 18,725 12.2
EBITDA excluding non-cash items 55,909 53,083 172,253 153,528 Interest expense, net(1) (10,533) (24,319) (28,914) (45,313)
Adjustments to derivative instruments recorded in interest expense(1) 461 15,345 98 18,653 Amortization of debt financing costs(1) 805 808 2,419 2,426
Provision for income taxes, net of changes in deferred taxes (5,962) (6,181) (14,565) (13,765)Changes in working capital 5,382 (17,621) 17,680 (30,468)Cash provided by operating activities 46,062 21,115 148,971 85,061 Changes in working capital (5,382) 17,621 (17,680) 30,468 Maintenance capital expenditures (15,303) (14,539) (30,756) (36,058)
Free cash flow 25 377 24 197 1 180 4 9 100 535 79 471 21 064 26 5Free cash flow 25,377 24,197 1,180 4.9 100,535 79,471 21,064 26.5 _____________________NM - Not meaningful(1) Interest expense, net, includes adjustments to derivative instruments and non-cash amortization of deferred financing fees.
31
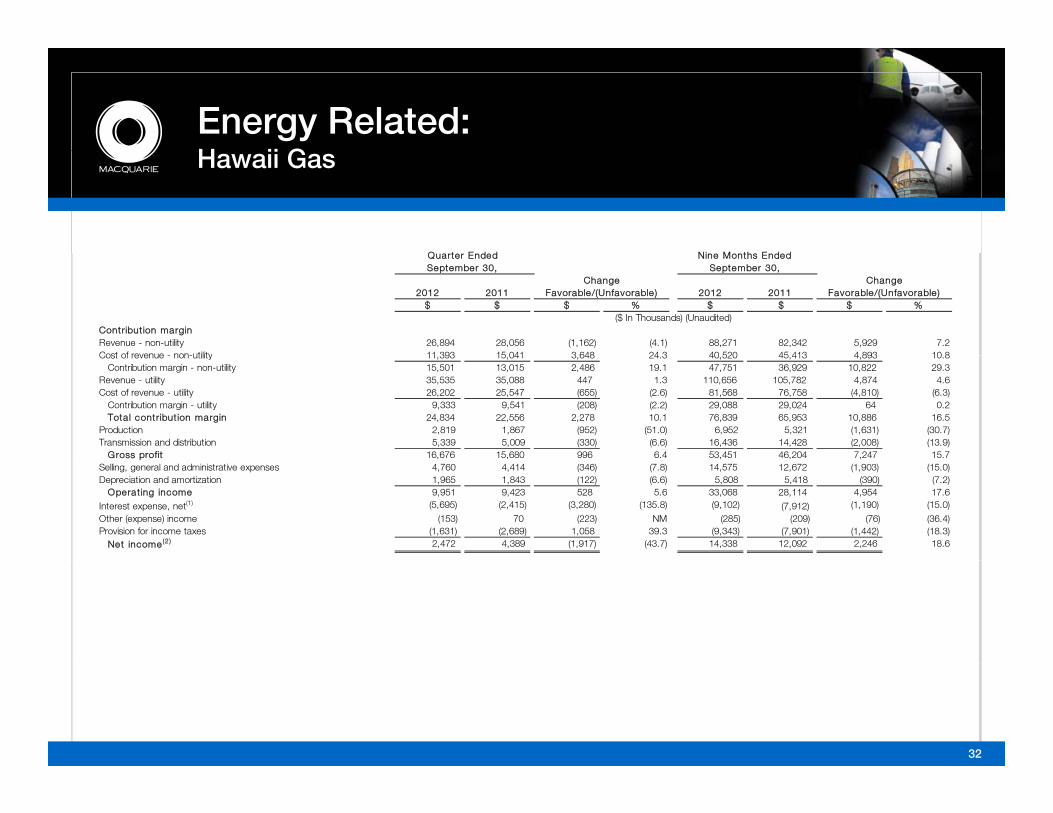
Energy Related: H ii GHawaii Gas
Q t E d d Ni M th E d d
2012 2011 2012 2011$ $ $ % $ $ $ %
Contribut ion marginRevenue - non-utility 26,894 28,056 (1,162) (4.1) 88,271 82,342 5,929 7.2 Cost of revenue - non-utility 11 393 15 041 3 648 24 3 40 520 45 413 4 893 10 8
Change Favorable/(Unfavorable)
Quarter Ended September 30,
Nine Months Ended September 30,
Change Favorable/(Unfavorable)
($ In Thousands) (Unaudited)
Cost of revenue - non-utility 11,393 15,041 3,648 24.3 40,520 45,413 4,893 10.8 Contribution margin - non-utility 15,501 13,015 2,486 19.1 47,751 36,929 10,822 29.3
Revenue - utility 35,535 35,088 447 1.3 110,656 105,782 4,874 4.6 Cost of revenue - utility 26,202 25,547 (655) (2.6) 81,568 76,758 (4,810) (6.3)
Contribution margin - utility 9,333 9,541 (208) (2.2) 29,088 29,024 64 0.2 Tota l contribut ion margin 24,834 22,556 2,278 10.1 76,839 65,953 10,886 16.5
Production 2,819 1,867 (952) (51.0) 6,952 5,321 (1,631) (30.7)Transmission and distribution 5,339 5,009 (330) (6.6) 16,436 14,428 (2,008) (13.9)
Gross profit 16,676 15,680 996 6.4 53,451 46,204 7,247 15.7 G oss p o t 6,6 6 5,680 996 6 53, 5 6, 0 , 5Selling, general and administrative expenses 4,760 4,414 (346) (7.8) 14,575 12,672 (1,903) (15.0)Depreciation and amortization 1,965 1,843 (122) (6.6) 5,808 5,418 (390) (7.2)
Operat ing income 9,951 9,423 528 5.6 33,068 28,114 4,954 17.6 Interest expense, net(1) (5,695) (2,415) (3,280) (135.8) (9,102) (7,912) (1,190) (15.0)Other (expense) income (153) 70 (223) NM (285) (209) (76) (36.4)Provision for income taxes (1,631) (2,689) 1,058 39.3 (9,343) (7,901) (1,442) (18.3)
Net income(2) 2,472 4,389 (1,917) (43.7) 14,338 12,092 2,246 18.6
32

Energy Related: H ii G (C t )Hawaii Gas (Cont.)
Quarter Ended Nine Months Ended
2012 2011 2012 2011$ $ $ % $ $ $ %
Change Favorable/(Unfavorable)
Quarter Ended September 30,
Nine Months Ended September 30,
Change Favorable/(Unfavorable)
($ In Thousands) (Unaudited)Reconciliation of net income to EBITDA excluding non-cash items:Net income(2) 2,472 4,389 14,338 12,092
Interest expense net(1) 5 695 2 415 9 102 7 912Interest expense, net( ) 5,695 2,415 9,102 7,912
Provision for income taxes 1,631 2,689 9,343 7,901 Depreciation and amortization 1,965 1,843 5,808 5,418 Other non-cash expenses 869 736 2,671 1,918 EBITDA excluding non-cash items 12,632 12,072 560 4.6 41,262 35,241 6,021 17.1
EBITDA excluding non-cash items 12,632 12,072 41,262 35,241 Interest expense, net(1) (5,695) (2,415) (9,102) (7,912)
I t t t b k f (1) (8 701) (8 701)Interest rate swap breakage fees(1) (8,701) - (8,701) - Adjustments to derivative instruments recorded in interest expense(1) 4,386 35 3,089 932 Amortization of debt financing costs(1) 507 119 746 358
Provision for income taxes, net of changes in deferred taxes (1,513) (562) (5,888) (4,107)Changes in working capital 4,822 (1,030) 1,117 (7,479)Cash provided by operating activities 6,438 8,219 22,523 17,033 Changes in working capital (4,822) 1,030 (1,117) 7,479 Maintenance capital expenditures (2,056) (2,368) (5,241) (6,288)
Free cash flow (440) 6 881 (7 321) (106 4) 16 165 18 224 (2 059) (11 3)Free cash flow (440) 6,881 (7,321) (106.4) 16,165 18,224 (2,059) (11.3)_____________________NM - Not meaningful(1) Interest expense, net, includes adjustments to derivative instruments, non-cash amortization of deferred financing fees and interest rate swap breakage fees.
(2) Corporate allocation expense, intercompany fees and the tax effect have been excluded from the above table as they are eliminated on consolidation at the MIC Inc. level.
33
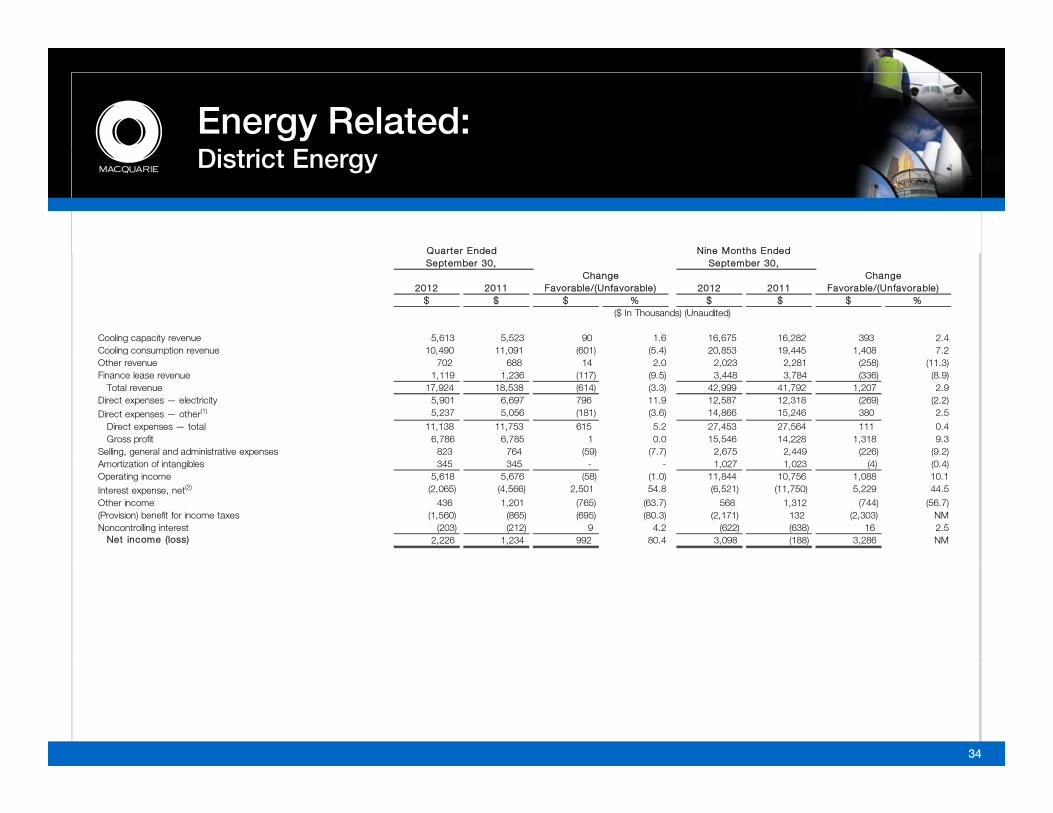
Energy Related: Di t i t EDistrict Energy
Quarter Ended Nine Months Ended
2012 2011 2012 2011$ $ $ % $ $ $ %
Cooling capacity revenue 5,613 5,523 90 1.6 16,675 16,282 393 2.4 Cooling consumption revenue 10,490 11,091 (601) (5.4) 20,853 19,445 1,408 7.2
Change Favorable/(Unfavorable)
Change Favorable/(Unfavorable)
Quarter Ended September 30,
Nine Months Ended September 30,
($ In Thousands) (Unaudited)
gOther revenue 702 688 14 2.0 2,023 2,281 (258) (11.3)Finance lease revenue 1,119 1,236 (117) (9.5) 3,448 3,784 (336) (8.9)
Total revenue 17,924 18,538 (614) (3.3) 42,999 41,792 1,207 2.9 Direct expenses — electricity 5,901 6,697 796 11.9 12,587 12,318 (269) (2.2)Direct expenses — other(1) 5,237 5,056 (181) (3.6) 14,866 15,246 380 2.5
Direct expenses — total 11,138 11,753 615 5.2 27,453 27,564 111 0.4 Gross profit 6,786 6,785 1 0.0 15,546 14,228 1,318 9.3
Selling, general and administrative expenses 823 764 (59) (7.7) 2,675 2,449 (226) (9.2)Amortization of intangibles 345 345 - - 1,027 1,023 (4) (0.4)Operating income 5,618 5,676 (58) (1.0) 11,844 10,756 1,088 10.1 Interest expense, net(2) (2,065) (4,566) 2,501 54.8 (6,521) (11,750) 5,229 44.5 Other income 436 1,201 (765) (63.7) 568 1,312 (744) (56.7)(Provision) benefit for income taxes (1,560) (865) (695) (80.3) (2,171) 132 (2,303) NM Noncontrolling interest (203) (212) 9 4.2 (622) (638) 16 2.5
Net income (loss) 2,226 1,234 992 80.4 3,098 (188) 3,286 NM
34

Energy Related: Di t i t E (C t )District Energy (Cont.)
Quarter Ended Nine Months Ended
2012 2011 2012 2011$ $ $ % $ $ $ %
Change Favorable/(Unfavorable)
Change Favorable/(Unfavorable)
Quarter Ended September 30,
Nine Months Ended September 30,
($ In Thousands) (Unaudited)
Reconciliation of net income (loss) to EBITDA excluding non-cash items:
Net income (loss) 2 226 1 234 3 098 (188)Net income (loss) 2,226 1,234 3,098 (188)Interest expense, net(2) 2,065 4,566 6,521 11,750 Provision (benefit) for income taxes 1,560 865 2,171 (132)Depreciation(1) 1,685 1,664 5,036 4,969 Amortization of intangibles 345 345 1,027 1,023 Other non-cash expenses 156 313 425 651 EBITDA excluding non-cash items 8,037 8,987 (950) (10.6) 18,278 18,073 205 1.1
EBITDA excluding non cash items 8 037 8 987 18 278 18 073EBITDA excluding non-cash items 8,037 8,987 18,278 18,073 Interest expense, net(2) (2,065) (4,566) (6,521) (11,750)
Adjustments to derivative instruments recorded in interest expense(2) (589) 1,865 (1,458) 3,808
Amortization of debt financing costs(2) 177 171 522 511 Equipment lease receivable, net 885 778 2,595 2,271 Provision/benefit for income taxes, net of changes in deferred taxes (619) (1,277) (892) (1,092)Changes in working capital 419 (789) (1,453) (608)Cash provided by operating activities 6,245 5,169 11,071 11,213 Changes in working capital (419) 789 1 453 608Changes in working capital (419) 789 1,453 608 Maintenance capital expenditures (478) (164) (642) (289)
Free cash flow 5,348 5,794 (446) (7.7) 11,882 11,532 350 3.0 _____________________NM - Not meaningful(1) Includes depreciation expense of $1.7 million and $5.0 million for the quarter and nine months ended September 30, 2012, respectively, and $1.7 million and $5.0 million for the
quarter and nine months ended September 30, 2011, respectively.(2) Interest expense, net, includes adjustments to derivative instruments and non-cash amortization of deferred financing fees.
35

Aviation Related: Atl ti A i tiAtlantic Aviation
Quarter Ended Nine Months Ended
2012 2011 2012 2011$ $ $ % $ $ $ %
RevenueFuel revenue 139,491 131,778 7,713 5.9 420,197 392,138 28,059 7.2 Non-fuel revenue 39,409 38,118 1,291 3.4 120,502 116,582 3,920 3.4
ChangeFavorable/(Unfavorable)
($ In Thousands) (Unaudited)
September 30, September 30,Change
Favorable/(Unfavorable)
Total revenue 178,900 169,896 9,004 5.3 540,699 508,720 31,979 6.3 Cost of revenueCost of revenue-fuel 96,925 89,217 (7,708) (8.6) 295,800 270,949 (24,851) (9.2)Cost of revenue-non-fuel 3,906 4,108 202 4.9 14,036 13,141 (895) (6.8)
Total cost of revenue 100,831 93,325 (7,506) (8.0) 309,836 284,090 (25,746) (9.1)Fuel gross profit 42,566 42,561 5 0.0 124,397 121,189 3,208 2.6 Non-fuel gross profit 35,503 34,010 1,493 4.4 106,466 103,441 3,025 2.9 Gross profit 78,069 76,571 1,498 2.0 230,863 224,630 6,233 2.8
S lli l d d i i t ti 43 983 43 430 (553) (1 3) 130 830 130 105 (725) (0 6)Selling, general and administrative expenses 43,983 43,430 (553) (1.3) 130,830 130,105 (725) (0.6)Depreciation and amortization 14,086 16,521 2,435 14.7 41,761 52,864 11,103 21.0 (Gain) loss on disposal of assets (1,706) 518 2,224 NM (1,379) 1,743 3,122 179.1 Operating income 21,706 16,102 5,604 34.8 59,651 39,918 19,733 49.4 Interest expense, net(1) (7,381) (7,655) 274 3.6 (23,448) (29,209) 5,761 19.7 Other (expense) income (10) (18) 8 44.4 38 (195) 233 119.5 Provision for income taxes (6,531) (3,396) (3,135) (92.3) (15,815) (4,236) (11,579) NM Net income(2) 7,784 5,033 2,751 54.7 20,426 6,278 14,148 NM
36

Aviation Related: Atl ti A i ti (C t )Atlantic Aviation (Cont.)
Quarter Ended Nine Months Ended
2012 2011 2012 2011$ $ $ % $ $ $ %
ChangeFavorable/(Unfavorable)
($ In Thousands) (Unaudited)
September 30, September 30,Change
Favorable/(Unfavorable)
Reconciliation of net income to EBITDA excluding non-cash items:Net income(2) 7,784 5,033 20,426 6,278
(1) 7 381 7 655 23 448 29 209Interest expense, net(1) 7,381 7,655 23,448 29,209 Provision for income taxes 6,531 3,396 15,815 4,236 Depreciation and amortization 14,086 16,521 41,761 52,864 (Gain) loss on disposal of assets (1,850) (204) (1,803) 949 Other non-cash (income) expenses (39) 207 (268) 310 EBITDA excluding non-cash items 33,893 32,608 1,285 3.9 99,379 93,846 5,533 5.9
EBITDA excluding non-cash items 33,893 32,608 99,379 93,846 (1) (7 381) (7 655) (23 448) (29 209)Interest expense, net(1) (7,381) (7,655) (23,448) (29,209)
Interest rate swap breakage fees(1) (95) (515) (595) (2,247)
Adjustments to derivative instruments recorded in interest expense(1) (5,567) (5,993) (16,015) (12,066)
Amortization of debt financing costs(1) 663 724 2,022 2,205 Provision for income taxes, net of changes in deferred taxes (997) (326) (1,972) (942)Changes in working capital 1,904 (4,620) 2,549 (7,482)Cash provided by operating activities 22,420 14,223 61,920 44,105 Changes in working capital (1,904) 4,620 (2,549) 7,482 Maintenance capital expenditures (2,837) (2,665) (7,949) (5,694)
Free cash flow 17,679 16,178 1,501 9.3 51,422 45,893 5,529 12.0 _____________________NM - Not meaningful(1) Interest expense, net, includes adjustments to derivative instruments, non-cash amortization of deferred financing fees and interest rate swap breakage fees.(2) Corporate allocation expense, intercompany fees and the tax effect have been excluded from the above table as they are eliminated on consolidation at the MIC Inc. level.
37