mgmt-165 chapter 03 slides - kids in prison program copyright © 2013 by the mcgraw-hill companies,...
TRANSCRIPT
McGraw-Hill/Irwin Copyright © 2013 by The McGraw-Hill Companies, Inc. All rights reserved.
Financial Statements Analysis and Financial
Models
Chapter 3

3-1
Key Concepts and Skills
Know how to standardize financial statements
for comparison purposes
Know how to compute and interpret important
financial ratios
Be able to develop a financial plan using the
percentage of sales approach
Understand how capital structure and dividend
policies affect a firm’s ability to grow
3-2
Chapter Outline
3.1 Financial Statements Analysis
3.2 Ratio Analysis
3.3 The DuPont Identity
3.4 Financial Models
3.5 External Financing and Growth
3.6 Some Caveats Regarding Financial Planning Models

3-3
3.1 Why Evaluate Financial
Statements? Internal uses
Performance evaluation – compensation and comparison between divisions
Management – identify problem areas (e.g., too little or too much cash, too little or too much inventory)
Planning for the future – guide in estimating future cash flows
External uses Creditors
Suppliers
Customers
Stockholders / Investors

3-4
3.1 Financial Statements Analysis
Common-Size Balance Sheets
Compute all accounts as a percent of total assets
Common-Size Income Statements
Compute all line items as a percent of sales
Standardized statements make it easier to compare
financial information, particularly as the company
grows.
They are also useful for comparing companies of
different sizes, particularly within the same industry.

3-5
3.2 Ratio Analysis
Ratios also allow for better comparison through time
or between companies.
As we look at each ratio, ask yourself:
How is the ratio computed?
What is the ratio trying to measure and why?
What is the unit of measurement?
What does the value indicate?
How can we improve the company’s ratio? (This is
hard! Typically no good answer… Ratios may
help highlight an issue, not much more)

3-6
Categories of Financial Ratios
Short-term solvency or liquidity ratios
Long-term solvency or financial leverage
ratios
Asset management or turnover ratios
Profitability ratios
Market value ratios

3-7
Balance Sheet, Greene Co.

3-8
Income Statement, Greene Co.
3-9
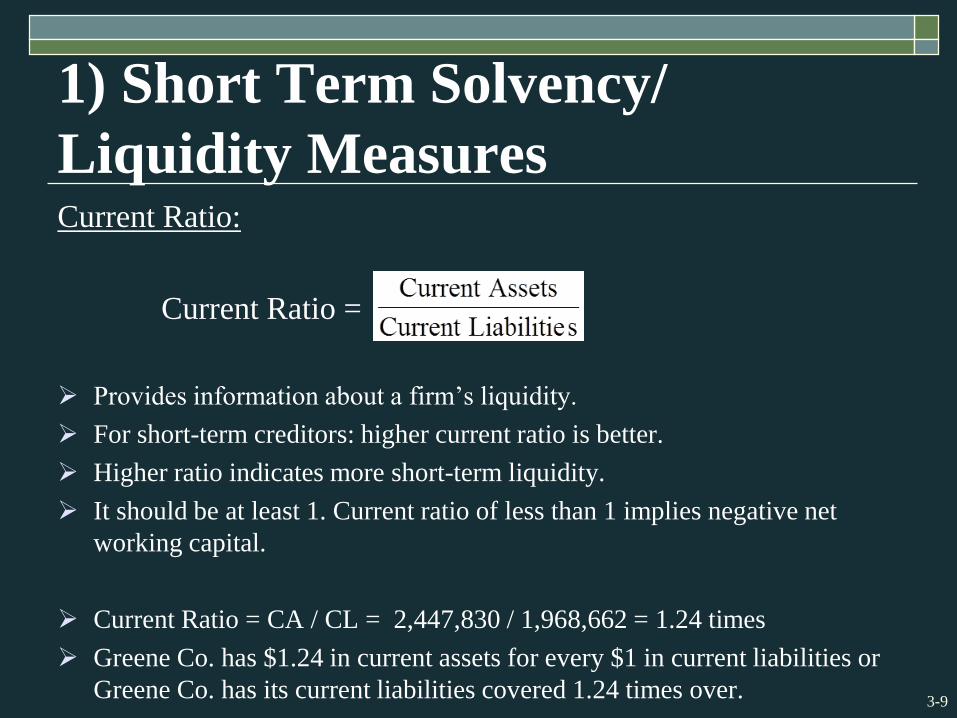
1) Short Term Solvency/
Liquidity MeasuresCurrent Ratio:
Current Ratio =
Provides information about a firm’s liquidity.
For short-term creditors: higher current ratio is better.
Higher ratio indicates more short-term liquidity.
It should be at least 1. Current ratio of less than 1 implies negative net
working capital.
Current Ratio = CA / CL = 2,447,830 / 1,968,662 = 1.24 times
Greene Co. has $1.24 in current assets for every $1 in current liabilities or
Greene Co. has its current liabilities covered 1.24 times over.

3-10
1) Short Term Solvency or
Liquidity MeasuresQuick or Acid - Test Ratio:
Quick Ratio =
Provides information about a firm’s liquidity.
Large inventories could be a sign of short-term trouble.
Quick Ratio = (2,447,830 – 300,459) / 1,968,662 = 1.09 times

3-11
1) Short Term Solvency/
Liquidity Measures
Cash Ratio:
Cash Ratio =
Cash Ratio = 680,623 / 1,968,662 = .346 times

3-12
Note on Liquidity
Concerns a firm’s ability to pay its bills over a
short period of time.
But is it ability to convert assets to cash
quickly?
No. You can convert anything to cash quickly
if you lower the price enough! (e.g. price of a
house).
Hence, it is ability to convert assets to cash
quickly without a significant loss in value.

3-13
Another Word of Caution about
Liquidity Is a higher current ratio a good thing?
Sufficiently high is good for short-term solvency.
However, too high is not good. Liquid assets earn lower returns in general… So too much in Current Assets/Liabilities compromises earning capacity of the firm, and reduces stock price.
Investors would prefer that the firm invested in profitable projects. If the firm is sitting on too much cash, investors will wonder if the executives are incapable or unwilling to come up with such projects, or why no dividends are paid or why no stock is bought back.
REMEMBER: objective of the firm is to maximize owner wealth!

3-14
Examples
Kirk Kerkorian’s takeover bid for Chrysler in April
1995 is a perfect example of investor dissatisfaction
with excess liquidity. At the time, Chrysler’s
management had accumulated $7.3 billion in cash
and marketable securities as a cushion against an
economic down-turn. Mr. Kerkorian instigated a
takeover bid because Chrysler’s management
refused to pay this cash to stockholders.
More recently, Apple sitting on $137 billion!

3-15
Consider the Scenario:
The current ratio exhibits no change over a two or three year
period, while the quick ratio experiences a steady decline.
How could this occur? Is it bad?
Implies:
-Co. is operating with lower levels of most liquid assets
-Situation should be monitored
-Problem could arise should a large amount of current
liabilities come due for payment at the same time
-But may not be major concern the company has sufficient
line of credit at a bank
-May indicate larger levels of inventory relative to current
liabilities. Slowing sales? Need to look at more ratios!

3-16
2)Long-Term Solvency or
Leverage Measures This group of ratios measures the level of indebtedness and the
ability to service debt.
Total Debt Ratio:
Total Debt Ratio =
Two Variations
Debt-Equity Ratio =
Equity Multiplier =
Assets Total
Equity Total - Assets Total
Equity Total
Debt Total
Equity Total
Debt) Total Equity Total(
Equity Total
Assets Total

3-17
2)Long-Term Solvency or
Leverage Measures Total Debt Ratio = (TA – TE) / TA
- (5,862,989 – 2,984,513) / 5,862,989 = .491 times or 49.1%
The firm finances slightly over 49% of their assets with
debt.
The firm has $0.49 in debt for every $1 in assets.
Debt-Equity Ratio = TD / TE =
= (1,968,662+909,814) / 2,984,513 = .964 times
Equity Multiplier = TA / TE = 1 + TD/TE =
= 1 + .964 = 1.964

3-18
2)Long-Term Solvency or
Leverage Measures Times Interest Earned (TIE) = EBIT / Interest =
= 1,174,690 / 5,785 = 203 times
- Informs us if the firm has its interest obligations covered.
- EBIT is not a good measure of cash available to pay
interest because it includes non-cash expenses
(depreciation and amortization). Hence,
Cash Coverage = EBITDA / Interest =
=(EBIT + Depreciation+Amortization) / Interest =
= (1,174,900 + 124,647) / 5,785 = 225 times
3-19
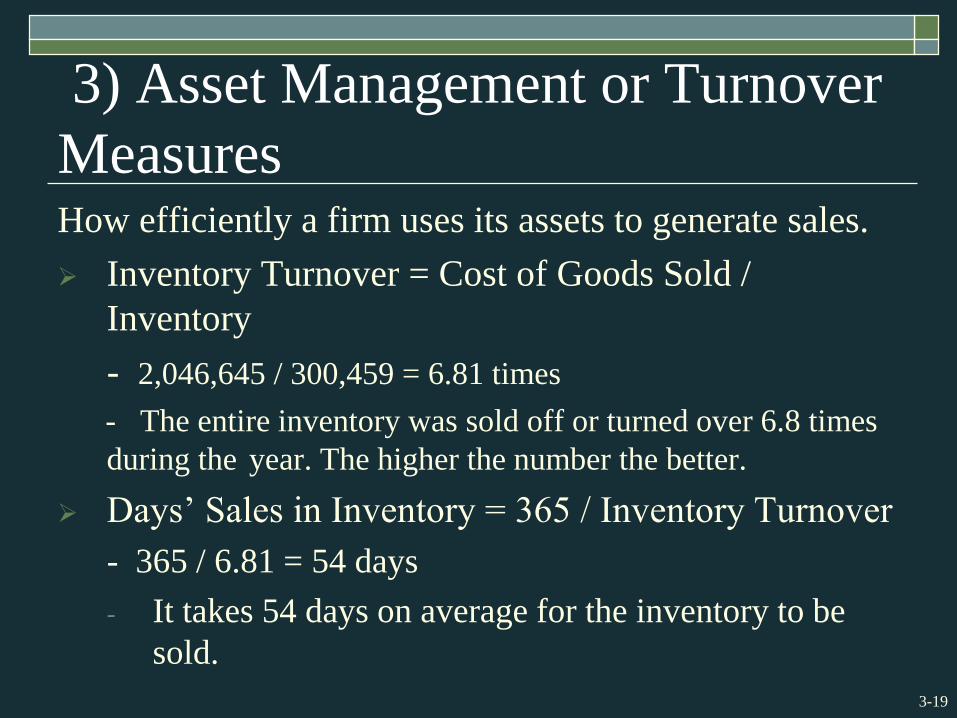
3) Asset Management or Turnover
MeasuresHow efficiently a firm uses its assets to generate sales.
Inventory Turnover = Cost of Goods Sold /
Inventory
- 2,046,645 / 300,459 = 6.81 times
- The entire inventory was sold off or turned over 6.8 times
during the year. The higher the number the better.
Days’ Sales in Inventory = 365 / Inventory Turnover
- 365 / 6.81 = 54 days
- It takes 54 days on average for the inventory to be
sold.

3-20
3) Asset Management or Turnover
MeasuresHow fast the firm collects on its sales?
Receivables Turnover = Sales / Accounts Receivable
- 5,250,538 / 1,051,438 = 4.99 times
- Collected the outstanding accounts and lent the money
again 4.99 times during the year.
- Easier to interpret in days.
Days’ Sales in Receivables = 365 days / Receivables
Turnover
- 365 / 4.99 = 73 days
- This ratio is also called average collection period.
- This firm collects its credit sales in 73 days on average.
3-21
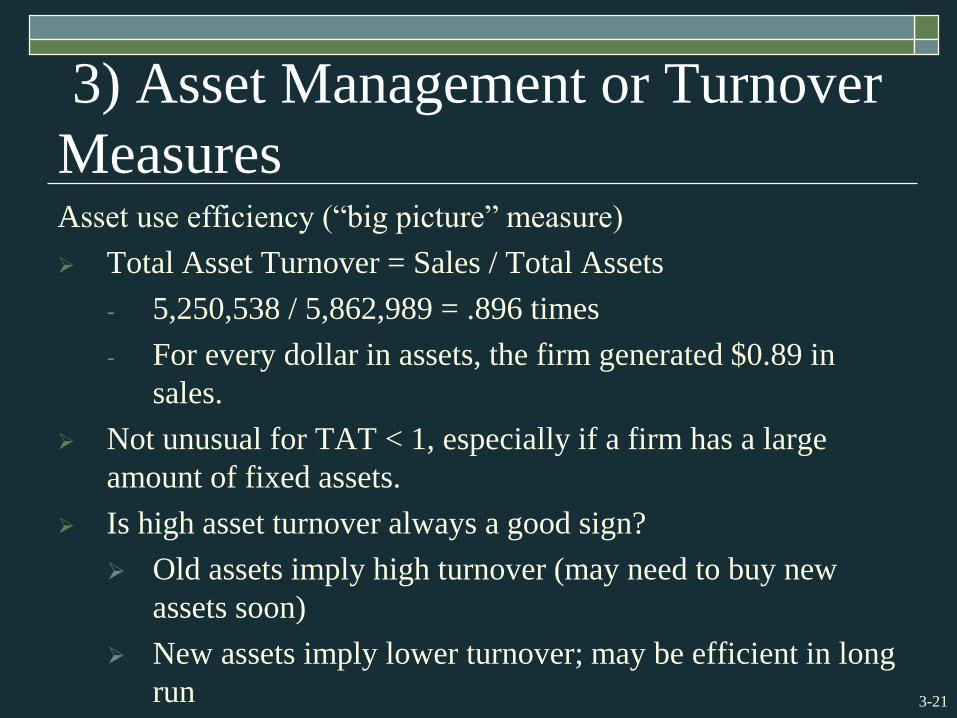
3) Asset Management or Turnover
MeasuresAsset use efficiency (“big picture” measure)
Total Asset Turnover = Sales / Total Assets
- 5,250,538 / 5,862,989 = .896 times
- For every dollar in assets, the firm generated $0.89 in
sales.
Not unusual for TAT < 1, especially if a firm has a large
amount of fixed assets.
Is high asset turnover always a good sign?
Old assets imply high turnover (may need to buy new
assets soon)
New assets imply lower turnover; may be efficient in long
run

3-22
4) Profitability Measures Profit Margin = Net Income / Sales
– 756,410 / 5,250,538 = .1441 times or 14.41%
– Greene co. generates about 14 cents in profit for each
dollar in sales.
Return on Assets (ROA) = Net Income / Total Assets
– 756,410 / 5,862,989 = .1290 times or 12.90%
– A measure of profit per dollar of assets
Return on Equity (ROE) = Net Income / Total Equity
– A measure of how the stockholders fared during the year.
– 756,410 / 2,984,513 = .2534 times or 25.34%
– For every dollar in equity, the firm generated 25 cents in
profit

3-23
5) Market Value Measures
Market Price (12/31/09) = $91.54 per share
Shares outstanding = 193,000
EPS = Net income/Shares Outstanding = 756,410/193,000 =
$3.92
Price-Earnings (PE) Ratio = Price per share / Earnings per
share
- 91.54 / 3.92 = 23.35 times
- High PE indicates that firm has prospects for future
growth.
Price-Sales Ratio = Price per share/sales per share
- This ratio is used if a firm has negative earnings for
extended period of time.

3-24
5) Market Value Measures
Market-to-book ratio = market value per share /
book value per share
Book Value per share = Common equity/Shares
outstanding
Book Value per share = (2,984,513 / 193,000) =
$15.46
Market-to-Book ratio = 91.54 / 15.46 = 5.92 times
- A value less than one indicates that the firm has not
been very successful in creating value.
Market Capitalization=PxShares
outstanding=91.54x193,000=17,667,220

3-25
3.3Tying Ratios Together: The Du
Pont Identity Shows relationship between ROE and ROA
Gives us a way to decompose ROE
ROE = Net Income (NI) / Total Equity (TE)
Multiply by Total Assets (TA)/Total Assets (TA) and then
rearrange
ROE = (NI / TE) x (TA / TA)
ROE = (NI / TA) x (TA / TE) = ROA * Equity Multiplier
Multiply by sales/sales and then rearrange
ROE = (NI / TA) (TA / TE) (Sales / Sales)
ROE = (NI / Sales) (Sales / TA) (TA / TE)
ROE = Profit Margin * Total Asset Turnover * Equity
Multiplier
3-26
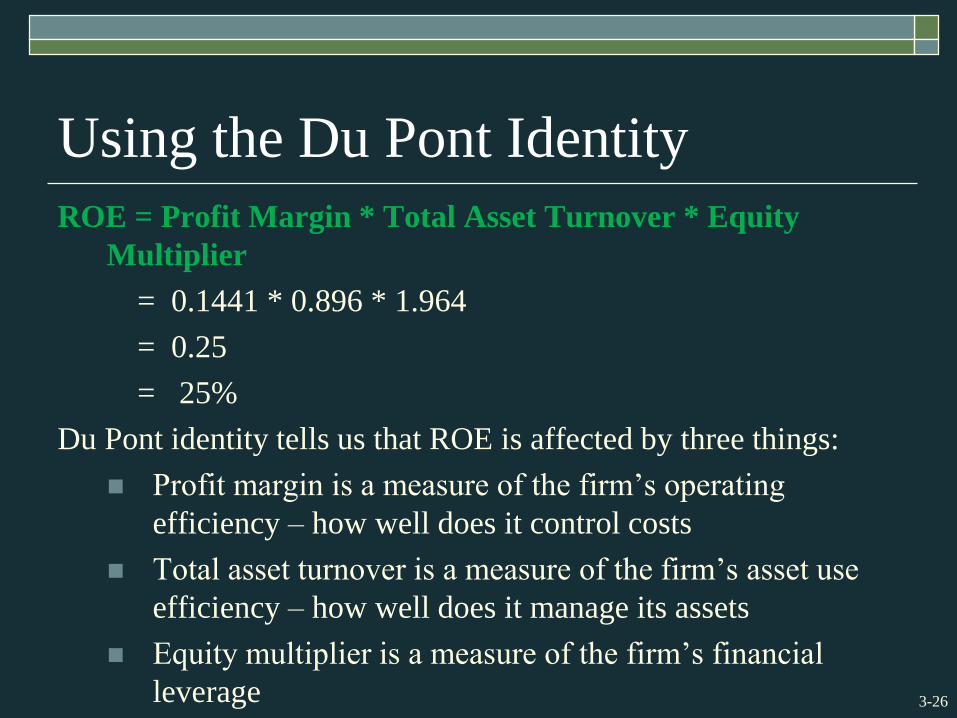
Using the Du Pont Identity
ROE = Profit Margin * Total Asset Turnover * Equity
Multiplier
= 0.1441 * 0.896 * 1.964
= 0.25
= 25%
Du Pont identity tells us that ROE is affected by three things:
Profit margin is a measure of the firm’s operating
efficiency – how well does it control costs
Total asset turnover is a measure of the firm’s asset use
efficiency – how well does it manage its assets
Equity multiplier is a measure of the firm’s financial
leverage

3-27
Using Financial Statements
Ratios are not very helpful by themselves: they
need to be compared to something
Time-Trend Analysis
Used to see how the firm’s performance is
changing through time
Peer Group Analysis
Compare to similar companies or within industries
SIC and NAICS codes

3-28
Limitations of Ratio Analysis Ratio analysis is more useful for small, narrowly focused
firms as compared to large multidivisional firms (e.g. GE).
Different accounting practices can distort comparisons. For
instance, outside the US, financial statements may not
conform to GAAP.
A firm may have some ratios that make it look “good” and
others “bad”. So it might be difficult to tell if a company is
doing well or not.
Different firms might use different accounting procedures.
Different firms might end their fiscal years at different times.
One time (extraordinary) events.

3-29
3.4 Financial Models
Investment in new assets – determined by
capital budgeting decisions
Degree of financial leverage – determined by
capital structure decisions
Cash paid to shareholders – determined by
dividend policy decisions
Liquidity requirements – determined by net
working capital decisions

3-30
Financial Planning Ingredients Sales Forecast – many cash flows depend directly on the level
of sales
Pro Forma Statements – setting up the plan as projected (pro forma) financial statements allows for consistency and ease of interpretation
Asset Requirements – the additional assets that will be required to meet sales projections
Financial Requirements
Plug Variable – determined by management decisions about what type of financing will be used (makes the balance sheet balance)
Economic Assumptions – explicit assumptions about the coming economic environment

3-31
Percent of Sales Approach Some items vary directly with sales, others do not.
Separate balance sheet and income statement accounts into two groups depending on whether they do vary with sales.
Can then calculate financing needed to support predicted sales.
Percentage of sales approach is a quick way to generate pro forma statements.
Income Statement
Costs may vary directly with sales
Depreciation and interest expense may not vary directly with sales
Dividends are a management decision and generally do not vary directly with sales (but dividend payout ratio = Cash dividends / Net income may reflect company policy, so reasonable to assume that is fixed)

3-32
Percent of Sales Approach
Balance Sheet
Initially assume all assets, including fixed, vary directly with sales.
Accounts payable also normally vary directly with sales.
Notes payable, long-term debt, and equity generally do not vary with sales because they depend on management decisions about capital structure. The changes in these sources of funds are what we are trying to determine.
The change in the retained earnings portion of equity will come from the dividend decision.
External Financing Needed (EFN)
The difference between the forecasted increase in assets and the forecasted increase in liabilities and equity.

3-33
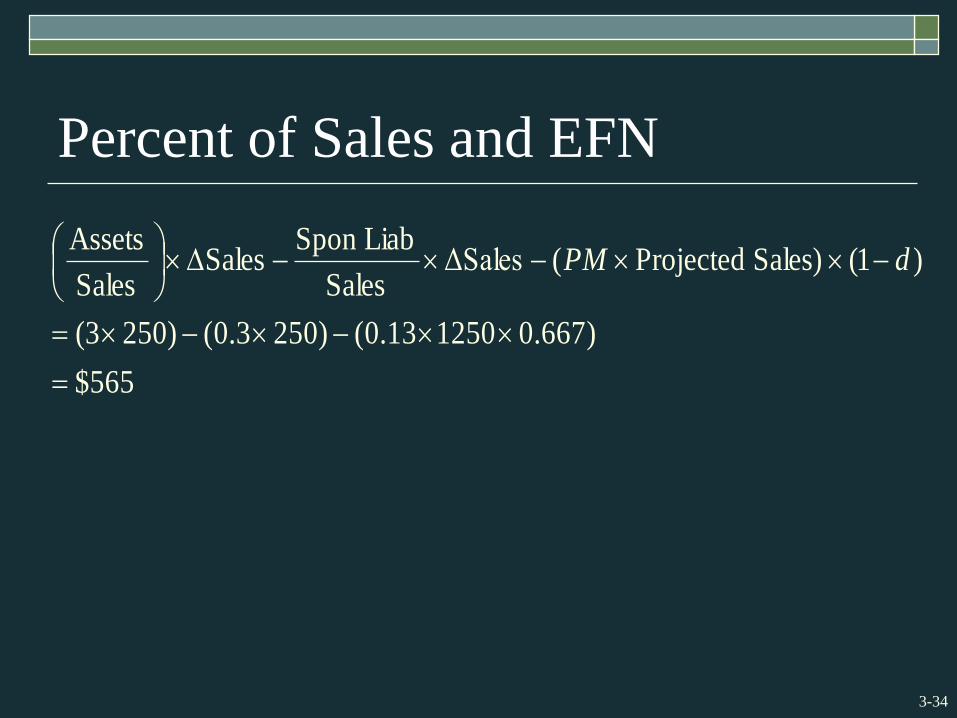
Percent of Sales and EFN Instead of creating pro forma statements, External Financing
Needed (EFN) can also be calculated by the formula on the next page.
Use Rosengarten e.g. from book
Sales: this year $1000, next year $1250
Costs: this year $800 (80% of sales), next year $1000 (80% of sales)
Accounts Payable: only liability that changes with Sales: this year $300 (30%) , next year 375 (30%)
Assets: this year $3000 (300%), needed next year $3750 (300%); therefore, new funding needed = $750
Profit Margin (PM)=13.2%; dividend payout ratio=33.3%
3-34
Percent of Sales and EFN
565$
)667.0125013.0()2503.0()2503(
)1(Sales) Projected(ΔSalesSales
LiabSpon Sales
Sales
Assets
dPM

3-35
3.5 External Financing and Growth
At low growth levels, internal financing (retained
earnings) may exceed the required investment in
assets.
As the growth rate increases, the internal financing
will not be enough, and the firm will have to go to the
capital markets for financing, that is, the higher the
rate of growth in sales or assets, the greater the need
for external financing.
Examining the relationship between growth and
external financing required is a useful tool in
financial planning.
3-36
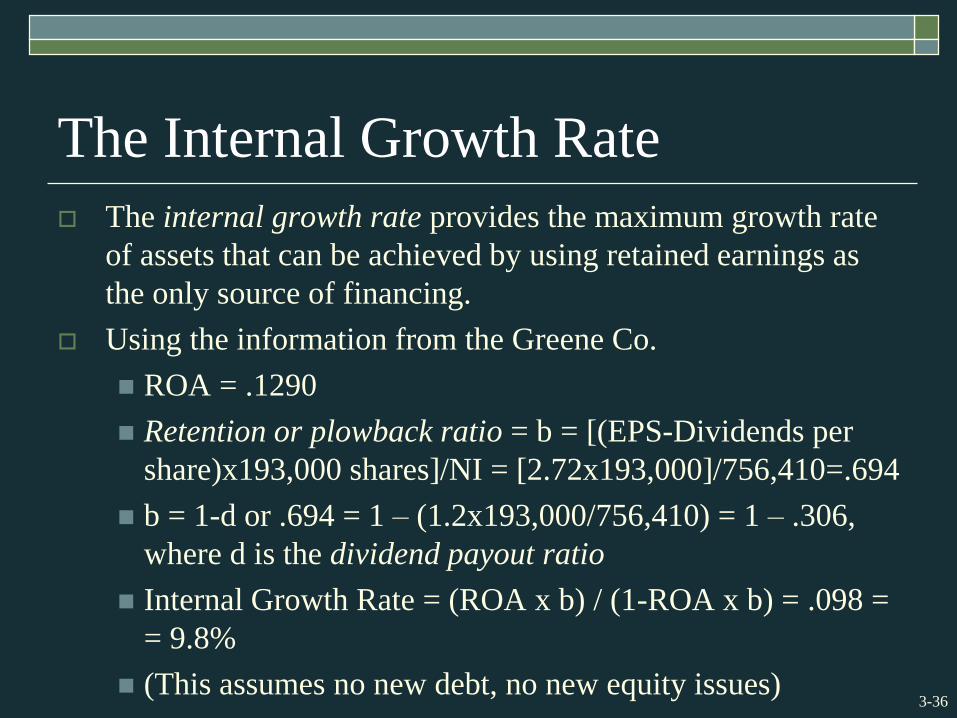
The Internal Growth Rate
The internal growth rate provides the maximum growth rate
of assets that can be achieved by using retained earnings as
the only source of financing.
Using the information from the Greene Co.
ROA = .1290
Retention or plowback ratio = b = [(EPS-Dividends per
share)x193,000 shares]/NI = [2.72x193,000]/756,410=.694
b = 1-d or .694 = 1 – (1.2x193,000/756,410) = 1 – .306,
where d is the dividend payout ratio
Internal Growth Rate = (ROA x b) / (1-ROA x b) = .098 =
= 9.8%
(This assumes no new debt, no new equity issues)

3-37
The Sustainable Growth Rate
The sustainable growth rate provides the maximum growth
that can be achieved without additional external equity
financing while maintaining a constant debt-to-equity ratio,
that is, the maximum growth rate without increasing financial
leverage.
Using the information from the Greene Co.
ROE = .2534
b = .694
Sustainable Growth Rate = (ROE x b) / (1-ROE x b) = .213
= 21.3%

3-38
Determinants of Growth
Profit margin – operating efficiency
Total asset turnover – asset use efficiency
Financial leverage – choice of optimal debt
ratio
Dividend policy – choice of how much to pay
to shareholders versus reinvesting in the firm

3-39
3.6 Some Caveats
Financial planning models do not indicate
which financial polices are the best.
Models are simplifications of reality, and the
world can change in unexpected ways.
Without some sort of plan, the firm may find
itself adrift in a sea of change without a rudder
for guidance.
3-40
Quick Quiz
How do you standardize balance sheets and income statements?
Why is standardization useful?
What are the major categories of financial ratios?
How do you compute the ratios within each category?
What are some of the problems associated with financial statement analysis?

3-41
Quick Quiz
What is the purpose of financial planning?
What are the major decision areas involved in developing a plan?
What is the percentage of sales approach?
What is the internal growth rate?
What is the sustainable growth rate?
What are the major determinants of growth?