mÉxico - gob.mx · the resolution of the maps is presented latitude 5 degrees, ... conagua,...
TRANSCRIPT
GOBIERNO DE LA REPÚBLICA
INTENDED NATIONALLYDETERMINED CONTRIBUTION
MÉXICO
Mexico
1
“… Mexico recognizes its global responsibility with a solid commitment to mitigate greenhouse gases in order to nourish the
new agreement to be adopted in COP 21 Paris, 2015 under the UNFCCC.”
Enrique Peña Nieto,
Constitutional President of MexicoClimate Summit, September 23th, 2014
2
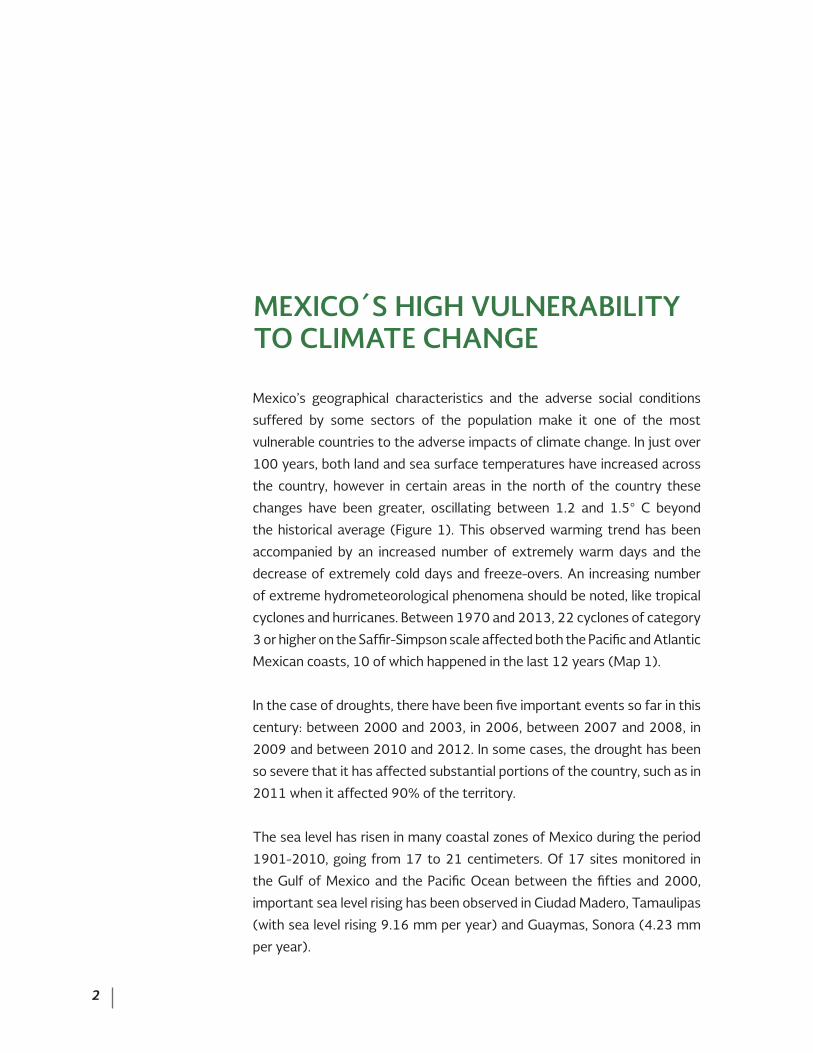
MEXICO´S HIGH VULNERABILITY TO CLIMATE CHANGE
Mexico’s geographical characteristics and the adverse social conditions
suffered by some sectors of the population make it one of the most
vulnerable countries to the adverse impacts of climate change. In just over
100 years, both land and sea surface temperatures have increased across
the country, however in certain areas in the north of the country these
changes have been greater, oscillating between 1.2 and 1.5° C beyond
the historical average (Figure 1). This observed warming trend has been
accompanied by an increased number of extremely warm days and the
decrease of extremely cold days and freeze-overs. An increasing number
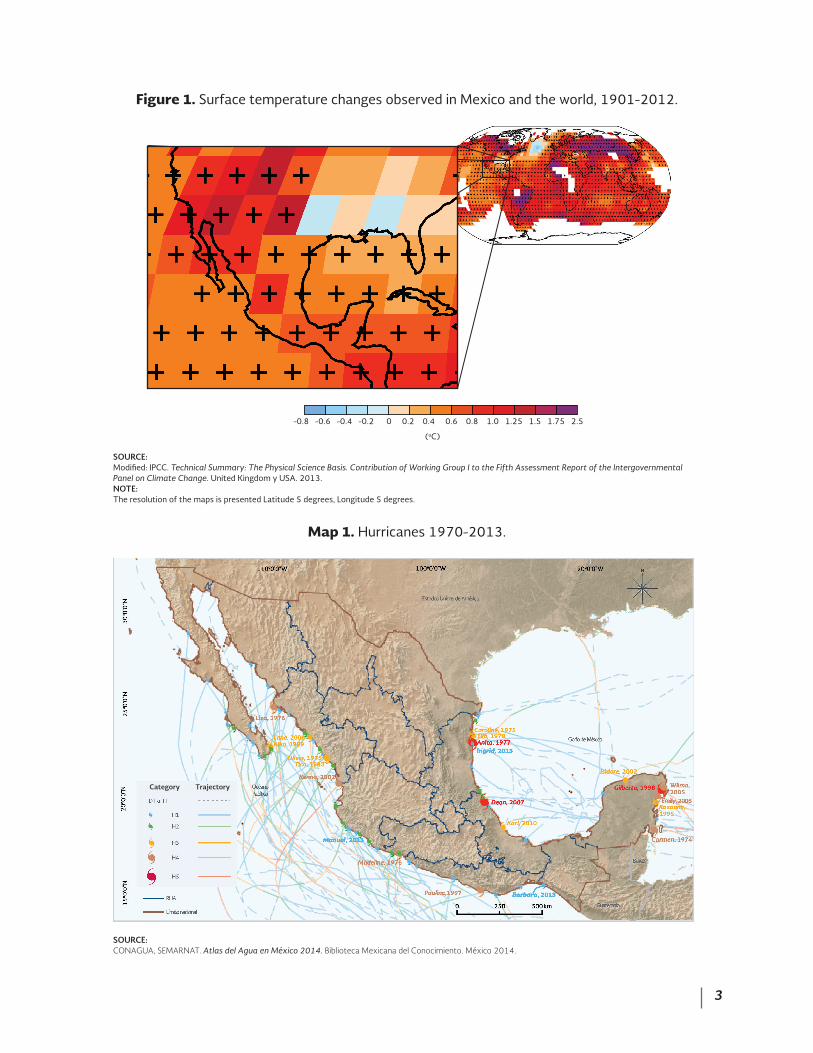
of extreme hydrometeorological phenomena should be noted, like tropical
cyclones and hurricanes. Between 1970 and 2013, 22 cyclones of category
3 or higher on the Saffir-Simpson scale affected both the Pacific and Atlantic
Mexican coasts, 10 of which happened in the last 12 years (Map 1).
In the case of droughts, there have been five important events so far in this
century: between 2000 and 2003, in 2006, between 2007 and 2008, in
2009 and between 2010 and 2012. In some cases, the drought has been
so severe that it has affected substantial portions of the country, such as in
2011 when it affected 90% of the territory.
The sea level has risen in many coastal zones of Mexico during the period
1901-2010, going from 17 to 21 centimeters. Of 17 sites monitored in
the Gulf of Mexico and the Pacific Ocean between the fifties and 2000,
important sea level rising has been observed in Ciudad Madero, Tamaulipas
(with sea level rising 9.16 mm per year) and Guaymas, Sonora (4.23 mm
per year).
3
Figure 1. Surface temperature changes observed in Mexico and the world, 1901-2012.
(oC)
SOURCE:Modified: IPCC. Technical Summary: The Physical Science Basis. Contribution of Working Group I to the Fifth Assessment Report of the Intergovernmental Panel on Climate Change. United Kingdom y USA. 2013.NOTE:The resolution of the maps is presented Latitude 5 degrees, Longitude 5 degrees.
SOURCE: CONAGUA, SEMARNAT. Atlas del Agua en México 2014. Biblioteca Mexicana del Conocimiento. México 2014.
Map 1. Hurricanes 1970-2013.
-0.8 -0.6 -0.4 -0.2 0 0.2 0.4 0.6 0.8 1.0 1.25 1.5 1.75 2.5
Category Trajectory

4
Map 2. Climate change vulnerability degree of municipalities in Mexico.
SOURCE: INECC. Vulnerabilidad al cambio climático en los municipios de México. Instituto Nacional de Ecología y Cambio Climático. Dirección General de Investigación de Ordenamiento Ecológico y Conservación de Ecosistemas. México. 2013.
According to the Special Climate Change Program (PECC 2014-2018) 319 municipalities in Mexico (13% of the total) present greater vulnerability to
the impacts of climate change, in particular droughts, floods and landslides.
In Mexico there have been loss of human life and high economic and social costs associated with climate change impacts. Only between 2001 and 2013, around 2.5 million people were affected by hydrometeorological phenomena. The economic costs of these impacts were about 338.35 billion pesos.
The negative consequences of these events
tend to increase because of negative social
conditions, as poverty is widespread, and due
to the environmental degradation that affects
their communities. This generates high levels
of vulnerability in many regions (Map 2).
The climate change scenarios for the period 2015-2039 are worrisome. The estimated annual temperature will be 2°C higher in the North, while in the rest of the territory it has been estimated
that it will increase between 1 and 1.5°C. Rainfall in general, will decrease between 10 and 20%. All of this will bring important economic, social and environmental consequences.
Very highHighMediumLowVery LowSubnational borderNational borderInternational border
Legend
Beliz
eGuatemalaScale 1:8 000 000
United States of America
5
EMISSIONS OF GREENHOUSE GASES AND BLACK CARBON IN MEXICO
9 000
8 000
7 000
6 000
5 000
4 000
3 000
2 000
1 000
0
Chi
na
Uni
ted
Stat
es
Indi
a
Russ
ian
Fede
rati
on
Japa
n
Ger
man
y
Kor
ea
Can
ada
Iran
Saud
i Ara
bia
Uni
ted
Kin
gdom
Braz
il
Mex
ico
Indo
nesi
a
Aus
tral
ia
Sout
h A
fric
a
Ital
y
Fran
ce
Tur
key
Pola
nd
8 2
06
5 0
74
1 9
54
1 6
59
1 2
23
75
5
59
3
53
4
53
2
45
9
45
7
44
0
43
5
38
6
37
6
37
5
33
4
30
2
29
4
13st place436 Mt CO2
1.37%
SOURCE:International Energy Agency. CO2 Emissions from Fuel Combustion. 2014.
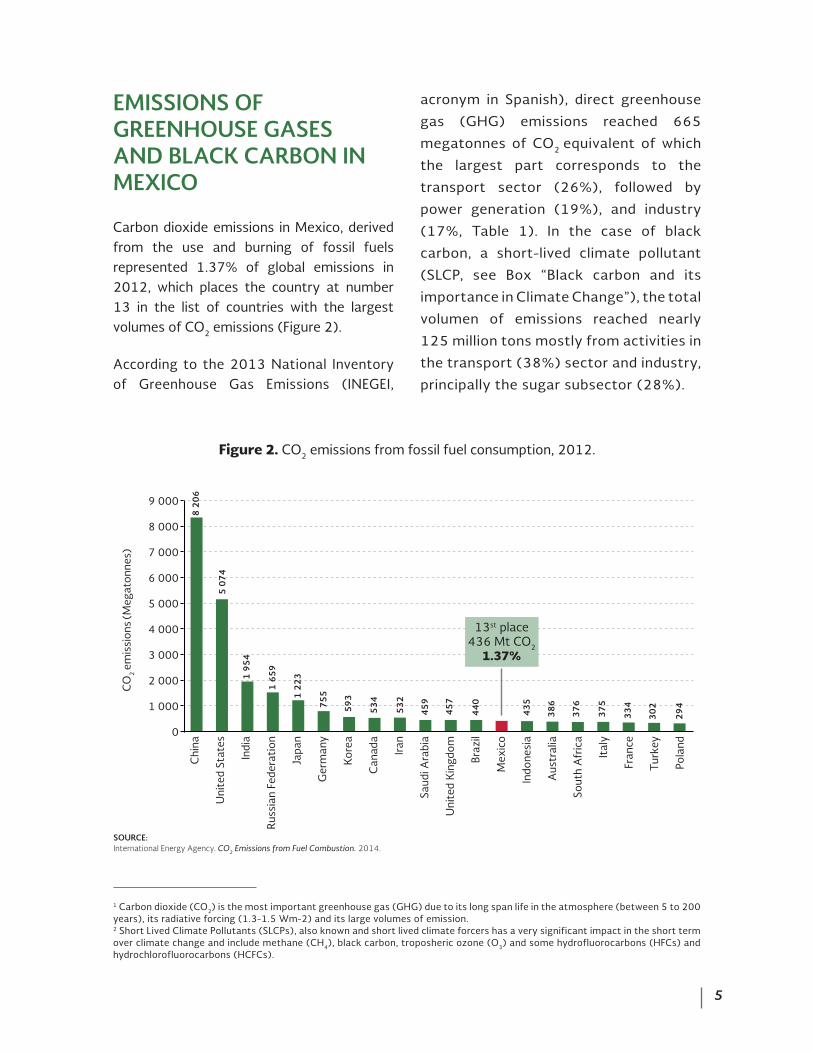
Figure 2. CO2 emissions from fossil fuel consumption, 2012.
CO
2 e
mis
sion
s (Meg
aton
nes)
1 Carbon dioxide (CO2) is the most important greenhouse gas (GHG) due to its long span life in the atmosphere (between 5 to 200 years), its radiative forcing (1.3-1.5 Wm-2) and its large volumes of emission.2 Short Lived Climate Pollutants (SLCPs), also known and short lived climate forcers has a very significant impact in the short term over climate change and include methane (CH4), black carbon, troposheric ozone (O3) and some hydrofluorocarbons (HFCs) and hydrochlorofluorocarbons (HCFCs).
Carbon dioxide emissions in Mexico, derived from the use and burning of fossil fuels represented 1.37% of global emissions in 2012, which places the country at number 13 in the list of countries with the largest volumes of CO2 emissions (Figure 2).
According to the 2013 National Inventory of Greenhouse Gas Emissions (INEGEI,
acronym in Spanish), direct greenhouse
gas (GHG) emissions reached 665
megatonnes of CO2 equivalent of which
the largest part corresponds to the
transport sector (26%), followed by
power generation (19%), and industry
(17%, Table 1). In the case of black
carbon, a short-lived climate pollutant
(SLCP, see Box “Black carbon and its
importance in Climate Change”), the total
volumen of emissions reached nearly
125 million tons mostly from activities in
the transport (38%) sector and industry,
principally the sugar subsector (28%).
6
Sector GHG emissions (MtCO2e)
Black carbon emissions
(thousand tons)
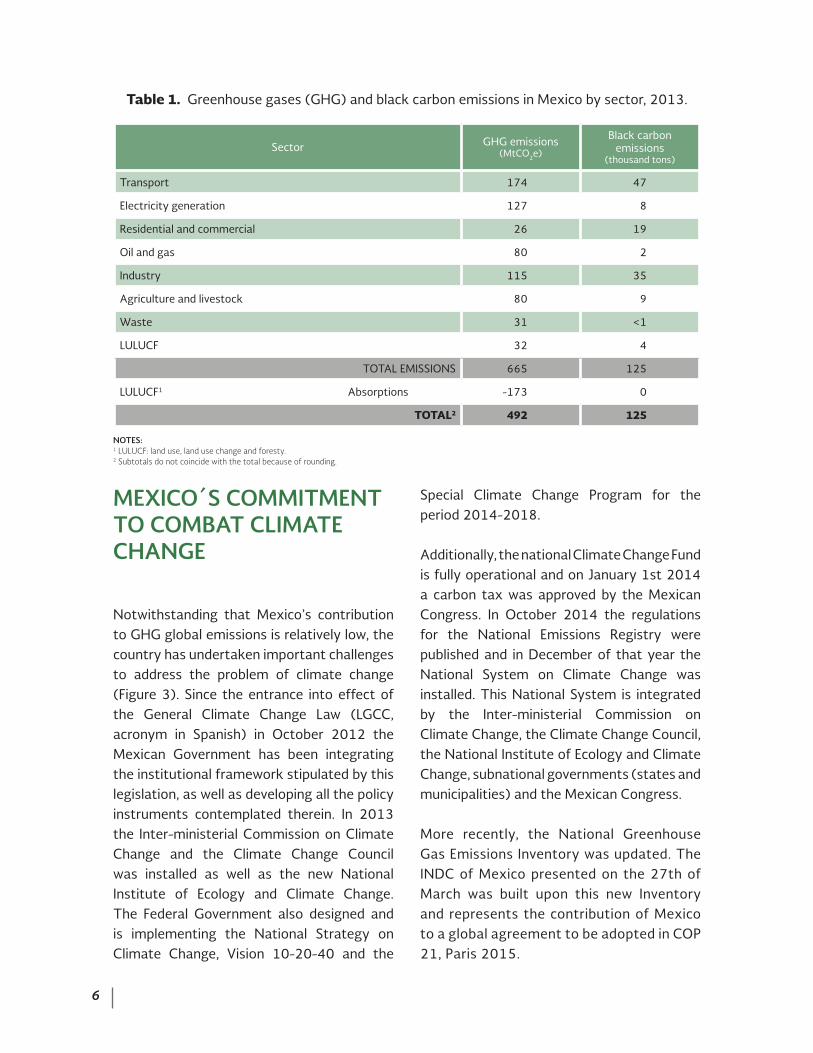
Transport 174 47
Electricity generation 127 8
Residential and commercial 26 19
Oil and gas 80 2
Industry 115 35
Agriculture and livestock 80 9
Waste 31 <1
LULUCF 32 4
TOTAL EMISSIONS 665 125
LULUCF1 Absorptions -173 0
TOTAL2 492 125
MEXICO´S COMMITMENT TO COMBAT CLIMATE CHANGE
Table 1. Greenhouse gases (GHG) and black carbon emissions in Mexico by sector, 2013.
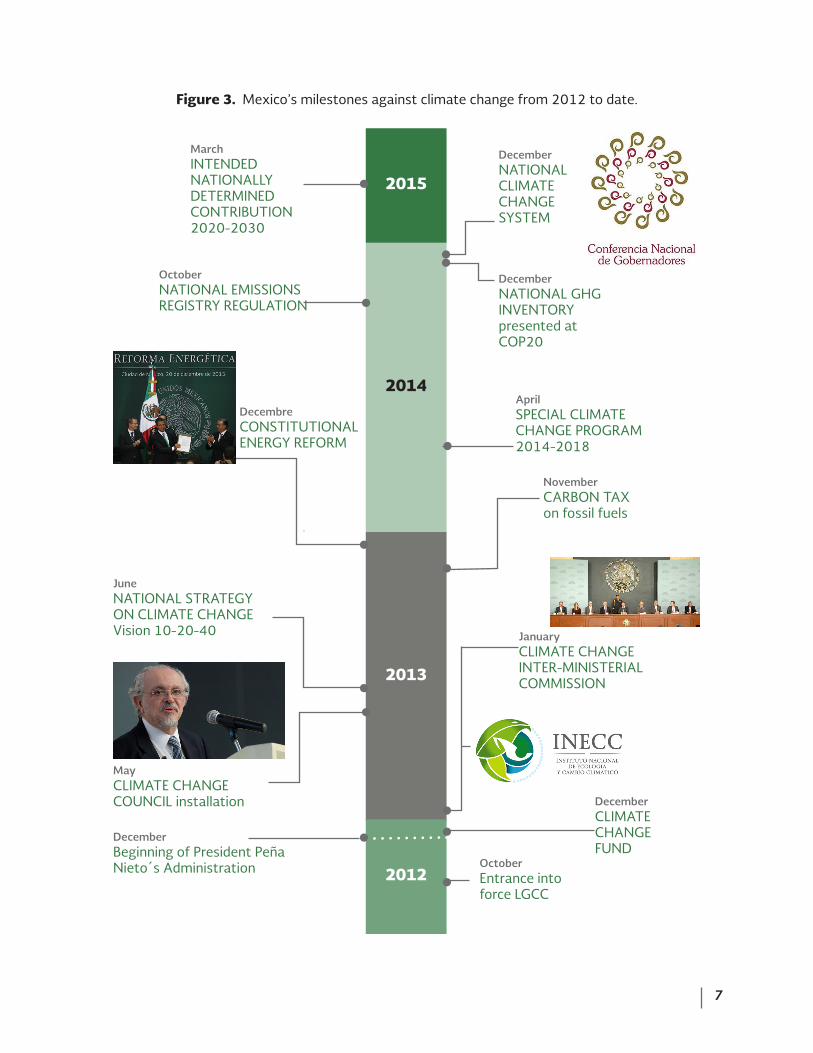
Notwithstanding that Mexico’s contribution to GHG global emissions is relatively low, the country has undertaken important challenges to address the problem of climate change (Figure 3). Since the entrance into effect of the General Climate Change Law (LGCC, acronym in Spanish) in October 2012 the Mexican Government has been integrating the institutional framework stipulated by this legislation, as well as developing all the policy instruments contemplated therein. In 2013 the Inter-ministerial Commission on Climate Change and the Climate Change Council was installed as well as the new National Institute of Ecology and Climate Change. The Federal Government also designed and is implementing the National Strategy on Climate Change, Vision 10-20-40 and the
Special Climate Change Program for the period 2014-2018.
Additionally, the national Climate Change Fund is fully operational and on January 1st 2014 a carbon tax was approved by the Mexican Congress. In October 2014 the regulations for the National Emissions Registry were published and in December of that year the National System on Climate Change was installed. This National System is integrated by the Inter-ministerial Commission on Climate Change, the Climate Change Council, the National Institute of Ecology and Climate Change, subnational governments (states and municipalities) and the Mexican Congress.
More recently, the National Greenhouse Gas Emissions Inventory was updated. The INDC of Mexico presented on the 27th of March was built upon this new Inventory and represents the contribution of Mexico to a global agreement to be adopted in COP 21, Paris 2015.
NOTES:1 LULUCF: land use, land use change and foresty.2 Subtotals do not coincide with the total because of rounding.
7
Figure 3. Mexico’s milestones against climate change from 2012 to date.
2015
2014
2013
2012
DecemberBeginning of President Peña Nieto´s Administration October
Entrance into force LGCC
December CLIMATE CHANGE FUND
JanuaryCLIMATE CHANGE INTER-MINISTERIAL COMMISSION
May CLIMATE CHANGE COUNCIL installation
JuneNATIONAL STRATEGY ON CLIMATE CHANGE Vision 10-20-40
November CARBON TAX on fossil fuels
Decembre CONSTITUTIONAL ENERGY REFORM
AprilSPECIAL CLIMATE CHANGE PROGRAM 2014-2018
OctoberNATIONAL EMISSIONS REGISTRY REGULATION
MarchINTENDED NATIONALLY DETERMINED CONTRIBUTION 2020-2030
DecemberNATIONAL GHG INVENTORY presented at COP20
DecemberNATIONAL CLIMATE CHANGE SYSTEM
8
Emissions (thousand of metric tonnes)
2030 Goal
Baseline Unconditional
2013 2020 2025 2030 2030
Transport 47 47 52 58 10
Electricity generation 8 4 4 3 2
Residential and commercial 19 16 15 15 6
Oil and gas 2 3 3 3 <3
Industry 35 43 49 56 41
Agriculture and livestock 9 11 12 13 10
Waste <1 <1 <1 <1 <1
LULUCF14 4 4 4 4
TOTAL EMISSIONS2 125 127 138 152 75
INTENDED NATIONALLY DETERMINED CONTRIBUTION (INDC) OF MEXICO
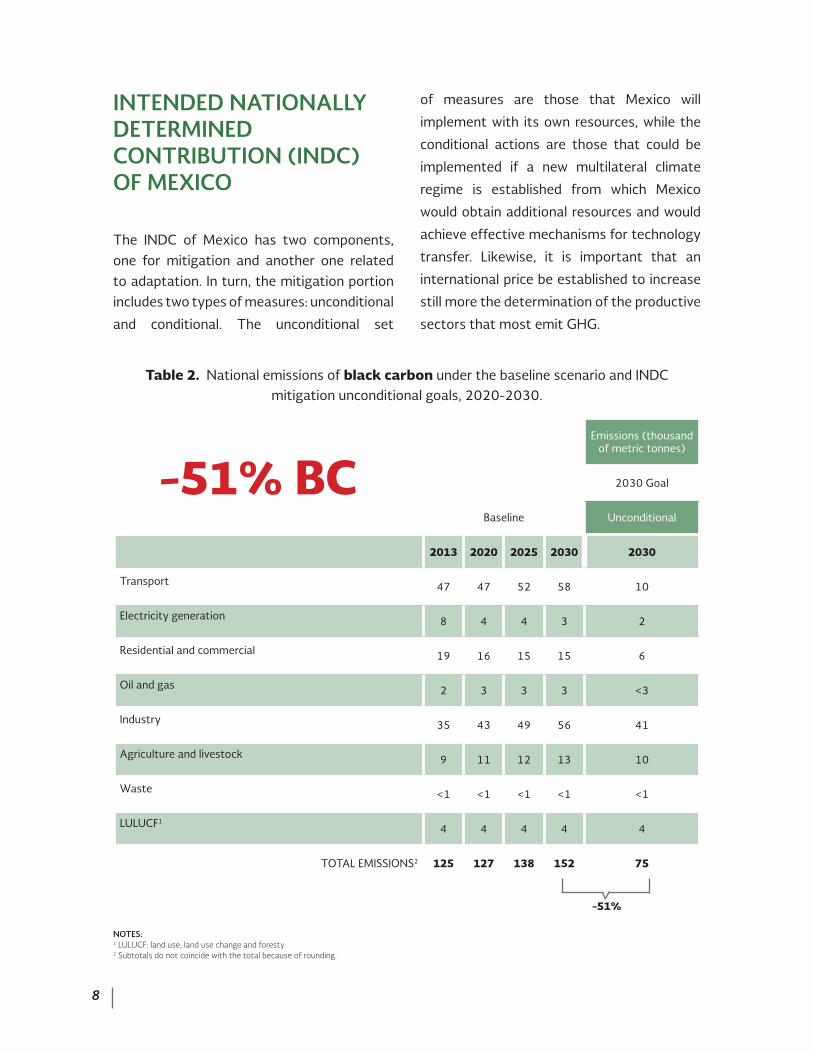
Table 2. National emissions of black carbon under the baseline scenario and INDC mitigation unconditional goals, 2020-2030.
-51% BC
-51%
The INDC of Mexico has two components, one for mitigation and another one related to adaptation. In turn, the mitigation portion includes two types of measures: unconditional
and conditional. The unconditional set
of measures are those that Mexico will
implement with its own resources, while the
conditional actions are those that could be
implemented if a new multilateral climate
regime is established from which Mexico
would obtain additional resources and would
achieve effective mechanisms for technology
transfer. Likewise, it is important that an
international price be established to increase
still more the determination of the productive
sectors that most emit GHG.
NOTES:1 LULUCF: land use, land use change and foresty.2 Subtotals do not coincide with the total because of rounding.
9
GHG emissions (MtCO2e)
2030 Goal
Baseline Unconditional
2013 2020 2025 2030 2030
Transport 174 214 237 266 218
Electricity generation 127 143 181 202 139
Residential and commercial 26 27 27 28 23
Oil and gas 80 123 132 137 118
Industry 115 125 144 165 157
Agriculture and livestock 80 88 90 93 86
Waste 31 40 45 49 35
SUBTOTAL 633 760 856 941 776
LULUCF1 32 32 32 32 -14
TOTAL EMISSIONS2 665 792 888 973 762
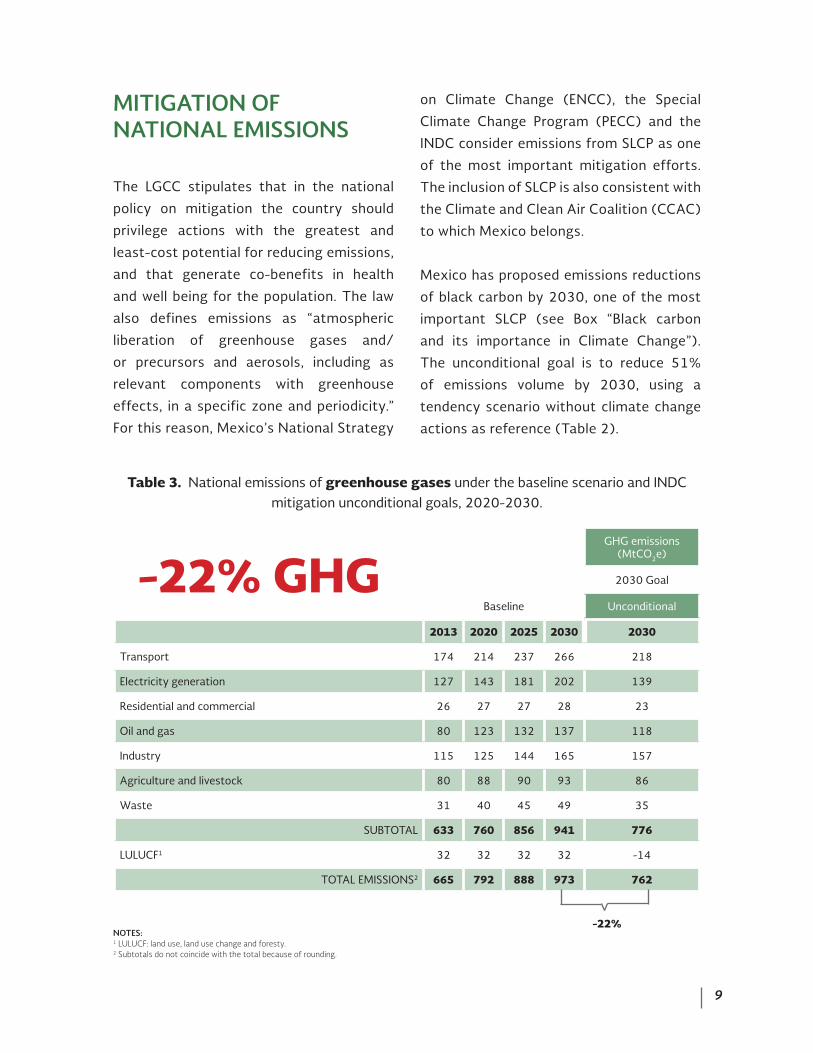
MITIGATION OF NATIONAL EMISSIONS
The LGCC stipulates that in the national
policy on mitigation the country should
privilege actions with the greatest and
least-cost potential for reducing emissions,
and that generate co-benefits in health
and well being for the population. The law
also defines emissions as “atmospheric
liberation of greenhouse gases and/
or precursors and aerosols, including as
relevant components with greenhouse
effects, in a specific zone and periodicity.”
For this reason, Mexico’s National Strategy
on Climate Change (ENCC), the Special
Climate Change Program (PECC) and the
INDC consider emissions from SLCP as one
of the most important mitigation efforts.
The inclusion of SLCP is also consistent with
the Climate and Clean Air Coalition (CCAC)
to which Mexico belongs.
Mexico has proposed emissions reductions
of black carbon by 2030, one of the most
important SLCP (see Box “Black carbon
and its importance in Climate Change”).
The unconditional goal is to reduce 51%
of emissions volume by 2030, using a
tendency scenario without climate change
actions as reference (Table 2).
NOTES:1 LULUCF: land use, land use change and foresty.2 Subtotals do not coincide with the total because of rounding.
-22% GHG
-22%
Table 3. National emissions of greenhouse gases under the baseline scenario and INDC mitigation unconditional goals, 2020-2030.
10
3 Considering a BAU with no measures to address climate change.4 Estimated as the quotient of the volume of emissions of GHG by GDP.
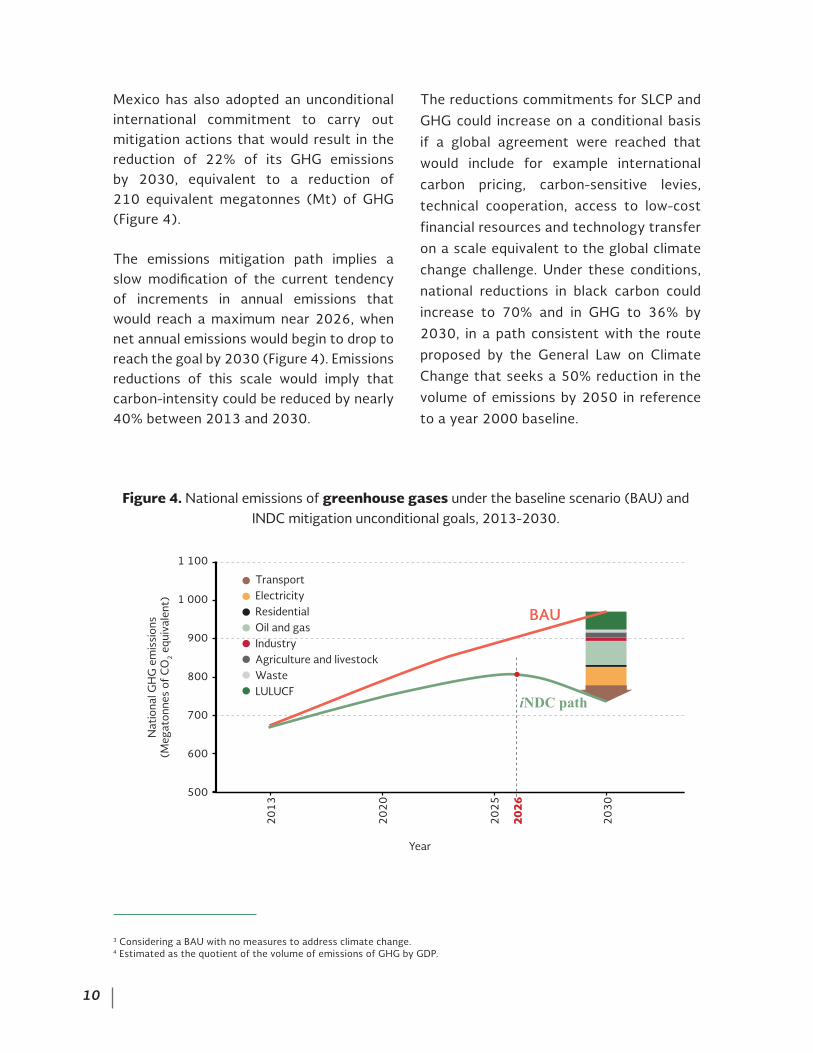
Mexico has also adopted an unconditional international commitment to carry out mitigation actions that would result in the reduction of 22% of its GHG emissions by 2030, equivalent to a reduction of 210 equivalent megatonnes (Mt) of GHG (Figure 4).
The emissions mitigation path implies a slow modification of the current tendency of increments in annual emissions that would reach a maximum near 2026, when net annual emissions would begin to drop to reach the goal by 2030 (Figure 4). Emissions reductions of this scale would imply that carbon-intensity could be reduced by nearly 40% between 2013 and 2030.
Figure 4. National emissions of greenhouse gases under the baseline scenario (BAU) and INDC mitigation unconditional goals, 2013-2030.
1 100
1 000
900
800
700
600
500
TransportElectricityResidentialOil and gasIndustryAgriculture and livestockWasteLULUCF
Nat
iona
l GH
G e
mis
sion
s (M
egat
onne
s of
CO
2 e
quiv
alen
t)
20
13
20
20
20
25
2026
20
30
BAU
iNDC path
Year
The reductions commitments for SLCP and
GHG could increase on a conditional basis
if a global agreement were reached that
would include for example international
carbon pricing, carbon-sensitive levies,
technical cooperation, access to low-cost
financial resources and technology transfer
on a scale equivalent to the global climate
change challenge. Under these conditions,
national reductions in black carbon could
increase to 70% and in GHG to 36% by
2030, in a path consistent with the route
proposed by the General Law on Climate
Change that seeks a 50% reduction in the
volume of emissions by 2050 in reference
to a year 2000 baseline.
11
PARTICIPATION OF DIFFERENT SECTORS TO MEET THE GOALS OF MEXICO´S CONTRIBUTION
ADAPTATION TO CLIMATE CHANGE IN MEXICO
5 Capacity of the natural or social systems to recover or support climate change effects.
The energy and industry sectors intend to:•Generate 35% of clean energy in 2024and 43% by 2030. Clean energy includes renewable sources, efficient combined heat and power and thermoelectric plants with carbon capture and storage;•Substitution of heavy fuels for naturalgas, clean energy and biomass in national industry;•25%reductioninmethaneleaks,ventingand controlled combustion; and•Control of soot particles in industrialequipment and installations.
In the case of the transport sector the goals are:•Standardize the environmental normsand regulations of the North American Free Trade Agreement (NAFTA) for existing and new vehicles as well as for locomotives, vessels and mobile machinery for agriculture and construction;•Provisionofultra-lowsulfurgasolineanddiesel;• Increase the vehicle pool using naturalgas and access to clean fuel;•Modernize the vehicle pool and reduceimports of used automobiles;•Promotemulti-modaltransportforfreightand passengers.
In the urban sector:•Encouragetheconstructionofsustainablebuildings and the transformation towards energy-efficient and low-carbon footprint sustainable cities; •Promote residential use of solar panelsand heaters; and•Methane recovery and use in municipallandfills and water treatment plans.
In the agricultural and forestry sector:•Meet0%deforestationratetargetby the year 2030;•Improveforestrymanagement;•Drivethesustainabletechnificationoftheagriculture and livestock sectors;•Promote the use of biodigesters inlivestock farms; and •Enhancerecuperationofgrasslands.
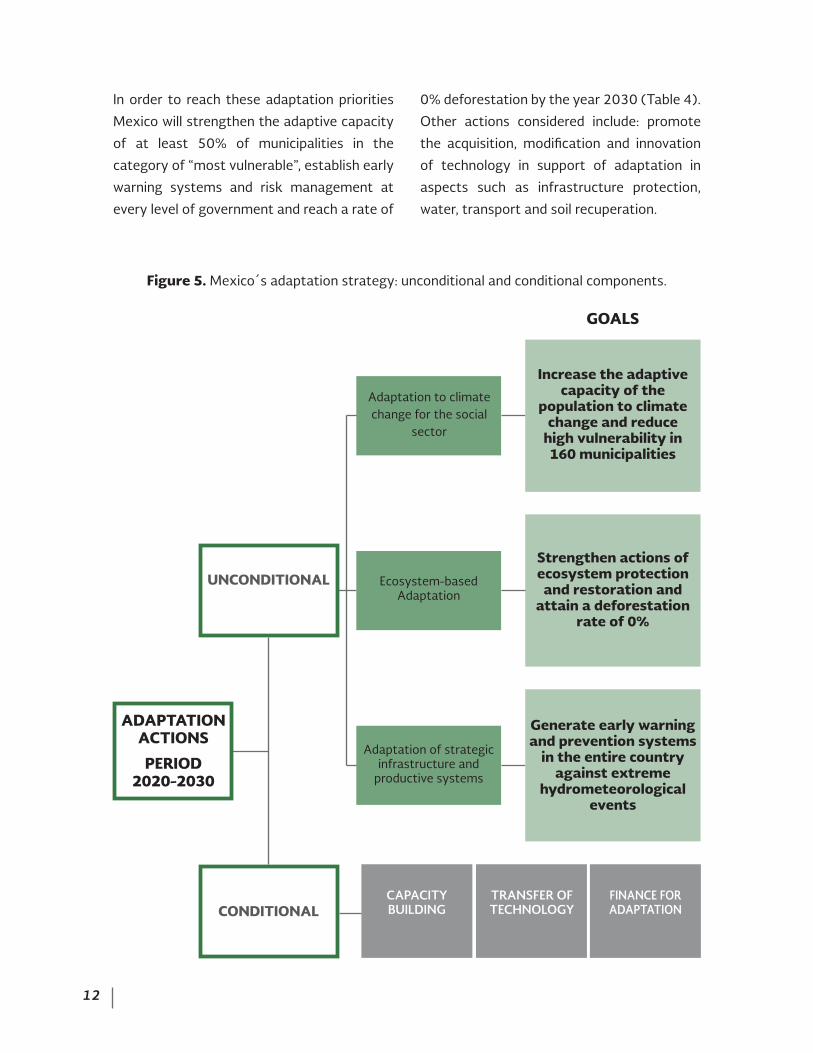
Mexico includes an Adaptation component
with unconditional and conditional
commitments by 2030 (Figure 5). The
priority of these actions is to protect
the population from the effects of
the climate change, such as extreme
hydrometeorological events and in parallel,
to increase the resilience5 of the country’s
strategic infrastructure and of the
ecosystems that harbor our biodiversity
and that provide important environmental
services.
12
Figure 5. Mexico´s adaptation strategy: unconditional and conditional components.
In order to reach these adaptation priorities
Mexico will strengthen the adaptive capacity
of at least 50% of municipalities in the
category of “most vulnerable”, establish early
warning systems and risk management at
every level of government and reach a rate of
0% deforestation by the year 2030 (Table 4).
Other actions considered include: promote
the acquisition, modification and innovation
of technology in support of adaptation in
aspects such as infrastructure protection,
water, transport and soil recuperation.
CAPACITYBUILDING
TRANSFER OFTECHNOLOGY
FINANCE FOR ADAPTATION
GOALS
ADAPTATIONACTIONS PERIOD
2020-2030
CONDITIONAL
UNCONDITIONAL
Adaptation to climate change for the social
sector
Ecosystem-based Adaptation
Adaptation of strategic infrastructure and
productive systems
Increase the adaptive capacity of the
population to climate change and reduce
high vulnerability in 160 municipalities
Strengthen actions of ecosystem protection and restoration and
attain a deforestation rate of 0%
Generate early warning and prevention systems
in the entire country against extreme
hydrometeorological events

13
Social SectorEcosystem-based
adaptation
Strategic infrastructure and
productive systems
Attain resilience in 50% of the country’s most
vulnerable municipalities
Fullfillment of 0% deforestation rate by the
year 2030
Establish early warning systems and risk
management at the three government levels
•Incorporateaclimate,gender and human rights approach to all territorial planning instruments and risk management
•Reforesthigh,mediumandlow watersheds considering native species
•Guaranteeandmonitorthe performance of urban and industrial waste water treatment in human settlements larger than 500,000 inhabitants
•Incrementthefinancialresources for disaster prevention and attention
•Increaseecologicalconnectivity and carbon capture through conservation and restoration
•Guaranteethesecurityofstrategic infrastructure
•Settheregulationoflanduse in areas at risk
•Increasecarboncaptureand the protection of coasts through the conservation of coastal ecosystems
•Incorporateclimatechangecriteria in agricultural and livestock related programs
•Integratedwatershedmanagement in order to ensure access to water
•SynergiesofREDD+actions
•Implementthestandardsfor environmental protection and adaptation specifications in coastal tourism developments
•Ensurecapacitybuildingand social participation in adaptation policy
•Guaranteetheintegralmanagement of water for its different uses (agriculture, ecological, urban, industrial and domestic)
•Incorporateadaptationcriteria for public investment projects that include infrastructure construction and maintenance
Table 4. Adaptation goals and actions included in Mexico´s INDC.
14
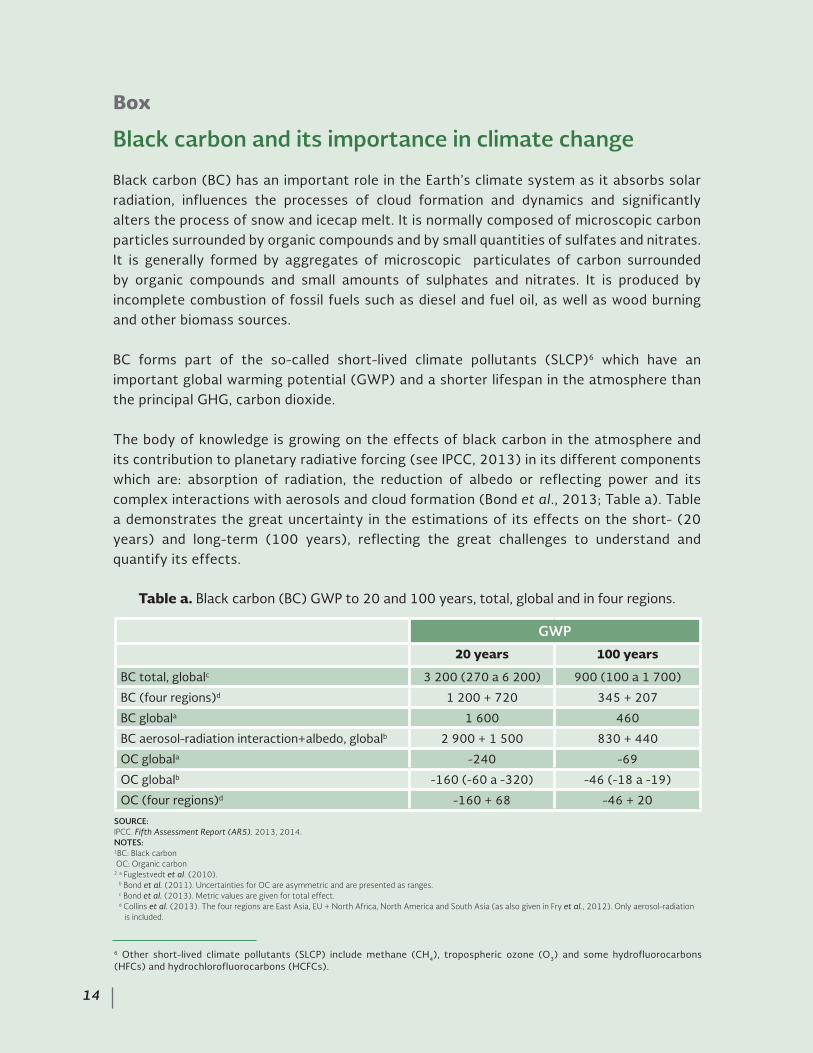
GWP
20 years 100 years
BC total, globalc 3 200 (270 a 6 200) 900 (100 a 1 700)
BC (four regions)d 1200+720 345+207
BC globala 1 600 460
BCaerosol-radiationinteraction+albedo,globalb 2900+1500 830+440
OC globala -240 -69
OC globalb -160 (-60 a -320) -46 (-18 a -19)
OC (four regions)d -160+68 -46+20
SOURCE:IPCC. Fifth Assessment Report (AR5). 2013, 2014.NOTES:1BC: Black carbon OC: Organic carbon2 a Fuglestvedt et al. (2010). b Bond et al. (2011). Uncertainties for OC are asymmetric and are presented as ranges. c Bond et al. (2013). Metric values are given for total effect. d Collins et al. (2013). The four regions are East Asia, EU + North Africa, North America and South Asia (as also given in Fry et al., 2012). Only aerosol-radiation is included.
6 Other short-lived climate pollutants (SLCP) include methane (CH4), tropospheric ozone (O3) and some hydrofluorocarbons (HFCs) and hydrochlorofluorocarbons (HCFCs).
Table a. Black carbon (BC) GWP to 20 and 100 years, total, global and in four regions.
Box
Black carbon and its importance in climate change
Black carbon (BC) has an important role in the Earth’s climate system as it absorbs solar radiation, influences the processes of cloud formation and dynamics and significantly alters the process of snow and icecap melt. It is normally composed of microscopic carbon particles surrounded by organic compounds and by small quantities of sulfates and nitrates. It is generally formed by aggregates of microscopic particulates of carbon surrounded by organic compounds and small amounts of sulphates and nitrates. It is produced by incomplete combustion of fossil fuels such as diesel and fuel oil, as well as wood burning and other biomass sources.
BC forms part of the so-called short-lived climate pollutants (SLCP)6 which have an important global warming potential (GWP) and a shorter lifespan in the atmosphere than the principal GHG, carbon dioxide.
The body of knowledge is growing on the effects of black carbon in the atmosphere and its contribution to planetary radiative forcing (see IPCC, 2013) in its different components which are: absorption of radiation, the reduction of albedo or reflecting power and its complex interactions with aerosols and cloud formation (Bond et al., 2013; Table a). Table a demonstrates the great uncertainty in the estimations of its effects on the short- (20 years) and long-term (100 years), reflecting the great challenges to understand and quantify its effects.
14
15
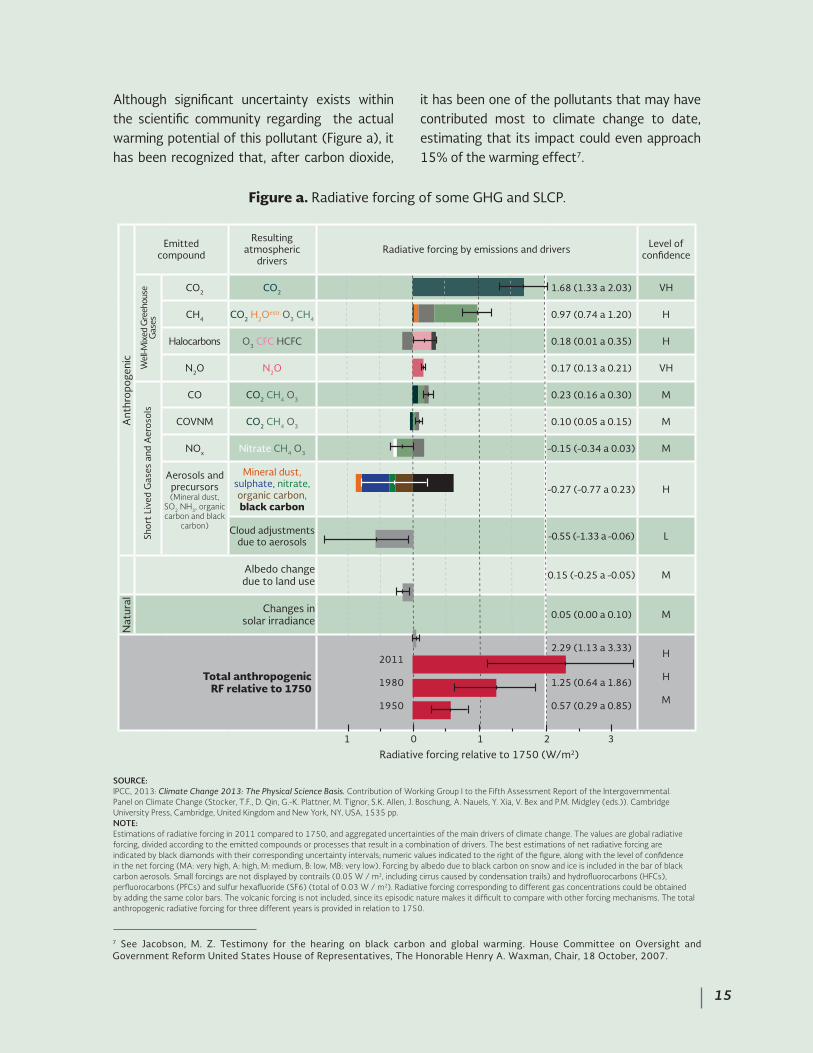
Figure a. Radiative forcing of some GHG and SLCP.
Emittedcompound
Resultingatmospheric
driversRadiative forcing by emissions and drivers Level of
confidence
CO2 CO2 1.68 (1.33 a 2.03) VH
CH4 CO2 H2Oestr. O3 CH4 0.97 (0.74 a 1.20) H
Halocarbons O3 CFC HCFC 0.18 (0.01 a 0.35) H
N2O N2O 0.17 (0.13 a 0.21) VH
CO CO2 CH4 O3 0.23 (0.16 a 0.30) M
COVNM CO2 CH4 O3 0.10 (0.05 a 0.15) M
NOx Nitrate CH4 O3 -0.15 (-0.34 a 0.03) M
Aerosols and precursors (Mineral dust,
SO2 NH3, organic carbon and black
carbon)
Mineral dust, sulphate, nitrate, organic carbon, black carbon
-0.27 (-0.77 a 0.23) H
Cloud adjustments due to aerosols -0.55 (-1.33 a -0.06) L
Albedo change due to land use 0.15 (-0.25 a -0.05) M
Changes in solar irradiance 0.05 (0.00 a 0.10) M
Total anthropogenic RF relative to 1750
2011
1980
1950
2.29 (1.13 a 3.33)
1.25 (0.64 a 1.86)
0.57 (0.29 a 0.85)
H
H
M
Ant
hrop
ogen
ic
Wel
l-Mix
ed G
reeh
ouse
G
ases
Shor
t Li
ved
Gas
es a
nd A
eros
ols
Nat
ural
1 0 1 2 3
Radiative forcing relative to 1750 (W/m2)
7 See Jacobson, M. Z. Testimony for the hearing on black carbon and global warming. House Committee on Oversight and Government Reform United States House of Representatives, The Honorable Henry A. Waxman, Chair, 18 October, 2007.
15
Although significant uncertainty exists within the scientific community regarding the actual warming potential of this pollutant (Figure a), it has been recognized that, after carbon dioxide,
it has been one of the pollutants that may have contributed most to climate change to date, estimating that its impact could even approach 15% of the warming effect7.
SOURCE:IPCC, 2013: Climate Change 2013: The Physical Science Basis. Contribution of Working Group I to the Fifth Assessment Report of the Intergovernmental.Panel on Climate Change (Stocker, T.F., D. Qin, G.-K. Plattner, M. Tignor, S.K. Allen, J. Boschung, A. Nauels, Y. Xia, V. Bex and P.M. Midgley (eds.)). Cambridge University Press, Cambridge, United Kingdom and New York, NY, USA, 1535 pp.NOTE:Estimations of radiative forcing in 2011 compared to 1750, and aggregated uncertainties of the main drivers of climate change. The values are global radiative forcing, divided according to the emitted compounds or processes that result in a combination of drivers. The best estimations of net radiative forcing are indicated by black diamonds with their corresponding uncertainty intervals; numeric values indicated to the right of the figure, along with the level of confidence in the net forcing (MA: very high, A: high, M: medium, B: low, MB: very low). Forcing by albedo due to black carbon on snow and ice is included in the bar of black carbon aerosols. Small forcings are not displayed by contrails (0.05 W / m2, including cirrus caused by condensation trails) and hydrofluorocarbons (HFCs), perfluorocarbons (PFCs) and sulfur hexafluoride (SF6) (total of 0.03 W / m2). Radiative forcing corresponding to different gas concentrations could be obtained by adding the same color bars. The volcanic forcing is not included, since its episodic nature makes it difficult to compare with other forcing mechanisms. The total anthropogenic radiative forcing for three different years is provided in relation to 1750.
16
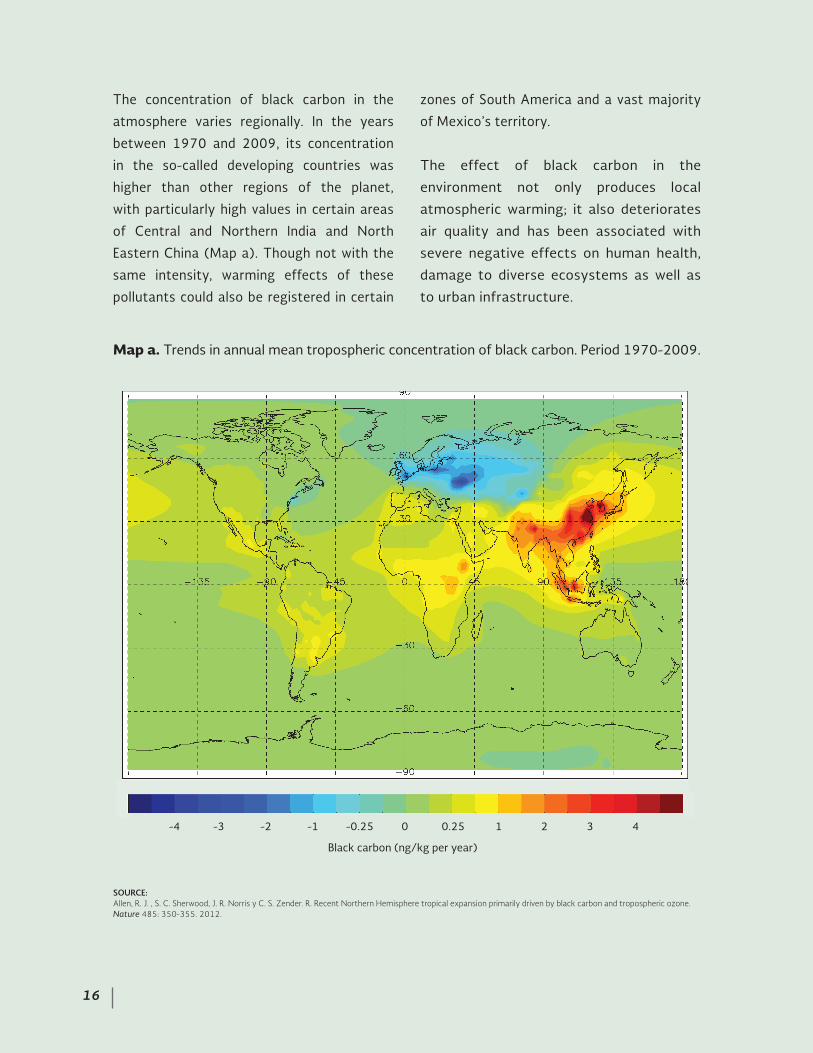
Map a. Trends in annual mean tropospheric concentration of black carbon. Period 1970-2009.
SOURCE: Allen, R. J. , S. C. Sherwood, J. R. Norris y C. S. Zender. R. Recent Northern Hemisphere tropical expansion primarily driven by black carbon and tropospheric ozone. Nature 485: 350-355. 2012.
The concentration of black carbon in the
atmosphere varies regionally. In the years
between 1970 and 2009, its concentration
in the so-called developing countries was
higher than other regions of the planet,
with particularly high values in certain areas
of Central and Northern India and North
Eastern China (Map a). Though not with the
same intensity, warming effects of these
pollutants could also be registered in certain
zones of South America and a vast majority
of Mexico’s territory.
The effect of black carbon in the
environment not only produces local
atmospheric warming; it also deteriorates
air quality and has been associated with
severe negative effects on human health,
damage to diverse ecosystems as well as
to urban infrastructure.
-4 -3 -2 -1 -0.25 0 0.25 1 2 3 4
Black carbon (ng/kg per year)
16
17
17
The LGCC establishes the obligation to
prioritize actions with higher mitigation
potential at the lowest cost encouraging
at the same time co-benefits of health
and wellness for the Mexican population.
That is why both the National Climate
Change Strategy, the 10-20-40 Vision
(ENCC 10-20-40) published in June 2013
as well as the Special Climate Change
Program (PECC 2014-2018) contemplate
the inclusion of SLCP in national emissions
mitigation actions.
The goal of 51% reduction in black carbon emissions committed to by Mexico could represent in CO2 equivalent about 3% of national emissions if the 900 value of global warming potential (GWP) is considered, which is commonly used as reference by the IPCC and the Climate and Clean Air Coalition.
For this reason, the actions aimed at abateing SLCP will have multiple benefits in addition to contributing to the short-term mitigation of climate change.
18
Land use and land use change and forestry (LULUCF) in calculating the Mexican Contribution
Box
18
Land use refers to the way humans use a specific surface either respecting its character as
natural ecosystem or allocating it to a different activity, for example, crops, pastures for
livestock, urban area or any other cover change.
The sector is a priority for strategies and climate actions of Mexico, both for its mitigation
potential (activities carried out in the different land uses contribute to GHG emissions and
absorptions), and adaptation (e.g., vulnerability to hydrometeorological phenomena in
locations with steep terrain is strongly related to the degree of conservation of natural
vegetation cover). Also, actions taken within the land use topic would also have impacts
on other areas of Mexico’s environmental agenda, such as protection of biodiversity and
ecosystem services, soil conservation, among others.
The use given to soil not only results in GHG emissions to the atmosphere. Plants absorb
carbon dioxide from the atmosphere through photosynthesis, as an input to produce organic
compounds necessary for their growth. Therefore, natural vegetation, as well as the oceans,
actually act as a “sink” for those gases. In this context, Mexico is a fortunate country given
its extensive forest ecosystem coverage, which makes the “sector” have a net absorption
effect. This means that it captures larger volumes of carbon dioxide related to the amount
it produces.
The ability to capture CO2 from land use can be achieved by increasing surfaces with
high absorption capabilities, such as forested surfaces, forestry and even well-managed
grasslands and agricultural lands.
It is noteworthy that there is still no global consensus on how to account for different
land uses in emissions mitigation commitments. In Mexico’s specific case, the baseline
established to calculate the contribution has not included the effects of forest land which
remains forest land, grassland which remains grassland, and cropland which remains
cropland. However, it includes projections of land use changes in the country, which
would also highlight the ambition of goals established by Mexico in its contribution.
Sectorial actions needed to achieve the goals recognize the importance of the LULUCF
sector. Among the most important are:
1919
•Haltingdeforestation,whichwouldsubtractemissionsarisingfromtheBAUscenarioand
would generate significant emission reductions; and
•Improving forest and soil management, resulting in an increase in removals beyond
those expected in the baseline; those obtained absorptions would also reduce net
emissions of the planet.
Determined mitigation actions, related to halting deforestation and improving forest and
soil management are priorities given that they would also be largely beneficial for Mexican
biodiversity conservation.
20
References
International Energy Agency. CO2 Emissions from Fuel Combustion. 2014.
Bond, T. C. et al. Bounding the role of black carbon in the climate system: A scientific assessment. Journal of Geophysical Research: Atmospheres. 118: 5380–5552. 2013.
Boot, B. and N. Bellouin. Climate change: Black carbon and atmospheric feedbacks. Nature. 519: 167-168. 2015.
Botello, A. Evaluación regional de la vulnerabilidad actual y futura de la zona costera mexicana y los deltas más impactados antes el incremento del nivel del mar debido al cambio climático y fenómenos hidrometeorológicos extremos. INE-SEMARNAT, UNAM. 2008.
CONAGUA, SEMARNAT. Atlas del Agua en México 2014. Biblioteca Mexicana del Conocimiento. México. 2014.
Chung, C. E., V. Ramanathan, Dohyeong Kim, and I. A. Podgorny. Global anthropogenic aerosol direct forcing derived from satellite and ground-based observations. Journal of Geophysical Research. 110. 2005.
DOF. Ley General de Cambio Climático. Diario Oficial de la Federación. México. 2012 (6 de junio).
INECC. Información sobre ecología y cambio climático. Respuesta Internacional. Disponible en: http://iecc.inecc.gob.mx/respuesta-internacional.php. Fecha de consulta: abril, 2015.
INECC. Vulnerabilidad al cambio climático en los municipios de México. Instituto Nacional de Ecología y Cambio Climático. Dirección General de Investigación de Ordenamiento Ecológico y Conservación de Ecosistemas. México. 2013.
IPCC. Fifth Assessment Report (AR5). 2013, 2014.
IPCC. Technical Summary: The Physical Science Basis. Contribution of Working Group I to the Fifth Assessment Report of the Intergovernmental Panel on Climate Change. United Kingdom y USA. 2013.
Jacobson, M. Z. Testimony for the hearing on black carbon and global warming. House Committee on Oversight and Government Reform United States House of Representatives, The Honorable Henry A. Waxman, Chair, 18 October. 2007.
Rogelj, J., M. Schaeffer, M. Meinshausen, D. T. Shindell, W. Hare, Z. Klimont, G. J. M. Velders, M. Amann and H. J. Schellnhuber. Disentangling the effects of CO2 and short-lived climate forcer mitigation. Proceedings of the National Academy of Sciences. 111: 16325-16330. 2014.
Sand, M., T. Iversen, P. Bohlinger, A. Kirkevåg, I. Seierstad, Ø. Seland, and A. Sorteberg. A Standardized Global Climate Model Study Showing Unique Properties for the Climate Response to Black Carbon Aerosols. Journal of Climate. 28, 2512–2526. 2015.
Semarnat. Estrategia Nacional de Cambio Climático Visión 10-20-40. México. 2013.
Semarnat. Programa Especial de Cambio Climático 2014 – 2018 (PECC). México. 2014.