methylmercury exposure increases lipocalin related (lpr) and
TRANSCRIPT

Mda
MJa
b
h
•••
a
ARRAA
KHOENB
mno
P
nlm(
0h
Toxicology Letters 222 (2013) 189– 196
Contents lists available at ScienceDirect
Toxicology Letters
jou rn al hom epage: www.elsev ier .com/ locate / tox le t
ethylmercury exposure increases lipocalin related (lpr) andecreases activated in blocked unfolded protein response (abu) genesnd specific miRNAs in Caenorhabditis elegans�
artina Rudgalvytea, Natalia VanDuynb, Vuokko Aarnioa, Liisa Heikkinena,uhani Peltonena, Merja Laksoa, Richard Nassb, Garry Wonga,∗
A. I. Virtanen Institute for Molecular Sciences, Department of Neurobiology, University of Eastern Finland, Kuopio, FinlandDepartment of Pharmacology and Toxicology, Indiana University School of Medicine, 635 Barnhill Drive, MS 549, Indianapolis, IN 46202, USA
i g h l i g h t s
Chronic methylmercury exposure increases oxidative stress and endoplasmic reticulum stress gene expression.Chronic methylmercury exposure increases lpr and decreases abu family gene expression.Chronic methylmercury exposure alters expression of miRNAs.
r t i c l e i n f o
rticle history:eceived 22 May 2013eceived in revised form 10 July 2013ccepted 10 July 2013vailable online 18 July 2013
eywords:eavy metalxidative stressR stressext-generation sequencing
a b s t r a c t
Methylmercury (MeHg) is a persistent environmental and dietary contaminant that causes seriousadverse developmental and physiologic effects at multiple cellular levels. In order to understand morefully the consequences of MeHg exposure at the molecular level, we profiled gene and miRNA transcriptsfrom the model organism Caenorhabditis elegans. Animals were exposed to MeHg (10 �M) from embryo tolarval 4 (L4) stage and RNAs were isolated. RNA-seq analysis on the Illumina platform revealed 541 genesup- and 261 genes down-regulated at a cutoff of 2-fold change and false discovery rate-corrected signif-icance q < 0.05. Among the up-regulated genes were those previously shown to increase under oxidativestress conditions including hsp-16.11 (2.5-fold), gst-35 (10.1-fold), and fmo-2 (58.5-fold). In addition, weobserved up-regulation of 6 out of 7 lipocalin related (lpr) family genes and down regulation of 7 out of15 activated in blocked unfolded protein response (abu) genes. Gene Ontology enrichment analysis high-
locked unfolded protein response lighted the effect of genes related to development and organism growth. miRNA-seq analysis revealed6–8 fold down regulation of mir-37-3p, mir-41-5p, mir-70-3p, and mir-75-3p. Our results demonstrate theeffects of MeHg on specific transcripts encoding proteins in oxidative stress responses and in ER stresspathways. Pending confirmation of these transcript changes at protein levels, their association and disso-ciation characteristics with interaction partners, and integration of these signals, these findings indicatebroad and dynamic mechanisms by which MeHg exerts its harmful effects.
©
� This is an open-access article distributed under the terms of the Creative Com-ons Attribution-NonCommercial-No Derivative Works License, which permits
on-commercial use, distribution, and reproduction in any medium, provided theriginal author and source are credited.∗ Corresponding author at: A. I. Virtanen Institute, University of Eastern Finland,
L 1627, Kuopio 70211, Finland. Tel.: +358 44 2121319; fax: +358 17 163030.E-mail addresses: [email protected] (M. Rudgalvyte),
[email protected] (N. VanDuyn), [email protected] (V. Aarnio),[email protected] (L. Heikkinen), [email protected] (J. Peltonen),
[email protected] (M. Lakso), [email protected] (R. Nass), [email protected]. Wong).
378-4274/$ – see front matter © 2013 The Authors. Published by Elsevier Ireland Ltd. Alttp://dx.doi.org/10.1016/j.toxlet.2013.07.014
2013 The Authors. Published by Elsevier Ireland Ltd. All rights reserved.
1. Introduction
Methylmercury (MeHg) is a global contaminant that originatesfrom inorganic mercury and accumulates in the environment. It hasbeen found in a broad range of living organisms including plants,wildlife, and humans (WHO, 1990) who are exposed to mercurymostly through ingestion of contaminated seafood and fish, butcan also be exposed through occupational hazards and via dentalprocedures (European Food Safety Authority, 2004; Björkman et al.,
2007). After exposure, high concentrations of mercury are found inthe brain as well as in blood, kidneys, and hair (Clarkson and Magos,2006). MeHg easily crosses the blood–brain, blood–placentaand blood–retinoic barriers. It is associated with humanl rights reserved.
1 logy L
dodsnort
mgmcSip2swa2cglMcwgfindtC
stgggoTieee2l2co
tmosairiaeoSt2
90 M. Rudgalvyte et al. / Toxico
evelopmental abnormalities, neurological dysfunction, embry-nic defects, and loss of vision (Takeuchi, 1968). While theeveloping fetus is highly sensitive, in adult humans, MeHg poi-oning can cause loss of physical coordination, abnormal speech,europathology, and death (Harada, 1968, 1978; Eto, 1997). Despitever 50 years of experience with human disasters, MeHg exposureemains a serious human health threat and its consequences con-inue to be intensely studied (Dórea et al., 2012; Aslan et al., 2013).
While the physical effects of MeHg toxicity are well docu-ented, the molecular targets remain obscure. MeHg depletes
lutathione, confers an increase in reactive oxygen species (ROS),itochondrial dysfunction, oxidative phosphorylation, and a loss of
alcium regulation (Clarkson and Magos, 2006; Choi et al., 1996).trategies to attenuate the toxic effects of MeHg include admin-stering antioxidants, chelators, or increasing metallothioneins toromote removal (Choi et al., 1996; Miles et al., 2000; Boscolo et al.,009). Due to MeHg’s role in oxidative stress, it has been hypothe-ized that mitochondria are an intracellular target, but associationsith endoplasmic reticulum (ER), Golgi complex, nuclear envelope,
nd lysosomes have also been observed (Chang, 1977; Limke et al.,004; Ceccatelli et al., 2010; Roos et al., 2012). Mercury ions formross-linkages with membrane proteins causing structural disor-anization and weakening of the architecture of membranes thateads to neurotoxic events (Baatrup, 1991; Barboni et al., 2008).
eHg mimics the amino acid methionine by forming MeHg-l-ysteine complexes. It has been suggested that the Hg reactionith proteins is non-specific: Hg ions react with any sulfhydryl
roup forming S–HG–S bridges (Miura and Imura, 1987). MeHg dif-uses across cell membranes as well as other cell compartments andnterfere not only with cell membrane proteins, but also with inter-al cell proteins. These events disturb crucial cell processes andecrease cell integrity, disrupt migration and change cell signalinghat ultimately leads to altered cell function (Limke et al., 2004;eccatelli et al., 2010; Roos et al., 2012).
Previous genome level studies aimed at elucidating the down-tream transcriptional effects of MeHg have found the targets ofhe oxidative stress-activated transcription factor Nrf2 to be upre-ulated including cell cycle, apoptosis, cytokine, and heat shockenes as well as adaptive response genes that include chemokines,lutathione S-transferases, metallothioneins, and thioredoxin per-xidases (Liu et al., 2003; Simmons et al., 2011; Ayensu andchounwou, 2006). While these previous studies have been highlynformative, they mainly focused on specific target tissues. Forxample, the studies profiled rat liver and kidneys (Hendriksent al., 2007), rat lungs (Liu et al., 2003) mice pup brains (Glovert al., 2009), metallothionein-I/II null mice brains (Yoshida et al.,011), or zebrafish liver (Ung et al., 2010). Other studies used cell
ines such as HepG2 (Kawata et al., 2007; Ayensu and Tchounwou,006). Simmons et al. (2011) demonstrated a variability betweenell lines in activity and relative potency in response to MeHg andther heavy metals.
The nematode Caenorhabditis elegans is a convenient tool foroxicological studies (Nass and Hamza, 2007). Since molecular
echanisms in development, cell migration and toxicity are anal-gous on many levels in C. elegans and humans, and they alsohare similarities in signaling and neurotransmitter systems, thisnimal has been a useful tool in basic human pathophysiology stud-es. We previously demonstrated that chronic exposure to MeHgeduces the brood size and number of viable eggs, and affects viabil-ty and development of the embryo with delays in morphogenesisnd gonadogenesis, and dopamine neuron degeneration (VanDuynt al., 2010). We also demonstrated the transcriptional regulation
f a variety of oxidative sress response genes, including glutathione-transferases that were dependent upon the transcription fac-or SKN-1, the C. elegans ortholog of Nrf2 (VanDuyn et al.,010).etters 222 (2013) 189– 196
In the current study, we investigated the effect of MeHg onglobal gene transcription in whole animals. This approach was usedto cover, as broadly as possible, tissue or cell specific responses.Moreover, we exposed animals from embryo to larval 4 (L4) stage,a stage just prior to adulthood, modeling a chronic exposure, inorder to uncover more chronic effects of heavy metal exposure. Inaddition, we used highly sensitive RNA-seq methodology coupledwith Gene Ontology enrichment analysis, to identify both individ-ual genes and overrepresented Gene Ontology terms. Finally, weused miRNA-seq as a global approach to identify miRNAs whoseexpression was altered following MeHg exposure in whole animals.
2. Materials and methods
2.1. C. elegans maintenance and treatment
C. elegans strains wild-type (WT) Bristol N2, RNAi-sensitive mutant NL2099(rrf-3(pk1426)), and transgenic JS4063 (Pabu-1::GFP) were obtained from theCaenorhabditis Genetics Center (St. Paul, MN, USA) and maintained on nematodegrowth media (NGM) plates with bacterial lawns containing OP50 strain E. coli bacte-ria at 20 ◦C according to standard procedures (Brenner, 1974). Synchronized wormswere obtained by bleaching gravid adults in potassium hypochlorite and washed4× in M9 buffer. Embryos were placed directly onto NGM plates seeded with OP50.Methylmercury(II)Cl (MeHg)(Sigma, St. Louis, MO, USA) was dissolved in distilledwater and kept as a 500 �M stock solution and then added to agar plates for a finalconcentration of 10 �M. Control plates were without MeHg added. Animals wereallowed to grow at 20 ◦C until reaching L4 stage just before adulthood (48–56 h) forRNA isolation.
2.2. RNA isolation and sequencing
For RNA isolation both control and MeHg-treated L4 stage worms were collected,washed 4× with sterile water and placed immediately into Trizol solution (Gibco-BRL, Gaithersberg, MD, USA). Total RNA was isolated according to manufacturer’sprotocol and quantitated on a Nanodrop device (Thermo Scientific, Wilmington,DE, USA). Total RNAs were then treated to remove DNA using Turbo DNA-freeDNAse kit (Ambion, Austin, TX, USA). Isolated and DNAse treated total RNA wasthen sequenced using Illumina library sample kit (Illumina, San Diego, CA, USA) ona GA IIx instrument, using single read 38 nt mode.
2.3. RNA-seq analysis
35.4 million and 41.1 million sequences of 38 bases were acquired from the con-trol and MeHg-treated samples, respectively. Reads containing adapters (536,533and 615,796 for control and MeHg-treated samples, respectively) were removedwith TagDust 1.13 (Lassmann et al., 2009) using the default parameter values (28.0%coverage cutoff and 0.01 FDR). To find reads arising from the food source E. coli,the remaining reads were aligned to E. coli genome (version st 536, NCBI) withBowtie 0.12.7 (Langmead et al., 2009) allowing 0 mismatches. Reads aligning tothe E. coli genome (1562 and 20,449, respectively) were removed from furthersteps of the analysis. The remaining reads were then aligned to C. elegans genome(WormBase WS220, Ensembl Release 66) and known splice junctions derivedfrom the gene annotation file ws220/genes.gtf with TopHat 2.0.3 (Trapnell et al.,2009) using the following parameter values: –no-novel-juncs, –min-intron-length10, –max-intron-length 25,000, –min-segment-intron 10, –max-segment-intron25,000, –min-coverage-intron 10, –max-coverage-intron 1000, –max-multihits 10,–transcriptome-mismatches 1, –genome-read-mismatches 1, –read-mismatches 1,–segment-mismatches 1, –bowtie-n, –G/ws220/genes.gtf.
Differential gene expression analysis was performed using Cuffdiff program ofCufflinks 1.3.0 (Trapnell et al., 2010) for 44,968 predicted transcripts. Transcriptswith false discovery rate-corrected p-values (q-values) of <0.05 and fold change >2(or <0.5) were defined as differentially expressed. Enriched Gene Ontology terms(The Gene Ontology Consortium, 2000) were found separately for the up-regulatedand down-regulated genes from DAVID Functional Annotation Tool (Huang et al.,2009).
2.4. miRNA-seq analysis
Small RNAs (<200 bp) were isolated from L4 animals after treatment with MeHg(10 �M) since embryo stage using the miRVana kit (Ambion) according to the manu-facturer’s instructions. One �g of isolated small RNAs were used to construct a libraryusing the Small RNA library prep set kit for Illumina (New England Biolabs, Ipswich,MA, USA) using the same conditions as reported previously (Srinivasan et al., 2013).
Library products were sequenced on Illumina GAIIx instrument in single read 38 ntmode.The sizes of the small RNA sequence libraries were 21.9 million reads for thecontrol and 23.3 million reads for the MeHg treated sample. From the raw datareads, 3′ adapters were trimmed and adapter dimers were removed using in-house

logy Letters 222 (2013) 189– 196 191
tl2CpR2Rpw
2
FtakiOiUplahwa
v
2
1stU1(sfttb2ms
2
g2afl2
3
3M
pMaef(tiTwfo
Fig. 1. Scatter plot of RNA-seq (A) and miRNA-seq (B) from control and MeHg(10 �M) treated animals. RNAs were isolated from whole animals treated fromembryo to L4 stage and libraries prepared and sequenced as described in Meth-ods. Data were plotted as fragments per kilobase of exon per million fragmentsmapped (FPKM) or reads per million mapped reads (RPM) as indicated. Upper andlower diagonal lines represent 2-fold or 0.5-fold ratio, respectively. Yellow dots (A)represent genes with a false discovery rate corrected significant change (q < 0.05)between treatments. The location of lpr family, abu family genes, and significant
M. Rudgalvyte et al. / Toxico
ools. Further, reads exactly mapping to E. coli genome were removed from theibraries. Of the preprocessed data including 20.8 million reads in the control and2.1 million reads in the treated sample, 85% and 84%, respectively, mapped to the. elegans genome (WS220) with max one mismatch. Alignment to the genome waserformed with Bowtie 0.12.9, (Langmead et al., 2009). Known miRNAs (miRBaseelease 19) were identified and calculated with miRDeep 2.0.0.5 (Friedländer et al.,012). Differential expression analysis was conducted for miRNAs with at least 1PM expression with DESeq 1.6.1 (Anders and Huber, 2010). miRNA targets wereredicted with miR-SOM (Heikkinen et al., 2010) and targets of lpr and abu genesith TargetScan worm 6.2 (Jan et al., 2011).
.5. Quantitative real-time PCR (qRT-PCR)
The expression of 13 genes was analyzed by qRT-PCR based on RNA-seq findings.our independent biological replicate total RNA samples from control and MeHg-reated (final concentration 10 �M) C. elegans were isolated from L4 stage wormss described above. Total RNA was reverse transcribed to cDNA using Revert-Aidit (Thermo Fisher Scientific, Waltham, MA, USA) according to the manufacturer’snstructions. Oligonucleotide primers for PCR were designed and obtained fromligomer OY (Helsinki, Finland). The amplification reaction was performed accord-
ng to the manufacturer’s protocol with SYBR green PCR Master mix (Thermo Fisher,SA) using iCycler 1.0 (Biorad, Hercules, CA, USA). Each of 4 biological replicates waserformed in duplicate technical replicates. Gene expression differences were calcu-
ated using the delta-delta-Ct method (Livak and Schmittgen, 2001). The act-1 gene, highly abundant housekeeping transcript was used as an internal control. This geneas been used previously as the internal control for qRT-PCR experiments under aide variety of conditions and from different tissues and organisms. Sequences for
ll primer sets used are listed in Supplementary Table 1.Supplementary data associated with this article can be found, in the online
ersion, at http://dx.doi.org/10.1016/j.toxlet.2013.07.014.
.6. RNA interference
RNA-mediated interference (RNAi) was accomplished on NGM plates containing mM isopropyl �-d-thiogalactoside (IPTG) and 100 �g/ml ampicillin. Plates wereeeded with HT115 (DE3), an RNase III-deficient E. coli strain carrying L4440 vec-or with the gene fragment (skn-1) (Source BioScience LifeSciences, Nottingham,K) or empty vector (Addgene, Cambridge, MA). Bacteria cultures were grown for0 h in liquid medium with 100 �g/ml ampicillin and without IPTG. After 10 h IPTG1 mM) was added, cultures were grown 4 h more and transferred onto plates. L1tage worms or embryos were transferred onto RNAi plates and incubated at 20 ◦Cor 48–56 h for RNA isolation. Control RNAi was performed with HT115 bacteria con-aining an empty L4440 vector. RNAi of skn-1 was confirmed by qRT-PCR of skn-1ranscripts. For ABU family RNAi studies, NL2099 animals were fed separately RNAiacteria of abu-1, 6, 7, 9, 10, and 11 for 48 h and then exposed to MeHg (10 �M,0 �M, or 50 �M) for 2 days and then animals were scored for death. For develop-ental studies, NL2099 animals were grown on ABU family RNAi bacteria from L1
tage on 1 �M MeHg and time to adulthood was measured.
.7. Fluorescence microscopy
JS4063 animals from control and MeHg-treated (final concentration 125 �M)roups were placed on an agar pad with a drop of Aldicarb (final concentration.5 mM) and a drop of Fluoroshield (Sigma Chemicals). In order to avoid drying,nimals were imaged immediately on an Olympus IX71 (Olympus, Tokyo, Japan)uorescent microscope. Images were taken with DP Controller software (version.1.1.227, Olympus) at magnification 100×.
. Results
.1. RNA-seq and miRNA-seq analysis of C. elegans exposed toeHg
A total of 35.4 million and 41.1 million sequence reads wereroduced from sequencing RNA-seq libraries from control andeHg-treated samples, respectively. From Cufflinks RNA-seq data
nalysis program, using criteria of >2 fold change and false discov-ry rate (FDR) corrected p-value (q-value) <0.05, 802 genes wereound to be regulated, of which 541 were up and 267 were downFig. 1A). The complete list of regulated genes is in Supplemen-ary Table 2. Known oxidative stress responsive genes up-regulatedncluded hsp-16.11 (2.5-fold), gst-35 (10-fold), and fmo-2 (58-fold).
he largest fold change was the downstream of daf-16 gene dod-21hich was up-regulated >890-fold. The genes with the 20 largestold-changes up and down and their FPKM (fragments per kilobasef exon per million fragments mapped) values are shown in Table 1.
miRNAs are indicated with a red triangle. (For interpretation of the references tocolor in this figure legend, the reader is referred to the web version of the article.)
Supplementary data associated with this article can befound, in the online version, at http://dx.doi.org/10.1016/j.toxlet.2013.07.014.
From miRNA-seq analysis we were able to identify 4 mature
miRNA sequences significantly altered after MeHg exposure(Fig. 1B). All were down regulated in MeHg animals (p < 0.05):miR-37-3p, 7.5-fold; miR-75-3p, 7.8-fold; miR-70-3p, 5.7-fold; miR-41-5p, 6.5-fold. The complete list of miRNAs and expression values
192 M. Rudgalvyte et al. / Toxicology Letters 222 (2013) 189– 196
Table 1Twenty (20) most up-regulated transcripts and twenty (20) most down-regulated transcripts in MeHg-treated compared to non-treated C. elegans. FPKM values are fragmentsper kilobase of exon per million fragments mapped.
Transcript ID WormBase locus ID (if available) FPKM in control FPKM in MeHg treated Fold change FPKMMeHg/FPKMcontrol FDR-correctedp-value(q-value)
C32H11.10 dod-21 0.04 34.09 901.96 4.23 × 10⁻⁹
C32H11.9 0.07 33.13 443.14 0.00F44G3.10 0.09 15.66 174.99 5.22 × 10⁻⁵
B0399.2 oac-1 0.02 1.78 94.90 7.30 × 10⁻⁴
C08E3.1 1.94 150.74 77.85 6.80 × 10⁻⁷
Y64H9A.2 0.45 32.52 71.91 0.00C08E3.13 3.19 226.42 70.89 0.00K08C7.5 fmo-2 0.11 6.67 57.98 1.40 × 10⁻¹²
E03H4.10 clec-17 0.09 4.32 46.72 3.96 × 10⁻⁷
F55F8.1 ptr-10 0.08 3.79 46.66 4.90 × 10⁻¹¹
R03H4.6 bus-1 0.18 8.21 46.40 1.85 × 10⁻¹³
T08G5.3 0.13 5.81 44.32 6.62 × 10⁻⁵
Y51B9A.4 arrd-2 0.04 1.44 38.31 1.53 × 10⁻²
F26D11.2 0.07 2.24 33.52 3.45 × 10⁻⁴
EGAP7.1 dpy-3 0.98 32.70 33.36 0.00R07E3.6 0.51 16.94 33.16 0.00C08E3.10 fbxa-158 0.08 2.52 31.84 2.64 × 10⁻⁴
W04G3.3 lpr-4 1.37 43.42 31.65 0.00W04G3.8 lpr-3 1.54 47.76 31.05 0.00W04G3.2 lpr-5 1.07 33.23 30.98 0.00
T06E4.9 9.65 1.18 0.12 3.68 × 10⁻⁴
F59B10.3 3.73 0.45 0.12 1.48 × 10⁻³
ZC262.10 2.46 0.29 0.12 3.93 × 10⁻³
ZC262.9 2.46 0.29 0.12 3.93 × 10⁻³
F28F8.2 acs-2 18.51 2.17 0.12 9.95 × 10⁻¹⁴
C05A9.1 pgp-5 55.68 6.32 0.11 9.95 × 10⁻¹⁴
C15A11.6 col-62 301.83 33.98 0.11 0.00Y51H4A.9 col-137 34.60 3.89 0.11 3.38 × 10⁻⁷
T21E8.2 pgp-7 26.31 2.93 0.11 1.95 × 10⁻¹⁰
T21E8.1 pgp-6 58.97 6.55 0.11 0.00C15A11.5 col-7 312.88 33.27 0.11 0.00W06G6.10 6.88 0.71 0.10 1.90 × 10⁻³
C03A7.4 pqn-5 6.96 0.70 0.10 2.23 × 10⁻⁵
C03A7.7 abu-6 5.73 0.53 0.09 2.08 × 10⁻⁵
C01G12.11 nspb-9 6.94 0.63 0.09 1.06 × 10⁻²
C03A7.8 abu-7 6.92 0.63 0.09 5.74 × 10⁻⁶
Y37E11B.9 0.83 0.07 0.09 4.22 × 10⁻²
0 −6
00
cpSmota
f2
3
vfliawffttg
T06E4.11 pqn-63 4.22
T06E4.10 3.19
Y47D7A.9 18.25
an be found in Supplementary Table 3. Using a miRNA targetrediction software TargetScanWorm 6.2 (Jan et al., 2011) and miR-OM (Heikkinen et al., 2010) we looked for potential targets ofiRNA from our list of regulated RNAs. We were not able to find lpr
r abu family genes on the candidate target lists. We also looked athe possible miRNAs that would regulate lpr and abu gene familiesnd these also did not overlap with the found regulated miRNAs.
Supplementary data associated with this article can beound, in the online version, at http://dx.doi.org/10.1016/j.toxlet.013.07.014.
.2. qRT-PCR confirms LPR and ABU genes
A large number of LPR (LiPocalin-Related protein) and ABU (Acti-ated in Blocked Unfolded protein response) family members wereound to be regulated. The LPR genes included lpr-1, lpr-3, lpr-4,pr-5, lpr-6, lpr-7 from a total of 7 family members. The abu genesncluded abu-1, abu-6, abu-7, abu-8, abu-9, abu-10, and abu-11 from
total of 15 family members. In order to verify the gene regulation,e performed qRT-PCR on the 13 genes from ABU and LPR gene
amilies using four independent MeHg-treated and control samples
rom L4 animals (Fig. 2). The 6 LPR family members were confirmedo be up-regulated and all 7 ABU family members were confirmedo be down-regulated significantly. The most highly decreased abuene based on qRT-PCR results was abu-1 (20-fold down), while.30 0.07 6.14 × 10
.13 0.04 1.76 × 10⁻³
.37 0.02 7.44 × 10⁻³
RNA-seq showed a lower but still robust 7-fold change down. OtherABU family genes were also confirmed to be down-regulated. Thelpr genes had more modest fold changes in qRT-PCR than in RNA-seq. The most highly up-regulated lpr gene, lpr-4, according toRNA-seq (31-fold) was only 2-fold up-regulated in qRT-PCR. OtherLPR family genes also share similar fold change differences compar-ing RNA-seq and qRT-PCR results but are consistently up-regulatedaccording to both methods.
3.3. abu-1 transcriptional regulation to MeHg is not dependentupon skn-1 expression
MeHg (10 �M) exposure from embryo to L4 decreased abu-1expression in skn-1 RNAi animals (0.67 ± 0.20, n = 4) relative tonon-exposed animals, and also in HT115 no-RNAi control ani-mals (0.52 ± 0.17, n = 4). No significant difference was detectedbetween abu-1 expression after MeHg exposure in skn-1 and con-trol RNAi treatments (p = 0.31). skn-1 RNAi treatments decreasedskn-1 expression 3.0 ± 0.77 fold. MeHg increased lpr-1 expressionin skn-1 RNAi animals (2.1 ± 0.34, n = 4) while the increases were
1.1 ± 0.34, n = 4 in HT115 RNAi animals. We also performed RNAiof abu-1, 6, 7, 9, 10, and 11 and measured sensitivity to MeHg at10 �M, 20 �M, or 50 �M, for 48 h. We were not able to find any dif-ferences in sensitivity as measured by percentage of live animals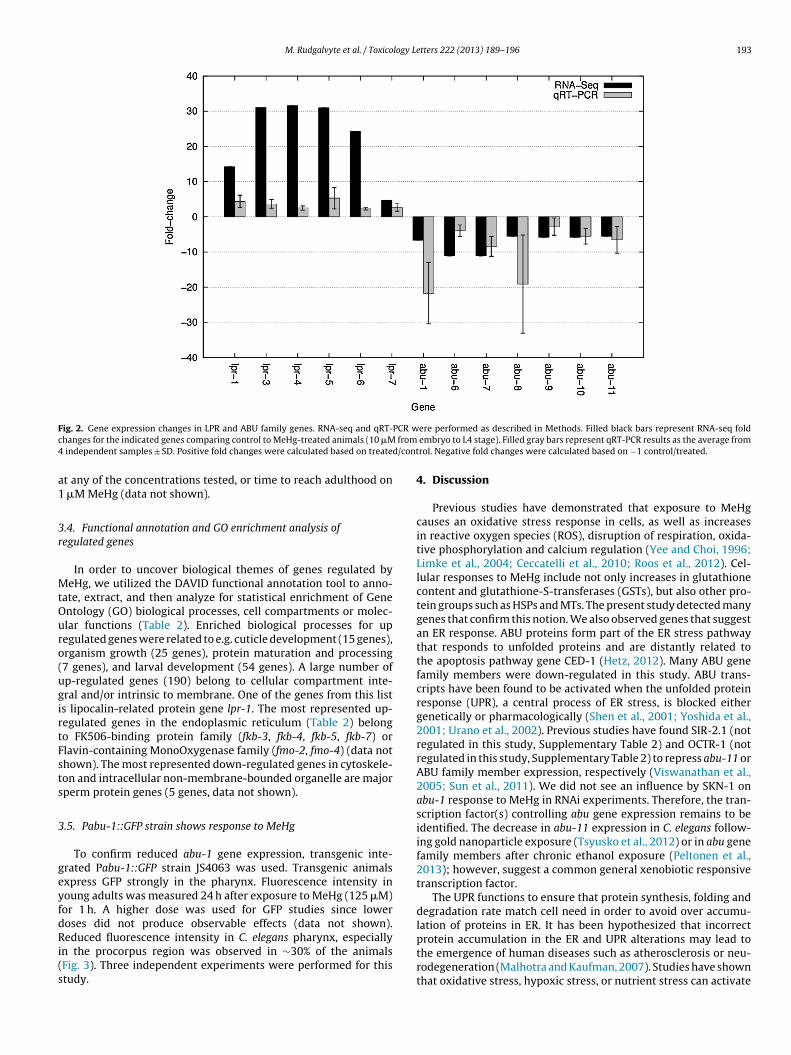
M. Rudgalvyte et al. / Toxicology Letters 222 (2013) 189– 196 193
F PCR wc from4 d/cont
a1
3r
MtOuro(ugirtFsts
3
geyfdRi(s
ig. 2. Gene expression changes in LPR and ABU family genes. RNA-seq and qRT-hanges for the indicated genes comparing control to MeHg-treated animals (10 �M
independent samples ± SD. Positive fold changes were calculated based on treate
t any of the concentrations tested, or time to reach adulthood on �M MeHg (data not shown).
.4. Functional annotation and GO enrichment analysis ofegulated genes
In order to uncover biological themes of genes regulated byeHg, we utilized the DAVID functional annotation tool to anno-
ate, extract, and then analyze for statistical enrichment of Genentology (GO) biological processes, cell compartments or molec-lar functions (Table 2). Enriched biological processes for upegulated genes were related to e.g. cuticle development (15 genes),rganism growth (25 genes), protein maturation and processing7 genes), and larval development (54 genes). A large number ofp-regulated genes (190) belong to cellular compartment inte-ral and/or intrinsic to membrane. One of the genes from this lists lipocalin-related protein gene lpr-1. The most represented up-egulated genes in the endoplasmic reticulum (Table 2) belongo FK506-binding protein family (fkb-3, fkb-4, fkb-5, fkb-7) orlavin-containing MonoOxygenase family (fmo-2, fmo-4) (data nothown). The most represented down-regulated genes in cytoskele-on and intracellular non-membrane-bounded organelle are majorperm protein genes (5 genes, data not shown).
.5. Pabu-1::GFP strain shows response to MeHg
To confirm reduced abu-1 gene expression, transgenic inte-rated Pabu-1::GFP strain JS4063 was used. Transgenic animalsxpress GFP strongly in the pharynx. Fluorescence intensity inoung adults was measured 24 h after exposure to MeHg (125 �M)or 1 h. A higher dose was used for GFP studies since loweroses did not produce observable effects (data not shown).
educed fluorescence intensity in C. elegans pharynx, especiallyn the procorpus region was observed in ∼30% of the animalsFig. 3). Three independent experiments were performed for thistudy.
ere performed as described in Methods. Filled black bars represent RNA-seq fold embryo to L4 stage). Filled gray bars represent qRT-PCR results as the average fromrol. Negative fold changes were calculated based on −1 control/treated.
4. Discussion
Previous studies have demonstrated that exposure to MeHgcauses an oxidative stress response in cells, as well as increasesin reactive oxygen species (ROS), disruption of respiration, oxida-tive phosphorylation and calcium regulation (Yee and Choi, 1996;Limke et al., 2004; Ceccatelli et al., 2010; Roos et al., 2012). Cel-lular responses to MeHg include not only increases in glutathionecontent and glutathione-S-transferases (GSTs), but also other pro-tein groups such as HSPs and MTs. The present study detected manygenes that confirm this notion. We also observed genes that suggestan ER response. ABU proteins form part of the ER stress pathwaythat responds to unfolded proteins and are distantly related tothe apoptosis pathway gene CED-1 (Hetz, 2012). Many ABU genefamily members were down-regulated in this study. ABU trans-cripts have been found to be activated when the unfolded proteinresponse (UPR), a central process of ER stress, is blocked eithergenetically or pharmacologically (Shen et al., 2001; Yoshida et al.,2001; Urano et al., 2002). Previous studies have found SIR-2.1 (notregulated in this study, Supplementary Table 2) and OCTR-1 (notregulated in this study, Supplementary Table 2) to repress abu-11 orABU family member expression, respectively (Viswanathan et al.,2005; Sun et al., 2011). We did not see an influence by SKN-1 onabu-1 response to MeHg in RNAi experiments. Therefore, the tran-scription factor(s) controlling abu gene expression remains to beidentified. The decrease in abu-11 expression in C. elegans follow-ing gold nanoparticle exposure (Tsyusko et al., 2012) or in abu genefamily members after chronic ethanol exposure (Peltonen et al.,2013); however, suggest a common general xenobiotic responsivetranscription factor.
The UPR functions to ensure that protein synthesis, folding anddegradation rate match cell need in order to avoid over accumu-lation of proteins in ER. It has been hypothesized that incorrect
protein accumulation in the ER and UPR alterations may lead tothe emergence of human diseases such as atherosclerosis or neu-rodegeneration (Malhotra and Kaufman, 2007). Studies have shownthat oxidative stress, hypoxic stress, or nutrient stress can activate
194 M. Rudgalvyte et al. / Toxicology Letters 222 (2013) 189– 196
Table 2Enriched GO biological process, molecular function and cellular compartment terms among differentially expressed genes in response to MeHg treatment. Genes and %correspond to the number and percentage of the regulated genes that have the GO term annotation in question. p-value is a measure of enrichment (Fisher exact test) of theGO term among the genes.
Genes % q-value
Enriched biological process for up-regulated genesCollagen and cuticulin-based cuticle development 15 2.9 8.5 × 10⁻⁹
Positive regulation of multicellular organism growth 25 4.9 1.7 × 10⁻⁷
Protein maturation 7 1.4 1.8 × 10⁻⁶
Protein processing 7 1.4 1.8 × 10⁻⁶
Oviposition 15 2.9 5.1 × 10⁻³
Nematode larval development 54 10.6 9.5 × 10⁻³
Proteolysis 21 4.1 1.2 × 10⁻²
Post-embryonic body morphogenesis 3 0.6 1.6 × 10⁻²
Steroid metabolic process 4 0.8 2.7 × 10⁻²
Enriched biological process for down-regulated genesDephosphorylation 6 2.7 2.7 × 10⁻³
Vitelline membrane formation 3 1.3 9.0 × 10⁻³
Protein modification process 12 5.3 1.1 × 10⁻²
Aminoglycan metabolic process 3 1.3 2.2 × 10⁻²
Enriched molecular function for up-regulated genesHedgehog receptor activity 8 1.6 4.0 × 10⁻⁷
3-Beta-hydroxy-delta5-steroid dehydrogenase activity 3 0.6 1.1 × 10⁻²
Steroid dehydrogenase activity, acting on the CH-OH group of donors, NAD or NADP as acceptor 3 0.6 1.1 × 10⁻²
Calcium ion binding 9 1.8 2.2 × 10⁻²
Serine-type endopeptidase activity 4 0.8 4.4 × 10⁻²
Enriched molecular function for down-regulated genesPhosphatase activity 11 4.9 1.6 × 10⁻⁵
Adenyl ribonucleotide binding 17 7.6 4.0 × 10⁻³
ATPase activity, coupled to transmembrane movement of substances 5 2.2 4.6 × 10⁻³
P P-bond-hydrolysis-driven transmembrane transporter activity 5 2.2 6.0 × 10⁻³
Metallopeptidase activity 6 2.7 1.6 × 10⁻²
Pyrophosphatase activity 9 4.0 2.3 × 10⁻²
Enriched cellular component for up-regulated genesIntegral to membrane 190 37.2 1.2 × 10⁻⁵
intrinsic to membrane 190 37.2 1.4 × 10⁻⁵
External side of plasma membrane 3 0.6 3.5 × 10⁻³
Endoplasmic reticulum 9 1.8 1.6 × 10⁻²
Enriched cellular component for down-regulated genesCytoskeleton 13 5.8 3.0 × 10⁻⁶
Cytoskeletal part 7 3.1 1.4 × 10⁻³
Intracellular non-membrane-bounded organelle 14 6.2 2.2 × 10⁻³
Intermediate filament 3 1.3 6.0 × 10⁻³
−3
tEht
Faiac
Intermediate filament cytoskeleton
Myosin complex
Actin cytoskeleton
he UPR pathway (Wang and Kaufman, 2012). A classic marker forR stress activation in mammalian cells is CHOP and this wouldave been useful to test, however no C. elegans orthologs existso our knowledge (Marciniak et al., 2004). We also observed the
ig. 3. Fluorescence intensity changes in pharynx of Pabu-1::GFP strain young adults afternd treated with the MeHg for 24 h. Animals were then placed on an agar pad and microgn (B) represents decreased GFP intensity. Plates of animals were also scored for loss of Gnimals with decreased GFP intensity from 4 independent experiments of 99–159 animalonsistent and unambiguous decrease of at least 50% in fluorescence. No animals with de
3 1.3 6.0 × 10³ 1.3 2.3 × 10⁻²
3 1.3 4.9 × 10⁻²
regulation of oxidative stress markers such as fmo, hsp, and gstgenes. However, separating the oxidative stress response fromthe ER stress responses may be difficult. For example, two flavinmono-oxygenease genes, fmo-2 and fmo-4, were grouped into the
exposure to MeHg (125 �M). Transgenic integrated animals were grown to L4 stageraphs taken of the pharynx of either control (A) or MeHg treated (B) animals. PhotoFP intensity. Values in panel (C) represent mean percent and standard deviation ofs each. Animals were scored as decreased GFP intensity if the procorpus region hadcreased GFP were observed in control plates.

logy Le
eatpcetmc
tcssstaeotpIseowttnntMe0anrsRs(msptd
eufipcuwsmemhmNm
rts
M. Rudgalvyte et al. / Toxico
ndoplasmic reticulum (ER) class of proteins by gene enrichmentnalysis, but these genes could also be considered markers of oxida-ive stress. Also found within this class were four FK506 bindingroteins. These proteins were originally classed as peptidyl prolylis-trans isomerases (PPIase) involved in protein folding. How-ver, they were later found to be histone chaperones involved inhe regulation of rDNA silencing, and suggests a potential novel
echansim by which MeHg could regulate developmental pro-esses (Kuzuhara and Horikoshi, 2004).
The lpr gene family is known to play an important role in excre-ory duct cell development. The lpr-1 gene is required for luminalonnectivity between excretory duct and pore cell in excretoryystem of C. elegans (Stone et al., 2009). In the present study, wehowed up-regulation of multiple LPR family members. Lipocalinequences are diverse, however, they share functional and struc-ural conservation. Most lipocalins have 1–3 disulfide bonds andn eight strand anti-parallel, symmetrical beta barrel fold, how-ver, it is the function of a human lipocalin (Von Ebner’s Glandf the tongue, VEGh) that acts as a cysteine protease inhibitorhat suggests increases in lipocalin may be a response to increaserotection of cysteine containing proteins (van’t Hof et al., 1997).
ncreases in GSTs could also be elicited by methylmercury for 2 rea-ons: first, as a general response due to oxidative stress (VanDuynt al., 2010), and secondly, perhaps to directly facilitate the removalf methylmercury via glutathione S-transferase activity. Coupledith the historical literature demonstrating mercury as an effec-
ive nephrotoxin (Edwards, 1942; Rodin and Crowson, 1962), andhe current literature advocating lipocalin as an indicator of kid-ey damage (Mori and Nakao, 2007), our results would suggest aovel link between nematodes and humans in an aspect of nephro-oxicity. The increases in LPR family gene expression after chronic
eHg exposure are consistent with cellular damage since acutexposure for 3 h in MeHg (10 �M) resulted in only very modest.9–1.7 fold changes in LPR family members (data not shown). Inddition, our RNA-seq and qRT-PCR data show quantitative butot qualitative differences. While the high sensitivity and dynamicange of RNA-seq for detecting and quantitating gene expres-ion has been established, few studies have compared directlyNA-seq versus qRT-PCR. Lee et al. (2011) compared 27 randomlyelected genes for such a comparison. While correlation was goodr2 = 0.62–0.90), it depended upon the RNA-seq data processing
ethod used, gene isoform, and level of expression. Clearly, RNA-eq methods still require improved and standardized methods torovide more accurate expression values. These improvements andheir implementation will likely lead to better agreement betweenifferent gene expression level detection platforms.
We observed 4 miRNAs that were significantly altered in MeHgxposed animals, yet their predicted targets did not overlap our reg-lated genes list. Several possible scenarios could account for this:rst, miRNA target prediction remains difficult with many falseositives/negatives and few known validated hits; second, miRNAsould act locally and thus a whole animal approach such as wassed here could dilute any miRNA or mRNA differences; finally, thehole animal approach limits the ability to know the anatomical
ource of the miRNA and its target, thus limiting the ability to detectiRNA-mRNA target combinations that might be regulated mod-
stly but are closely linked anatomically. Novel single cell RNA-seqethods are now becoming feasible and may eventually be able to
elp to tease apart the precise interactions between miRNAs andRNAs at the single cell level (Tang et al., 2010). Moreover, miR-As can in some cases repress translation of target mRNAs withoutarkedly reducing their levels (Valencia-Sanchez et al., 2006).
In summary, we have identified 2 gene families and 4 miRNAsegulated following exposure to MeHg in C. elegans. The generanscripts regulated suggest an important role for oxidativetress, ER stress, and excretory duct cell development pathways in
tters 222 (2013) 189– 196 195
mediating the toxic actions of MeHg. The results presented are atthe transcript level, and therefore preliminary pending confirma-tion at the protein level, characterization of the status of proteininteraction partners, intracellular locations, and integration ofER stress signals. While a broad array of pathways is involved,our studies suggest that individual genes that contribute to suchactions can be elucidated using a global transcriptomic approach.
Conflict of interest statement
The authors declare that they have no conflicts of interest.
Acknowledgements
The authors thank the Academy of Finland (M.L., G.W.), Bio-center Finland (L.H.), Finnish Cultural Foundation/Northern SavoRegional Fund (V.A.) and the doctoral program of molecularmedicine at the University of Eastern Finland (M.R. and J.P.) forfinancial support. This study was partially supported by grantsR01ES014459 and ES015559 from the National Institute of Environ-mental Health Sciences (RN) and an EPA STAR graduate fellowship(N.V.). We gratefully acknowledge Drs. Paul Sternberg and IgorAntoshechkin at the Millard and Muriel Jacobs Genetics andGenomics Laboratory, California Institute of Technology, for assis-tance with sequencing. We are indebted to Drs. Antero Salminenand Markus Storvik, and members of the NordForsk Nordic C.elegans Network for comments, suggestions, and encouragement.Some strains were provided by the Caenorhabditis Genetics Center,which is funded by NIH Office of Research Infrastructure Programs(P40 OD010440).
References
Anders, S., Huber, W., 2010. Differential expression analysis for sequence count data.Genome Biology 11, R106.
Aslan, L., Aslankurt, M., Bozkurt, S., Aksoy, A., Ozdemir, M., Gizir, H., Yasar, I., 2013.Ophthalmic findings in acute mercury poisoning in adults: a case series study.Toxicology and Industrial Health [Epub ahead of print].
Ayensu, W.K., Tchounwou, P.B., 2006. Microarray analysis of mercury-inducedchanges in gene expression in human liver carcinoma (HepG2) cells: impor-tance in immune responses. International Journal of Environmental Researchand Public Health 3, 141–173.
Baatrup, E., 1991. Structural and functional effects of heavy metals on the nervoussystem, including sense organs, of fish. Comparative Biochemistry and Physiol-ogy - Part C 100, 253–257.
Barboni, M.T., da Costa, M.F., Moura, A.L., Feitosa-Santana, C., Gualtieri, M., Lago, M.,Medrado-Faria, Mde, A., Silveira, L.C., Ventura, D.F., 2008. Visual field losses inworkers exposed to mercury vapor. Environmental Research 107, 124–131.
Björkman, L., Lundekvam, B.F., Laegreid, T., Bertelsen, B.I., Morild, I., Lilleng, P., Lind,B., Palm, B., Vahter, M., 2007. Mercury in human brain, blood, muscle and toenailsin relation to exposure: an autopsy study. Environmental Health 6, 30.
Boscolo, M., Antonucci, S., Volpe, A.R., Carmignani, M., Di Gioacchino, M., 2009.Acute mercury intoxication and use of chelating agents. Journal of BiologicalRegulators & Homeostatic Agents 23, 217–223.
Brenner, S., 1974. The Genetics of Caenorhabditis elegans. Genetics 77, 71–94.Ceccatelli, S., Daré, E., Moors, M., 2010. Methylmercury-induced neurotoxicity and
apoptosis. Chemico-Biological Interactions 188, 301–308.Chang, L.W., 1977. Neurotoxic effects of mercury—a review. Environmental Research
14, 329–373.Choi, B.H., Yee, S., Robles, M., 1996. The effects of glutathione glycoside in methyl
mercury poisoning. Toxicology and Applied Pharmacology 141, 357–364.Clarkson, T.W., Magos, L., 2006. The toxicology of mercury and its chemical com-
pounds. Critical Reviews in Toxicology 36, 609–662.Dórea, J.G., Marques, R.C., Isejima, C., 2012. Neurodevelopment of Amazonian
infants: antenatal and postnatal exposure to methyl- and ethylmercury. Journalof Biomedicine and Biotechnology 2012, 132876.
Edwards, J.G., 1942. The renal tubule (nephron) as affected by mercury. AmericanJournal of Pathology 18, 1011–1027.
Eto, K., 1997. Pathology of Minamata disease. Toxicologic Pathology 25, 614–623.European Food Safety Authority, 2004. Opinion of the Scientific Panel on Con-
taminants in the Food Chain Related to Mercury and Methylmercury in Food.European Food Safety Authority, Brussels, EFSA-Q-2003-030.
Friedländer, M.R., Mackowiak, S.D., Li, N., Chen, W., Rajewsky, N., 2012. miRDeep2accurately identifies known and hundreds of novel microRNA genes in sevenanimal clades. Nucleic Acids Research 40, 37–52.

1 logy L
G
H
H
H
H
H
H
J
K
K
L
L
L
L
L
L
M
M
M
M
M
N
P
R
R
null mice exposed to low levels of mercury vapor during postnatal development.
96 M. Rudgalvyte et al. / Toxico
lover, C.N., Zheng, D., Jayashankar, S., Sales, G.D., Hogstrand, C., Lundebye, A.K.,2009. Methylmercury speciation influences brain gene expression and behaviorin gestationally-exposed mice pups. Toxicological Sciences 110, 389–400.
arada, Y., 1968. Minamata Disease: Study Group of Minamata Disease. InfantileMinamata Disease, Kumamoto University, Japan, pp. 73–92.
arada, Y., 1978. Congenital Minamata disease: intrauterine methylmercury poi-soning. Teratology 18, 285–288.
eikkinen, L., Kolehmainen, M., Wong, G., 2010. Prediction of microRNA tar-gets in Caenorhabditis elegans using a self-organizing map. Bioinformatics 27,1247–1254.
endriksen, P.J., Freidig, A.P., Jonker, D., Thissen, U., Bogaards, J.J., Mumtaz, M.M.,Groten, J.P., Stierum, R.H., 2007. Transcriptomics analysis of interactive effectsof benzene, trichloroethylene and methyl mercury within binary and ternarymixtures on the liver and kidney following subchronic exposure in the rat.Toxicology and Applied Pharmacology 225, 171–188.
etz, C., 2012. The unfolded protein response: controlling cell fate decisions underER stress and beyond. Nature Reviews Molecular Cell Biology 13, 89–102.
uang, D.W., Sherman, B.T., Lempicki, R.A., 2009. Systematic and integrative analysisof large gene lists using DAVID bioinformatics resources. Nature Photonics 4,44–57.
an, C.H., Friedman, R.C., Ruby, J.G., Bartel, D.P., 2011. Formation, regulation andevolution of Caenorhabditis elegans 3’UTRs. Nature 469, 97–101.
awata, K., Yokoo, H., Shimazaki, R., Okabe, S., 2007. Classification of heavy-metaltoxicity by human DNA microarray analysis. Environmental Science & Technol-ogy 41, 3769–3774.
uzuhara, T., Horikoshi, M., 2004. A nuclear FK506-binding protein is a histonechaperone regulating rDNA silencing. Nature Structural & Molecular Biology 11,275–283.
assmann, T., Hayashizaki, Y., Daub, C.O., 2009. TagDust—a program to eliminateartifacts from next generation sequencing data. Bioinformatics 25, 2839–2840.
angmead, B., Trapnell, C., Pop, M., Salzberg, S.L., 2009. Ultrafast and memory-efficient alignment of short DNA sequences to the human genome. GenomeBiology 10, R25.
ee, S., Seo, C.H., Lim, B., Yang, J.O., Oh, J., Kim, M., Lee, S., Lee, B., Kang, C., Lee, S.,2011. Accurate quantification of transcriptome from RNA-Seq data by effectivelength normalization. Nucleic Acids Research 39, e9.
imke, T.L., Heidemann, S.R., Atchison, W.D., 2004. Disruption of intraneuronal diva-lent cation regulation by methylmercury: are specific targets involved in alteredneuronal development and cytotoxicity in methylmercury poisoning? Neuro-toxicology 25, 741–760.
iu, J., Lei, D., Waalkes, M.P., Beliles, R.P., Morgan, D.L., 2003. Genomic analysis of therat lung following elemental mercury vapor exposure. Toxicological Sciences74, 174–181.
ivak, K., Schmittgen, T.D., 2001. Analysis of relative gene expression data usingreal-time quantitative PCR and the 2−��CT method. Methods 25, 402–408.
arciniak, S.J., Yun, C.Y., Oyadomari, S., Novoa, I., Zhang, Y., Jungreis, R., Nagata, K.,Harding, H.P., Ron, D., 2004. CHOP induces death by promoting protein synthesisand oxidation in the stressed endoplasmic reticulum. Genes and Development18, 3066–3077.
alhotra, J.D., Kaufman, R.J., 2007. The endoplasmic reticulum and the unfoldedprotein response. Seminars in Cell & Developmental Biology 18, 716–731.
iles, A.T., Hawksworth, G.M., Beattie, J.H., Rodilla, V., 2000. Induction, regulation,degradation, and biological significance of mammalian metallothioneins. Criti-cal Reviews in Biochemistry and Molecular Biology 35, 35–70.
iura, K., Imura, N., 1987. Mechanism of methylmercury cytotoxicity. CriticalReviews in Toxicology 18, 161–188.
ori, K., Nakao, K., 2007. Neutrophil gelatinase-associated lipocalin as the real-timeindicator of active kidney damage. Kidney International 71, 967–970.
ass, R., Hamza, I., 2007. The nematode C. elegans as an animal model to exploretoxicology in vivo: solid and axenic growth culture conditions and compoundexposure parameters. Current Protocols in Toxicology Chapter 1, Unit1.9.
eltonen, J., Aarnio, V., Heikkinen, L., Lakso, M., Wong, G., 2013. Chronic ethanolexposure increases cytochrome P-450 and decreases activated in blockedunfolded protein response gene family transcripts in Caenorhabditis elegans.Journal of Biochemical and Molecular Toxicology 27, 219–228.
odin, A.E., Crowson, C.N., 1962. Mercury nephrotoxicity in the rat. 1. Factors influ-
encing the localization of the tubular lesions. American Journal of Pathology 41,297–313.oos, D., Seeger, R., Puntel, R., Barbosa, N.V., 2012. Role of calcium and mitochon-dria in MeHg-mediated cytotoxicity. Journal of Biomedicine and Biotechnology,248764.
etters 222 (2013) 189– 196
Simmons, S.O., Fan, C.Y., Yeoman, K., Wakefield, J., Ramabhadran, R., 2011. NRF2oxidative stress induced by heavy metals is cell type dependent. Current Chem-ical Genomics 5, 1–12.
Shen, X., Ellis, R.E., Lee, K., Liu, C.Y., Yang, K., Solomon, A., Yoshida, H., Morimoto,R., Kurnit, D.M., Mori, K., Kaufman, R.J., 2001. Complementary signaling path-ways regulate the unfolded protein response and are required for C. elegansdevelopment. Cell 107, 893–903.
Srinivasan, J., Dillman, A.R., Macchietto, M.G., Heikkinen, L., Lakso, M., Fracchia,K.M., Antoshechkin, I., Mortazavi, A., Wong, G., Sternberg, P.W., 2013. The draftgenome and transcriptome of panagrellus redivivus are shaped by the harshdemands of a free-living lifestyle. Genetics 193, 1279–1295.
Stone, C.E., Hall, D.H., Sundaram, M.V., 2009. Lipocalin signaling controls unicellulartube development in the Caenorhabditis elegans excretory system. Developmen-tal Biology 329, 201–211.
Sun, J., Singh, V., Kajino-Sakamoto, R., Aballay, A., 2011. Neuronal GPCR controlsinnate immunity by regulating noncanonical unfolded protein response genes.Science 332, 729–732.
Takeuchi, T., 1968. Minamata disease: Study group of Minamata disease. Pathologyof Minamata Disease, Kumamoto University, Japan, pp. 141–228.
Tang, F., Barbacioru, C., Nordman, E., Li, B., Xu, N., Bashkirov, V.I., Lao, K., Surani, M.A.,2010. RNA-Seq analysis to capture the transcriptome landscape of a single cell.Nature Protocols 5, 516–535.
The Gene Ontology Consortium, Ashburner, M., Ball, C.A., Blake, J.A., Botstein, D.,Butler, H., Cherry, J.M., Davis, A.P., Dolinski, K., Dwight, S.S., Eppig, J.T., Harris,M.A., Hill, D.P., Issel-Tarver, L., Kasarskis, A., Lewis, S., Matese, J.C., Richardson,J.E., Ringwald, M., Rubin, G.M., Sherlock, G., 2000. Gene ontology: tool for theunification of biology. Nature Genetics 25, 25–29.
Trapnell, C., Pachter, L., Salzberg, S.L., 2009. TopHat: discovering splice junctionswith RNA-seq. Bioinformatics 25, 1105–1111.
Trapnell, C., Williams, B.A., Pertea, G., Mortazavi, A., Kwan, G., van Baren, M.J., Sal-berg, S.L., Wold, B.J., Pachter, L., 2010. Transcript assembly and quantificationby RNA-Seq reveals unannotated transcripts and isoform switching during celldifferentiation. Nature Biotechnology 28, 511–515.
Tsyusko, O.V., Unrine, J.M., Spurgeon, D., Blalock, E., Starnes, D., Tseng, M., Joice, G.,Bertsch, P.M., 2012. Toxicogenomic responses of the model organism Caenorhab-ditis elegans to gold nanoparticles. Environmental Science & Technology 46,4115–4124.
Ung, C.Y., Lam, S.H., Hlaing, M.M., Winata, C.L., Korzh, S., Mathavan, S., Gong, Z., 2010.Mercury-induced hepatotoxicity in zebrafish: in vivo mechanistic insights fromtranscriptome analysis, phenotype anchoring and targeted gene expression vali-dation. BMC Genomics 11, 212.
Urano, F., Calfon, M., Yoneda, T., Yun, C., Kiraly, M., Clark, S.G., Ron, D., 2002. A survivalpathway for Caenorhabditis elegans with a blocked unfolded protein response.Journal of Cell Biology 158, 639–646.
VanDuyn, N., Settivari, R., Wong, G., Nass, R., 2010. SKN-1/Nrf2 inhibits dopamineneuron degeneration in a Caenorhabditis elegans model of methylmercury tox-icity. Toxicological Sciences 118, 613–624.
van’t Hof, W., Blankenvoorde, M.F., Veerman, E.C., Amerongen, A.V., 1997. The sali-vary lipocalin von Ebner’s gland protein is a cysteine proteinase inhibitor. Journalof Biological Chemistry 272, 1837–1841.
Viswanathan, M., Kim, S.K., Berdichevsky, A., Guarente, L., 2005. A role for SIR-2.1 regulation of ER stress response genes in determining C. elegans life span.Developmental Cell 9, 605–615.
Valencia-Sanchez, M.A., Liu, J., Hannon, G.J., Parker, R., 2006. Control of translationand mRNA degradation by miRNAs and siRNAs. Genes and Development 20,515–524.
Wang, S., Kaufman, R.J., 2012. The impact of the unfolded protein response on humandisease. Journal of Cell Biology 197, 857–867.
WHO (World Health Organization) International Programme on ChemicalSafety, 1990. Environmental Health Criteria 101 Methylmercury. WHO,Geneva.
Yee, S., Choi, B.H., 1996. Oxidative stress in neurotoxic effects of methylmercurypoisoning. Neurotoxicology 17, 17–26.
Yoshida, M., Honda, M., Watanabe, C., Satoh, M., Yasutake, A., 2011. Neurobehavioralchanges and alteration of gene expression in the brains of metallothionein-I/II
Journal of Toxicological Sciences 36, 539–547.Yoshida, H., Matsui, T., Yamamoto, A., Okada, T., Mori, K., 2001. XBP1 mRNA is
induced by ATF6 and spliced by IRE1 in response to ER stress to produce a highlyactive transcription factor. Cell 107, 881–891.