methyl chloride emission from greenhouse-grown tropical ... · leaf vial experiments qualitatively...
TRANSCRIPT

Ya-Ting Chen Methyl Halide Emissions from Tropical Crops Spring 2011
1
Methyl chloride (CH3Cl) and methyl bromide (CH3Br) emissions from economically
important tropical crops
Ya-Ting Chen
ABSTRACT
Tropical rainforests have recently been confirmed to be the largest source of methyl chloride and a missing source for methyl bromide. However, very few field studies have quantified methyl halide emissions from tropical plants. This study presents the first methyl halide emission measurements from 16 tropical crop species at the University of California, Berkeley Botanical Gardens. Leaf vial experiments qualitatively identified 15 out of the 16 species as CH3Cl emitters and 7 species as CH3Br emitters. Coffea arabica was the highest emitter for both CH3Cl and CH3Br. In addition, bag enclosure experiments were conducted on living plants to quantitatively determine net emission fluxes from C. arabica as well as a previous studied species, Angiopteris lygodiifolia. There were strong correlations between CH3Cl and CH3Br emission from both C. arabica and A. lygodiifolia, suggesting that the methyl halide productions share similar biological mechanisms in these species. Temperature observations also showed that methyl halide emissions from C. arabica strongly depended on temperature. Using the mean net emission flux, global CH3Cl emission by C. arabica was estimated to be 0.11 Tg yr-1, representing approximately 7.5% of the total CH3Cl emissions from tropical forests. Overall, the findings suggested that tropical crops make an important contribution to global terrestrial emissions of CH3Cl, but less so for CH3Br.
KEYWORDS
methyl halides, tropical rainforests, net emission flux, stratospheric ozone, ozone-depleting compounds

Ya-Ting Chen Methyl Halide Emissions from Tropical Crops Spring 2011
2
INTRODUCTION
Methyl chloride (CH3Cl) and methyl bromide (CH3Br) are important to the chemistry of
both the troposphere and stratosphere. Having atmospheric lifetimes of 1.3-year and 0.7 years,
CH3Cl and CH3Br can transport their halogen atoms to the stratosphere and thereby destroy
ozone molecules (O3) via radical chain reactions (Rhew, Teh, & Abel, 2007). After the Montreal
Protocol restricted the production of anthropogenic ozone-depleting compounds in the 1990s, the
ambient concentrations of many halogenated compounds such as chlorofluorocarbons (CFCs)
have stabilized or declined (World Meteorological Organization, 2003). Therefore, because they
are the most abundant natural halogen-containing compounds in the atmosphere, CH3Cl and
CH3Br have been receiving increasing attention in determining the future of the ozone chemistry
(World Meteorological Organization, 2007; Blei, Hardacre, Mills, Heal, & Heal, 2010). Current
estimates show that CH3Cl and CH3Br contribute up to 25% of present-day ozone destruction by
halogens in the stratosphere, and it is predicted that natural CH3Cl and CH3Br will contribute to
more than 50% of the equivalent effective stratospheric chlorine by 2050 (WMO, 2007). Over
the last decade, there has been a notable decrease in atmospheric levels of CH3Br, but no clear
trend for CH3Cl (Clerbaux & Cunnold, 2007). However, because of the variety of natural
sources, large uncertainty still exists in the global budgets of CH3Cl and CH3Br.
The high level of uncertainty in measuring CH3Cl and CH3Br emissions leads to an
imbalance between the global sources and sinks of the methyl halides (Saito & Yokouchi, 2008).
The major natural sources of CH3Cl and CH3Br include oceans, biomass burning, salt marshes,
certain fungi and higher plants, and senescent or dead leaves (Saito & Yokouchi, 2008;
Gebhardt, Colomb, Hofmann, Williams, & Lelieveld, 2008; Rhew, Chen, Teh, & Baldocchi,
2010). Oxidation by hydroxyl radicals and soil consumption are the primary removal processes
for CH3Cl and CH3Br (Rhew, Miller, Bill, Goldstein, & Weiss, 2002; Gebhardt et al., 2008). But
the current estimate of total CH3Cl emissions from these natural sources accounts for only about
half of the estimated total sinks (Saito & Yokouchi, 2006), while 30% of the estimated sources
for CH3Br are also unidentified (Rhew et al., 2010). Yokouchi et al. (2000) recently discovered
tropical rainforests as the missing source for CH3Cl. Since then, several studies have measured
and confirmed high concentrations of atmospheric CH3Cl in tropical rainforests (Yokouchi et al.,
2000; Yokouchi, Ikeda, Inuzuka, & Yukawa, 2002; Yokouchi, Saito, Ishigaki, & Aramoto, 2007;

Ya-Ting Chen Methyl Halide Emissions from Tropical Crops Spring 2011
3
Saito, Yokouchi, Kosugi, Tani, Philip, & Okuda, 2008; Gebhardt et al., 2008; Blei et al., 2010).
Three-dimensional global models suggested that the large emissions from the tropics can explain
the gaps in the CH3Cl budget (Lee-Taylor, Brasseur, & Yokouchi, 2001; Yoshida, Wang, Zeng,
& Yantosca, 2004; Gebhardt et al., 2008). To balance the global CH3Cl budget, tropical
rainforests would have to emit 2.4-2.9 Tg y-1, which is about 60-70% of the total source
(Yokouchi et al., 2007). However, because of tropical rainforests’ large geographical
distribution and high biodiversity in plant species, this source’s global CH3Cl emissions remain
highly uncertain (WMO, 2007). The global models also showed that the CH3Br budget contains
tropical sources (Lee-Taylor et al., 2001; Yoshida et al., 2004). Although previous studies had
suggested that tropical rainforest does not contribute significantly to CH3Br emissions, the few
field measurements have not confirmed the magnitude of global CH3Br emissions from the
tropics (Gebhardt et al., 2008; Blei et al., 2010). Therefore, it is important to conduct more field
measurements in the tropical rainforest ecosystem in order to increase our understanding of the
atmospheric budgets of CH3Cl and CH3Br.
Both biogenic and abiotic mechanisms could explain the high emissions of CH3Cl from
tropical rainforests (Gebhardt et al., 2008). First, a common biotic mechanism takes place in
plant cells via enzymatic transfer of a methyl group from S-adenosyl-L-methionine (SAM) to
accepter chloride (Cl-) (Saito & Yokouchi, 2006). Since this methyltransferase activity is known
to depend on temperature, a positive correlation should exist between temperature and tropical
plants’ CH3Cl production (Heldt, 2004; Rhew, Østergaard, Saltzman, & Yanofsky, 2003; Saito
& Yokouchi, 2006). Second, plant degradation also releases CH3Cl through abiotic chloride
methylation by plant pectin, and this process accounts for the CH3Cl emissions from leaf litter
and during biomass burning (Hamilton, McRoberts, Keppler, Kalin, & Harper, 2003; Gebhardt et
al., 2008). Growing in the warmer climate and decomposing easily due to higher level of
moisture, tropical plants thus produce CH3Cl during both their lifespan and decay (Saito &
Yokouch, 2008). Previous studies have suggested that CH3Cl and CH3Br production share the
same biological mechanism (Hamilton et al., 2003). It is possible that many unidentified tropical
species are strong CH3Cl and CH3Br emitters. However, methyltransferase activity appears to be
highly species dependent, and very few studies have focused on tropical plants’ methyl halide
emissions to provide deeper understanding of the production mechanisms (Yokouchi et al., 2007;
Saito & Yokouchi, 2006; Blei et al., 2010).

Ya-Ting Chen Methyl Halide Emissions from Tropical Crops Spring 2011
4
Although it is crucial to accurately estimate the contribution of tropical rainforest to
global CH3Cl and CH3Br productions, field experiments in the past decade have only measured
emissions from approximately 400 tropical plant species in Southeast Asia region. I present
measurements of CH3Cl and CH3Br net fluxes from 16 major tropical crops that were measured
for their methyl halide emissions for the first time. All these tropical crops are widely cultivated.
I modified the vial method from Yokouchi et al. (2007) to conduct a survey of methyl halide-
emitting plants and applied bag enclosure experiments to evaluate their emission strength. My
objectives were to identify new emitters among these diverse greenhouse-grown tropical plants
at the University of California, Berkeley (UCB) Botanical Garden, as well as to develop effective
techniques to provide accurate measurements. By quantifying CH3Cl and CH3Br emissions from
abundant tropical plants, my study aimed to improve the estimate of global methyl halide
emissions from the tropical rainforest ecosystem.
My specific research questions are:
1) Are any of these 16 economically important tropical rainforest crops methyl
halide emitters?
2) Are vial and bag enclosure experiments effective in measuring methyl halide
emissions?
3) Does temperature affect CH3Cl and CH3Br emissions from tropical plants?
4) What are the contributions of the highest CH3Cl and CH3Br emitter of my study
to the global methyl halide emissions?
I hypothesize that:
1) The existence of methyl halide emitters among tropical crops is species-specific
because of the variation in the activity of enzyme methyltransferase across
species. Also, there should be a positive correlation between CH3Cl and CH3Br
emissions in the same species because they are likely to share the same enzymatic
production pathway.
2) The vial and bag enclosure experiments are effective in detecting methyl halide
emissions, but the estimates might have accuracy problems. Estimates may be
over- or under-calculated by several orders of magnitude because of the

Ya-Ting Chen Methyl Halide Emissions from Tropical Crops Spring 2011
5
differences in the sampling environment as well as the lack of replicates for each
species (I had 1 individual per species in my study).
3) Methyl halide emissions increase as the day becomes warmer because
methyltransferase is temperature dependent, generating a diurnal emission pattern
in which the highest emissions correspond to the hottest hours of the day.
4) If the highest emitter has significant emissions and is an abundant species, its
contribution to global emissions of CH3Cl would be large because of its wide
geographical distribution and large emission rate.
METHODS
Study system
My study subjects consisted of 16 economically important tropical crop species (Table 1)
in the Tropical Greenhouse at UCB Botanical Garden (37°52’29’’N, 122°14’19’’W). Globally,
14 of these species cover an area of about 66 million hectares, or 3.6% of the total tropical land
surface (FAO, 2008). Since these 16 species have never been measured for their methyl halide
emissions, my experiment was the first attempt to estimate their methyl halide emissions as well
as their contribution to the global methyl halide budgets. I chose to study tropical crop species
because their wide distributions directly depend on global anthropogenic food production,
making their methyl halide emissions susceptible to human activities. To verify the effectiveness
of my methods, I also examined species that were measured in previous studies: Osmunda
regalis var. spectabilis, Rhododendron brookeanum subsp. kinabaluense, Rhizophora mangle,
and Angiopteris lygodiifolia (Yokouchi et al., 2002; Yokouchi et al., 2007; Saito & Yokouchi,
2008), although these species are not crops.

Ya-Ting Chen Methyl Halide Emissions from Tropical Crops Spring 2011
6
Table 1. The economically important tropical crops in the UCB Botanical Garden evaluated in this study. Family Genus and Species Common Name
1 Arecaceae Cocos nucifera Coconut 2 Rubiaceae Coffea arabica Arabica coffee 3 Euphorbiaceae Acalypha hispida Philippines medusa / fox tail 4 Euphorbiaceae Hevea brasiliensis Rubber tree 5 Euphorbiaceae Manihot esculenta Yuca / tapioca pearls 6 Lauraceae Cinnamomum zeylanicum Cinnamon 7 Malvaceae Theobroma cacao Cocoa / chocolate 8 Piperaceae Piper nigrum Black pepper 9 Orchidaceae Vanilla planifolia cv. variegata Vanilla
10 Zingiberaceae Zingiber officinale Ginger 11 Myrtaceae Psidium guajava Guava 12 Rubiaceae Coffea liberica Kape Barako 13 Anacardiaceae Mangifera indica Mango 14 Bromelioideae Ananas comosus Pineapple 15 Sapotaceae Synsepalum dulcificum Miracle fruit 16 Araceae Colocasia esculenta Taro
Greenhouse screening of potential CH3Cl and CH3Br-emitting species
Data collection
To determine methyl halide emitters among the 16 tropical species, I used the improved
vial method adopted from Yokouchi et al. (2007). The vial experiments were conducted from 24
September and 5 November 2010 (Table 2). I harvested fresh, mature leaves from different parts
of the same plant for each species at the Tropical Greenhouse and brought the leaves back to the
UCB campus laboratory within two hours. Leaf harvest occurred between 9:00 and 13:00 on the
sampling dates. I carefully chose leaves that received about equal amounts of sunlight. For each
tropical species, I incubated 1-4 leaves in a 40 mL screw-cap glass vial sealed with an inert
Teflon sampling cap. After 15 minutes of incubation, I used a 10 mL glass syringe to collect 10
mL of headspace air sample from the vial. I repeated these steps 2 more times to obtain a total of
3 gas samples for each tropical species. The sampling and measurements for each species were
conducted on the same day. All tropical plants in the study were ground plants except T. cacao
and R. mangle which were grown in pots (R. mangle was in a separate nursery greenhouse). A

Ya-Ting Chen Methyl Halide Emissions from Tropical Crops Spring 2011
7
second sampling was done for C. liberica and R. brookeanum subsp. kinabaluense, and as a
result they each had a total of 6 samples.
Table 2. Air temperature and measured species for the 10 sampling dates in the vial experiment. ‘*’ indicates the second set of measurements for the species. Leaf harvest occurred between 9:00 and 13:00 on sampling dates. Dates (2010) Incubation location Air Temp (°C) Species measured in order of the day 24 Sept Outdoor 20-22° R. brookeanum subsp. kinabaluense 01 Oct Outdoor 20-22° V. planifolia
T. cacao 13 Oct Outdoor 25-32° Z. officinale
P. nigrum 15 Oct Outdoor 18-26° A. hispida
C. nucifera 20 Oct Outdoor 17-21° M. esculenta
C. zeylanicum H. brasiliensis
22 Oct In lab 21-25° P. guajava C. liberica
27 Oct Outdoor 17-18° M. indica 29 Oct In lab 22-28° S. dulcificum
C. esculenta A. comosus
03 Nov In lab 22-31° R. mangle C. liberica*
05 Nov In lab 23-27° O. regalis var. spectabilis A. lygodiifolia C. arabica R. brookeanum subsp. kinabaluense*
I incubated harvested leaves both inside the laboratory and under the natural sunlight
inconsistently (Table 2), and therefore temperature was not a well-controlled factor in the vial
experiments. I conducted 33 of the 75 leaf incubations inside the laboratory by placing the
leaves underneath a lamp to provide constant amount of sunlight for the harvested leaves. The
air temperature inside the laboratory was measured throughout the sampling day, and ranged
from 17-30° C over different incubation days. I subjected the other 42 incubations to natural
sunlight by placing them on the fifth floor balcony of the Department of Geography building.
The air temperature for outdoor incubations was taken from the Google Weather website and it
ranged from 17-32° Celsius. On all incubation days, the length of time between leaf harvest and
sample analysis ranged from 1.5-9 hr. For each species, the samples had similar biomass
weights, but the average weight of the leaf samples varied between species. When I incubated
the leaves inside the laboratory, I placed one control vial at least 60 cm away from the leaf
samples and used it to incubate the air inside the laboratory to determine the background methyl

Ya-Ting Chen Methyl Halide Emissions from Tropical Crops Spring 2011
8
halide concentrations for comparison. When I incubated outdoors, I also collected an ambient air
sample to determine the background methyl halide concentrations on the balcony.
Before the leaf incubations, I conducted blank tests to evaluate the reliability of the vial
method. When vials with ambient air were sealed and placed under natural light condition,
CH3Cl and CH3Br concentrations in the vials showed no significant change over 2.5 hours.
Therefore, the tests showed that the clean vials do not emit or uptake CH3Cl and CH3Br, and the
vials were leak-proof. When ambient air samples incubated inside the vials were injected into
the GC/MS at different gas volumes (5 mL, 10 mL, 15 mL, and 20 mL), the analysis also showed
a linear relationship between the methyl halide concentrations and the volume injected. This
demonstrated that the GC/MS should be able to measure gas concentrations from 10 mL of air
sample.
Bag enclosure method
Data collection
Based on the results from the greenhouse screening, I conducted bag enclosure
experiments on C. arabica to determine its methyl halide emission patterns because it was the
highest CH3Cl and CH3Br emitter among the 16 species. To ensure that my bag enclosure
method was capable of measuring CH3Cl emission, I also examined A. lygodifolia which is a
known CH3Cl emitter (Yokouchi et al., 2007). The measurements were performed from January
2011 to March 2011 at the Tropical House. I enclosed multiple branches of a plant with a self-
constructed 50 L-Teflon bag and extracted the air sample within with pre-evacuated stainless
steel gas canisters logarithmically at 30, 60 and 120 minutes following leaf enclosure. In order
to understand the effect of diurnal pattern on plants’ methyl halide emissions, I measured the
species during the morning (9:00-12:00) and the afternoon (12:00-15:00) to establish a daytime
emission pattern. Thus, I took air samples at around these 6 different times of a day: 10:30,
11:00, 12:00, 13:30, 14:00, and 15:00. 2 individuals of C. arabica were measured; 2 one-day
experiments (morning and afternoon measurements) were conducted on the first individual while
the 2 half-day experiments (morning or afternoon measurement) were conducted on the second
individual. 3 one-day experiments were conducted on 1 individual of A. lygodiifolia.

Ya-Ting Chen Methyl Halide Emissions from Tropical Crops Spring 2011
9
Throughout the experiments, air temperature and pressure were recorded using a barometer. I
also harvested the enclosed leaves and dried them over 2 days at 65 °C to obtain the dry leaf
weight.
Before sampling the plants, I conducted 3 leakage tests on the Teflon bag and found the
average leakage rate to be -3.061 parts per trillion (ppt) per minute, which is a relatively small
value. Therefore, the Teflon bag was reasonably leak-tight and should be effective in containing
gas emissions from tree leaves.
Correlations
To determine the correlation between CH3Cl and CH3Br emissions from the tropical
species, and the correlation between temperature and methyl halide emissions, I conducted
regression and correlation analysis on Microsoft Excel.
Air analysis
To determine whether CH3Cl or CH3Br were emitted, the vial air samples were measured
once by gas chromatography/mass spectrometry (Agilent 6890N/5973 GC/MS) with a custom
inlet system that measures low volume air samples. The air canister samples from the bag
enclosure experiments were measured twice by GC/MS. The gas samples were compared
against a natural air working standard (561 ppt CH3Cl and 9.4 ppt CH3Br on the SIO-2005
scale). Details of the cryotrapping and sample inlet system, chromatographic separation, mass
spectrometer settings, and calibration methods are described in Khan, Rhew, Whelan, Zhou, &
Deverel (2011).
Flux calculation
Net fluxes were calculated using the following equation:
( ) ( )(g) w
nmol/pmol1000min/day1440)dnmol(fluxNet 11 ×××=−− nmg (Eqn. 1)

Ya-Ting Chen Methyl Halide Emissions from Tropical Crops Spring 2011
10
where m (ppt/min) represents the slope of the linear least squares fit to the measured dry air mole
fractions versus time; n represents the number of moles of air in the chamber; and w (g)
represents the weights of dry leaf (M. A. H. Khan, pers. comm.., April 27, 2011). Net flux errors
were calculated by propagating the standard error on the slope with the uncertainties (volume,
temperature and pressure) associated with n.
Positive slopes represented net emission, while negative slopes represented net uptake.
Net uptake rates were converted to the first order uptake rates k (min-1) by plotting the natural
log of the concentration versus time and subsequently normalized by multiplying the rate
constants with seasonally averaged background concentrations in Northern Hemisphere air
between 1998-2001 (10.4 ppt for CH3Br and 535.7 ppt for CH3Cl [Simmonds et al., 2004]). This
normalized net uptake rate was substituted for m in Eqn. 1 to yield the normalized net uptake
flux. Unless otherwise specified, fluxes are reported in nanomoles per gram dry leaf weight per
day (nmol g-1 d-1). For clarity, this study reports net consumption rates as negative values, while
net production rates are reported as positive values.
Global Emission Extrapolation
Using data on global distribution of C. arabica (FAO, 2008), I extrapolated its estimated
global methyl halide emissions by simply multiplying C. arabica’s methyl halide net flux rate
(nmol g-1 h-1) with the weight of global biomass harvested (g). I calculated the weight of global
biomass harvested (GBH) using the following equation:
GBH = W × NL × NT × A, (Eqn. 2)
where W is the average weight of dry leaf measured from C. arabica’s leaf samples in my study
(≈ 0.1602 gram), NL is the average number of leaves on each mature C. arabica plant (I assumed
2,000 leaves per tree), NT is the average number of plants per square meter area (I assumed 1
tree per m2), and A is the global area of C. arabica harvested in 2008 (97.5 billion m2 [FAO,
2008]). After several unit conversions, I obtained the final global methyl halide emissions in the
unit of grams per year (g yr-1).

Ya-Ting Chen Methyl Halide Emissions from Tropical Crops Spring 2011
11
RESULTS
Greenhouse screening of potential CH3Cl and CH3Br-emitting species
CH3Cl emission
Using the vial method, I found that all the tropical crops except H. brasiliensis had
positive net CH3Cl emission flux (Table 3). Although H. brasiliensis showed an average uptake
of CH3Cl (-0.005 ± 0.013 nmol g-1 d-1), 1 of the 3 samples for this species emitted CH3Cl at a
rate of 0.0094 ± 0.006 nmol g-1 d-1. The highest emitter among the 16 tropical crops was C.
arabica with a mean emission rate of 17.999 ± 4.556 nmol g-1 d-1. The weakest emitter was C.
nucifera with a mean emission rate of 0.014 ± 0.008 nmol g-1 d-1. The mean CH3Cl emission rate
from all tropical crops was 1.754 ± 4.50 nmol g-1 d-1. Only 2 of the 3 species in the
Euphorbiaceae family (A. hispida and M. esculenta) were CH3Cl emitters. On the other hand,
the 2 species from the Rubiacea family, both in the Coffea genus (C. arabica and C. liberica),
were CH3Cl emitters. Species belonging to a family that is known to contain CH3Cl emitters
were all found to be CH3Cl emitters (Table 3). On the other hand, C. esculenta emitted CH3Cl
even though the Araceae family is known to contain only non-emitters.
CH3Br emission
Of the 16 species examined, 7 were found to emit CH3Br while the others were found to
consume CH3Br (Table 3). C. liberica showed neither uptake or emission of CH3Br in all of its 6
samples. The highest CH3Br emitter was C. arabica with a mean emission rate of 0.348 ± 0.115
nmol g-1 d-1. The weakest emitter was A. comosus with a mean emission rate of 0.001 ± 0.001
nmol g-1 d-1. The 3 species from the Euphorbiaceae family all consumed CH3Br at similar rates.
The mean CH3Br emission rate from all tropical crops was 0.029 ± 0.087 nmol g-1 d-1, which is
about 60 times smaller than the mean CH3Cl emission rate.
Table 3. Summary of net CH3Cl and CH3Br fluxes from 20 tropical plants in the Tropical House. Family Species CH3Cl (nmol g-1 dry wt d-1)
mean sd
CH3Br (nmol g-1 dry wt d-1) mean sd

Ya-Ting Chen Methyl Halide Emissions from Tropical Crops Spring 2011
12
Anacardiaceae Araceaeb Arecaceae Bromelioideae Ericaceaea Euphorbiaceaec Euphorbiaceaec Euphorbiaceaec Lauraceaea Malvaceae Marattiaceaea Myrtaceaea Orchidaceae Osmundaceaea Piperaceae Rhizophoraceaea Rubiaceaea Rubiaceaea Sapotaceae Zingiberaceaea
M. indica C. esculenta C. nucifera A. comosus R. a brookeanum subsp. kinabaluense (6) A. hispida H. brasiliensis M. esculenta C. zeylanicum T. cacao A. lygodiifoliaa P. guajava V. planifoia O. a regalis var. spectabilis P. nigrum R. manglec C. arabica C. liberica (6) S. dulcificum Z. officinale
0.033 0.260 0.014 0.125
4.950 0.027
-0.005 0.114 0.125 0.023 0.874 0.500 4.174
144.857 0.696 0.157
17.999 0.239 3.232 0.507
0.015 0.110 0.008 0.114
5.895 0.094 0.013 0.013 0.080 0.039 1.669 0.042 6.980
125.857 0.371 0.021 4.556 0.174 1.295 0.183
-0.001 0.001
-0.005 0.001
0.007
-0.006 -0.002 -0.002 0.004
<-0.0001 -0.001 0.019 0.059 0.343
<-0.0001 <-0.0001
0.348 0
0.060 -0.004
0.001 0.003 0.002 0.001
0.007 0.004 0.001
0.0002 0.005 0.001 0.005 0.004 0.100 0.209 0.002
0.0004 0.115
0 0.031 0.003
aThe family, genus, or species is known to contain methyl chloride emitters. bThe family, genus, or species is known to contain non-emitters. cThe family, genus, or species is known to contain both emitters and non-emitters. Bolded name shows that this particular species has been measured for methyl chloride emission before. 3 emission measurements were conducted for each species using the vial experiment, unless otherwise noted in the parenthesis.
CH3Cl emission from previously measured plants
The 4 previously measured genus and species were all found to emit CH3Cl at relatively
higher level than the 16 tropical crops (Table 3). Among all 20 tropical species, O. regalis var.
spectabilis was the highest CH3Cl emitter with a mean emission rate of 144.857 ± 125.857 nmol
g-1 d-1. R. brookeanum subsp. kinabaluense ranked right below C. arabica as the third highest
emitter, with a mean emission rate of 4.950 ± 5.895 nmol g-1 d-1. Both A. lygodiifolia and R.
mangle emitted CH3Cl at similar rates as the 16 tropical crops (0.874 ± 1.669 nmol g-1 d-1 and
0.157 ± 0.021 nmol g-1 d-1 respectively). The average emission rate from O. regalis var.
spectabilis, R. brookeanum subsp. kinabaluense, A. lygodiifolia and R. mangle was about 37.71 ±
71.46 nmol g-1 d-1, which is about 22 times higher than the average CH3Cl emission rate of all 16
tropical crops.

Ya-Ting Chen Methyl Halide Emissions from Tropical Crops Spring 2011
13
Variability in the vial experiment
I observed considerable variability in emission rates obtained by the vial experiment
(Figure 1). Fluxes varied widely between and within the species, with the CH3Cl emission rates
ranging from 0.04 to 12.23 nmol g-1 d-1 (by V. planifolia). When I repeated the sampling for a
few species on two different days (R. brookeanum subsp. kinabaluenes and C. liberica), I also
found that newer samples had distinctively different emission rates than the previous samples,
such as a difference of 168 times in the CH3Cl emission rate for R. brookeanum subsp.
kinabaluense (Table 4). C. liberica had the same CH3Br emission rate for all of its samples (0
nmol g-1 d-1).
Figure 1. Results of the vial experiment, showing the minimal, maximal, and mean net emission fluxes of CH3Cl (a) and CH3Br (b) from 20 tropical plants in the Tropical House at UCB Botanical Garden. Blue squares represent average net flux measurements. Right arrows represent the maximum net flux rate and left arrows represent the minimum. The vertical grey lines at x = 10-3 in plot ‘a’ and at x = 10-4 in plot ‘b’ represent the lowest positive net flux measurement for the methyl halide emissions. (*) to the left of the vertical grey line indicates that the species has negative or zero net flux rates for any of the minimum, mean, and maximum net flux rate, but no actual value is assigned to these negative net flux rates on the plots. Horizontal line is drawn to connect the symbols when the minimum, average, and maximum net flux rates are all positive. A species with only negative or zero net flux measurements has no symbols except the (*) to the left of the grey line. Species surrounded by the thin bracket belong to the same genus, and species surrounded by the thicker bracket belong to the same family but not genus. Note that the species are arranged by their family names in alphabetical order. Also note that C. liberica and R. brookeanum subsp. kinabaluense had 6 measurements while all other species had 3 measurements.

Ya-Ting Chen Methyl Halide Emissions from Tropical Crops Spring 2011
14
Table 4. Emission rates for repeated vial experiments.
Species Name Sampling date (2010) Net CH3Cl flux (nmol g-1 d-1)
Net CH3Br net flux (nmol g-1 d-1)
R. subsp. kinabaluense 24 Sept 0.0586 ± 0.0335 0.0003 ± 0.0005
05 Nov
9.8411 ± 3.8846
0.0128 ± 0.0015
C. liberica 22 Oct 0.3438 ± 0.1829 0 ± 0 03 Nov 0.1335 ± 0.0928 0 ± 0
Bag enclosure experiment
I chose to conduct bag enclosure experiment on C. arabica and A. lygodiifolia. C.
arabica’s CH3Cl and CH3Br emissions both increased over the time of day (Figures 2a, 2b).
There were positive net CH3Cl flux and positive net CH3Br flux during each bag enclosure for C.
arabica, and the net fluxes from the second bag enclosure of the day was always higher than
those of the first. For two sampling dates, only one bag enclosure was conducted and there were
positive net CH3Cl flux and positive net CH3Br flux for each measurement. However, the
afternoon emission rate on March 2 was relatively smaller than all other measurements. On
average, C. arabica’s net CH3Br flux was about 20 times smaller than its net CH3Cl flux. The
highest CH3Cl flux rate measured was 26.577 ± 0.204 nmol g-1 d-1, and the corresponding CH3Br
flux rate, 0.282 ± 0.005 nmol g-1 d-1, was also the highest for CH3Br emission. The higher
emission rate always occurred during the second bag enclosure of the day, which took place
between 12:00 and 14:00 when the air temperature peaked. There were strong and statistically
significant correlations between temperature and the net methyl halide fluxes from C. arabica,
with a R2 value of 0.896 (p = 0.0004) for CH3Cl emission and a R2 value of 0.917 (p = 0.0002)
for CH3Br emission (Figure 3).

Ya-Ting Chen Methyl Halide Emissions from Tropical Crops Spring 2011
15
Figure 2. Results of the bag enclosure experiment, showing emission rates of CH3Cl and CH3Br from C. arabica (a and b) and A. lygodiifolia (c and d) over the time of day in the Tropical House at UCB Botanical Garden. Methyl halide flux measurements were conducted over 4 sampling dates for C. arabica and 3 sampling dates for A. lygodiifolia. In plots ‘a’ and ‘b’, hexagon represents February 4, circles represent February 8, triangles represent February 11, and diamond represents March 2, 2011. In plots ‘c’ and ‘d’, pentagram represents January 25, squares represent January 29, and asterisks represent February 25. The horizontal grey line in plot ‘d’ indicates zero CH3Br net flux. Morning and afternoon measurements were conducted consecutively in all sampling dates except for February 4 and March 2, in which only the morning or afternoon measurement was conducted. The morning measurements took place between 9:00 and 12:00 while the afternoon measurements were conducted between 12:00 and 14:00. Standard deviations are indicated by the lines above and below the symbols.
Figure 3. Correlations between temperature and methyl halide emissions from C. arabica. The correlation calculation included all bag enclosure measurements (n = 6) for C. arabica. (a) shows CH3Cl emissions; (b) shows CH3Br emissions.
Ya-Ting Chen Methyl Halide Emissions from Tropical Crops Spring 2011
16
Emission rates from A. lygodiifolia did not show a consistent pattern over the time of day
(Figure 2c, 2d). On 2 of the 3 sampling dates (January 25 and February 25, 2011), the
afternoon’s emission rate was lower than the morning’s. On the first sampling date (January 25),
the second bag enclosure measured a CH3Cl emission rate of 3.423 ± 0.015 nmol g-1 d-1, which is
less than half of the emission rate from the first bag enclosure of the day (9.477 ± 0.057 nmol g-1
d-1). On the third sampling date (February 25), the second bag enclosure’s flux rate (11.069 ±
0.026 nmol g-1 d-1) was only slightly lower than that of the first (11.494 ± 0.029 nmol g-1 d-1),
which was also the highest emission rate measured for A. lygodiifolia. The measurements from
the second sampling date (January 29) showed a vivid increase in the emission rate over the time
of day, going from 5.784 ± 0.021 nmol g-1 d-1 in the morning to 7.830 ± 0.041 nmol g-1 d-1 in the
afternoon. There were negative slopes for the linear regressions between temperature and the
emission rates of methyl halides from A. lygodiifolia.
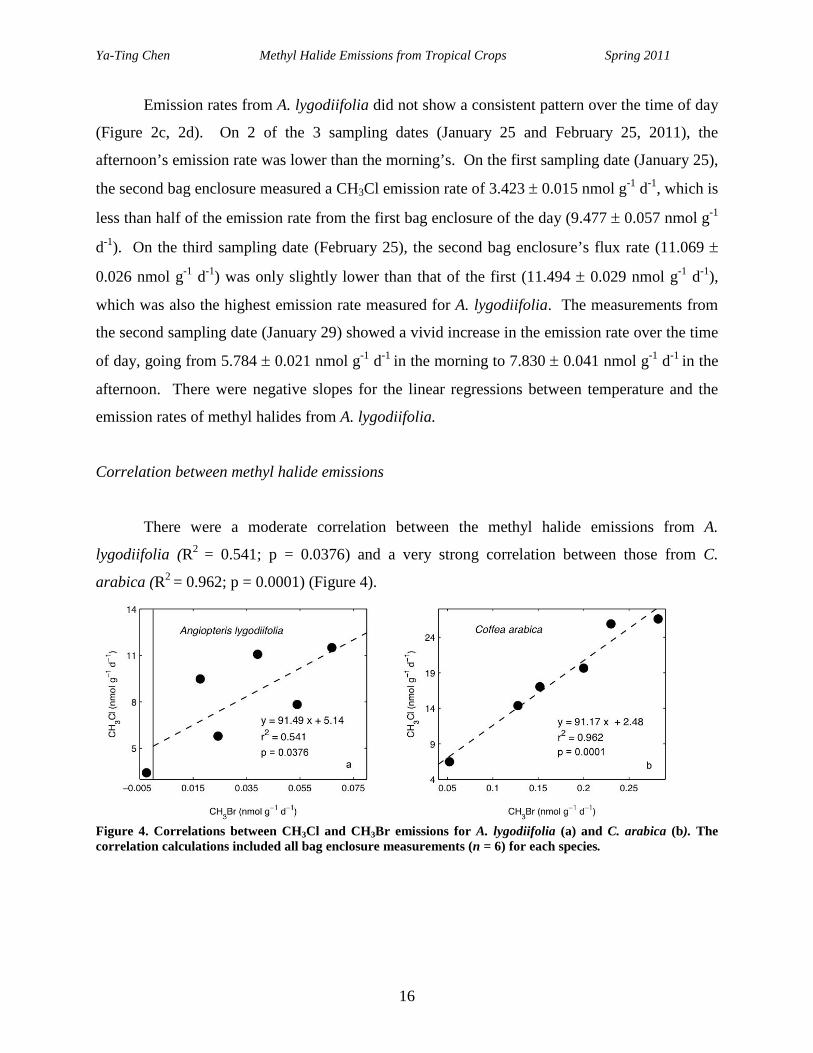
Correlation between methyl halide emissions
There were a moderate correlation between the methyl halide emissions from A.
lygodiifolia (R2 = 0.541; p = 0.0376) and a very strong correlation between those from C.
arabica (R2 = 0.962; p = 0.0001) (Figure 4).
Figure 4. Correlations between CH3Cl and CH3Br emissions for A. lygodiifolia (a) and C. arabica (b). The correlation calculations included all bag enclosure measurements (n = 6) for each species.
Ya-Ting Chen Methyl Halide Emissions from Tropical Crops Spring 2011
17
Global emission extrapolation
Based on the C. arabica’s emission results from my study (mean CH3Cl emission rate:
0.0385 ± 0.0158 µg g-1 hr-1; mean CH3Br emission rate: 0.688 ± 0.321 ng g-1 hr-1), I estimated
that that global C. arabica plantations emit about 0.01 ± 0.004 Tg CH3Cl and 0.19 ± 0.09 Tg
CH3Br annually.
DISCUSSION
The magnitude of known atmospheric methyl halide sinks is much greater than known
methyl halide sources (Cox et al., 2005). Therefore, in order to balance the global methyl halide
budget, identifying the remaining unknown methyl halide sources has been a crucial ongoing
task. By improving the quantification of global emission rates of ozone-depleting gases, we also
gain insight into the ozone depletion cycle. My study aimed to assess the effectiveness of two
emission measurement techniques, the vial and the bag enclosure experiments, as well as to
provide methyl halide emission data from tropical species, which have recently been discovered
to be the largest biogenic source of CH3Cl (Yokouchi et al., 2000; Yokouchi et al., 2007;
Gebhardt et al., 2008). Although tropical rainforests are not a significant source for CH3Br,
studying CH3Br emission from these tropical species shows positive correlation between CH3Cl
and CH3Br emission, which suggests that CH3Cl and CH3Br synthesis share similar biotic
mechanisms in certain tropical plants (Saito & Yokouchi, 2006). Furthermore, in the tropical
regions, tropical crops’ distribution and growth are tightly bound to human activities. Therefore,
investigating CH3Cl emission by tropical crops provides a better assessment of the human impact
on ozone depletion.
Identification of CH3Cl and CH3Br emitting plants in the Tropical Greenhouse
CH3Cl emission
This study represents the first screening of 16 economically important tropical crop
species for their methyl halide emissions. All tropical crops except H. brasiliensis emitted

Ya-Ting Chen Methyl Halide Emissions from Tropical Crops Spring 2011
18
CH3Cl in the vial experiment. By converting the unit of my emission results to µg g-1 h-1. I
obtained an average of 0.004 µg g-1 h-1 for all 16 tropical crops, which was about 10 times
smaller than the average emission rate in the previous greenhouse and field measurements in the
tropics (Yokouchi et al., 2002; Yokouchi et al., 2007; Saito & Yokouchi, 2006; Saito et al., 2008;
Blei et al., 2010). Assuming the vial experiment effectively measured the emission rate, the
difference between my measurements and previous studies could be caused by the difference in
study location. In contrast to all the previous greenhouse and field studies conducted in the
tropical region, UCB Botanical Garden resides in a higher latitude with cooler climate
(37°52’29’’N, 122°14’19’’W). Thus, the colder climate might have contributed to lower
emission rates from the tropical plants because of the temperature dependency in plant’s methyl
halide productions (Hamilton et al., 2003). The difference in the vial incubation time might have
also been a factor (15 minutes in my study versus 4-8 days in Yokouchi et al. [2007]). In the
experiment conducted by Yokouchi et al. (2007), CH3Cl concentration in the vials showed linear
increase for a few days under constant natural light condition. Thus, my average emission rate
could have been higher if I had incubated the leaves longer. However, it was not plausible to
incubate the leaves for more than a day because my study aimed to measure emission from
freshly harvested leaves, which should release the same amount of CH3Cl as intact, live plants.
Older or dead leaves might release CH3Cl at a lower rate because of physical stress and decay
(Blei et al., 2010).
Viability of the vial experiment
On the other hand, the vial experiment might have provided inaccurate emission
estimates because it was susceptible to a wide range of factors. Temperature, sunlight exposure,
and the time between leave harvest and emission analysis were not controlled consistently.
CH3Cl net flux emission varied widely from 1 to 3 orders of magnitude within many species. V.
planifolia had the widest range in its CH3Cl net flux emission (0.04 to 12.23 nmol g-1 d-1). R.
brookeanum subsp. kinabaluense also had an 168 times higher CH3Cl emission rate on the
second sampling date than the results on the first sampling date. Such large variability in
emission rates suggested that the vial experiment did not provide consistent or accurate
measurements. Although the observation of variable emission rates within the same species

Ya-Ting Chen Methyl Halide Emissions from Tropical Crops Spring 2011
19
corresponded to the previous field measurements in Malaysia tropical forests (Saito et al., 2008;
Blei et al., 2010), the results still demonstrated the challenge in controlling all factors to make
the vial experiment a viable method.
CH3Br emission
In contrast to CH3Cl emission, not all tropical crops emitted CH3Br. The average of net
flux emission was 0.06 ng g-1 h-1, and 8 out of the 16 species showed uptake of CH3Br at very
low rates. The weakest CH3Br emitting species identified in the previous study had a net flux of
0.1 ng g-1 h-1, which is slightly higher than the average net flux in my study (Blei et al., 2010).
Blei et al. (2010), the first group to conduct flux measurements of CH3Br in situ in tropical
rainforest, observed an average rate of 0.4 ng g-1 h-1 for CH3Br emission from 18 different
species in lowland Malaysian tropical rainforest. Saito & Yokouchi (2006) was the only other
group to measure CH3Br emission rates from tropical plants, and they observed much higher
CH3Br emission rates from Cyathea podophylla (20 ng g-1 h-1) and Cyathea lepifera (16 ng g-1 h-
1). Thus, similar to my CH3Cl emission results, my average CH3Br emission rate was about 7
times smaller than other studies.
Choosing species for bag enclosure experiment
Most of the previous studies arbitrarily considered any CH3Cl emission rate above 0.01
µg g-1 h-1 to be significant emission (Yokouchi et al., 2007; Saito & Yokouchi, 2008; Saito et al.,
2008). Therefore, using the same emission threshold, I found that C. arabica was the only
significant CH3Cl emitter with a emission rate of 0.04 µg g-1 h-1. In addition, C. arabica was
also the highest emitter for CH3Br. Such correlation suggested that CH3Cl and CH3Br synthesis
might share similar biological pathways in C. arabica (Saito & Yokouchi, 2006). I chose to
conduct bag enclosure experiment on C. arabica because it was the highest emitter for both
methyl halides and therefore it was easier to observe any change in the atmospheric
concentrations of methyl halides in the 50 L Teflon bag. Furthermore, nearly 75-80% of the
world’s coffee comes from C. arabica (Griffin, 2006). If C. arabica is determined to be a very

Ya-Ting Chen Methyl Halide Emissions from Tropical Crops Spring 2011
20
strong methyl halide emitter, C. arabica would have significant influence on the methyl halide
budgets because of its wide distribution and economic importance.
CH3Cl emission from previously measured plants
The positive emission results from O. regalis var. spectabilis, R. brookeanum subsp.
kinabaluense, and A. lygodifolia also agreed with previous field studies (Yokouchi et al., 2007;
Blei at al., 2010). Osmundaceae, Ericaceae, and Marattiaceae families are known to contain
strong CH3Cl-emitters (Table 2). Both O. regalis var. spectabilis and R. brookeanum subsp.
kinabaluense were shown in this study for the first time to be CH3Cl-emitting plants. A.
lygodiifolia (Marattiaceae) has been measured several times to be a significant emitter (e.g.,
emission rate greater than 0.01 µg g-1 h-1; Yokouchi et al., 2007; Yokouchi et al., 2006; Blei et
al., 2010). A. lygodiifolia was the 8th highest emitter in this study (mean net emission flux: 0.875
± 1.669 nmol g-1 d-1), and its emission rate was 111.46 times lower than the results from previous
studies. O. regalis var. spectabilis and R. brookeanum subsp. kinabaluense also had lower
emission rates than the other species in the same genus (10 times and 3.7 times lower
respectively) (Yokouchi et al., 2007). Although these 3 species had lower emission rates than
their counterparts in the other studies, the presence of CH3Cl emissions suggested that my vial
experiment was effective as a screening method for emitters, but not effective to accurately
assess the magnitude of emissions.
On the other hand, R. mangle (Rhizophoraceae) has also been measured several times for
CH3Cl emission, but two previous studies gave opposite results. Yokouchi et al. (2007) found R.
mangle to be a non-emitter using the vial measurement, while Manley, Wang, Walser, &
Cicerone (2007) observed R. mangle as a weak emitter for both CH3Cl and CH3Br using the
chamber incubation method. In my study, R. mangle was the 12th highest CH3Cl emitter among
the 20 tropical species. The CH3Cl emission from R. mangle was inconsistent with the
observations by Yokouchi et al. (2007) but similar to that of Manley et al. (2007). Comparing
my testing environment to that of the two studies, I found that Yokouchi et al. (2007) measured a
ground plant in the rainforest while both Manley et al. (2007) and I conducted measurements on
R. mangle that grew in artificial environments, such as in a pot and in water-sealed chamber.

Ya-Ting Chen Methyl Halide Emissions from Tropical Crops Spring 2011
21
Thus, assuming my vial experiment is effective, the emission result from R. mangle suggested
that a plant’s growing environment could potentially affect its methyl halide emissions.
Family, genus, and species-dependency of CH3Cl emission from tropical plants
My study showed that the two species from the Euphorbiaceae family, A. hispida and M.
esculenta, were both weak CH3Cl-emitters (mean emission rates were 0.06 ± 0.19 ng g-1 h-1 and
0.24 ± 0.03 ng g-1 h-1 respectively), while the other species in the same family, H. brasiliensis,
showed weak uptake of CH3Cl. This agreed with previous studies that found the Euphorbiaceae
family contains both CH3Cl emitters and non-emitters. Since species belonged to a family that is
known to contain CH3Cl emitters were all found to emit CH3Cl, the results suggested that CH3Cl
emission could be family-dependent for many species. At the same time, Yokouchi et al. (2007)
also proposed that CH3Cl emission was a common character at genus level. The high emission
from O. regalis var. spectabilis and R. brookeanum subsp. kinabuluense supported that species
in the same genus share similar CH3Cl emission character, particularly in genus Osmunda and
Rhododendron. However, I found that two species within the same genus, C. arabica and C.
liberica, had distinctively different emission rates (mean emission rates were 37.86 ± 9.58 ng g-1
h-1 and 0.50 ± 0.37 ng g-1 h-1 respectively). Thus, my results also suggested that species in the
same genus do not necessarily have similar CH3Cl emission pattern, and this agreed with
previous studies that found CH3Cl emission in the tropics to be highly species dependent (Blei et
al., 2010; Saito et al., 2008).
Bag enclosure experiment
I found a trend of increasing methyl halide emissions in both A. lygodiifolia and C.
arabica throughout the 5-hr measurement period. On two sampling dates for C. arabica, only
one bag enclosure measurement was conducted and therefore these results merely demonstrated
that C. arabica is a consistent methyl halide emitter in both the morning and the afternoon. The
relatively small emission rate in the afternoon of March 2 could be explained by the lowest
temperature (18.3 °C) that was recorded for C. arabica sampling (see the lowest point in Figure
3a). The strong, positive correlations between the temperature and methyl halide net flux

Ya-Ting Chen Methyl Halide Emissions from Tropical Crops Spring 2011
22
emissions from C. arabica provided evidence for the temperature dependency of the
methyltransferase activity (Hamilton et al., 2003; Saito & Yokouchi, 2006; Saini et al., 1995).
Although the greenhouse was meant to maintain a constant temperature throughout the day, the
sunlight exposure still increased the temperature inside the Teflon bag. Therefore, the increase
of 1-2° C in the air temperature during the enclosure period could have enhanced the
methyltransferase activity within the plant leaves.
I chose to conduct bag enclosure experiment on A. lygodiifolia because this species has
previously been measured 3 times in different seasons (Yokouchi et al., 2002; Yokouchi et al.,
2007; Saito & Yokouchi, 2008). In my study, I found that methyl halide emissions from A.
lygodiifolia decreased from morning to afternoon in 2 of the 3 sampling dates (January 25 and
February 25, 2011). Bad sampling flasks for sampling in the afternoon of January 25 might have
contributed to this unexpected reduction in methyl halide emissions. The two flux rate
measurements obtained on February 25 were almost the same (0.024 µg g-1 h-1 and 0.023 µg g-1
h-1) and therefore did not suggest significant decline in emission. However, there were negative
slopes for the linear regression between the temperature and methyl halide emissions for A.
lygodiifolia, suggesting that A. lygodiifolia’s methyl halide emissions are not temperature
dependent. In addition, the emission rates obtained from the bag experiment were about 10.7
times smaller than the results from previous studies (Yokouchi et al., 2002; Saito & Yokouchi,
2008). Comparing the results of the vial and the bag enclosure experiments suggested that the
bag enclosure method is much more accurate in quantitatively measuring CH3Cl emissions.
For both A. lygodiifolia and C. arabica, there were moderate and strong correlations
between CH3Cl and CH3Br emission (R2 = 0.54 and p = 0.0376; R2 = 0.96 and p = 0.0001
respectively). The low p-values indicated that these correlations are statistically significant,
especially for C. arabica. These correlations suggested that CH3Cl and CH3Br productions share
similar biological mechanism (Saito & Yokouchi, 2006).
Global extrapolation of methyl halide emissions
The annual global CH3Cl emission from C. arabica was extrapolated to be 0.01 ± 0.004
Tg CH3Cl. However, using the bag enclosure experiments, I found that A. lygodiifolia’s CH3Cl
emission rates were roughly 10.7 times smaller than previous measurements (Yokouchi et al.,

Ya-Ting Chen Methyl Halide Emissions from Tropical Crops Spring 2011
23
2002; Saito & Yokouchi, 2008). If I assumed that my bag enclosure experiment is effective in
measuring CH3Cl emissions but could only detect emission rates that are 10.7 times smaller than
the actual estimates, then it is plausible that C. arabica’s emission rates in my study were also
underestimated by 10.7 times. Therefore, I multiplied the extrapolated number with 10.7 to
obtain 0.11 ± 0.05 Tg CH3Cl as the resulting annual CH3Cl emission from C. arabica. This
corresponds to approximately 7.5% of the total tropical rainforest emissions (about 1.5 Tg;
[Gebhardt et al., 2008]) and 2.6% of the total source (about 4.4 Tg; [WMO, 2007]), suggesting
that C. arabica is non-negligible source of atmospheric CH3Cl . However, this is still possibly
an underestimate because the global area harvested (part of the global extrapolation calculation)
excludes the area from which, although sown or planted, there was no harvest due to damage or
failure. Also, I assumed that there are only 2,000 leaves per square meter, but the real C. arabica
planations might have much higher density. In addition, I measured a young C. arabica plant (3-
year-old) in my study while the average economic age of C. arabica plants in the fields is 30-40
years old (Duke, 1996). The older trees might emit more CH3Cl because of their well-
established metabolism. Therefore, C. arabica’s global CH3Cl emissions could be higher than
estimated.
I also estimated that global C. arabica plantations emit roughly 0.19 ± 0.09 Tg CH3Br
annually. However, since none of the species in my study have been measured for their CH3Br
emissions before, it is not certain whether the C. arabica’s CH3Br emission rates were an
overestimate or an underestimate. Three-dimensional models have proposed that tropical
vegetations are the additional source of CH3Br and emit approximately 45.6 Gg yr-1 (Warwick,
Pyle, & Shallcross, 2006; Gebhardt et al., 2008), but this estimate contains large uncertainty
because of limited CH3Br emission measurements in the tropics. Nevertheless, if this estimate
were accurate, C. arabica’s annual CH3Br emission represents approximately 0.41% of the total
CH3Br emission from the tropical forests, suggesting that C. arabica is not a significant source
of atmospheric CH3Br.
Broader implications
In sharp contrast to the bag enclosure method, the vial experiment could only provide
qualitative measurements with much lower precision and high variability. The inconsistency in

Ya-Ting Chen Methyl Halide Emissions from Tropical Crops Spring 2011
24
the vial measurements strongly suggested that using the vial experiment emission rates to
extrapolate global CH3Cl emission is susceptible to a large amount of errors. Hence, researchers
should avoid using results from the vial experiment to provide global estimates, and should
instead use the vial method to screen potential emitters.
Since these tropical crops are widely distributed and cultivated, their CH3Cl emissions
are significant to the global CH3Cl production. Therefore, along with the naturally grown
tropical rainforest species, tropical crops should also be taken into account in future estimates of
global CH3Cl emission. Because of tropical crops’ economic importance, we should also be
aware that the global CH3Cl production is highly susceptible to human activities. Furthermore, if
many tropical crops are potentially significant CH3Cl emitters like C. arabica, the environmental
cost of these tropical crops would be re-defined to not only include deforestation, but also ozone
depletion.
Limitations
Although my research sought to improve the experimental method in Yokouchi et al.
(2007) by taking CH3Cl measurement on freshly harvested leaves instead of old harvested
leaves, both of the greenhouse screening and bag enclosure experiments had many uncontrolled
factors that interfered with accurate measurements of CH3Cl emission. Variable factors
including temperature, sunlight exposure, time after harvesting, water content of the leaves
(Hamilton et al., 2003), and limited number of trees for experimenting all prevented me from
obtaining consistent measurements or determining the most influential factors in affecting CH3Cl
emission. Although the bag enclosure experiment suggested that CH3Cl emission was dependent
on temperature, the exposure to solar radiation could also be a significant factor. Nevertheless,
the bag enclosure experiment was still successful in capturing a clear diurnal emission pattern
from the plants.
Future research
To continue this pioneering research on tropical plants’ emission of methyl chloride, this
experiment should be replicated on more than one individual plant specimen. To further

Ya-Ting Chen Methyl Halide Emissions from Tropical Crops Spring 2011
25
investigate methyl halide production from C. arabica, researchers could grow coffee trees inside
the laboratory in order to control extraneous variables. Researchers could manipulate soil
moisture, nutrients levels, water content, halide ion concentrations, and air temperature to
determine methyl halide production’s dependency on different factors. To determine if C.
arabica in other environments also emits methyl halides, it would be necessary to measure
naturally grown trees in the tropics and especially in the crop fields. Furthermore, there are
many more tropical crops in the world and most of them could also be potential emitters.
Identification of more tropical crops for CH3Cl emission would not only improve the estimation
of global CH3Cl production, but also allow us to understand the extent of anthropogenic impact
on CH3Cl emission.
ACKNOWLEDGEMENTS
I thank Professor Robert Rhew for providing me essential guidance for this project as
well as access to the equipment and resources in his lab; Anwar Khan for helping me with data
analysis and sampling; Mary Whelan for helping with the construction of the Teflon bag;
Kimberly Barnash, Michael Song, Kevin Zhou, Julien Vollering, Clayton Ernst, Robin Kim, and
Paz Lozano for field and sample analysis assistance; Holly Forbes for access to the Tropical
House at UCB Botanical Garden; Christy Matasick for identifying plant species at the
greenhouse; and Patina Mendez, Lara Roman, Nagi Susuki, and Stephanie Panlasigui for
assisting with the development of my senior thesis and providing me with helpful feedback.
REFERENCES
Blei, E., Hardacre C., Mills, G., Heal, K., & Heal, M. (2010). Identification and quantification of methyl halide sources in a lowland tropical rainforest. Atmospheric Environment, 44, 1005-1010.
Clerbaux, C. & Cunnold, D. M. (2007). Long-lived compounds. In: Ajavon, A.-L.n., et al. (Eds.), Scientific Assessment of Ozone Depletion: 2006. World Meteorological Organization, Geneva.
Cox, M. L., Sturrock, G. A., Fraser, P. J., Siems, S. T., & Krummel, P. B. (2005). Identification of regional sources of methyl halides from AGAGE observations at Cape Grim, Tasmania, J. Atmospheric Chemistry, 50, 59–77.

Ya-Ting Chen Methyl Halide Emissions from Tropical Crops Spring 2011
26
Duke, J. A. (1996). Handbook of Energy Crops. Retrieved from http://www.hort.purdue.edu/newcrop/duke_energy/coffea_arabica.html
FAO. (2008). Food and Agriculture Organization. Statistical database. Retrieved from http://faostat.fao.org/site/567/default.aspx#ancor
Gebhardt, S., Colomb, A., Hofmann, R., Williams, J., & Lelieveld, J. (2008). Halogenated organic species over the tropical South American rainforest. Atmospheric Chemistry and Physics, 8, 3185-3197.
Griffin, Michael. (2006). Arabica and Robusta Coffee Plant. Retrieved from http://www.coffeeresearch.org/agriculture/coffeeplant.htm
Hamilton, J. T. G., McRoberts, W.C., Keppler, F., Kalin, R. M., & Harper, D. B. (2003). Chloride methylation by plant pectin: An efficient environmentally significant process. Science, 301, 206-209.
Heldt, H. W. (2004). Plant Biochemistry. San Diego: Academic Press.
Khan, M. A. H., Rhew, R. C., Whelan, M. E., Zhou, K., & Deverel, S. J. (2011). Methyl halide and chloroform emissions from a subsiding Sacramento-San Joaquin Delta island converted to rice fields. Atmospheric Environment, 45, 977-985.
Manley, S. L., Wang, N., Walser, L. M., & Cicerone, R. J. (2007). Methyl halide emissions from greenhouse-grown mangroves. Geophysical Research Letters, 34, L01806.
Lee-Taylor, J. M., Brasseur, G. P., & Yokouchi, Y. (2001). A preliminary three-dimensional global model study of atmospheric methyl chloride distributions. Journal of Geophysical Research, 106 (D24), 34,221-34,233.
Rhew, R., & Abel, T. (2007). Measuring simultaneous production and consumption fluxes of methyl chloride and methyl bromide in annual temperate grasslands. Environmetnal Science Technology, 41, 7837-7843.
Rhew, R., Chen., C, Teh, Y. A., & Baldocchi, D. (2010). Gross fluxes of methyl chloride and methyl bromide in a California oak-savanna woodland. Atmospheric Environment, 44, 2054-2061.
Rhew, R. C., Miller, B. R., Bill, M., Goldstein, A. H., & Weiss, R. F. (2002). Environmental and Biological Controls on Methyl Halide Emissions from Southern California Coastal Salt Marshes. Biogeochemistry, 60 (2), 141-161.
Rhew, R. C., Østergaard, L., Saltzman, E. S., & Yanofsky, M. F. (2003). Genetic control of methyl halide production in Arabidopsis. Current Biology: CB, 13 (20), 1809-1813.
Rhew, R., Teh, Y., & Abel, T. (2007). Methyl halide and methane fluxes in the northern Alaskan costal tundra. Geophysical Research, 112, G02009.
Ya-Ting Chen Methyl Halide Emissions from Tropical Crops Spring 2011
27
Saito, T., & Yokouchi, Y. (2006). Diurnal variation in methyl halide emission rates from tropical ferns. Atmospheric Environment, 40, 2806-2811.
Saito, T., & Yokouchi, Y. (2008). Stable carbon isotope ratio of methyl chloride emitted from glasshouse-grown tropical plants and its implication for the global methyl chloride budget. Geophysical Research, 35, L08807.
Saito, T., Yokouchi, Y., Kosugi, Y., Tani, M., Philip, E., & Okuda, T. (2008). Methyl chloride and isoprene emissions from tropical rain forest in Southeast Asia. Geophysics Research Letters, 35, L19812
Saini, H. S., Attieh, J. M., & Hanson, A. D. (1995). Biosynthesis of halomethanes and methanethiol by higher plants via a novel methyltransferase reaction. Plant, Cell and Environment, 18(9), 1027-1033.
Simmonds, P. G., Derwent, R. G., Manning, A. J., Fraser, P. J., Krummel, P. B., O’Doherty, S., Prinn, R. G., Cunnold, D. M., Wang, R., & Prinn, R. (2004). AGAGE observations of methyl bromide and methyl chloride at Mace Head, Ireland, and Cape Grim, Tasmania, 1998-2001. Journal of Atmospheric Chemistry 47, 243-269.
Warwick, N. J., Pyle, J. A., & Shallcross, D. E. (2006). Global modelling of the atmospheric methyl bromide budget, J. Atmos. Chem., 54, 133–159.
World Meteorological Organization (WMO). (2003). Scientific Assessment of Ozone Depletion: 2002. Global Ozone Research and Monitoring Project Report No. 47. World Meteorological Organization, Geneva.
World Meteorological Organization (WMO). (2007). Scientific Assessment of Ozone Depletion: 2006. Global Ozone Research and Monitoring Project Report No. 50. World Meteorological Organization, Geneva.
Yokouchi, Y., Ikeda, M., Inuzuka, Y., & Yukawa, T. (2002). Strong emission of methyl chloride from tropical plants. Nature, 416, 163-165.
Yokouchi Y., Noijiri, Y., Barrie, L. A., Toom-Sauntry, D., Machida, T., Inuzuka, Y., Akimoto, H., Li, H. J., Fujinuma, Y., & Aoki, S. (2000). A strong source of methyl chloride to the atmosphere from tropical coastal land. Nature, 403, 295-298.
Yokouchi, Y., Saito, T., Ishigaki, C., & Aramoto, N. (2007). Identification of methyl chloride-emitting plants and atmospheric measurements on a subtropical island. Chemosphere, 69, 549-553.
Yoshida, Y., Wang, Y. H., Zeng, T., & Yantosca, R. (2004). A three- dimensional global model study of atmospheric methyl chloride budget and distributions. J. Geophys. Res.-Atmos., 109, D24309.