methodology of ndt transfer from laboratory to site
TRANSCRIPT

21ème Congrès Français de Mécanique Bordeaux, 26 au 30 août 2013
1
Analysis and Capitalisation for the Diagnosis of
Constructions:
Methodology of NDT transfer from laboratory to site
V. Garnier1, D Martini1, JP Balayssac2, M. Sbartai3 G Villain4, B. Piwakowski5, J Salin6, V. Fardeau7
1-Aix Marseille Université, CNRS LMA UPR 7051, site LCND, 13625 Aix en Provence, 2-Université de Toulouse, LMDC, 3-Université de Bordeaux, I2M,
4-IFSTTAR Nantes, 5-EC Lille IEMN, 6-EDF R&D STEP Châtou, 7-SETRA Knowing the pathological or mechanical state of a concrete is determining information for structures
and construction works managers. The Non Destructive Testing (NDT) that allow for access to
information, in real time or during inspection visits, are studied in a laboratory and lead to the
evaluation of indicators that characterize the material. The complementarity and combination of
information permit to overcome control difficulties and to link up the data. Several projects have
shown that it is possible to link the so-called Non Destructive Parameters (NDP) information data,
obtained via NDT, with these indicators thanks to empirical or less frequently analytical laws. The
Analysis and Capitalisation for the Diagnosis of Constructions (ACDC) project that we hereby present
aims at studying and formalizing the knowledge transfer from laboratory to on site evaluation. The
biases generated in the course of this transposition by the environment, the specific nature of each
concrete and the ageing conditions have to be identified and corrected during testing and processing
in industrial conditions. We display the various ways proposed to calibrate the data and try to get
closer to the true value of the indicators with data fusion tools. The measurement and exploitation
protocol adaptation to be defined in a diagnosis context as well as the information quality estimation
are presented. These decision-making aids are dynamic and adaptive procedures leading to the
writing of recommendations.
Key-words: NDT, Decision, Combination, Fusion
1 Introduction
Taking into account the ageing of the zones of structures and construction works, together with the risks related to environmental changes, are becoming prominent elements and require a predictive maintenance procedure. Non Destructive Testing (NDT) is an answer to this issue, allowing for a regular or real-time follow-up of the material and of the structure. Besides, this procedure must reduce the samplings that are essential in diagnoses. NDT makes it possible to have access to information linked to the pathological or mechanical state of the concrete in a structure. The SENSO project [1] has shown in particular that data fusion allows to combine NDT measurements and to improve evaluation.
The concrete’s space and time variability generated by the environmental and structural parameters of the material modifies the NDT measurement responses. These biases have to be addressed while on-site tests are exploited. The work hereby presented consists in establishing protocols relying on tools in order to ensure this transfer while integrating this variability. To this end we present the “Analysis and Capitalisation for the Diagnosis of Constructions” (ACDC) project and the data fusion method that we have integrated into the procedure. We propose to assess the quality of the inversion result and introduce methods for readjustment. A methodology is proposed and tested in real size on two sites. We present some results of this project.

21ème Congrès Français de Mécanique Bordeaux, 26 au 30 août 2013
2
2 Data Fusion
The ACDC project is supported by the RGCU of the French Ministry for Sustainable Development. It is carried out by seven partners (five research structures and two construction works managers, EDF and SETRA). It is in connection with the ANR SENSO project results and uses data fusion to readjust the measures of NDT made on-site. Table 1 presents the NDT developed and the Non Destructive Parameters NDPs measured by the laboratories.
Techniques Laboratories N° Non Destructive Parameter (NDP)
Ultrasounds EC Lille 1 Surface waves : group velocity (m/s)
Ultrasounds IFSTTAR 2 Surface waves : phase velocity (m/s)
Ultrasounds LMA 3 Transmitted waves : Velocity at 250 kHz (m/s)
Impact Echo IFSTTAR 4 Compression waves : Velocity (m/s)
Impact Echo IFSTTAR 5 Modulus of Elasticity (GPa)
Ultrasounds EC Lille 6 Surface waves : Attenuation (dB/m)
Resistivity I2M 7 5 and 10 cm Quadripole
Resistivity LMDC 8 Wenner
Electromagnetic IFSTTAR 9 Capacity : Large electrodes
Electromagnetic LMDC 10 Radar : Peak to peak amplitude
Electromagnetic LMDC 11 Radar : Velocity of direct waves (cm/s)
Electromagnetic IFSTTAR 12 Radar : Arrival time 14.7 cm (s)
Rebound Hammer I2M 13 Rebound index Table 1: Definition of non-destructive tests NDT and non-destructive parameters NDPs
Each NDT technique is sensitive to some properties of the concrete and combining the measurements obtained from different physics allows for the simultaneous extraction of one or several characteristics of the concrete. The multiplicity of NDPs allows for a reinforcement of information but increases the risks of conflicting information. Data fusion makes it possible to manage the contradictions. [2, 3, 4] We exploit the theory of possibilities in order to combine the NDT data [5]. To achieve this, we integrate in the fusion process the correlation laws between the NDT measurements, so-called NDPs, and the indicators of the concrete’s state, i.e. porosity, water content, modulus of elasticity and compressive strength. These experimental correlation laws between each NDP and the indicators have been set up during the ANR SENSO project [6] or may be set up on new data. It is expressed as follows:
bIaOp
k
kk +
= ∑
=1
.
where O is the measurement of the NDP under study and the ( )pkkI
≤≤1 correspond to the values of the
p indicators associated with the value of O. The ( )( )bapkk ,1 ≤≤
coefficients reflect the dependence of
the NDP on the p considered indicators i.e. the correlation between the NDP and the sought p indicators. Thereafter we limit our research to the bi-dimensional case of indicators (p=2) for a number of NDPs ranging from 3 to 6 among those initially assessed.
These empirical multi-linear relations between the NDPs and the indicators allow, by means of a mathematical operator of fuzzy logic, for the indicators’ assessment by the intersection of these relations associated with NDP’ values given by the NDT measurements. Figure 1 shows the result of the estimation of the saturation S and porosity W on the basis of the fusion of the velocities of the transmitted ultrasonic waves V, of the measurements of the capacity C and of the amplitude of the radar signal R.

21ème Congrès Français de Mécanique Bordeaux, 26 au 30 août 2013
3
The transfer of this procedure from laboratory to site raises two questions, first about the domain of validity of the correlation laws provided in the laboratory for the assessment of a concrete in external conditions and second about the accuracy of the fusion.
Figure 1 : Weighted distributions of possibilities for three NDPs: US velocity, capacity and radar amplitude within the indicators’ space of saturation S and porosity W,
a) before fusion in 2D (projection) b) before fusion in 3D c) after fusion
As for the domain of validity, we test these laws in an industrial context in Part 4.
We estimate accuracy from two quantities: * The reliability which characterizes the sensitiveness of the fusion procedure versus the measurement errors of the NDPs. This characterisation enables us to sort out the possible combinations of NDPs depending on their sensitiveness to measurement errors. This work has been initiated in the project. * The quality of the result which characterizes the convergence of the NDT measurements. It is associated to the emergence of a solution in the indicators’ space. We retain the threshold height (hs) as the quality estimator (QE) as shown graphically on figure 2.
Figure 2: Illustration of the possibilities distributions after fusion and the threshold height hs a) from 3 concurrent NDPs b) from 3 non-concurrent NDPs
This quality estimator of the fusion results allows on the one hand to quantify the confidence that an operator and a manager may have in front of this solution and on the other hand the element of quantification of the quality of the n NDPs combination. It then becomes possible to make a choice among the most efficient configurations of NDPs to estimate defined indicators.
3 Readjustment
Readjustment consists in correcting the correlation laws depending on the variability influencing measurements. The first is the nature of the structure’s concrete to be auscultated in view of that of the material used in laboratory to establish the correlation laws. The second is related to the measurement real environmental conditions and the third is the space and time variability of the material on site. The corrections can be made in two ways:
* A readjustment by the input which consists in separately correcting the correlation laws associated to each of the NDPs considered in relation to the influential parameters. Nine parameters are potentially influential on these correlations: Cement, Aggregates, Porosity, Curing and ageing, Mechanical Stress, Pathologies, Geometry, Steel reinforcement, environmental conditions during measurement. We classified them according to the influence they have over these laws and determined that their influence is ill-mastered. The correction of the correlations is thus difficult on the basis of
hs
W
S
0
1
0
20
100 0 S W
1
0 100 0
20 S W
1
0 100 0
20
Saturation Saturation E E
0
1
0
1
hs
hs

21ème Congrès Français de Mécanique Bordeaux, 26 au 30 août 2013
4
general laws. A new approach to re-define correlation laws in laboratory from cores sampled on the structure was initiated by IFSTTAR in this project.
* A readjustment by the outputs which consists in simultaneously correcting the correlations laws from the global consistence in the fusion of the NDPs measurements on all the points of auscultation and from the indicators values obtained by destructive testing (DT) on the structure’s samples. This readjustment is made for q points of NDT measurement and for c cores in two steps. The first optimizes the convergence of the q results of the fusion process in the two indicators space (p=2; I1 - I2) as shown on figure 3. It has to be noted that the q NDT points are taken into account simultaneously so that the threshold heights be minimized by the cost function as defined above.
( )[ ] ( )[ ]( )∑≤≤
≤≤
≤≤
≤≤−
q
=i
pj
mk
j
kki
pj
mk
j
kk b,aEQ=b,aJ1
21
1
1
1 1
( ) pj
mk
j
kk b,a≤≤
≤≤
1
1 are the correlation parameters between the m NDPs and the p indicators. EQ is the quality estimator associated with the threshold height.
The second stage optimizes the position of the previous fusion result from an affine function to converge towards the n places of core sampling (DT). Only the n out q NDT points measured at the coring places are included in this optimisation.
Figure 3: Process of readjustment by output: Step 1 Coherence in the possibilities distribution Step 2 Affine transformation
4 Implementation
This approach may be applied to the auscultation of any structure provided that we have a priori ideas on the correlation laws i.e. possible fluctuation ranges of their coefficients, and provided that NDT measurements are carried out at the sampling places. We have applied it on two industrial sites. We will hereby mention some results attached to the Marly highway bridge near Valenciennes in the north of France. Two pillars, that had been submitted to different exposures and previously identified, were auscultated over two sides, and one pillar was over one side.
Figure 4: Tests on a highway bridge in Marly A: Structure B: Pre-auscultation grid C : Auscultation zones D :Coring
The procedure of expertise transfer from laboratory to site relies on the one hand on an auscultation methodology as well as on measurements defined by protocols, and on the other hand on the quantitative procedures conceived around the quality estimator to assess the quality of the result:
• Identification of the pillars Figure A and definition of the surfaces to be auscultated (2*2 m²)
I1
OptimisationCohérence
Transformation Affine
I1 I1
I2I2 I2
E2
ValeursEDE1
E3
E4
E2
ValeursEDE1
E3
E4
E2
E1
E3
E4

21ème Congrès Français de Mécanique Bordeaux, 26 au 30 août 2013
5
• Pre-auscultation (16 points) Figure B by rapid techniques following the NDT protocols (Impact Echo, Radar amplitude, Transmitted ultrasounds, Resistivity, Capacity)
• Fusion and diagnosis to identify the six zones to be auscultated thoroughly Figure C • In-depth auscultation carried out in parallel by the teams • Coring in the zones initially spotted in Figure D • Adjustment and fusion
In the pre-auscultation step, we measured the NDT parameters for each of the 16 points on the pillars and applied the fusion process with or without readjustment methods (through input and/or output) in order to assess the indicators such as saturation S and compressive strength fc while quantifying the quality estimator. The results are provided in the form of mapping (fig. 5) with the values S, fc and QE as the colour scale; Table 2 presents the domains of variation of these data as well as the values of DT destructive tests.
Pile S Saturation % fc MPa EQ Mini Maxi Mini Maxi Mini Maxi
Senso 52 66 61 70 0.12 0.14 Input 62 72 46 58 0.69 1 DT 49,6 58,1 49 61
The fusion of the NDP’s measurements without readjustment, directly from the correlations obtained through the works of the SENSO project gives very weak QE values (0.12 to 0.14) which expresses inconsistency between the possibilities distributions. The correction through input which consists in modifying the coefficients of the correlation laws independently for each NDP, leads to the results displayed on figure 5. These corrections are made by a priori (average values of the indicators) and by values obtained from the Destructive Tests (DT). The QE values are significantly improved and superior to the critical threshold of 0.5. We have inferred the zones to be assessed during auscultation. It is carried out on three zones identified on each of the three pillars with 23 spots on the pillars S and Z and four spots on the pillar Sa. All the Non Destructive techniques are implemented, and the resulting NDPs are exploited and gathered into configurations of 3, 4 or 5.
During this auscultation, we applied the readjustment through output in order to improve the corrections of the correlations obtained by readjustment through input and to refine the estimates of the concrete’s indicators of the structure under study. For example we present the improvements in the quality of the estimates regarding saturation and compressive strength that were brought by this sort of readjustment in the case of two configurations with 3 NDPs.
Configuration ND Parameters Correction
by the input
Taux QE>0,5
Saturation Sat Strength fc
Mini Maxi Mini Maxi
1 3 US Velocity 5 IE Modulus
12 Radar Time
Before 84 % 48.5 55.9 46,5 53,3
After 88 %
2 5 IE Modulus
9 Capacity 11 Radar Velocity
Before 68 % 44.5 56.3 45,6 60,8
After 78 %
Destructive Tests 49,1 59.1 41.5 58.7
Table 3: Rates of the values of the quality estimator superior to the critical value 0.5 before or after correction by the output, for two configurations with three NDPs: Range of variation for saturation and compressive strength obtained by fusion and destructive tests (DT).
We notice in table 3 that the adjustment brings an increase in the rate of measurement points for which the quality estimator is superior to 0.5. This reflects an increase in the consistency of the whole set of NDT measurements on the auscultation points after readjustment by output that we associate with an
Table 2: Range of the variation of the fusion results (Sat and fc) obtained by the SENSO correlation laws, then corrected by the input: Range of values obtained from the destructive tests
Figure 5: Fusion of NDT measurements (rapid techniques) with corrections by input : 2*2 m² surface on a bridge pillar
21ème Congrès Français de Mécanique Bordeaux, 26 au 30 août 2013
6
improvement of the indicators assessment. Finally we will note that the values estimated from fusion are very close to those obtained by destructive tests.
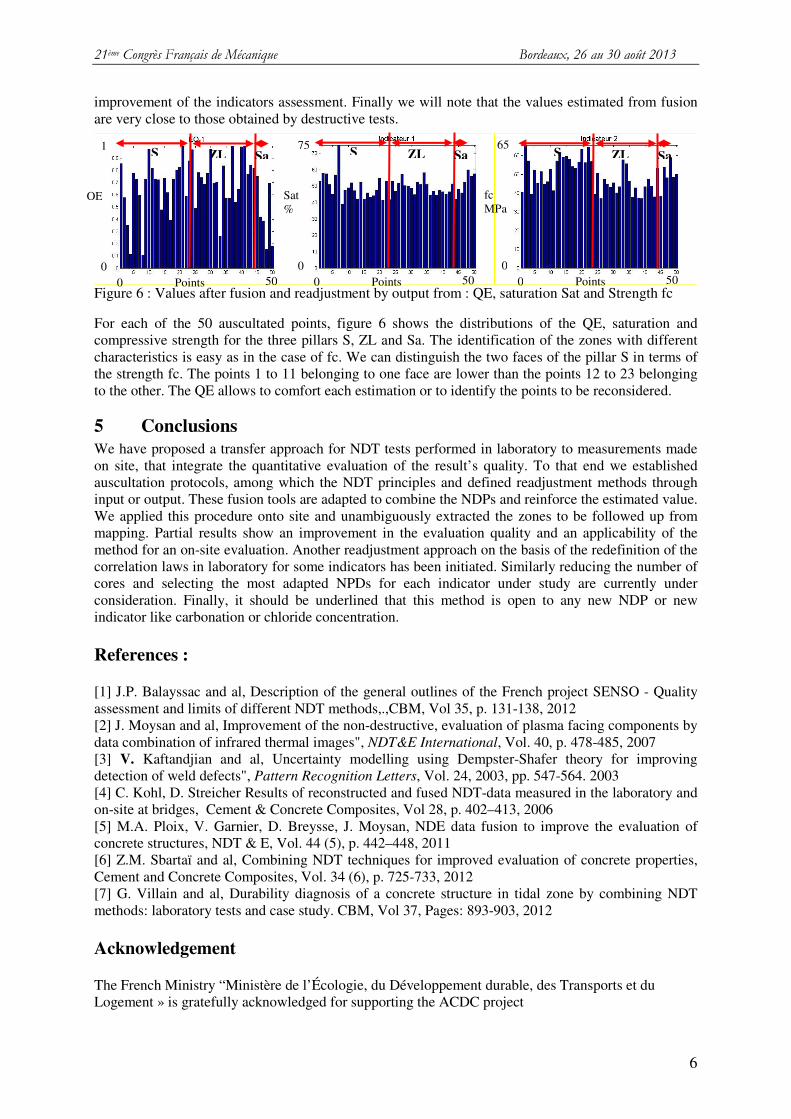
Figure 6 : Values after fusion and readjustment by output from : QE, saturation Sat and Strength fc
For each of the 50 auscultated points, figure 6 shows the distributions of the QE, saturation and compressive strength for the three pillars S, ZL and Sa. The identification of the zones with different characteristics is easy as in the case of fc. We can distinguish the two faces of the pillar S in terms of the strength fc. The points 1 to 11 belonging to one face are lower than the points 12 to 23 belonging to the other. The QE allows to comfort each estimation or to identify the points to be reconsidered.
5 Conclusions
We have proposed a transfer approach for NDT tests performed in laboratory to measurements made on site, that integrate the quantitative evaluation of the result’s quality. To that end we established auscultation protocols, among which the NDT principles and defined readjustment methods through input or output. These fusion tools are adapted to combine the NDPs and reinforce the estimated value. We applied this procedure onto site and unambiguously extracted the zones to be followed up from mapping. Partial results show an improvement in the evaluation quality and an applicability of the method for an on-site evaluation. Another readjustment approach on the basis of the redefinition of the correlation laws in laboratory for some indicators has been initiated. Similarly reducing the number of cores and selecting the most adapted NPDs for each indicator under study are currently under consideration. Finally, it should be underlined that this method is open to any new NDP or new indicator like carbonation or chloride concentration.
References :
[1] J.P. Balayssac and al, Description of the general outlines of the French project SENSO - Quality assessment and limits of different NDT methods,.,CBM, Vol 35, p. 131-138, 2012 [2] J. Moysan and al, Improvement of the non-destructive, evaluation of plasma facing components by data combination of infrared thermal images", NDT&E International, Vol. 40, p. 478-485, 2007 [3] V. Kaftandjian and al, Uncertainty modelling using Dempster-Shafer theory for improving detection of weld defects", Pattern Recognition Letters, Vol. 24, 2003, pp. 547-564. 2003 [4] C. Kohl, D. Streicher Results of reconstructed and fused NDT-data measured in the laboratory and on-site at bridges, Cement & Concrete Composites, Vol 28, p. 402–413, 2006 [5] M.A. Ploix, V. Garnier, D. Breysse, J. Moysan, NDE data fusion to improve the evaluation of concrete structures, NDT & E, Vol. 44 (5), p. 442–448, 2011 [6] Z.M. Sbartaï and al, Combining NDT techniques for improved evaluation of concrete properties, Cement and Concrete Composites, Vol. 34 (6), p. 725-733, 2012 [7] G. Villain and al, Durability diagnosis of a concrete structure in tidal zone by combining NDT methods: laboratory tests and case study. CBM, Vol 37, Pages: 893-903, 2012
Acknowledgement
The French Ministry “Ministère de l’Écologie, du Développement durable, des Transports et du Logement » is gratefully acknowledged for supporting the ACDC project
S ZL Sa
0
1
0 50 Points
QE
S ZL Sa
0
75
0 50 Points
Sat %
S ZL Sa
0
65
0 50 Points
fc MPa