methodology for the assessment of significant damage at
TRANSCRIPT
Methodology for the assessment of significant damage at wetlands
Science Report
SCHO1008BOTF-E-P

Science Report – Methodology for the assessment of significant damage at wetlands ii
The Environment Agency is the leading public body protecting and improving the environment in England and Wales.
It's our job to make sure that air, land and water are looked after by everyone in today's society, so that tomorrow's generations inherit a cleaner, healthier world.
Our work includes tackling flooding and pollution incidents, reducing industry's impacts on the environment, cleaning up rivers, coastal waters and contaminated land, and improving wildlife habitats.
This report is the result of research commissioned and funded by the Environment Agency's Science Programme.
Published by: Environment Agency, Rio House, Waterside Drive, Aztec West, Almondsbury, Bristol, BS32 4UD Tel: 01454 624400 Fax: 01454 624409 www.environment-agency.gov.uk ISBN: 978-1-84432-957-1 © Environment Agency – December 2007 All rights reserved. This document may be reproduced with prior permission of the Environment Agency. The views and statements expressed in this report are those of the author alone. The views or statements expressed in this publication do not necessarily represent the views of the Environment Agency and the Environment Agency cannot accept any responsibility for such views or statements. This report is printed on Cyclus Print, a 100% recycled stock, which is 100% post consumer waste and is totally chlorine free. Water used is treated and in most cases returned to source in better condition than removed. Further copies of this report are available from: The Environment Agency's National Customer Contact Centre by emailing: [email protected] or by telephoning 08708 506506.
Author(s): Andy Brooks, Anna Cohen, Sarah Evers, Paul Hulme, Natalie Phillips Dissemination Status: Publicly available Available all regions Keywords: Significant Damage, wetlands, risk assessment, GIS, groundwater dependent terrestrial ecosystems Research Contractor: Entec UK Ltd, Canon Court, Abbey Lawn, Abbey Foregate, Shrewsbury, SY2 5DE. 01743 342000 Environment Agency's Project Manager: Mark Whiteman, Science Department Product Code: SCHO1008BOTF-E-P

Science Report – Methodology for the assessment of significant damage at wetlands iii
Science at the Environment Agency Science underpins the work of the Environment Agency. It provides an up-to-date understanding of the world about us and helps us to develop monitoring tools and techniques to manage our environment as efficiently and effectively as possible.
The work of the Environment Agency's Science Department is a key ingredient in the partnership between research, policy and operations that enables the Environment Agency to protect and restore our environment.
The science programme focuses on five main areas of activity:
• Setting the agenda, by identifying where strategic science can inform our evidence-based policies, advisory and regulatory roles;
• Funding science, by supporting programmes, projects and people in response to long-term strategic needs, medium-term policy priorities and shorter-term operational requirements;
• Managing science, by ensuring that our programmes and projects are fit for purpose and executed according to international scientific standards;
• Carrying out science, by undertaking research – either by contracting it out to research organisations and consultancies or by doing it ourselves;
• Delivering information, advice, tools and techniques, by making appropriate products available to our policy and operations staff.
Steve Killeen
Head of Science

Science Report – Methodology for the assessment of significant damage at wetlands iv
Executive summary A multi-disciplinary team from the Environment Agency (Science Department, Process and Policy) and the environmental consultants Entec have produced a method for assessing whether the ecology on a groundwater dependent terrestrial ecosystem (a wetland) is significantly damaged by groundwater pressures.
This report describes the development and use of the method, which was completed in December 2006 and then used to conduct risk assessments across England and Wales. It provides the foundation for the 'significant damage to groundwater dependent ecosystems' test as part of groundwater body classification for the Water Framework Directive (WFD). The wetlands identified as high risk during this risk assessment will be put forward into the classification scheme during 2007.
The key elements of the approach are that it considers the risk of transmission of groundwater pressures, either quantitative or chemical, via the groundwater pathway to the wetland receptor and the potential subsequent impact on the ecology of the wetland.
In England and Wales the nature conservation bodies, Natural England and the Countryside Council for Wales, have selected over 1300 wetland sites that they suggest are dependent on groundwater. All of these sites are designated as Sites of Special Scientific Interest. Each site is scored for the likelihood that it is significantly damaged, by considering ecology and hydrology, groundwater quantity and quality.
The following nationally available data were gathered in a GIS system:
• abstraction pressures;
• phosphate pollution pressures;
• hydraulic connection between the aquifer and wetland;
• dependency of the wetland plant communities on groundwater.
From the GIS a ranked list of sites was produced based on the scores for likelihood of significant damage. Subsequently, hydrogeological and ecological experts presented local evidence at workshops across the country, and the initial scores were modified accordingly. At these workshops other pressures were considered including:
• non-abstraction pressures (e.g. drainage of the groundwater body);
• non-phosphate pollution (e.g. nitrates, pesticides).
80 sites were judged to be at high risk from quantitative pressures, however, following consideration of local evidence only 63 sites remained in this category. 131 sites were found to be at high risk from chemical pressures. After consideration of local evidence and chemical pressures other than phosphate 117 sites remained at high risk. Comments were made against a number of these sites that the assessment has over-estimated the risk. There was therefore much more certainty about the quantitative pressure risks derived during the assessment than the chemical pressure risks.
Several issues were identified through the workshops which need to be addressed during future River Basin planning cycles:
• 3D definition of groundwater bodies is often unclear, which means dependency is hard to establish even for sites that do sit on groundwater bodies.

Science Report – Methodology for the assessment of significant damage at wetlands v
• Many important sites are dependent on aquifers that occur on groundwater currently classified as “unproductive strata”, which means that they fail to qualify for WFD measures, even if they are damaged by groundwater-related pressures.
• For a number of sites, drainage and land use changes (e.g. forestry) affects the site condition much more than impacts from abstraction.
• Abstraction may affect a small part of some large sites, whilst other pressures may affect an entirely different part of the site. The risk assessment, however, adds these risks together, perhaps over-estimating the risk to the site.
• The risk assessment methodology does not deal well with riverine sites with associated land parcels, or multi-site terrestrial SSSI, which would be better assessed on a site unit scale.
• Many areas of Wales and some areas of England are licence-exempt, making it difficult to establish reliable data on locations and rates of existing abstractions.
• Chemical risk assessments are uncertain with respect to attenuation of phosphate concentrations in groundwater.
• ADAS phosphate loading data appear to overestimate the concentration of phosphate and hence the risk to sites.
Science Report – Methodology for the assessment of significant damage at wetlands vi
Acknowledgements The authors gratefully acknowledge the contributions to this work by Mark Whiteman, Tim Besien, Cath Tomlin, Steve Fletcher, Felicity Miller, Ann Skinner, Grant McMellin, Anna Hall, Stuart Kirk, Keith Phillipson, Graham Morgan, Peter Daldorph, Peter Jones, Johan Schutten, Julie McNish, David Johnson, Ursula Buss, Mike Carey, Lindsay Powell and all the participants in the local workshops.

Science Report – Methodology for the assessment of significant damage at wetlands vii
Contents Executive summary iv
Acknowledgements vi
1 Introduction 1
2 Background 2 2.1 Initial ideas on the assessment of significant damage 2 2.2 Risk screening 2
3 Method 4 3.1 Overview of method 4 3.2 National GIS screening model 6 3.2.1 Source – pressures 6 3.2.2 Pathway – groundwater connectivity 11 3.2.3 Receptor – groundwater dependency of ecological features 13 3.2.4 Scoring 14 3.3 Capturing local knowledge 17 3.3.1 Changing the nationally derived source-pathway-receptor scores 18 3.3.2 Pathway – groundwater connectivity 21 3.3.3 Receptor – groundwater dependency of ecological features 23 3.3.4 Taking account of additional pressures in the risk assessment 25 3.3.5 Scoring 28
4 National GIS screening model: alternative scenarios 34 4.1 Source analysis 34 4.1.1 Alternative quantitative pressure analysis 34 4.1.2 Alternative chemical pressure analysis 35 4.2 Pathway analysis 37
5 Limitations 44 5.1 Source – pressures 44 5.1.1 Quantitative pressures 44 5.1.2 Chemical pressures 46 5.2 Pathway 47 5.2.1 Arial extent of the SNIFFER drift permeability data 47 5.2.2 Elevation of a site compared to nearby abstractions 47 5.3 Receptor 47
Science Report – Methodology for the assessment of significant damage at wetlands viii
6 Lessons learned in running participatory decision-making workshops in the Environment Agency 50
7 Next steps 51 Appendix 1: Preferred trophic status of NVC communities (from Meade et al., 2006) 52
Appendix 2: English Nature draft list of NVC communities with associated groundwater dependency ratings (July 2006) 54
Appendix 3: Definition and use of Welsh subjectives 61
References 62

Science Report – Methodology for the assessment of significant damage at wetlands 1
1 Introduction A multi-disciplinary team from the Environment Agency and Entec has produced a method for assessing whether the ecology on a groundwater dependent terrestrial ecosystem (GWDTE) (a wetland) is significantly damaged by groundwater pressures. The method was completed by December 2006 and was used to conduct risk assessments across England and Wales between January and April 2007.
The Water Framework Directive (WFD) requires us to classify each groundwater body as good or poor status. We must assess each groundwater body to see if it is causing significant damage to any GWDTE. To do this, both quantitative and chemical pressures acting on the GWDTE must be considered. Natural England and the Countryside Council for Wales (CCW) provided a list of 1368 sites believed to be groundwater dependent and we have ranked these according to their risk of significant damage to the ecology. The high risk sites will be put forward to the WFD classification process.
For brevity GWDTEs are frequently referred to as wetlands in this report.
Report structure
Section 2 describes the background and the route taken in developing the method. The methodology is explained in Section 3. Alternative approaches investigated during development of the risk assessment method are recorded in Section 4. Section 5 describes the limitations of the approach. Lessons learned while running the participatory workshops are noted in Section 6 and next steps are outlined in Section 7.
Science Report – Methodology for the assessment of significant damage at wetlands 2
2 Background
2.1 Initial ideas on the assessment of significant damage Initial ideas about assessing whether groundwater dependent terrestrial ecosystems (GWDTEs) are significantly damaged by groundwater pressures involved the following three steps:
1. Identify all wetlands in England and Wales.
2. Determine which of these wetlands depend on groundwater to support the wetland ecological features.
3. Decide which of these have been significantly damaged by pressures acting through the groundwater.
In 2005, the Ribble Basin Pilot Project commissioned the Environment Agency Science Group to carry out a determination of groundwater dependence (step 2) for five wetlands in the Ribble Basin (Environment Agency, 2007) using guidance produced by the UK Technical Advisory Group (UKTAG). The UKTAG guidance was in turn an interpretation of the Common Implementation Strategy (CIS) guidance issued by the European Commission on the role of wetlands in the Water Framework Directive (WFD), (European Commission, 2003).
The UKTAG guidance recognised that:
• Nearly all water dependent ecosystems 'lie on a continuum between being always only groundwater dependent and always only surface water dependent';
• 'The task of identifying dependence upon groundwaters is sometimes complex' (UKTAG, 2004, Section 4.1).
It also suggested using two complementary lines of evidence for assessing groundwater dependence based on (a) the ecology and (b) the hydrogeology.
The main conclusion of the work by the Science Group on the five Ribble sites was that screening for groundwater dependency alone, as outlined in the UKTAG guidance (i.e. step 2, above), would probably identify most wetlands as potentially groundwater dependent. Therefore, the screening process was unlikely to reduce the number of wetlands that would need to be assessed in more detail for significant damage (step 3, above). Therefore it was recommended that there should be pressure-focused screening as part of the significant damage assessments.
2.2 Risk screening The practical basis for this pressure-focused screening for wetlands at risk of significant damage due to groundwater pressures was prompted by the outline framework that a team from the whole of the UK and the Republic of Ireland produced (SNIFFER, 2006; Krause et al., 2007). We also used the guidance in working paper 5c, version 9.6, Draft protocol for determining 'Significant Damage' to a 'Groundwater
Science Report – Methodology for the assessment of significant damage at wetlands 3
Dependent Terrestrial Ecosystem' prepared by the WFD UK Technical Advisory Group (UKTAG, 2005).
The UKTAG working paper provided a working definition of significant damage and suggested the need for a risk-based approach and the use of expert judgement as follows:
Paragraph 2.7: The term 'significant damage' is a function of:
• 'Degree of damage' occurring to a GWDTE (caused by groundwater-related factors); and
• The 'significance' or 'conservation value' of the ecosystem.
Paragraph 2.11: A risk-based approach will be applied to the identification of significant damage.
Paragraph 2.2: Given the lack of existing data, the determination of significant damage will use technical assessments backed up by expert judgement where necessary.
One way of estimating the degree of damage caused by groundwater quality or quantity pressures is to answer the following questions:
• How do the surrounding groundwater pressures change the hydrological conditions beneath the wetland (e.g. water levels or contaminant concentrations)?
• How do the hydrological conditions beneath the wetland influence the hydrological conditions in the wetland?
• How do the hydrological conditions on the wetland affect the ecology, i.e. have they caused ecological damage?
As recognised in paragraphs 2.2 and 2.11 of the UKTAG guidance (see above), there are not enough ecological and hydrological data to answer these questions for 1368 wetlands. Hence the method we have developed uses both a risk assessment approach and the expert judgement of local ecologists and hydrogeologists. However, there were many unanswered questions about how the risk screening should be done in practice and whether there were many wetlands with unique features which would make a national risk assessment inappropriate.
In early 2006, the Environment Agency Science Group used national GIS data for a group of about 900 wetlands to trial early ideas for the risk screening and to begin answering these questions (Environment Agency, 2006). We trialled several approaches and finally settled on a simple two-tier method where a score was firstly derived for each wetland based on nationally available GIS data and then subsequently revised by specialists with local ecological and hydrogeological knowledge.
The trial was successful enough for the Environment Agency Water Framework team to recommend using it as the basis for the full development of a risk screening methodology that could be applied throughout England and Wales.
This report describes the development of that full method and its application in assessing all GWDTEs for significant damage due to groundwater pressures.

Science Report – Methodology for the assessment of significant damage at wetlands 4
3 Method The method described here is based on the trial work by the Environment Agency Science Group in 2006 (see Section 2). It is a simple two-tier method where a score was firstly derived for each wetland based on nationally available GIS data and then subsequently revised by specialists with local ecological and hydrogeological knowledge.
The source-pathway-receptor model was followed to derive scores using data on (1) groundwater pressures (quantitative and chemical); (2) the degree of hydraulic connection between the wetland and the groundwater body and (3) the dependency of ecological indicators on groundwater.
3.1 Overview of method The national conservation bodies in England and Wales (Natural England and the Countryside Council for Wales) produced a list of 1368 Sites of Special Scientific Interest (SSSIs) which they consider to be groundwater dependent terrestrial ecosystems (GWDTEs).
The risk assessment of these wetlands was based on the source-pathway-receptor model where:
Source = groundwater-related pressures
Pathway = hydraulic connectivity between groundwater body and wetland
Receptor = dependency of wetland ecology on groundwater
All wetlands were assessed and given a score, between 0 and 3, related to each of these three components and the individual scores were then added to give a total risk score between 0 (low risk) and 9 (high risk). A wetland may experience damage arising from both quantitative pressures and chemical pressures so each wetland received a total 'quantitative pressure risk score' and a total 'chemical pressure risk score'.
The risk assessment was carried out in two stages. In the first stage, we used nationally available GIS data to give each site an initial risk assessment score. In the second stage we held ten local workshops across England and Wales where local expert ecologists and hydrogeologists reviewed these initial risk scores. Figure 3.1 gives an overview of this risk assessment method.
The main features of the risk assessment method are:
• Two lists are produced, one where sites are ranked according to their 'total quantitative pressure risk score' and another according to their 'total chemical pressure risk score'.
• These ranked lists show the risk that a site is significantly damaged. Sites with higher scores are at higher risk. So a high score is a relative indication but not an absolute indication of significant damage.

Science Report – Methodology for the assessment of significant damage at wetlands 5
Figure 3.1 Overview of risk assessment method
List of sites
Assess quantitativegroundwater
pressures
Assessgroundwater
quality pressures
Assessgroundwaterconnectivity
Assessgroundwaterdependency
Quantitativepressure risk score
Chemical pressurerisk score
Source
Pathway
Receptor
Review at local workshops

Science Report – Methodology for the assessment of significant damage at wetlands 6
3.2 National GIS screening model
3.2.1 Source – pressures
3.2.1.1 Quantitative pressures
The methodology for determining quantitative pressures on wetlands uses data sets created as part of the WFD assessment of groundwater body abstraction pressure. The groundwater body abstraction pressure is combined with information about the size and distribution of abstractions with respect to the wetlands and associated groundwater bodies, as inferred by recharge circles.
Groundwater body abstraction pressure
This data set was one of the precursor maps created for the WFD abstraction pressure risk assessment (Environment Agency, internal publication 1). Information about water level trends and saline intrusions are not included in this approach.
The groundwater body abstraction pressure is based on predicted future abstractions for 2015 in order to meet the criteria of assessing the ecological status of the wetlands also in 2015. The future abstraction is divided by the average recharge across each groundwater body, taking into account the effect of aquifer storage on water levels, to obtain the abstraction pressure within each groundwater body.
The abstraction pressure map categorises each groundwater body in England and Wales into four classes based on the assessed groundwater body status and the associated confidence. These four classes were assigned a score from 0 to 3 corresponding to no, low, medium or high risk, as shown in Table 3.1.
Table 3.1 Scores associated with the groundwater body abstraction pressure status
Abstraction pressure status Abstraction pressure risk Poor (high confidence) 3 Poor (low confidence) 2 Good (low confidence) 1 Good (high confidence) 0
Note: This scoring system was developed in the pilot methodology (Environment Agency, 2006). Where a site intersects more than one groundwater body the worst case scenario (i.e. the groundwater body with the highest abstraction pressure risk) is applied. Recharge circles
'Equivalent recharge circles' were developed for the RAM Framework in the first CAMS cycle by Entec. They are based on information provided by the Environment Agency's abstraction licence database (NALD) combined with estimated recharge for the area affected by the abstraction (Environment Agency, internal publication 2). The area of the circle around an abstraction corresponds to the abstraction size divided by the average recharge for the groundwater body.
Due to the lack of available information on groundwater flow directions at a national scale, 5 km buffers are created around each wetland to reflect the possible zone of

Science Report – Methodology for the assessment of significant damage at wetlands 7
interaction between the wetland and the underlying groundwater. The percentage cover by recharge circles of the buffered wetland is compared with that of the associated groundwater body(ies). This information is used to infer whether the groundwater body abstraction pressure is representative of the abstraction pressure close to the wetland.
Table 3.2, shows the local modification made to the groundwater body abstraction pressure score using the recharge circles. For example, if the percentage area of recharge circles covering the buffered wetland is, say, 18% more than that covering the groundwater body then the score for the recharge circles data is equal to the score for the groundwater body abstraction pressure map plus 1. In addition, if a recharge circle intersects the wetland itself then the recharge modification is automatically increased by 2 up to a maximum of 3.
Table 3.2 Recharge circle adjustment calculations
Difference between % of wetland coverage and % of ground water body
coverage
% coverage recharge circle adjustment
>20 +2 10 to 20 +1
–10 to 10 0 –10 to –20 –1
<–20 –2 Where a wetland intersects more than one groundwater body, the values from the coincident groundwater bodies with the minimum and maximum percentage coverage are used in the method described above to give two possible adjustments. Using these two values, the following rules are applied to calculate a score from recharge circles data:
I. If the minimum and maximum % groundwater body coverage are within the same difference range, i.e. 0–10%, 10–20%, >20%, relative to the % cover around the wetland, then this score was added or subtracted to the overall groundwater body risk.
II. If the differences based on the minimum and maximum % groundwater body coverage agree on the direction of adjustment but have a different magnitude, the smaller adjustment of the two was added or subtracted to the overall groundwater body risk.
III. If the minimum and maximum % groundwater body coverage adjustments are in opposite directions then no change is made to the overall groundwater body risk.
The two scores from the abstraction pressure map and the recharge circles are combined and divided by 2 to give the wetland abstraction pressure score. This results in a range of scores from 0, no risk, to 3, high risk, with 0.5 unit intervals.
3.2.1.1 Chemical pressures
The methodology for assessing national groundwater chemical pollution pressures uses groundwater phosphate as an indicator of the risk of significant damage to GWDTEs from chemical pollution pressures. The phosphate GIS layer is a coarse first-pass national screening tool which is based on available data sets. It does not consider

Science Report – Methodology for the assessment of significant damage at wetlands 8
any aspects of phosphate transport in groundwater or surface water phosphate runoff from flooding. These important mechanisms governing groundwater phosphate concentrations are to be considered by local experts during the workshops.
The assessment process is described below and summarised in Figure 3.2.
Groundwater phosphate data
Groundwater phosphate data from the Environment Agency monitoring network held on the WIMS water quality database were used. The data are derived from 2875 monitoring points and have records from 1 day to 37 years. Of the monitoring sites, 25% have time series of greater than 10 years and 38% are longer than 6 years.
The number of samples by monitoring site is shown in Table 3.3. A total of 71% of the monitoring sites have less than ten samples, 52% of the sites have fewer than six samples, while 21.5% of sites have less than three samples.
Table 3.3 Distribution of number of samples by monitoring site
Number of samples Cumulative % of sites
1 10.0 2 21.5 3 33.4 4 42.9 5 52.2 6 58.4 7 63.3 8 67.2 9 70.7
10 to 19 83.6 20 to 49 95.6
>50 100.0 The average phosphate concentration for each groundwater body is calculated from the time series average for each monitoring point within the groundwater body. Data are available for 248 groundwater bodies, and 176 groundwater bodies have at least three monitoring points. Where there are less than three monitoring points within a groundwater body, the average diffuse agricultural phosphorus loading for the groundwater body is applied. The 1 km resolution diffuse agricultural phosphorus loading layer from the initial characterisation exposure assessment was used.
Ecological phosphate sensitivity data
Botanical communities are useful in risk assessments, as each is normally associated with a definable water quality range. The preferred trophic conditions of each community is classified, in decreasing trophic status order, as oligotrophic, mesotrophic and eutrophic.
The preferred trophic status of each community has been taken to indicate its relative sensitivity to nutrient enrichment, in this case phosphate. The preferred trophic status of the notified features (botanical communities) for each wetland is assigned from a rating presented by Meade et al. (2006) and is shown in Appendix 1. A sensitivity is assigned to the notified features of 978 of the 1368 wetlands with the remaining 390 sites unassigned.

Science Report – Methodology for the assessment of significant damage at wetlands 9
Total phosphate pressure
The average phosphate or phosphorus loading level for each groundwater body is classified as No, Low, Medium or High according to the threshold ranges presented in Figure 3.2. The threshold ranges are somewhat arbitrary, as groundwater thresholds have not been defined. The lower end of the threshold ranges are based on surface water thresholds used by Natural England for certain aquatic communities.
This phosphate/phosphorus loading class is combined with the phosphate sensitivity for each wetland as illustrated in Figure 3.2 to yield the total phosphate pressure at each site. For sites straddling more than one groundwater body a precautionary approach is adopted and the highest risk of the groundwater bodies intersected is assigned to the site.
Background (natural) phosphate levels
Groundwater background phosphate data from the British Geological Survey (BGS)/Environment Agency baseline project (BGS and Environment Agency Science Group, 2006) are used. The 95 percentiles of background orthophosphate time series for each groundwater baseline unit are applied to 2481 WIMS phosphate monitoring points. The data are interpolated into a surface using inverse distance weighting in a GIS. The surface is used to assign a background class of No/Low, Medium or High to the wetland. The highest background phosphate class is attributed to a wetland containing more than one background class.
Chemical phosphate pressure
The chemical phosphate pressure, due to anthropogenic influences, is assigned to each wetland by subtracting the background phosphate component from the total phosphate pressure, as set out in Figure 3.2.

Science Report – Methodology for the assessment of significant damage at wetlands 10
Step1: Determine total (chemical and background) phosphate pressure
Group average PO4 data by GWB
Count of monitoring points by GWB
Are there three or more monitoring points in the GWB?
Yes No
Use P loading data
Calculate average of average PO4 by GWB Calculate average P loading for GWB
Apply PO4 thresholds: Apply P loading thresholds:
No 0–0.05 mg/l No 0–10 kg/ha
Low 0.06–0.1 mg/l Low 10–100 kg/ha
Med 0.1–0.5 mg/l Med 100–2500 kg/ha
High >0.5 mg/l High 2500–15000 kg/ha
Determine PO4 level by GWB Determine P loading level by GWB
Combine PO4/P level layer with SSSI PO4 sensitivity according to the matrix
GWB PO4 class
PO4 sensitivity
Total PO4/ P pressure
GWB PO4 class
PO4 sensitivity
Total PO4/ P pressure
O H O M
M H M L
E M E N
H
DNA H
L
DNA L
O H O L
M M M N
E L E N
M
DNA M
N
DNA N
GWB – groundwater body, PO4 – phosphate, P – phosphorus, O – oligotrophic, M – mesotrophic, E – eutrophic, DNA – data not available

Science Report – Methodology for the assessment of significant damage at wetlands 11
Step 2: Determine background (natural) phosphate levels
Interpolate 95%ile background PO4 value assigned to WIMS monitoring points
Apply PO4 thresholds (as above) and assign baseline value to each wetland
Step 3: Assign chemical phosphate pressure
Assign chemical phosphate pressure to each site according to the matrix:
Total PO4 pressure
Background PO4
Chemical PO4 pressure
Chemical PO4 pressure score
H M 2
M M 2
N/L H 3
H
unattributed H 3
H N/L 0/1
M N/L 0/1
N/L M 2
M
unattributed M 2
H N/L 0/1
M N/L 0/1
N/L N/L 0/1
N/L
unattributed N/L 0/1
Note: Unattributed sites occur in an area in Northumbria which was excluded from the interpolation.
Figure 3.2 Assessment of chemical pressure
3.2.2 Pathway – groundwater connectivity
This method uses the water resource potential of the bedrock together with the thickness and permeability of the drift to infer the groundwater connectivity of the wetland. This information is combined in the GIS so that each 50 m grid square has an assigned score.
At the national scale it is assumed that any gap in the drift, or area of high permeability, no matter how large or small, can act as the groundwater connection for the whole site. For this reason the connectivity score is based on the most connected part of the site irrespective of how large the area is.
Science Report – Methodology for the assessment of significant damage at wetlands 12
Geology
The Bedrock 50k data set is based on the 50k geology map combined with DigMapGB data from the BGS, which includes a vulnerability classification that identifies Primary, Secondary and Unproductive strata. This data set is the best currently available and does not suffer from the processing errors that some of the other data sets have. For more information about these data please visit the website http://www.bgs.ac.uk/products/digitalmaps/digmapgb_50.html.
The data set was reclassified into three categories:
I. Productive strata (i.e. Primary and Secondary aquifer);
II. Unproductive strata within 500 m of productive strata;
III. Unproductive strata.
A 500-m buffer zone around the productive strata was incorporated to reflect sites that may be located on unproductive bedrock but are fed by nearby groundwater derived from the productive strata.
Drift thickness
The BGS GeoSure drift thickness grid represents a mathematical interpolation of BGS's legacy borehole and map data sets (BGS, Unpublished). It is the only data set currently available of this kind. For further information about this data set please visit the website http://www.bgs.ac.uk/programmes/infoserv/ip/superficialthickness.html.
At the time of developing the methodology there were some map-squares missing in Wales and Northern England. However, comparison with the groundwater vulnerability drift maps revealed that no drift is present in the missing Welsh squares. Patchy drift is present in Northumberland and Cumbria; however, this has a minimal affect on the scores due to the precautionary approach adopted with regard to connectivity.
The data set was simplified into three main components considered to have an impact on the groundwater connection of the wetland based on scientific understanding of the generalised hydrological characteristics of drift. These are listed below.
I. 0–5 m absent;
II. 5–10 m thin;
III. >10 m thick.
Five metres was taken as the minimal drift thickness that offers protection to the bedrock since shallower depths are usually affected by weathering and thus offer less protection.
Drift permeability
The drift permeability data were produced by SNIFFER. The data are classified into low, moderate and high permeability drift categories. Work using this data set for the Nitrate Directive (SNIFFER, 2006) found that low primary permeability was good at explaining the observed protection offered by the drift compared to moderate and high permeability; however, further separation between moderate and high was not. The categories for the SNIFFER data were differentiated into:
I. High and moderate primary permeability;
II. Low primary permeability;
III. No drift.

Science Report – Methodology for the assessment of significant damage at wetlands 13
The three data sets were combined and a groundwater connectivity score assigned to the wetland based on the highest connectivity present anywhere on the site. Table 3.4 shows the various possible scores and associated characteristics.
Table 3.4 Groundwater connectivity classifications and associated scores
Aquifer water resource potential
Drift thickness Drift permeability Score
Productive Absent – 3
Productive Thin Very high/ high/moderate 3
Productive Thin Low 2
Productive Thick Very high/ high/moderate 2
Productive Thick Low 1
500 m buffer – – 1
Unproductive – – 0
3.2.3 Receptor – groundwater dependency of ecological features
The method assigns a groundwater dependency to each site and therefore the groundwater dependency of the ecological features (communities and species) present on GWDTEs needs to be determined. A high groundwater dependency may make ecological features more sensitive to changes in groundwater supply and the converse is true for low groundwater dependencies.
In July 2006 Johan Schutten of Natural England produced a draft list of National Vegetation Classification (NVC) communities with associated groundwater dependency ratings (see Appendix 2). In this list a number of the communities are assigned two groundwater dependencies, dependent upon site geology. This method uses the main groundwater dependency number from this list.
All Sites of Special Scientific Interest (SSSIs) have ecological features that, either singly or together, have met the published criteria for the selection of biological SSSI. Upon notification of a site as an SSSI these ecological features become known as notified features. Notified features for SSSI in England were obtained from Natural England and groundwater dependency has been assigned to each English site based on these.
Notified features are not available for many of the Welsh peatland SSSI and therefore Peter Jones of the Countryside Council for Wales (CCW) has assigned to them a subjective groundwater dependency value. Definitions of subjectives and the groundwater dependency value assigned to each are presented in Appendix 3.
For the purposes of this methodology, groundwater dependency has been assigned a scale of 1–3 as follows:
• High dependency communities Natural England groundwater dependency category = 1, score 3;
• Medium dependency communities, Natural England groundwater dependency category = 2, score 2;

Science Report – Methodology for the assessment of significant damage at wetlands 14
• Low dependency communities, Natural England groundwater dependency category = 3, score 1.
The score is assigned at a site level, rather than a site unit level. This is because, at a national level, notified features can only be attributed to a site, and not a specific unit of a site.
The score assigned to a site is the score for the most groundwater dependent community present. Where SSSIs have botanical communities that have no groundwater dependency assigned, or have notified features that are not botanical communities, these have been assigned a 0, to indicate no data.
3.2.4 Scoring
The individual numeric scores assigned to each component of the risk assessment, that is source, pathway and receptor (described in Sections 3.2.1 to 3.2.3), are combined to create the national-scale risk score of significant damage to wetlands by quantitative or chemical pressures.
The nature of the source-pathway-receptor chain prescribes that there is no risk to the receptor if any of the components is zero. Consequently, when combining the results from the individual components, an overall score of zero is assigned to any site where any of the contributing components is equal to zero. Quantitative and chemical risk are scored separately since these pressures may occur independently of each other and result in different scores at the same site.
The result is a range of values from 0 to 9 for the quantitative and chemical pressures, respectively. The thresholds for high, medium and low risk are determined by analysing the distribution of scores to identify breakpoints. The two cumulative distribution plots are shown in Figures 3.3 and 3.4 and thresholds for quantitative and chemical risk categories are shown in Tables 3.5 and 3.6.
1000
1050
1100
1150
1200
1250
1300
1350
1400
0 1 2 3 4 5 6 7 8 9
Combined Abstraction Risk Score
Cum
ulat
ive
num
ber o
f site
s
Figure 3.3 Combined quantitative risk scores

Science Report – Methodology for the assessment of significant damage at wetlands 15
Table 3.5 Thresholds for quantitative risk score
Quantitative score Risk Number of sites
0 None 954
0.5–4 Low 12
4.5–7 Moderate 322
7.5–9 High 80
0
200
400
600
800
1000
1200
1400
1600
0 1 2 3 4 5 6 7 8 9
Combined Chemical Risk Score
Cum
ulat
ive
Num
ber o
f Site
s
Figure 3.4 Combined chemical risk scores
Table 3.6 Thresholds for chemical risk categories
Chemical score Risk Number of sites
0 None 349
1–4 Low 18
5–8 Moderate 870
9 High 131
Both the quantitative and chemical cumulative frequency risk plots have a normal distribution; however, the number of sites with an over all score of zero is substantially greater for the quantitative pressure than the chemical pressure. This is due to the large number of sites located in Wales, and the north west and south east of England where there are fewer large abstractions located close to wetlands or within adjacent groundwater bodies.

Science Report – Methodology for the assessment of significant damage at wetlands 16
3.2.4.1 Worked example – Bryn Marsh and Ince Moss
Table 3.7 illustrates how the quantitative pressure risk score was derived for a wetland in north west England, Bryn Marsh and Ince Moss. Table 3.8 illustrates the derivation of the Chemical Pressure Risk Score for the same wetland.
Quantitative pressure risk score
Table 3.7 Quantitative pressure risk score for Bryn Marsh and Ince Moss wetland
Quantitative pressure risk score Component Explanation Score
Groundwater abstraction pressure
(1) Whole groundwater body class: 'not at risk'. (Score 0) (2) Local groundwater abstraction pressures: recharge circle area within 5 km of wetland is 11% more than across whole groundwater body. (Score 1) Scores from (1) and (2) averaged
0.5
Groundwater connectivity Aquifer covered with thin, low permeability drift 2
Groundwater dependency National Vegetation Classification rating: 'medium' 2
Total quantitative pressure risk score 4.5
Groundwater abstraction pressure score: The Bryn Marsh and Ince Moss wetland site lies above a groundwater body that has been classified as 'not at risk' and was hence given a whole groundwater abstraction body score of 0 (column 2, Table 3.7). The difference between the percentage area of the whole groundwater body that the recharge circles cover and the percentage area of the buffered wetland that the recharge circles cover is 11%, and no recharge circles intersect the boundary of the wetland itself. Hence it was assigned a local abstraction score of 1, i.e. the whole groundwater body score (0) plus 1. These were added and divided by 2 to give a combined score of 0.5 (column 3, Table 3.7)
Groundwater connectivity score: The score for Bryn Marsh and Ince Moss is 2 because it lies above an aquifer covered with drift which is thin (5–10 m thick) and low permeability.
Groundwater dependency score: On Bryn Marsh and Ince Moss the community W2 (Salix cinerea–Betula pubescens–Phragmites australis woodland) is the notified feature on the SSSI with the highest rating, 'medium', and so the site scores 2.
The three individual scores in column three of Table 3.7 were added to give a total quantitative pressure risk score of 4.5.
Chemical pressure risk score
For the Bryn Marsh and Ince Moss site, the average phosphate concentration for the groundwater body is between 0.05 and 0.1 mg/l putting it in the 'low' risk class. The preferred trophic status of the NVC communities on the site is oligotrophic, which increases the risk class from 'low' to 'medium'. The baseline

Science Report – Methodology for the assessment of significant damage at wetlands 17
phosphate is 'medium' and so the risk class is decreased back to 'low'. This gives a groundwater phosphate pressure score of 1 (Table 3.8). Adding this to the groundwater connectivity and groundwater dependency scores gives a total chemical risk score of 5.
Table 3.8 Chemical pressure risk score for Bryn Marsh and Ince Moss wetland
Chemical pressure risk score Component Explanation Score
Groundwater abstraction pressure
(1) Average monitored PO4 for groundwater body: 'low' (2) Trophic status: 'oligotrophic' (3) Baseline PO4: 'medium'
1
Groundwater connectivity
Aquifer covered with thin, low permeability drift 2
Groundwater dependency
National Vegetation Classification rating: 'medium' 2
Total quantitative pressure risk score 5
3.3 Capturing local knowledge The national GIS screening produced a draft ranking of wetlands at risk of significant damage. At this stage local knowledge had not been sought. However, it was considered important to capture knowledge from local staff (Environment Agency and conservation agencies) because:
• there may have been issues of accuracy with the national data sets;
• it was considered likely that the robustness of the risk assessment could be improved by including local knowledge of staff who may have worked on the sites.
To capture local knowledge local ecologists and hydrogeologists from the Environment Agency, Natural England and the Countryside Commission for Wales were invited to a series of ten workshops across England and Wales.
There were over 100 wetlands relevant to each workshop and so it was not possible to discuss all the sites. Therefore to ensure that the workshops would run as efficiently as possible, the ecologists and hydrogeologists attending were asked to review the scores from the initial national assessment before arriving. In particular they were asked to focus on:
• sites that score around the high/medium risk category boundary to determine if local knowledge would result in a site moving up into the high, or down into the medium/low/no risk categories;
• sites scoring 0 to determine if local knowledge would result in a site moving into the high risk category.
These two scenarios were focused on as only those sites that were categorised as high risk would be likely to influence the classification of a groundwater body.

Science Report – Methodology for the assessment of significant damage at wetlands 18
The ecologists and hydrogeologists were asked to present evidence at the workshop which would justify revising a score, where they believed this to be necessary. The presentation of evidence was fundamental to any changes made although any score change was subject to discussion and collective agreement at each workshop. A GIS project, containing the final scores resulting from the national assessment, and all the data used to obtain them, was available at each workshop to inform the discussions.
Changes to scores were allowed where:
• there was evidence which superseded the national GIS data used in the national screening assessment;
• there was evidence which related to new pressures not considered in the national screening assessment.
The types of evidence accepted, and the allowed score changes, are presented in Sections 3.3.1 to 3.3.4.
Both the original and modified scores were recorded in a Microsoft Excel spreadsheet during the workshops, providing an audit trail of the work undertaken. Notes were made in the spreadsheet of all discussions, whether they resulted in a score change or not, and even if they were anecdotal. If a change was made, the evidence presented and the name of the person presenting the evidence was recorded.
3.3.1 Changing the nationally derived source-pathway-receptor scores
Upon presentation of evidence at the workshops it was possible to alter the pressure, pathway and receptor scores. The rules governing these score changes are described below, accompanied by examples of changes made. At the conclusion of this step an overall interim risk score was derived.
3.3.1.1 Quantitative pressures
Evidence that could be accepted to change the quantitative pressure scores included:
• groundwater modelling results;
• local abstraction licence investigations;
• AMP3/4 impact assessments;
• Habitats Directive Review of Consents assessments.
The way evidence presented could change the scores is indicated in Table 3.9.
Science Report – Methodology for the assessment of significant damage at wetlands 19
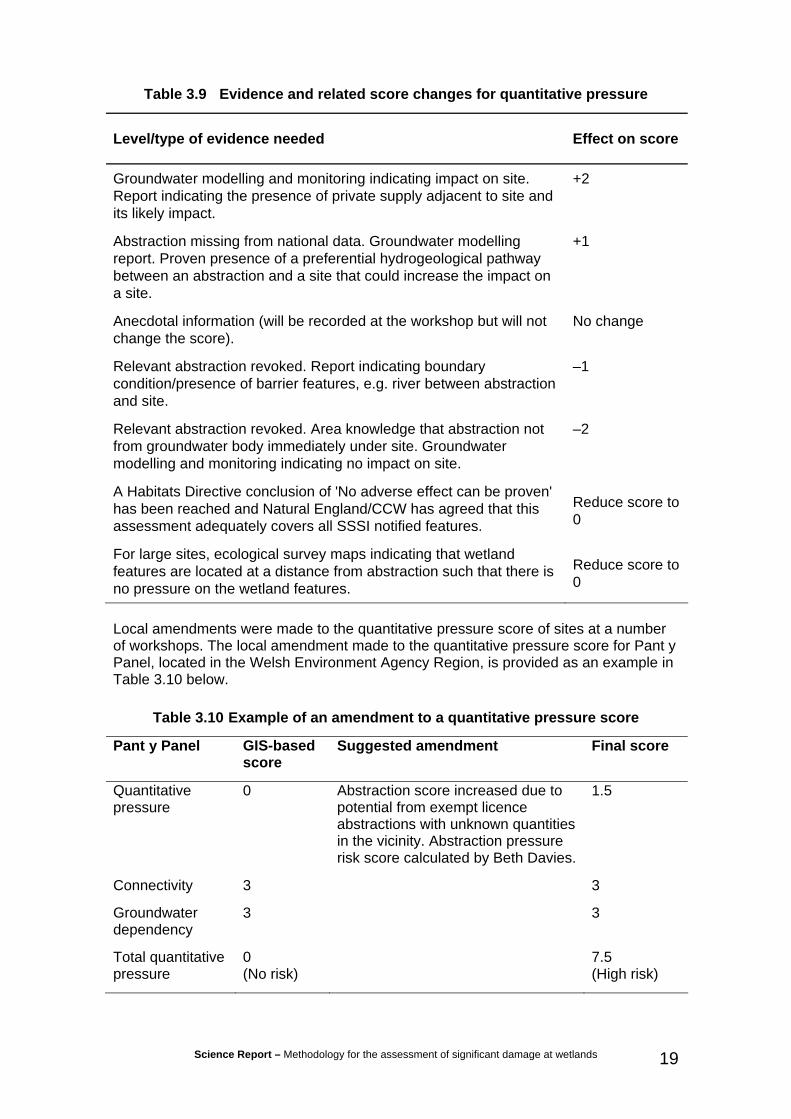
Table 3.9 Evidence and related score changes for quantitative pressure
Level/type of evidence needed Effect on score
Groundwater modelling and monitoring indicating impact on site. Report indicating the presence of private supply adjacent to site and its likely impact.
+2
Abstraction missing from national data. Groundwater modelling report. Proven presence of a preferential hydrogeological pathway between an abstraction and a site that could increase the impact on a site.
+1
Anecdotal information (will be recorded at the workshop but will not change the score).
No change
Relevant abstraction revoked. Report indicating boundary condition/presence of barrier features, e.g. river between abstraction and site.
–1
Relevant abstraction revoked. Area knowledge that abstraction not from groundwater body immediately under site. Groundwater modelling and monitoring indicating no impact on site.
A Habitats Directive conclusion of 'No adverse effect can be proven' has been reached and Natural England/CCW has agreed that this assessment adequately covers all SSSI notified features.
For large sites, ecological survey maps indicating that wetland features are located at a distance from abstraction such that there is no pressure on the wetland features.
–2
Reduce score to 0
Reduce score to 0
Local amendments were made to the quantitative pressure score of sites at a number of workshops. The local amendment made to the quantitative pressure score for Pant y Panel, located in the Welsh Environment Agency Region, is provided as an example in Table 3.10 below.
Table 3.10 Example of an amendment to a quantitative pressure score
Pant y Panel GIS-based score
Suggested amendment Final score
Quantitative pressure
0 Abstraction score increased due to potential from exempt licence abstractions with unknown quantities in the vicinity. Abstraction pressure risk score calculated by Beth Davies.
1.5
Connectivity 3 3
Groundwater dependency
3 3
Total quantitative pressure
0 (No risk)
7.5 (High risk)
Science Report – Methodology for the assessment of significant damage at wetlands 20
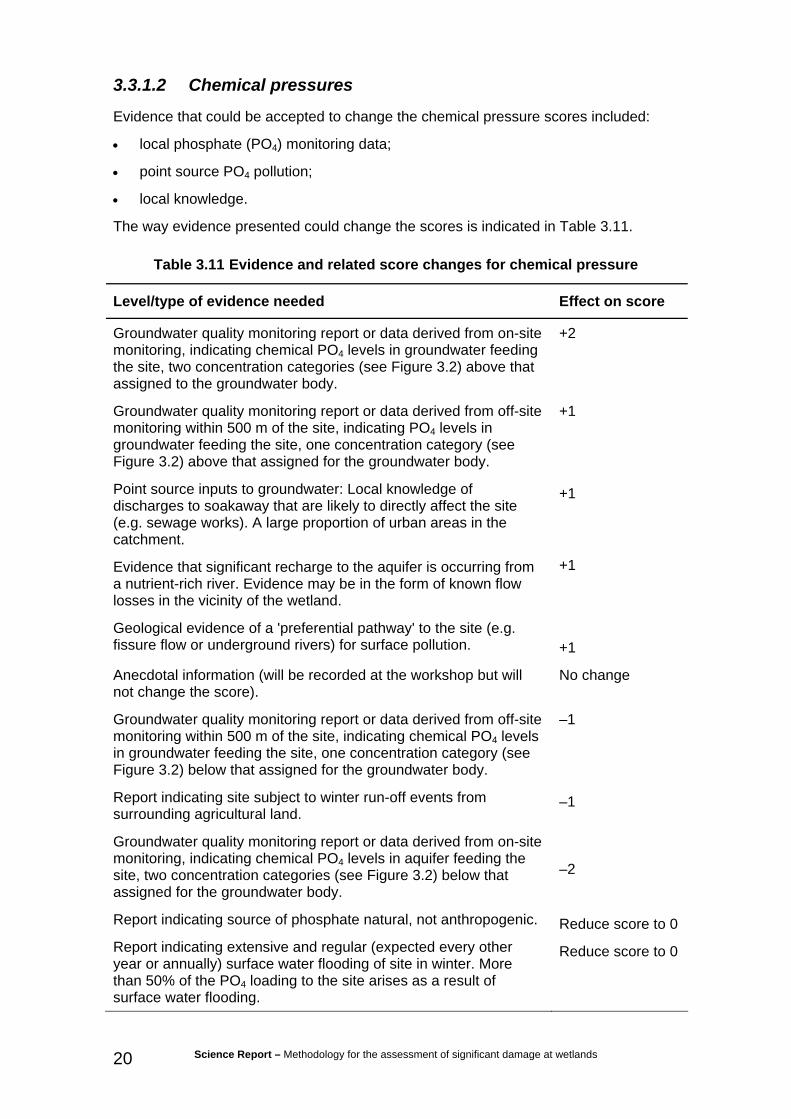
3.3.1.2 Chemical pressures
Evidence that could be accepted to change the chemical pressure scores included:
• local phosphate (PO4) monitoring data;
• point source PO4 pollution;
• local knowledge.
The way evidence presented could change the scores is indicated in Table 3.11.
Table 3.11 Evidence and related score changes for chemical pressure
Level/type of evidence needed Effect on score
Groundwater quality monitoring report or data derived from on-site monitoring, indicating chemical PO4 levels in groundwater feeding the site, two concentration categories (see Figure 3.2) above that assigned to the groundwater body.
+2
Groundwater quality monitoring report or data derived from off-site monitoring within 500 m of the site, indicating PO4 levels in groundwater feeding the site, one concentration category (see Figure 3.2) above that assigned for the groundwater body.
Point source inputs to groundwater: Local knowledge of discharges to soakaway that are likely to directly affect the site (e.g. sewage works). A large proportion of urban areas in the catchment.
Evidence that significant recharge to the aquifer is occurring from a nutrient-rich river. Evidence may be in the form of known flow losses in the vicinity of the wetland.
Geological evidence of a 'preferential pathway' to the site (e.g. fissure flow or underground rivers) for surface pollution.
+1
+1
+1
+1
Anecdotal information (will be recorded at the workshop but will not change the score).
No change
Groundwater quality monitoring report or data derived from off-site monitoring within 500 m of the site, indicating chemical PO4 levels in groundwater feeding the site, one concentration category (see Figure 3.2) below that assigned for the groundwater body.
Report indicating site subject to winter run-off events from surrounding agricultural land.
–1
–1
Groundwater quality monitoring report or data derived from on-site monitoring, indicating chemical PO4 levels in aquifer feeding the site, two concentration categories (see Figure 3.2) below that assigned for the groundwater body.
Report indicating source of phosphate natural, not anthropogenic.
Report indicating extensive and regular (expected every other year or annually) surface water flooding of site in winter. More than 50% of the PO4 loading to the site arises as a result of surface water flooding.
–2
Reduce score to 0
Reduce score to 0
Science Report – Methodology for the assessment of significant damage at wetlands 21
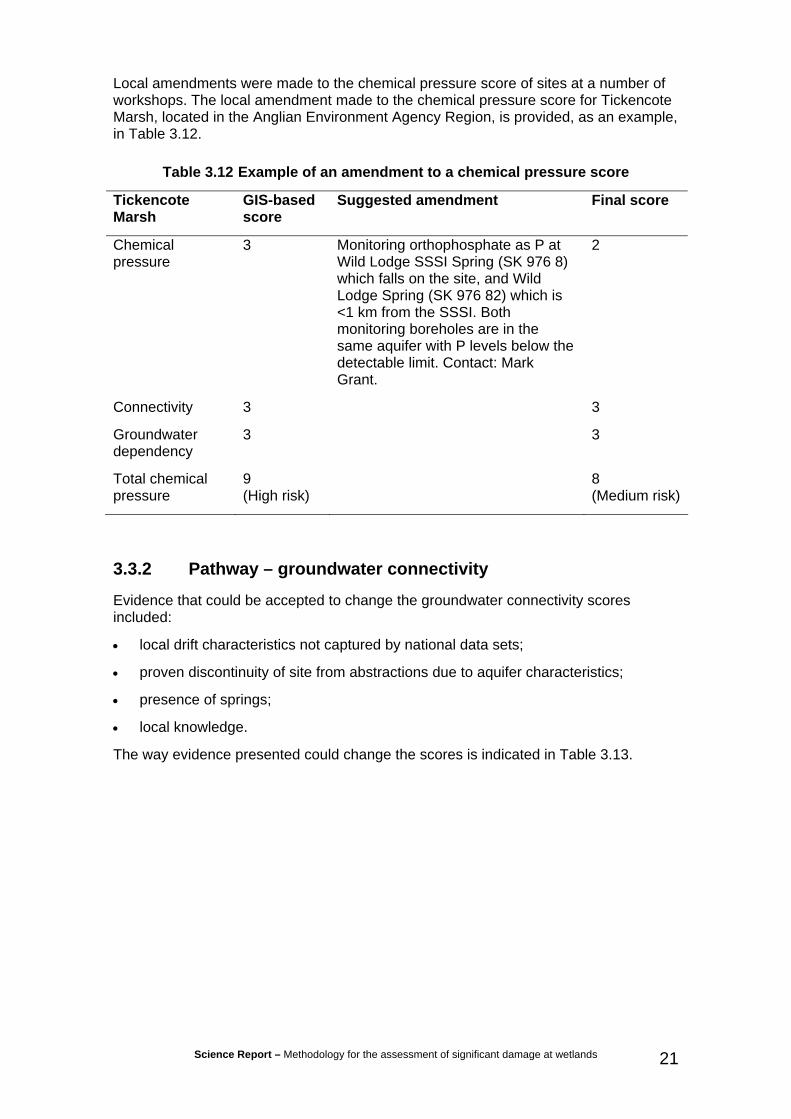
Local amendments were made to the chemical pressure score of sites at a number of workshops. The local amendment made to the chemical pressure score for Tickencote Marsh, located in the Anglian Environment Agency Region, is provided, as an example, in Table 3.12.
Table 3.12 Example of an amendment to a chemical pressure score
Tickencote Marsh
GIS-based score
Suggested amendment Final score
Chemical pressure
3 Monitoring orthophosphate as P at Wild Lodge SSSI Spring (SK 976 8) which falls on the site, and Wild Lodge Spring (SK 976 82) which is <1 km from the SSSI. Both monitoring boreholes are in the same aquifer with P levels below the detectable limit. Contact: Mark Grant.
2
Connectivity 3 3
Groundwater dependency
3 3
Total chemical pressure
9 (High risk)
8 (Medium risk)
3.3.2 Pathway – groundwater connectivity
Evidence that could be accepted to change the groundwater connectivity scores included:
• local drift characteristics not captured by national data sets;
• proven discontinuity of site from abstractions due to aquifer characteristics;
• presence of springs;
• local knowledge.
The way evidence presented could change the scores is indicated in Table 3.13.
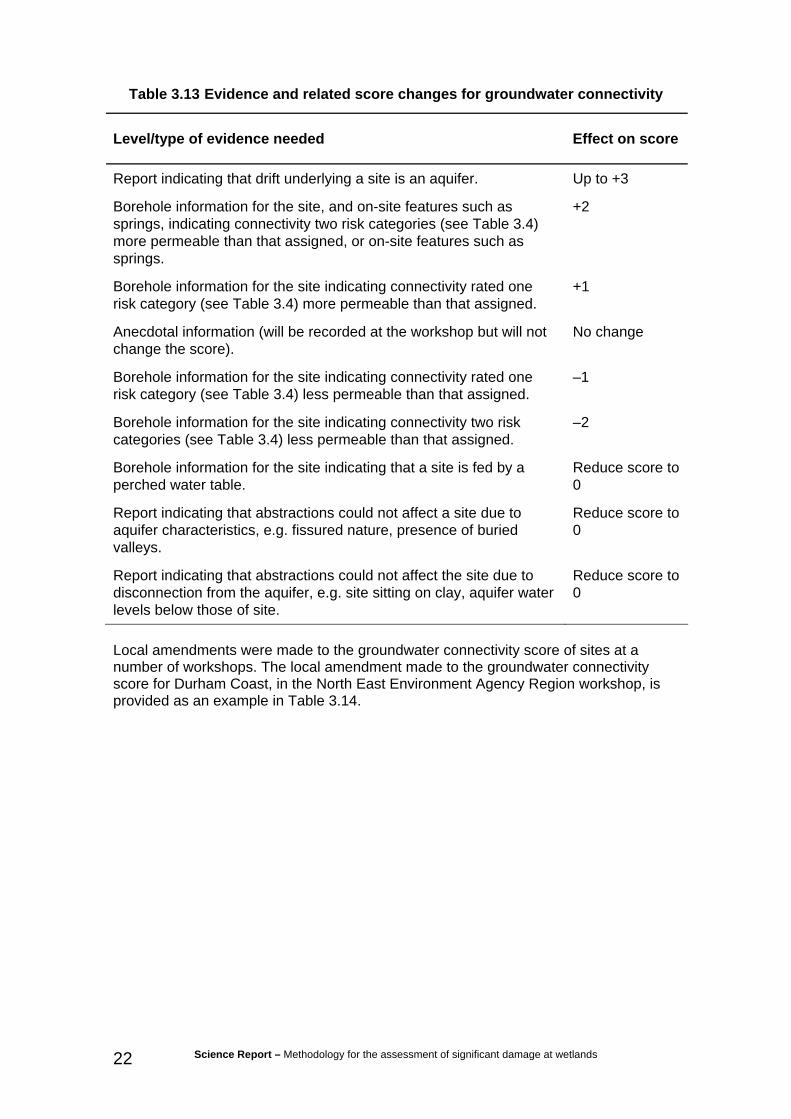
Science Report – Methodology for the assessment of significant damage at wetlands 22
Table 3.13 Evidence and related score changes for groundwater connectivity
Level/type of evidence needed Effect on score
Report indicating that drift underlying a site is an aquifer. Up to +3
Borehole information for the site, and on-site features such as springs, indicating connectivity two risk categories (see Table 3.4) more permeable than that assigned, or on-site features such as springs.
+2
Borehole information for the site indicating connectivity rated one risk category (see Table 3.4) more permeable than that assigned.
+1
Anecdotal information (will be recorded at the workshop but will not change the score).
No change
Borehole information for the site indicating connectivity rated one risk category (see Table 3.4) less permeable than that assigned.
–1
Borehole information for the site indicating connectivity two risk categories (see Table 3.4) less permeable than that assigned.
–2
Borehole information for the site indicating that a site is fed by a perched water table.
Reduce score to 0
Report indicating that abstractions could not affect a site due to aquifer characteristics, e.g. fissured nature, presence of buried valleys.
Reduce score to 0
Report indicating that abstractions could not affect the site due to disconnection from the aquifer, e.g. site sitting on clay, aquifer water levels below those of site.
Reduce score to 0
Local amendments were made to the groundwater connectivity score of sites at a number of workshops. The local amendment made to the groundwater connectivity score for Durham Coast, in the North East Environment Agency Region workshop, is provided as an example in Table 3.14.

Science Report – Methodology for the assessment of significant damage at wetlands 23
Table 3.14 Example of an amendment to a groundwater connectivity score
Durham Coast GIS-based score
Suggested amendment Final score
Quantitative pressure
2.5 2.5
Chemical pressure
3 3
Connectivity 3 Site is on cliff top (approx 6 m high). Sitting on boulder clay. Water may come from the sands and gravels under the site but there is no connection to the groundwater body. Evidence: groundwater contour data and groundwater monitoring data. Contact: Sally Gallagher.
0
Groundwater dependency
3
3
Total quantitative pressure
8.5 (High risk)
0 (No risk)
Total chemical pressure
9 (High risk)
0 (No risk)
3.3.3 Receptor – groundwater dependency of ecological features
Evidence that could be accepted to change the receptor (ecological sensitivity) scores included:
• sites for which notified features are habitats but NVC communities can also be identified;
• communities contributing to the European designation of a site (Natura 2000 feature) but which are not notified SSSI features.
The way evidence presented could change the scores is indicated in Table 3.15.
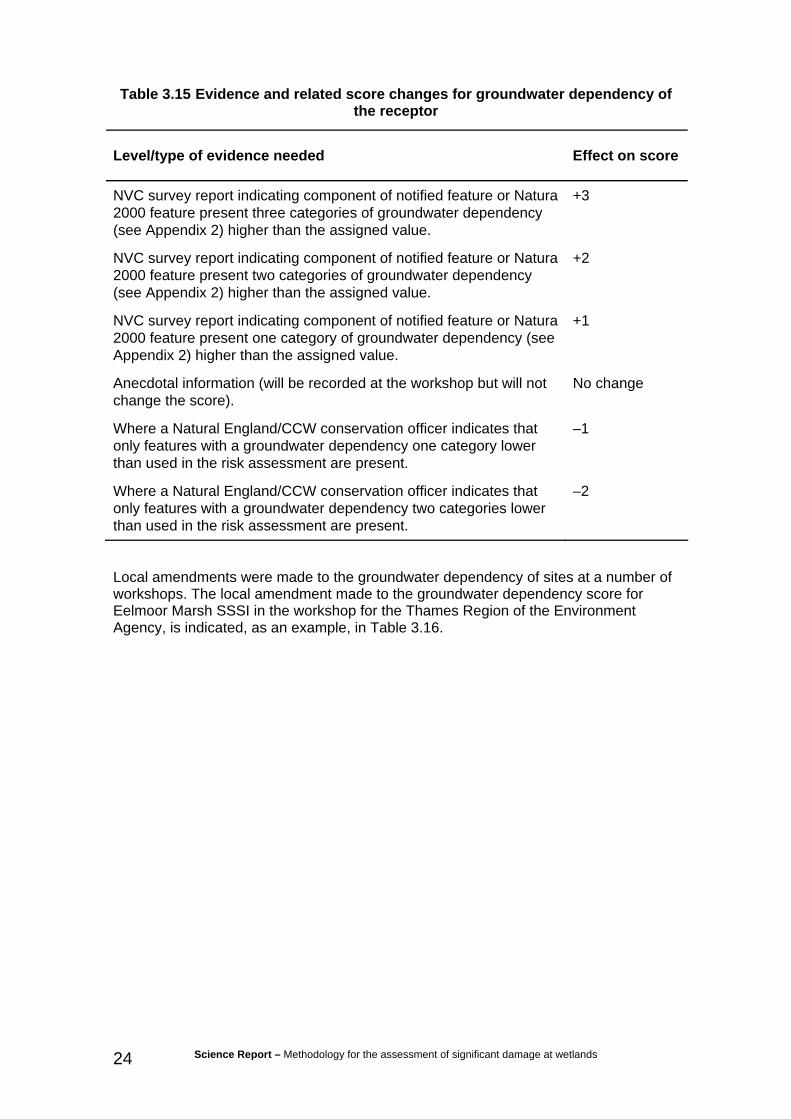
Science Report – Methodology for the assessment of significant damage at wetlands 24
Table 3.15 Evidence and related score changes for groundwater dependency of the receptor
Level/type of evidence needed Effect on score
NVC survey report indicating component of notified feature or Natura 2000 feature present three categories of groundwater dependency (see Appendix 2) higher than the assigned value.
+3
NVC survey report indicating component of notified feature or Natura 2000 feature present two categories of groundwater dependency (see Appendix 2) higher than the assigned value.
+2
NVC survey report indicating component of notified feature or Natura 2000 feature present one category of groundwater dependency (see Appendix 2) higher than the assigned value.
+1
Anecdotal information (will be recorded at the workshop but will not change the score).
No change
Where a Natural England/CCW conservation officer indicates that only features with a groundwater dependency one category lower than used in the risk assessment are present.
–1
Where a Natural England/CCW conservation officer indicates that only features with a groundwater dependency two categories lower than used in the risk assessment are present.
–2
Local amendments were made to the groundwater dependency of sites at a number of workshops. The local amendment made to the groundwater dependency score for Eelmoor Marsh SSSI in the workshop for the Thames Region of the Environment Agency, is indicated, as an example, in Table 3.16.

Science Report – Methodology for the assessment of significant damage at wetlands 25
Table 3.16 Example of an amendment to a groundwater dependency score
Eelmoor Marsh GIS-based score
Suggested amendment Final score
Quantitative pressure
1 1
Chemical pressure
1
Connectivity 3 3
Groundwater dependency
0 One high and one medium groundwater dependency communities are present (M16 and M25, respectively). NVC evidence reported by Russ Money, Natural England.
3
Total quantitative pressure
0 (No risk)
7 (Medium risk)
Total chemical pressure
0 (No risk)
7 (Medium risk)
3.3.4 Taking account of additional pressures in the risk assessment
The nationally derived risk assessment focused on the risk of effects of abstraction in respect of quantitative pressures, and the risk posed by elevated phosphate levels in groundwater for chemical pressures. However, other pressures can also act to affect the condition of the ecological features on a site. Additional pressures were taken into account in the risk assessment by allowing evidence, presented at the workshops, to alter the respective overall interim quantitative or chemical pressure risk scores, that is, the total score derived following any amendments made to the component pressure, connectivity or receptor scores.
The rules governing these score changes are described below, accompanied by examples of changes made.
Additionally, where the risk score, even after modifications described above, does not fully reflect the risk to the site (i.e. an appropriate level of risk cannot be reflected using the rules as set out in Sections 3.3.1, 3.3.2, and 3.3.3 above) the risk score could, in exceptional circumstances, be overridden at this stage by addition of an appropriate score. This only took place following detailed discussions during a workshop.
At the conclusion of this step the final risk score has been derived for both quantitative and chemical pressures.
3.3.4.1 Quantitative risk (non-abstraction)
Evidence that could be accepted to change the overall interim quantitative risk score included:
• drainage;

Science Report – Methodology for the assessment of significant damage at wetlands 26
• water level control.
The way evidence presented could change the scores is indicated in Table 3.17.
Table 3.17 Evidence and related score changes for quantitative risk (non-abstraction)
Level/type of evidence needed Effect on score
Report and monitoring indicating that drainage of water from the groundwater body has caused water levels on the wetland to fall. For example, a road drainage scheme that drains water from the aquifer. Note: it would not include local drainage such as grazing marshes where water levels are reduced for flood defence.
+2
Unreported monitoring data suggesting that groundwater levels and consequently site water levels are reduced by drainage.
+1
Anecdotal information (will be recorded at the workshop but will not change the score).
No change
Water Level Management Plan (WLMP) indicating that water levels are maintained at a high level on site, for example for nature conservation purposes.
–1
Report (e.g. WLMP) and monitoring data indicating that water levels are maintained at a high level on site for nature conservation purposes.
–2
Local amendments were made to the overall quantitative pressure score of sites during some workshops. The local amendment made to the overall quantitative pressure score for Rainworth Lakes, located in the Midlands Environment Agency Region, is provided as an example in Table 3.18.

Science Report – Methodology for the assessment of significant damage at wetlands 27
Table 3.18 Example of an amendment to an overall quantitative pressure score
Rainworth Lakes
GIS-based score
Suggested amendment Final score
Connectivity 3 3
Groundwater dependency
1 1
Quantitative pressure
2 Water company abstraction licence within 2 km. When they pump the springs run dry. Evidence: Reports 'Rainworth Lakes AMP4 scoping document' ESI/'Rainworth Lakes Low Flows investigation Study' SRK. Contact: Monica Garcia.
3
Quantitative local modifier
N/A There is clear documented evidence via AMP4. AMP4 reports there are abstractions impacting on this site but methodology states that site should be medium risk so a local modifier has been added to modify the score to high. Note: A borehle is being put in on the site under AMP4 as a compensation borehole – this will not be sustainable. Site is at risk.
1
Total quantitative pressure
6 (Medium risk)
8 (High risk)
3.3.4.2 Chemical pressure (non-PO4)
Evidence that could be accepted to change the overall interim chemical risk scores included:
• pesticides;
• nitrates;
• non-PO4 point source pollution (e.g. septic tank);
• local non-PO4 monitoring data.
The way evidence presented could change the scores is indicated in Table 3.19.

Science Report – Methodology for the assessment of significant damage at wetlands 28
Table 3.19 Evidence and related score changes for the overall chemical risk (non-PO4)
Level/type of evidence needed Effect on score
Report of an investigation into the relevant chemical pressure in the groundwater, which concludes that there is an affect causing ecological damage on the site. Based on on-site monitoring.
+2
Data from off-site monitoring indicating that elevated levels of the relevant chemical are present in the groundwater feeding in to the site. Other data (e.g. septic tank locations) indicating a significant risk to the site.
+1
Anecdotal information No change
Not possible –1
Not possible –2 Local amendments were made to the overall chemical pressure score of sites during some workshops. The local amendment made to the overall chemical pressure score for Cors Crymlyn/Crymlyn Bog, located in the Welsh Environment Agency Region, is provided, as an example, in Table 3.20.
Table 3.20 Example of an amendment to an overall chemical pressure score
Cors Crymlyn/ Crymlyn Bog
GIS-based score
Suggested amendment Final score
Connectivity 3 3
Groundwater dependency
3 3
Chemical pressure
1 1
Chemical local modifier
N/A 2
Total chemical pressure
7 (Medium risk)
Hyper-enriched leachate from an old tip west of the site is entering the groundwater. Other List 1 and List 2 substances also found. Former BP oil refinery to north of site. Nitrogen- rich leachate from north west of site. Evidence: Alistair Headley (2005) Enrichment by nitrogen – pathway by groundwater.
9 (High risk)
3.3.5 Scoring
The scoring system for the risk assessment, which indicates where local knowledge can influence scores and where additional pressures influence scores, is summarised in Tables 3.21 and 3.22 for quantitative and chemical pressures, respectively.
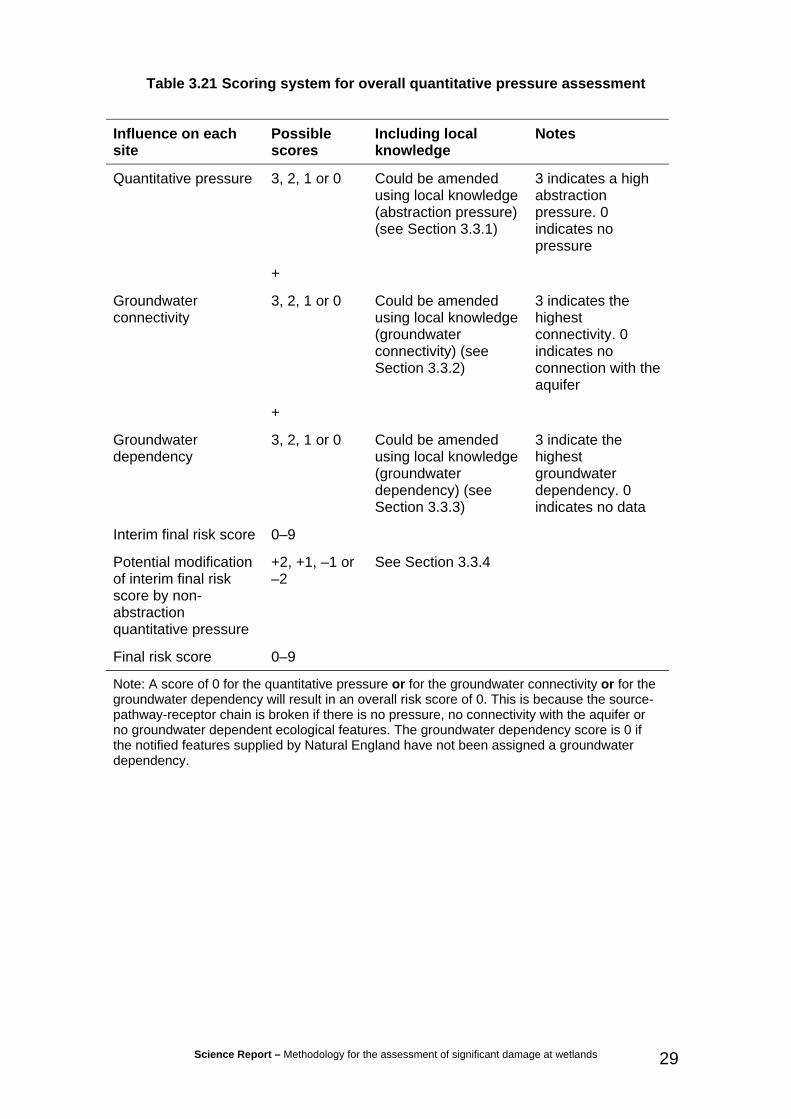
Science Report – Methodology for the assessment of significant damage at wetlands 29
Table 3.21 Scoring system for overall quantitative pressure assessment
Influence on each site
Possible scores
Including local knowledge
Notes
Quantitative pressure 3, 2, 1 or 0 Could be amended using local knowledge (abstraction pressure) (see Section 3.3.1)
3 indicates a high abstraction pressure. 0 indicates no pressure
+
Groundwater connectivity
3, 2, 1 or 0 Could be amended using local knowledge (groundwater connectivity) (see Section 3.3.2)
3 indicates the highest connectivity. 0 indicates no connection with the aquifer
+
Groundwater dependency
3, 2, 1 or 0 Could be amended using local knowledge (groundwater dependency) (see Section 3.3.3)
3 indicate the highest groundwater dependency. 0 indicates no data
Interim final risk score 0–9
Potential modification of interim final risk score by non-abstraction quantitative pressure
+2, +1, –1 or –2
See Section 3.3.4
Final risk score 0–9
Note: A score of 0 for the quantitative pressure or for the groundwater connectivity or for the groundwater dependency will result in an overall risk score of 0. This is because the source-pathway-receptor chain is broken if there is no pressure, no connectivity with the aquifer or no groundwater dependent ecological features. The groundwater dependency score is 0 if the notified features supplied by Natural England have not been assigned a groundwater dependency.

Science Report – Methodology for the assessment of significant damage at wetlands 30
Table 3.22 Scoring system for overall chemical pressure assessment
Influence on each site
Possible scores
Including local knowledge
Notes
Chemical pollution pressure
3, 2, 1 or 0 Could be amended using local knowledge (chemical pollution – PO4 pressure) (see Section 3.3.1)
3 indicates a high pressure. 0 indicates no pressure
+
Groundwater connectivity
3, 2, 1 or 0 Could be amended using local knowledge (groundwater connectivity) (see Section 3.3.2)
3 indicates the highest connectivity. 0 indicates no connection with the aquifer
+
Groundwater dependency
3, 2, 1 or 0 Could be amended using local knowledge (groundwater dependency) (see Section 3.3.3)
3 indicates the highest groundwater dependency. 0 indicates no data
Interim final risk score 0–9
Potential modification of interim final risk score by non-PO4 chemical pressure
+2, +1, –1 or –2
See Section 3.3.4
Final risk score 0–9
Note: A score of 0 for chemical pollution, groundwater connectivity or groundwater dependency gives an overall risk score of 0. The groundwater dependency score is 0, if the notified features supplied by Natural England have not been assigned a groundwater dependency).
A summary of the numbers of wetlands falling into each of the no/low risk, moderate risk and high risk categories following the initial GIS-based screen, following amendment using local knowledge and following amendment for other quantitative and chemical pressures is presented in Tables 3.23 and 3.24.
Final risk maps, following local amendment, are presented in Figures 3.5 and 3.6 for quantitative and chemical risk for England and Wales, respectively.

Science Report – Methodology for the assessment of significant damage at wetlands 31
Table 3.23 Summary of sites subject to quantitative pressure
Risk National GIS risk assessment
Following amendment using local knowledge
Following amendment for
other quantitative pressures
High 80 63 65
Medium 322 365 363
Low 966 940 940
Total 1368 1368 1368
Table 3.24 Summary of sites subject to chemical pressure
Risk National GIS risk assessment
Following amendment using local knowledge
Following amendment for other chemical
pressures
High 131 112 117
Medium 870 886 882
Low 367 370 369
Total 1368 1368 1368

Science Report – Methodology for the assessment of significant damage at wetlands 32
Figure 3.5 Map of quantitative risk of significant damage to wetlands in England and Wales

Science Report – Methodology for the assessment of significant damage at wetlands 33
Figure 3.6 Map of chemical risk of significant damage to wetlands in England and Wales

Science Report – Methodology for the assessment of significant damage at wetlands 34
4 National GIS screening model: alternative scenarios
4.1 Source analysis
4.1.1 Alternative quantitative pressure analysis
The groundwater body abstraction pressure map, described in Section 3.2.1, reflects the abstraction pressure within the groundwater body as a whole (Environment Agency, internal publication1). The recharge circles data, also described in Section 3.2.1, provide an indication of the possible range of influence of an abstraction based on the size of the abstraction and the associated recharge (Environment Agency, internal publication2)
Once it had been decided to use the groundwater body abstraction pressure map, information from the recharge circles was used to modify the scores in order to obtain an abstraction pressure score that reflects the local conditions at the site. The scores for the groundwater body abstraction pressure layer are based on the groundwater body status assigned from the WFD groundwater body abstraction pressure risk assessment, shown in Table 3.1. A number of different scoring configurations for the recharge circles data were trialled.
The different scoring configurations considered for recharge circles were:
1. Maximum percentage area covered by recharge circles (multiple groundwater bodies).
2. Maximum and minimum percentage area covered by recharge circles (multiple groundwater bodies).
3. Intersecting recharge circles.
Approaches 1 and 2 compare the percentage area of the groundwater body covered by recharge circles with the percentage area of the buffered wetland covered by recharge circles. Table 3.2 in Section 3.2.1, shows the modification made to the groundwater body abstraction pressure score based on recharge circles analysis. This is the same for both scenarios. The two approaches differ in situations where a site over lies more than one groundwater body. This is the case for 304 sites.
Scenario 1
Scenario 1 is based on the worst case scenario. The groundwater body with the highest percentage cover of recharge circles is used in the comparison. This is consistent with the approach used for the groundwater body abstraction pressure layer.
Scenario 2
In scenario 2, both the highest and lowest percentage covers of the coincident groundwater bodies are calculated. The corresponding recharge circle modification is calculated for both the minimum and maximum groundwater body abstraction coverage using the relationships in Table 3.2. If the modification scores are in the same direction (i.e. both positive or both negative), then the smaller of the two is used to modify the groundwater body abstraction pressure score. If the modification scores are in different
Science Report – Methodology for the assessment of significant damage at wetlands 35
directions (i.e. one is positive and the other is negative or zero), then no modification is made to the groundwater body abstraction pressure score.
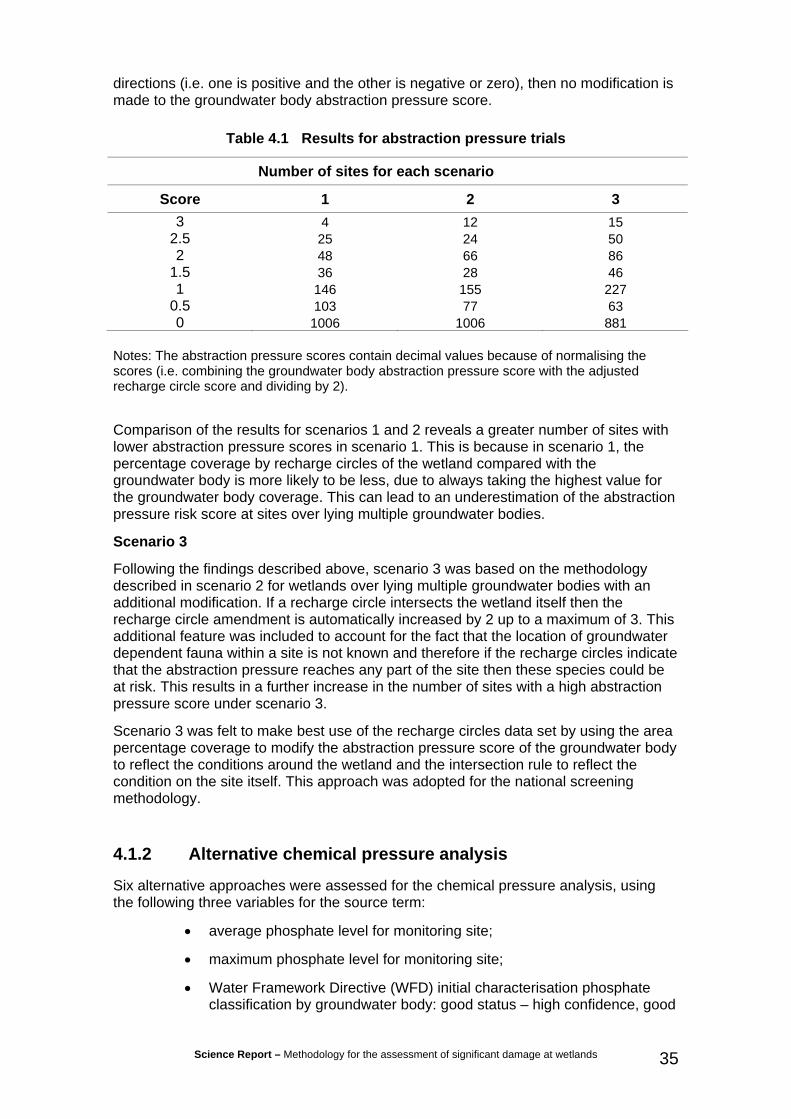
Table 4.1 Results for abstraction pressure trials
Number of sites for each scenario
Score 1 2 3 3 4 12 15
2.5 25 24 50 2 48 66 86
1.5 36 28 46 1 146 155 227
0.5 103 77 63 0 1006 1006 881
Notes: The abstraction pressure scores contain decimal values because of normalising the scores (i.e. combining the groundwater body abstraction pressure score with the adjusted recharge circle score and dividing by 2).
Comparison of the results for scenarios 1 and 2 reveals a greater number of sites with lower abstraction pressure scores in scenario 1. This is because in scenario 1, the percentage coverage by recharge circles of the wetland compared with the groundwater body is more likely to be less, due to always taking the highest value for the groundwater body coverage. This can lead to an underestimation of the abstraction pressure risk score at sites over lying multiple groundwater bodies.
Scenario 3
Following the findings described above, scenario 3 was based on the methodology described in scenario 2 for wetlands over lying multiple groundwater bodies with an additional modification. If a recharge circle intersects the wetland itself then the recharge circle amendment is automatically increased by 2 up to a maximum of 3. This additional feature was included to account for the fact that the location of groundwater dependent fauna within a site is not known and therefore if the recharge circles indicate that the abstraction pressure reaches any part of the site then these species could be at risk. This results in a further increase in the number of sites with a high abstraction pressure score under scenario 3.
Scenario 3 was felt to make best use of the recharge circles data set by using the area percentage coverage to modify the abstraction pressure score of the groundwater body to reflect the conditions around the wetland and the intersection rule to reflect the condition on the site itself. This approach was adopted for the national screening methodology.
4.1.2 Alternative chemical pressure analysis
Six alternative approaches were assessed for the chemical pressure analysis, using the following three variables for the source term:
• average phosphate level for monitoring site;
• maximum phosphate level for monitoring site;
• Water Framework Directive (WFD) initial characterisation phosphate classification by groundwater body: good status – high confidence, good
Science Report – Methodology for the assessment of significant damage at wetlands 36
status – low confidence, poor status – low confidence and poor status – high confidence.
Method 1: Interpolation of data
The phosphate data were interpolated using inverse distance weighting in a GIS. The resulting surfaces were compared with the WFD phosphate classification map. Initially the maxima surface appeared the most useful variable to adopt for the risk assessment as it exhibits some signal across the high, medium and low classes, while representing the worst case. By contrast, the other two maps were bland and showed very little structure with the majority of the country covered by low and medium classes. The limitation of this approach is that the interpolation assumes spatial dependence of the data and therefore does not recognise the influence of the hydrogeology in controlling phosphate levels.
Method 2: Average by groundwater body
In this approach the monitoring points were grouped by groundwater body and the groundwater body average was calculated for both the average and maxima for the monitoring sites within the groundwater body. Comparison was made between these maps and the WFD map.
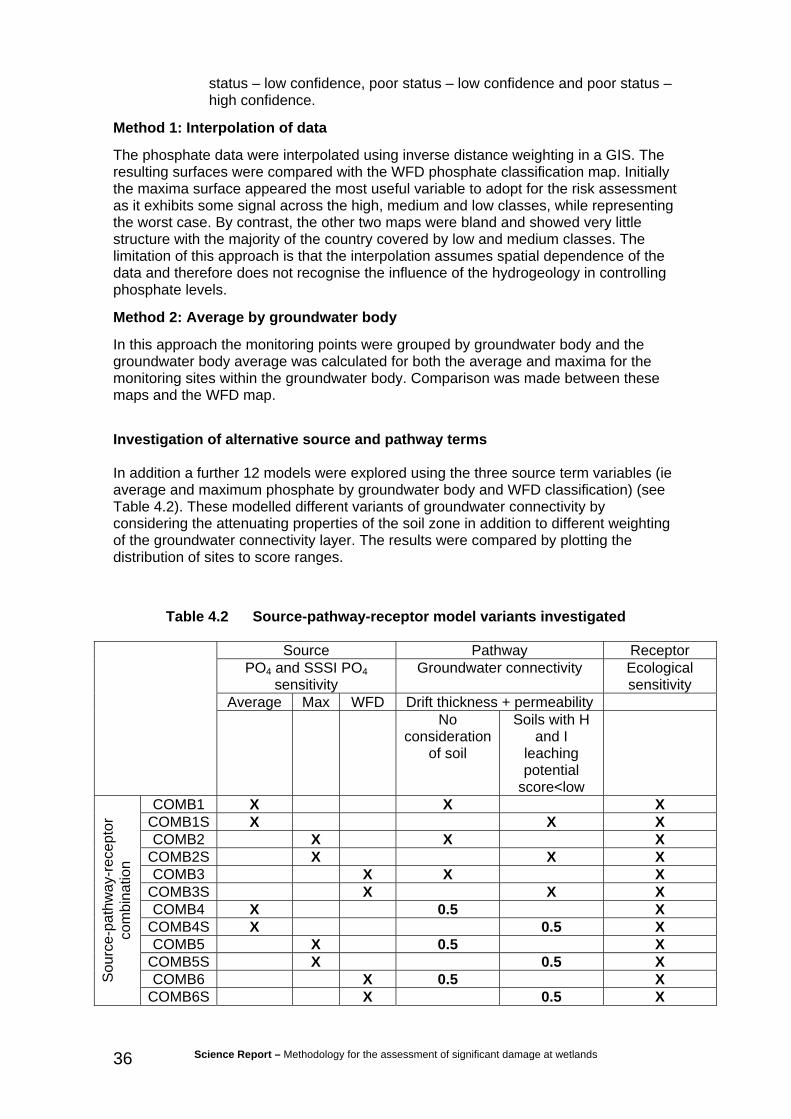
Investigation of alternative source and pathway terms In addition a further 12 models were explored using the three source term variables (ie average and maximum phosphate by groundwater body and WFD classification) (see Table 4.2). These modelled different variants of groundwater connectivity by considering the attenuating properties of the soil zone in addition to different weighting of the groundwater connectivity layer. The results were compared by plotting the distribution of sites to score ranges.
Table 4.2 Source-pathway-receptor model variants investigated
Source Pathway Receptor PO4 and SSSI PO4
sensitivity Groundwater connectivity Ecological
sensitivity Average Max WFD Drift thickness + permeability
No consideration
of soil
Soils with H and I
leaching potential
score<low
COMB1 X X X COMB1S X X X COMB2 X X X
COMB2S X X X COMB3 X X X
COMB3S X X X COMB4 X 0.5 X
COMB4S X 0.5 X COMB5 X 0.5 X
COMB5S X 0.5 X COMB6 X 0.5 X S
ourc
e-pa
thw
ay-r
ecep
tor
com
bina
tion
COMB6S X 0.5 X

Science Report – Methodology for the assessment of significant damage at wetlands 37
For example combination COMB5S is produced by overlaying:
• the groundwater body average of average phosphate levels combined with the phosphate sensitivity of the notified features in the SSSI; with
• the connectivity layer which reflect soil leaching potential which has half the weight of the other two layers; and
• the ecological sensitivity layer.
Results
Table 4.3 shows the proportion of sites within each risk class, defined as very high, high, medium, low and no, for each of the 12 model variants.
Table 4.3 Proportion of sites within risk classes for source-pathway-receptor model variants investigated
Risk class COMB1 COMB1S COMB2 COMB2S COMB3 COMB3S VH 14% 13% 26% 23% 3% 3% H 34% 35% 26% 29% 32% 32% M 36% 36% 33% 33% 43% 43% L 1% 1% 1% 1% 1% 1% N 15% 15% 15% 15% 21% 21% COMB4 COMB4S COMB5 COMB5S COMB6 COMB6S
VH 17% 17% 30% 30% 5% 5% H 40% 40% 34% 34% 33% 33% M 29% 29% 28% 28% 35% 35% L 5% 5% 4% 4% 7% 7% N 15% 15% 15% 15% 21% 21%
Analysis of monitoring data time series
The time series monitoring data were analysed. The analysis considered the count, average, maximum, standard deviation for the whole data set, standard deviation of the maxima above the average (assuming a normal distribution), GRAD-gradient of regression line to identify increasing trends, R2 fit of regression. Grad and R2 were only included for sites with a sufficient number of samples and with a good correlation.
The number of sites with a Max_AB_AV > 2SD = 872 (i.e. 872 sites have a maximum that lies in the top 2.14% of data points – of these four have a statistically significant increasing trend).
The number of sites with a Max_AB_AV > 3SD is 426 (i.e. 426 sites have a maximum that lies in the top 0.13% of data points).
Based on these findings it was decided that the maximum values could not be used for subsequent processing because they were not representative of the situation occurring at the monitoring point (i.e. the standard deviation of the maximum above the average was too great).
4.2 Pathway analysis The previously conducted pilot methodologies for calculating the groundwater connectivity risk were unable to sufficiently differentiate the range of groundwater

Science Report – Methodology for the assessment of significant damage at wetlands 38
connectivity characteristics for different wetland sites. This resulted in a large number of wetlands being assigned the same score (Environment Agency, 2006). The aim of this investigation was to trial different data sets, methodologies, classifications and scoring configurations in order to maximise the information available from the data such that variations could be identified.
A number of alternative data sets were applied in these trials, and reclassified into the main components considered to have an impact on the connectivity of the wetland to groundwater . The data sets and their corresponding classifications are listed below.
Geology:
• Bedrock 50k data set (http://www.bgs.ac.uk/products/digitalmaps/geninfodevelopment.html)
• WFD groundwater body typology maps (Environment Agency, Unpublished)
These data sets differ in terms of what is classified as productive and unproductive strata and have been processed using different methods. The WFD groundwater body typology maps were found to have processing errors at the time of conducting the trials and could not be included in the trial analysis. However, a retrospective analysis was conducted in response to queries raised at the workshops in order to identify any sites with different scores.
These were reclassified into:
1. Primary and Secondary aquifers, i.e. Productive aquifer;
2. 500 m/1 km buffer;
3. Unproductive strata.
A buffer, around the unproductive strata, was introduced to capture potential sites that may be located on unproductive strata but are being fed by water derived from groundwater such as nearby springs. Two buffer distances of 500 m and 1 km were trialled separately and results compared to see which approach was most effective.
Drift thickness:
• GeoSure drift thickness (http://www.bgs.ac.uk/programmes/infoserv/ip/superficialthickness.html)
Only one drift thickness data set was available at the time of this study.
Thickness was simplified into three groupings:
1. 0–5 m thick;
2. 5–10 m thick;
3. >10 m thick.
The reason for taking 5 m as the lower limit is that this is the usual depth for the weathered zone, which offers less protection.
Drift permeability:
• BGS GeoSure drift permeability data set (Lewis et al., 2006)
• SNIFFER drift permeability data set (SNIFFER, 2006)
Detailed descriptions of the data sets can be found in the references cited above; however, the principle difference between GeoSure and SNIFFER drift permeability
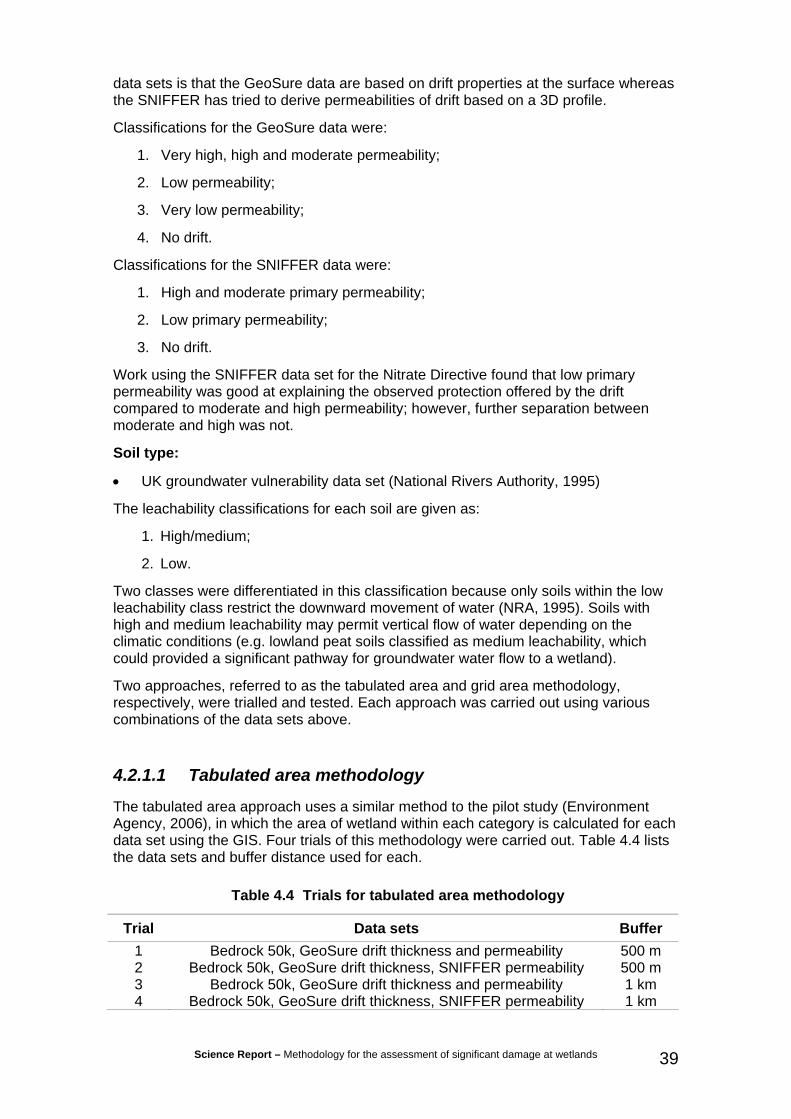
Science Report – Methodology for the assessment of significant damage at wetlands 39
data sets is that the GeoSure data are based on drift properties at the surface whereas the SNIFFER has tried to derive permeabilities of drift based on a 3D profile.
Classifications for the GeoSure data were:
1. Very high, high and moderate permeability;
2. Low permeability;
3. Very low permeability;
4. No drift.
Classifications for the SNIFFER data were:
1. High and moderate primary permeability;
2. Low primary permeability;
3. No drift.
Work using the SNIFFER data set for the Nitrate Directive found that low primary permeability was good at explaining the observed protection offered by the drift compared to moderate and high permeability; however, further separation between moderate and high was not.
Soil type:
• UK groundwater vulnerability data set (National Rivers Authority, 1995)
The leachability classifications for each soil are given as:
1. High/medium;
2. Low.
Two classes were differentiated in this classification because only soils within the low leachability class restrict the downward movement of water (NRA, 1995). Soils with high and medium leachability may permit vertical flow of water depending on the climatic conditions (e.g. lowland peat soils classified as medium leachability, which could provided a significant pathway for groundwater water flow to a wetland).
Two approaches, referred to as the tabulated area and grid area methodology, respectively, were trialled and tested. Each approach was carried out using various combinations of the data sets above.
4.2.1.1 Tabulated area methodology
The tabulated area approach uses a similar method to the pilot study (Environment Agency, 2006), in which the area of wetland within each category is calculated for each data set using the GIS. Four trials of this methodology were carried out. Table 4.4 lists the data sets and buffer distance used for each.
Table 4.4 Trials for tabulated area methodology
Trial Data sets Buffer 1 Bedrock 50k, GeoSure drift thickness and permeability 500 m 2 Bedrock 50k, GeoSure drift thickness, SNIFFER permeability 500 m 3 Bedrock 50k, GeoSure drift thickness and permeability 1 km 4 Bedrock 50k, GeoSure drift thickness, SNIFFER permeability 1 km
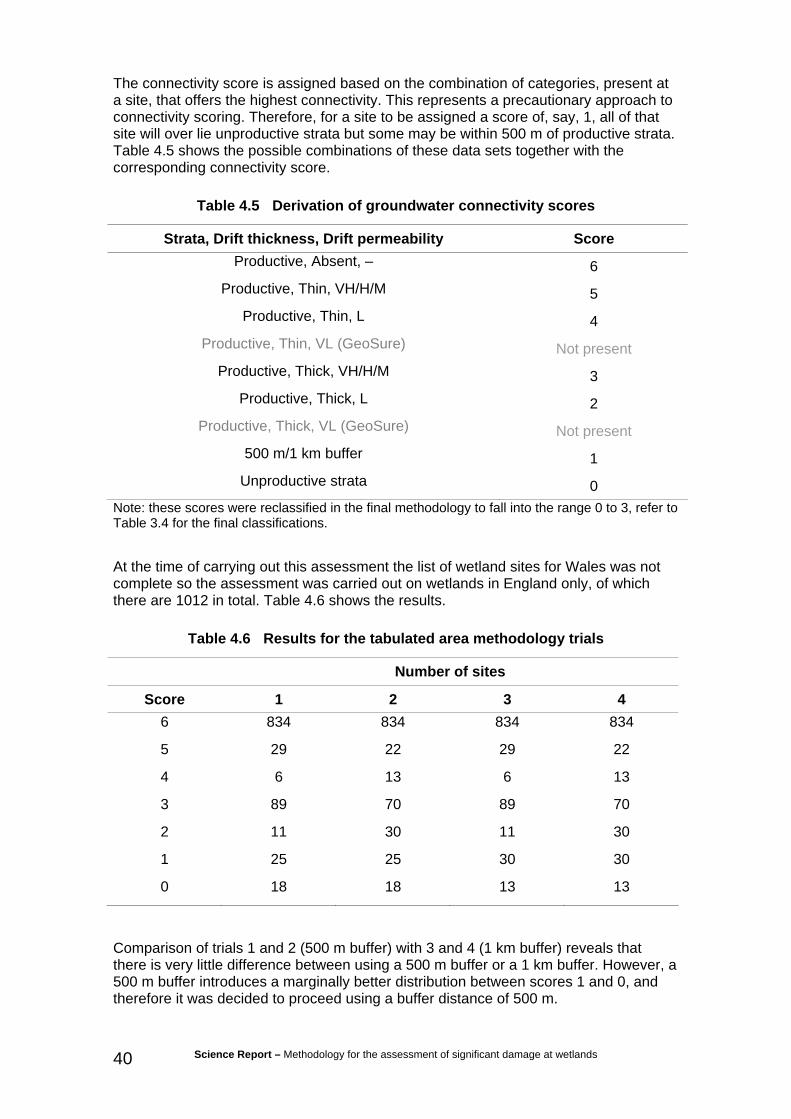
Science Report – Methodology for the assessment of significant damage at wetlands 40
The connectivity score is assigned based on the combination of categories, present at a site, that offers the highest connectivity. This represents a precautionary approach to connectivity scoring. Therefore, for a site to be assigned a score of, say, 1, all of that site will over lie unproductive strata but some may be within 500 m of productive strata. Table 4.5 shows the possible combinations of these data sets together with the corresponding connectivity score.
Table 4.5 Derivation of groundwater connectivity scores
Strata, Drift thickness, Drift permeability Score Productive, Absent, – 6
Productive, Thin, VH/H/M 5 Productive, Thin, L 4
Productive, Thin, VL (GeoSure) Not present Productive, Thick, VH/H/M 3
Productive, Thick, L 2 Productive, Thick, VL (GeoSure) Not present
500 m/1 km buffer 1 Unproductive strata 0
Note: these scores were reclassified in the final methodology to fall into the range 0 to 3, refer to Table 3.4 for the final classifications.
At the time of carrying out this assessment the list of wetland sites for Wales was not complete so the assessment was carried out on wetlands in England only, of which there are 1012 in total. Table 4.6 shows the results.
Table 4.6 Results for the tabulated area methodology trials
Number of sites
Score 1 2 3 4 6 834 834 834 834
5 29 22 29 22
4 6 13 6 13
3 89 70 89 70
2 11 30 11 30
1 25 25 30 30
0 18 18 13 13
Comparison of trials 1 and 2 (500 m buffer) with 3 and 4 (1 km buffer) reveals that there is very little difference between using a 500 m buffer or a 1 km buffer. However, a 500 m buffer introduces a marginally better distribution between scores 1 and 0, and therefore it was decided to proceed using a buffer distance of 500 m.

Science Report – Methodology for the assessment of significant damage at wetlands 41
Trials 2 and 4 using the SNIFFER drift permeability data show a slightly better spread of scores over the range 5 to 2 than trials 1 and 3 using the GeoSure data. Further trials will therefore investigate groundwater connectivity using the SNIFFER drift permeability data set. However, despite trialling different data sets this methodology is not able to differentiate the large number of sites with a connectivity score of 6.
A limitation of this approach is that no consideration is given to the spatial distribution of data sets with respect to each other as well as the wetland site. For example, if a site has a score of 6, then some of the site may overlie productive strata and some of the site may have no drift present but the area on productive strata may not be coincident with the area of no drift cover. Therefore an overly high connectivity score will be assigned to this site. This problem was overcome using the grid area methodology.
4.2.1.2 Grid area methodology
The trial grid area methodology combines the data sets in the GIS so that each 50 m grid square is assigned a score based on the major category present from each data set. Table 4.5 shows the data classifications giving rise to each groundwater connectivity score. The groundwater connectivity score for a site is still based on the highest connectivity score present within the wetland. This is because any gap in the drift, or area of high permeability, no matter how large or small, can act as the groundwater connection for the whole site.
The approach was trialled using the bedrock 50k geology data with a 500 m buffer, the GeoSure drift thickness data and the SNIFFER drift permeability data so that results could be compared with the tabulated area results. Table 4.7 shows the results.
Table 4.7 Groundwater connectivity scores as a percentage of total sites
Score Tabulated area Grid area 6 82 86 5 2 2 4 1 1 3 7 5 2 3 2 1 2 2 0 2 1
Notes: The results are given in percentages because the total number of sites analysed by the two methodologies was different due to ongoing changes to the site list during these trials.
The two approaches show a very similar spread of data across the connectivity scores. Slight differences may be the result of the site lists used as well as the methodology applied. The majority of the sites still have a high groundwater connectivity score. Further investigation of this issue revealed that this is the result of their physical location and cannot be altered using these data sets alone.
It was decided to proceed using the grid area method, as this takes into account the spatial distribution of the data sets with respect to each other, and is the more sophisticated approach. An additional data set, the groundwater vulnerability data set, was tested to see whether the leachability of the soil would introduce some differentiation between the most highly connected sites (i.e. those with a connectivity score of 6). The results are shown in Table 4.8.
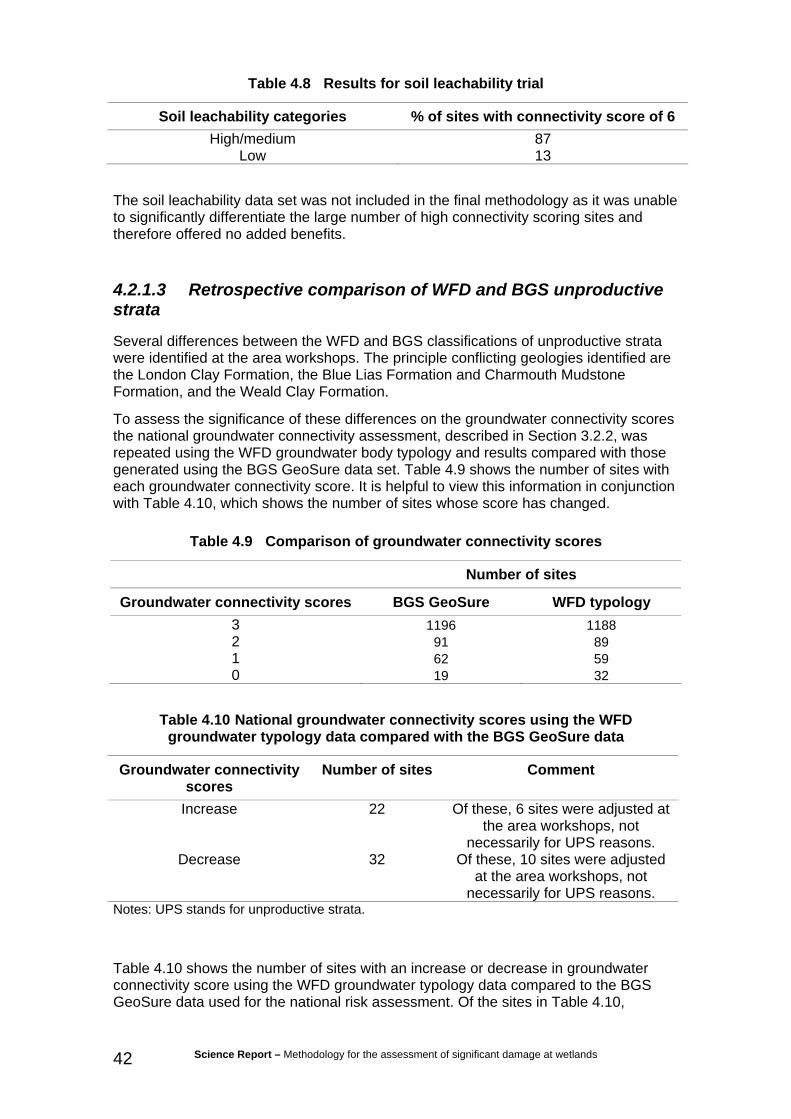
Science Report – Methodology for the assessment of significant damage at wetlands 42
Table 4.8 Results for soil leachability trial
Soil leachability categories % of sites with connectivity score of 6 High/medium 87
Low 13
The soil leachability data set was not included in the final methodology as it was unable to significantly differentiate the large number of high connectivity scoring sites and therefore offered no added benefits.
4.2.1.3 Retrospective comparison of WFD and BGS unproductive strata
Several differences between the WFD and BGS classifications of unproductive strata were identified at the area workshops. The principle conflicting geologies identified are the London Clay Formation, the Blue Lias Formation and Charmouth Mudstone Formation, and the Weald Clay Formation.
To assess the significance of these differences on the groundwater connectivity scores the national groundwater connectivity assessment, described in Section 3.2.2, was repeated using the WFD groundwater body typology and results compared with those generated using the BGS GeoSure data set. Table 4.9 shows the number of sites with each groundwater connectivity score. It is helpful to view this information in conjunction with Table 4.10, which shows the number of sites whose score has changed.
Table 4.9 Comparison of groundwater connectivity scores
Number of sites
Groundwater connectivity scores BGS GeoSure WFD typology 3 1196 1188 2 91 89 1 62 59 0 19 32
Table 4.10 National groundwater connectivity scores using the WFD groundwater typology data compared with the BGS GeoSure data
Groundwater connectivity scores
Number of sites Comment
Increase 22 Of these, 6 sites were adjusted at the area workshops, not
necessarily for UPS reasons. Decrease 32 Of these, 10 sites were adjusted
at the area workshops, not necessarily for UPS reasons.
Notes: UPS stands for unproductive strata.
Table 4.10 shows the number of sites with an increase or decrease in groundwater connectivity score using the WFD groundwater typology data compared to the BGS GeoSure data used for the national risk assessment. Of the sites in Table 4.10,

Science Report – Methodology for the assessment of significant damage at wetlands 43
information provided by staff at the area workshops was used to modify 16 of these sites. This means that 38 sites have a different groundwater connectivity score using the WFD groundwater typology data set. This is a significant number of sites; however, it is important to note that the number of sites whose overall chemical and quantitative risk scores would have been affected may have been less than this due to the nature of the source-pathway-receptor model, where, if any link is broken, the risk is zero.
This issue has been logged and it is recommended that in subsequent reviews of this methodology the WFD groundwater typologies data be used for the assessment of groundwater connection. This is to ensure consistency with the WFD requirements.

Science Report – Methodology for the assessment of significant damage at wetlands 44
5 Limitations The national GIS screening model is not without limitations, due in part to the information available at a national scale and also due to the approach itself. However, in these cases local knowledge of the specific hydrogeological environment was used to modify the abstraction score at the area workshops.
80 sites were judged to be at high risk from quantitative pressures, however, following consideration of local evidence only 63 sites remained in this category (Table 3.23). 131 sites were found to be at high risk from chemical pressures. After consideration of local evidence and chemical pressures other than phosphate 117 sites remained at high risk (Table 3.24). Comments were made against a number of these sites that the assessment has over-estimated the risk. There was therefore much more certainty about the quantitative pressure risks derived during the assessment than the chemical pressure risks. Several issues were identified through the workshops which need to be addressed during future River Basin planning cycles:
• 3D definition of groundwater bodies is often unclear, which means dependency is hard to establish even for sites that do sit on groundwater bodies.
• Many important sites are dependent on aquifers that occur on groundwater currently classified as “unproductive strata”, which means that they fail to qualify for WFD measures, even if they are damaged by groundwater-related pressures.
• For a number of sites, drainage and land use changes (e.g. forestry) affects the site condition much more than impacts from abstraction.
• Abstraction may affect a small part of some large sites, whilst other pressures may affect an entirely different part of the site. The risk assessment, however, adds these risks together, perhaps over-estimating the risk to the site.
• The risk assessment methodology does not deal well with riverine sites with associated land parcels, or multi-site terrestrial SSSI, which would be better assessed on a site unit scale.
• Many areas of Wales and some areas of England are licence-exempt, making it difficult to establish reliable data on locations and rates of existing abstractions.
• Chemical risk assessments are uncertain with respect to attenuation of phosphate concentrations in groundwater.
• ADAS phosphate loading data appear to overestimate the concentration of phosphate and hence the risk to sites.
5.1 Source – pressures
5.1.1 Quantitative pressures
Revision of the groundwater body abstraction pressure map
The WFD groundwater body abstraction pressure map has been revised since the national screening methodology was carried out. This means that the quantitative risk scores may be inconsistent with the revised maps.
This problem cannot be avoided because of the normal cycle of licensing procedures within the Environment Agency. The methodology uses the best available data at the time of the assessment.
There was some uncertainty over the vertical and horizontal definition of WFD groundwater bodes at the workshops with local experts. Some groundwater bodies did not appear to be “useful” for the risk screening process. In Wales, in particular,
Science Report – Methodology for the assessment of significant damage at wetlands 45
large areas that are geologically heterogeneous have been allocated into a single groundwater body (for example on Anglesey), which means single sites at high risk could cause large areas to be at “poor groundwater status” which are made up of different, non-contiguous aquifers. The 3D definition of groundwater bodies is often unclear, which means dependency is hard to establish even for sites that do sit on groundwater bodies. This was particularly notable in the south west where the Dorset Heaths sit on a complex series of strata and it was not clear at the workshops what was defined as the groundwater body
Unproductive strata in the abstraction pressure map
Unproductive strata in the WFD groundwater body abstraction pressure maps are represented as a single groundwater body unlike the productive strata which are subdivided according to the hydraulic properties of the constituent geology. This causes problems for processing the data because unproductive strata cover large swathes of the country so the abstraction pressure is averaged over the whole area.
The recharge circles data should rectify this problem by identifying wetlands where there appears to be a local abstraction pressure, and in addition local knowledge can be brought in at the area workshops.
Many important sites are dependent on aquifers that occur on groundwater currently classified as “unproductive strata”, which means that they fail to qualify for WFD measures, even if they are damaged by groundwater-related pressures.
Drainage and Land Use impacts
For some sites, local drainage networks and land use changes (e.g. conifer plantations) affect the site condition much more than impacts from abstraction. There are data from Anglesey (Stratford et al, 2007) in particular to demonstrate that forestry plantations are exerting the main impact causing poor site condition. This is likely to occur elsewhere also. It is difficult to deal with these types of issues in the risk screening methodology.
Recharge circles
Recharge circles do not represent the true zone of influence of an abstraction well. For example, if a river is situated between the abstraction and the wetland, then the wetland is unlikely to feel the effect of the abstraction as the river may act as a recharge source to the groundwater body preventing drawdown of water beyond it.
Abstractions maybe close to the wetland but not within the same groundwater body.
In both cases the national methodology cannot identify such sites; however, where ever possible local knowledge was used to modify the results at the area workshops.
Areas exempt from abstraction licensing
There are large areas of Wales, and some areas of the north west of England, which are exempt from groundwater abstraction licensing. Additionally, there are currently licence exempt activities (such as quarry dewatering and trickle irrigation) which therefore do not feature in the national data sets and hence did not contribute to the risk assessment. The licence exempt areas and licence exempt activities mean that reliable data on locations and rates of existing abstractions often do not exist.

Science Report – Methodology for the assessment of significant damage at wetlands 46
Furthermore, there are no mechanisms to control abstractions that are known to have detrimental effects. This highlights the need to bring uncontrolled abstractions into the licensing regime. Where possible, amendments were made to scores at the workshops using local knowledge; however, there will have been abstractions that have still not been reflected in the risk assessment.
5.1.2 Chemical pressures
Phosphate (PO4) data
The monitoring sites are not located in close proximity to the wetlands. Time series data are short, on the whole, with two-thirds of monitoring sites having less than 6 years of data. One-third contain only three samples. There is no comprehensive depth data for phosphate monitoring sites.
Phosphorus loading layer
The issue with the use of phosphorus loading data is that these appear to overestimate the level of phosphate and hence the risk, particularly for upland areas such as Wales.
A revised phosphorus loading layer is currently being developed, which may be available for future use.
As a result of the uncertainty, it is not intended to assign groundwater bodies to poor status for chemical pressure unless there is clear evidence of damage resulting from phosphate (or other chemical) pressure.
Attenuation of phosphate levels in groundwater
The key issue is that there is uncertainty surrounding the relationship between phosphate levels in groundwater in the groundwater body and phosphate levels in groundwater that emerges on a wetland. This is because numerous factors can act to attenuate phosphate levels in groundwater before it emerges on the surface.
Thresholds
With respect to the thresholds chosen for the risk assessment, these were selected to be ecologically meaningful (in that, at the lower end at least, they relate to levels used by Natural England as thresholds for certain aquatic communities). However, they are for surface waters and we are applying them in the groundwater, from where levels will be attenuated. The implication of this is that, even using monitored data, the risk assessment may overestimate the risk of damage to wetlands.
Account also needs to be taken of potential thresholds suggested by Meade et al. (2006), which are considerably lower than those used in this assessment.
This issue needs to be looked at further.
Science Report – Methodology for the assessment of significant damage at wetlands 47
Ecological sensitivity to other chemical pressures
The risk assessment method allowed the chemical pressure risk to be amended to take into account pressures other than phosphate (e.g. pressure from mine water discharge, or from nitrates etc). However, the ecological sensitivity of the vegetation communities to these chemical pressures is uncertain. It is therefore not clear whether the changes made adequately addressed the issue raised.
Unproductive strata
Erroneous results were obtained for the phosphate pressure in unproductive strata. This is because unproductive strata within the groundwater body GIS shapefile comprise a single polygon formed by joining a number of previously non-contiguous polygons representing the distribution of unproductive strata throughout the whole of England and Wales. This caused problems when PO4 monitoring data were used to calculate PO4 risk within each groundwater body, as points falling in the unproductive strata in widely distributed locations influenced the risk in the whole unproductive strata polygon. The erroneous results would be removed by splitting the unproductive strata back into their former constituent parts.
5.2 Pathway
5.2.1 Arial extent of the SNIFFER drift permeability data
The spatial coverage of the SNIFFER drift permeability data set does not extend beyond the terrestrial borders of Scotland, England and Wales; however, some of the wetland sites do. Approximately 100 of the 1012 English sites have greater than 5% of their total area outside of the England and Wales boundary (the full list of Welsh sites was not available at the time of investigating these issues).
In the absence of any data, a precautionary approach has been adopted (i.e. where drift is present it is assumed to be highly permeable for the purpose of assigning an groundwater connectivity score).
5.2.2 Elevation of a site compared to nearby abstractions
There are many parts of England and Wales where an SSSI is elevated, while abstractions in the vicinity are on lower ground. This could result in a break in the connectivity between the aquifer being abstracted and the groundwater feeding groundwater dependent communities on the SSSI (i.e. the groundwater feeding the SSSI may be from a perched aquifer and not part of the groundwater body). Unless this was identified during workshops, this will have resulted in an overestimation of the risk to such sites.
5.3 Receptor There are limitations to the risk assessment with respect to the receptors, and how the assessment method works. These are summarised below.

Science Report – Methodology for the assessment of significant damage at wetlands 48
GWDTE subject to risk assessment
Natural England and the Countryside Council for Wales were asked, at a national level, to provide lists of sites that they believed to be GWDTE to be included in the risk assessment. A total of1368 sites were provided; however, both organisations have indicated that this did not represent the full list of possible GWDTE. Therefore the risk assessment has not currently screened all possible GWDTE in England and Wales against the risk of significant damage and these sites will need to be identified and assessed in due course.
Large sites
The risk assessment method works by summing all the pressures identified, no matter where the pressure may be exerted on a site. Therefore, for large sites, such as the Dyfi SSSI, there may be an issue of abstraction affecting a small part of the site, while arterial land drainage issues may be affecting another, different, small area of the site. These would probably both be relatively minor issues in their own right, but the risk assessment adds the risks together, ultimately suggesting the site is perhaps at greater risk than it is believed to be by conservation agencies.
Locations of groundwater dependent communities on sites
The notified features were provided by the conservation agencies at a site level, not a site unit level, and this resulted in groundwater dependencies being assigned at a site level. However, not all notified groundwater dependent communities will be present on each unit and in some cases site units are geographically widespread. Therefore it is likely that some units are less groundwater dependent than the risk assessment assumes which, when combined with the distribution of abstractions, may result in the risk to a site being overestimated.
Riverine SSSI
A number of riverine SSSIs have been included in the list of GWDTEs. While a river cannot be a GWDTE, land parcels associated with the river can be dependent on groundwater and hence it is legitimate to include these sites in the risk assessment.
The issue is that the risk assessment method does not deal well with these sites. This is because:
• It is the land parcels often included within a riverine SSSI that are the GWDTE element of a site.
• The land parcels are sometimes separated from the main channel.
• There may be large spatial variations in abstraction pressure across this type of site.
• These sites often cross numerous groundwater bodies, which may skew the risk derived.
A similar issue applies to multi-site terrestrial SSSIs such as East Walton and Adcocks Common.
It would have been better to undertake the risk assessment on a site unit scale for these types of sites, rather than just the one assessment. However, this was not

Science Report – Methodology for the assessment of significant damage at wetlands 49
logistically feasible when the assessment was undertaken because of time and budget constraints.
Use of subjectives to assign groundwater dependencies to sites
Notified feature communities are not available for most Welsh SSSI. Therefore, for Welsh peatland SSSI, Countryside Council for Wales (Peter Jones) has assessed the groundwater dependency based on personal knowledge of the sites, assigning each site a subjective score, as indicated in Section 3.2.3. While it would not have been possible to undertake the risk assessment at all without the subjectives, by using these instead of the notified feature communities, some inconsistency is likely to have been introduced to the risk assessment as sites that support the same communities may have been assigned different subjectives.
Lack of groundwater dependency data for species and some NVC communities
Groundwater dependency scores were derived for a range of NVC communities by Natural England (Johan Schutten), and these have been used to assign groundwater dependencies to sites, where these communities are present. However, not all communities were assigned scores. Additionally, no animal or plant species were assigned groundwater dependency scores. Therefore, where sites that had communities or species as notified features that had not been assigned a groundwater dependency score, it was not possible to assign a groundwater dependency to the site overall, and the site score was restricted to 0. This was often the case even where a site appeared, based on hydrogeological criteria, to be supported by an element of groundwater input. Natural England has been asked to consider how this may be addressed.
Science Report – Methodology for the assessment of significant damage at wetlands 50
6 Lessons learned in running participatory decision-making workshops in the Environment Agency
The assessment of wetlands for significant damage using the risk screening approach described here involved a wide variety of participants: national and local specialists in ecology, hydrogeology and hydrology from several organisations (Natural England, Countryside Council for Wales). Both the method and the use of interactive GIS in the workshops was new to most of the participants and organisers. Issues raised at the workshops were recorded in an issues log.
The following are the key issues that the authors want to highlight to help guide future participatory work of this kind:
• Pre-workshop notes were distributed prior to the workshops. Ideally these should be sent out 4–6 weeks before the workshop. It would be good to try to get feedback on some key questions before the first workshop. For example, 'What are the names of the sites that you wish to discuss and revise at the workshop and do you disagree with the quantitative risk score or the chemical risk score?'
• Two pilot workshops were organised prior to the actual local workshops. These helped to iron out initial difficulties. However, we had expected the attendees to pass on messages about the aims of the workshops to other staff in their locality but this proved ineffective and many people arrived not having been briefed. A better means of passing on the aims may have been by distribution of the pre-workshop notes and some follow-up telephone calls to key attendees at each workshop.
Science Report – Methodology for the assessment of significant damage at wetlands 51
7 Next steps This report describes how a list of groundwater dependent terrestrial ecosystems (wetlands) has been screened for risk of significant damage to the ecology of the site due to groundwater pressures. It provides the foundation for the significant damage to groundwater dependent ecosystems test as part of groundwater body classification. The wetlands identified as high risk during this risk assessment will be put forward into the classification scheme during 2007. Where a groundwater body is judged to be at poor status due to significant damage to a groundwater dependent ecosystem, the River Basin Plan may include work as part of a Programme of Measures to reverse the damage to the wetland. This work is still under way and so cannot be described here.
Nevertheless, two issues have been agreed. Firstly, we will rule out those sites that are in favourable condition. But, if the risk assessment gives them a high score, they will be watched for early signs of damage which may not yet have reached the site. Secondly, we will rule out sites in unfavourable condition because of non-groundwater-related pressures such as over-grazing, and local drainage. We will also rule out those sites where:
• A Habitats Directive Review of Consents investigation has concluded no adverse impact from abstractions, as long as this is judged to cover the SSSI features as well as European features. This will not rule out the site from consideration of chemical pressures due to diffuse groundwater pollution, however.
• An investigation has ruled out abstraction impacts as part of a Restoring Sustainable Abstraction scheme (this includes investigations conducted as part of the Water Companies' Periodic Review process)

Science Report – Methodology for the assessment of significant damage at wetlands 52
Appendix 1: Preferred trophic status of NVC communities (from Meade et al., 2006) NVC community or sub-community O M E M1 Sphagnum auriculatum bog pool community + M2 Sphagnum cuspidatum/recurvum bog pool community + M3 Eriophorum angustifolium bog pool community + M4 Carex rostrata–Sphagnum recurvum mire + M5 Carex rostrata–Sphagnum squarrosum mire + M6 Carex echinata–Sphagnum recurvum/auriculatum mire + M7 Carex curta–Sphagnum russowii mire + M8 Carex rostrata–Sphagnum warnstorfii mire + + M9 Carex rostrata–Calliergon cuspidatum/giganteum mire + + M10 Carex dioica–Pinguicula vulgaris mire + + M11 Carex demissa–Saxifraga aizoides mire + M12 Carex saxatilis mire + M13 Schoenus nigricans–Juncus subnodulosus mire + + M14 Schoenus nigricans–Narthecium ossifragum mire + + M15 Scirpus cespitosus–Erica tetralix heath + M16 Erica tetralix–Sphagnum compactum wet heath + M17 Scirpus cespitosus–Eriophorum vaginatum blanket mire + M18 Erica tetralix–Sphagnum papillosum raised and blanket mire + M19 Calluna vulgaris–Eriophorum vaginatum blanket mire + M20 Eriophorum vaginatum blanket and raised bog + M21 Narthecium ossifragum–Sphagnum papillosum valley mire + M22 Juncus subnodulosus–Cirsium palustre fen meadow + + M23 Juncus effusus/acutiflorus–Galium palustre rush pasture + M24 Molinia caerulea–Cirsium dissectum fen meadow + + M25 Molinia caerulea–Potentilla erecta mire + M26 Molinia caerulea–Crepis paludosa mire + + M27 Filipendula ulmaria–Angelica sylvestris mire + + M28 Iris pseudacorus–Filipendula ulmaria mire + + M29 Hypericum elodes–Potamogeton polygonifolius soakaway + + M30 Related vegetation of seasonally inundated habitats + M31 Anthelia julacea–Sphagnum auriculatum spring mire + M32 Philonotis fontana–Saxifraga stellaris spring + M33 Pohlia wahlenbergii var. glacialis spring + M34 Carex demissa–Koenigia islandia flush + M35 Ranunculus omiophyllus–Montia fontana rill + + M36 Lowland springs and stream banks of shaded situations (various) M37 Cratoneuron commutatum–Festuca rubra spring + M38 Cratoneuron commutatum–Carex nigra spring + S1 Carex elata swamp + + S2 Cladium mariscus swamp + + S3 Carex paniculata swamp + + S4 Phragmites australis swamp and reed beds + + S5 Glyceria maxima swamp + S6 Carex riparia swamp + + S7 Carex acutiformis swamp + + S8 Scirpus lacustris ssp. lacustris swamp + + + S9 Carex rostrata swamp + +

Science Report – Methodology for the assessment of significant damage at wetlands 53
NVC community or sub-community O M E S10 Equisetum fluviatile swamp + + + S11 Carex vesicaria swamp + + S12 Typha latifolia swamp + + S13 Typha angustifolia swamp + + S14 Sparganium erectum swamp + + S15 Acorus calamus swamp + S16 Sagittaria sagittifolia swamp + S17 Carex pseudocyperus swamp + + S18 Carex otrubae swamp + S19 Eleocharis palustris swamp + + S20 Scirpus lacustris ssp. tabernaemontani swamp + S21 Scirpus maritimus swamp (+) S22 Glyceria fluitans water margin vegetation + S23 Other water margin vegetation (variable) S24 Phragmites australis–Peucedanum palustre fen + + S25 Phragmites australis–Eupatorium cannabinum tall-herb fen + + S26 Phragmites australis–Urtica dioica tall herb fen + + S27 Carex rostrata–Potentilla palustris fen + + S28 Phalaris arundinacea tall herb fen + W1 Salix cinerea–Galium palustre woodland + + W2 Salix cinerea–Betula pubescens–Phragmites australis woodland + + + W3 Salix pentandra–Carex rostrata woodland + + W4 Betula pubescens–Molinia caerulea woodland + + W5 Alnus glutinosa–Carex paniculata woodland + + W6 Alnus glutinosa–Urtica dioica woodland + W7 Alnus glutinosa–Fraxinus excelsior–Lysimachia nemorum woodland + Note: O – oligotrophic, M – mesotrophic, E – eutrophic Where a community is assigned two categories, the most sensitive category has been used.

Science Report – Methodology for the assessment of significant damage at wetlands 54
Appendix 2: English Nature draft list of NVC communities with associated groundwater dependency ratings (July 2006)
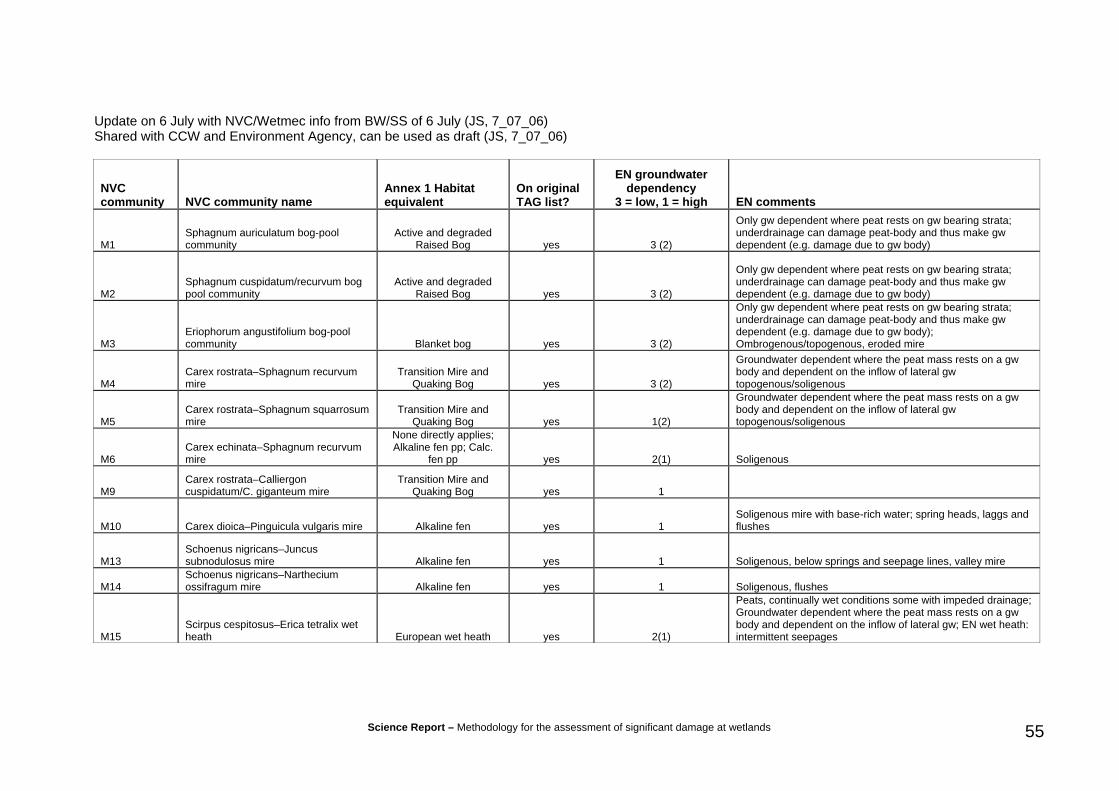
Science Report – Methodology for the assessment of significant damage at wetlands 55
Update on 6 July with NVC/Wetmec info from BW/SS of 6 July (JS, 7_07_06) Shared with CCW and Environment Agency, can be used as draft (JS, 7_07_06)
NVC community NVC community name
Annex 1 Habitat equivalent
On original TAG list?
EN groundwater dependency
3 = low, 1 = high EN comments
M1 Sphagnum auriculatum bog-pool community
Active and degraded Raised Bog yes 3 (2)
Only gw dependent where peat rests on gw bearing strata; underdrainage can damage peat-body and thus make gw dependent (e.g. damage due to gw body)
M2 Sphagnum cuspidatum/recurvum bog pool community
Active and degraded Raised Bog yes 3 (2)
Only gw dependent where peat rests on gw bearing strata; underdrainage can damage peat-body and thus make gw dependent (e.g. damage due to gw body)
M3 Eriophorum angustifolium bog-pool community Blanket bog yes 3 (2)
Only gw dependent where peat rests on gw bearing strata; underdrainage can damage peat-body and thus make gw dependent (e.g. damage due to gw body); Ombrogenous/topogenous, eroded mire
M4 Carex rostrata–Sphagnum recurvum mire
Transition Mire and Quaking Bog yes 3 (2)
Groundwater dependent where the peat mass rests on a gw body and dependent on the inflow of lateral gw topogenous/soligenous
M5 Carex rostrata–Sphagnum squarrosum mire
Transition Mire and Quaking Bog yes 1(2)
Groundwater dependent where the peat mass rests on a gw body and dependent on the inflow of lateral gw topogenous/soligenous
M6 Carex echinata–Sphagnum recurvum mire
None directly applies; Alkaline fen pp; Calc.
fen pp yes 2(1) Soligenous
M9 Carex rostrata–Calliergon cuspidatum/C. giganteum mire
Transition Mire and Quaking Bog yes 1
M10 Carex dioica–Pinguicula vulgaris mire Alkaline fen yes 1 Soligenous mire with base-rich water; spring heads, laggs and flushes
M13 Schoenus nigricans–Juncus subnodulosus mire Alkaline fen yes 1 Soligenous, below springs and seepage lines, valley mire
M14 Schoenus nigricans–Narthecium ossifragum mire Alkaline fen yes 1 Soligenous, flushes
M15 Scirpus cespitosus–Erica tetralix wet heath European wet heath yes 2(1)
Peats, continually wet conditions some with impeded drainage; Groundwater dependent where the peat mass rests on a gw body and dependent on the inflow of lateral gw; EN wet heath: intermittent seepages
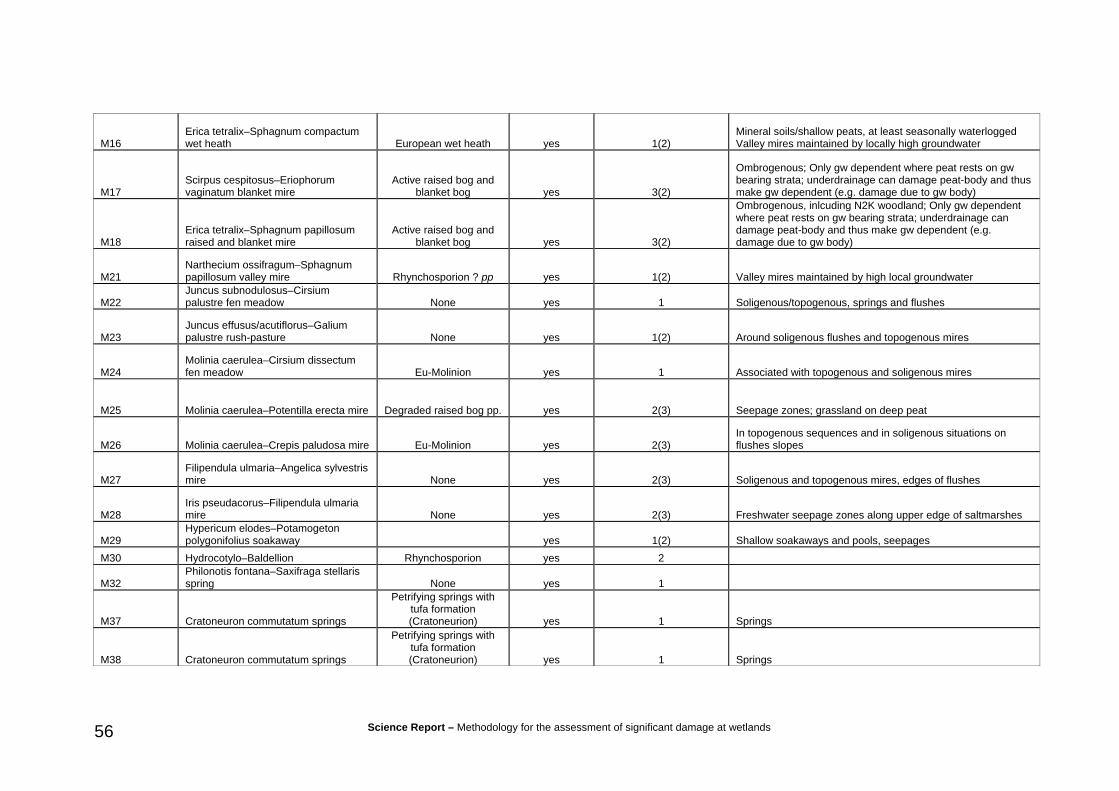
Science Report – Methodology for the assessment of significant damage at wetlands 56
M16 Erica tetralix–Sphagnum compactum wet heath European wet heath yes 1(2)
Mineral soils/shallow peats, at least seasonally waterlogged Valley mires maintained by locally high groundwater
M17 Scirpus cespitosus–Eriophorum vaginatum blanket mire
Active raised bog and blanket bog yes 3(2)
Ombrogenous; Only gw dependent where peat rests on gw bearing strata; underdrainage can damage peat-body and thus make gw dependent (e.g. damage due to gw body)
M18 Erica tetralix–Sphagnum papillosum raised and blanket mire
Active raised bog and blanket bog yes 3(2)
Ombrogenous, inlcuding N2K woodland; Only gw dependent where peat rests on gw bearing strata; underdrainage can damage peat-body and thus make gw dependent (e.g. damage due to gw body)
M21 Narthecium ossifragum–Sphagnum papillosum valley mire Rhynchosporion ? pp yes 1(2) Valley mires maintained by high local groundwater
M22 Juncus subnodulosus–Cirsium palustre fen meadow None yes 1 Soligenous/topogenous, springs and flushes
M23 Juncus effusus/acutiflorus–Galium palustre rush-pasture None yes 1(2) Around soligenous flushes and topogenous mires
M24 Molinia caerulea–Cirsium dissectum fen meadow Eu-Molinion yes 1 Associated with topogenous and soligenous mires
M25 Molinia caerulea–Potentilla erecta mire Degraded raised bog pp. yes 2(3) Seepage zones; grassland on deep peat
M26 Molinia caerulea–Crepis paludosa mire Eu-Molinion yes 2(3) In topogenous sequences and in soligenous situations on flushes slopes
M27 Filipendula ulmaria–Angelica sylvestris mire None yes 2(3) Soligenous and topogenous mires, edges of flushes
M28 Iris pseudacorus–Filipendula ulmaria mire None yes 2(3) Freshwater seepage zones along upper edge of saltmarshes
M29 Hypericum elodes–Potamogeton polygonifolius soakaway yes 1(2) Shallow soakaways and pools, seepages
M30 Hydrocotylo–Baldellion Rhynchosporion yes 2
M32 Philonotis fontana–Saxifraga stellaris spring None yes 1
M37 Cratoneuron commutatum springs
Petrifying springs with tufa formation (Cratoneurion) yes 1 Springs
M38 Cratoneuron commutatum springs
Petrifying springs with tufa formation (Cratoneurion) yes 1 Springs

Science Report – Methodology for the assessment of significant damage at wetlands 57
S1 Carex elata sedge swamp None yes 2(1) Waterlogged and fluctuating water table
S2 Cladium mariscus swamp and sedge beds yes 2(1) In Eco-hydr guidelines
S3 Carex paniculata sedge swamp None yes 3 Some movement in and eutroph of base rich waters
S4 Phragmites australis swamp None yes 3 Incl in Eco-hydr guidelines
S5 Glyceria maxima swamp None yes 3 Incl in Eco-hydr guidelines
S6 Carex riparia swamp None yes 3 Wet/waterlogged margins water table above or below surface
S7 Carex acutiformis swamp None yes 3 Wet/waterlogged margins
S8 Scirpus lacustris ssp. lacustris swamp None yes 3 Deep water swamp >25 cm water
S9 Carex rostrata swamp None yes 3 Standing waters, water table above surface
S10 Equisetum fluviatile swamp None yes 3 In standing water, margins
S12 Typha latifolia swamp None yes 3 Standing or variable water table
S13 Typha angustifolia swamp None yes 3 Standing or variable water table
S14 Sparganium erectum swamp None yes 3 Stream margins, high water table
S15 Acorus calamus swamp None yes 3 Standing waters
S16 Sagittaria sagittafolia swamp None yes 3 Fairly deep water
S17 Carex pseudocyperus swamp None yes 3 Shallow water margins
S18 Carex otrubae swamp None yes 3 Margins
S19 Eleocharis palustris swamp None yes 3 Margins of standing/running waters
S20 Scirpus lacustris ssp. tabernaemontani swamp None yes 3 Moist brackish sites
S21 Scirpus maritimus swamp None yes 3 Ill-drained brackish sites
S22 Glyceria fluitans water-margin vegetation None yes 3 Around ponds/wet areas in fens and pastures
S23 Other water-margin vegetation None yes 3 Marginal, tolerant to water table variation/drying
S11 Carex vesicaria swamp None yes 1 High water table, open water margins
S24 Phragmites australis–Peucedanum palustre tall-herb fen Calc. fen pp. yes 2(3) Incl in Eco-hydr guidelines
S25 Phragmites australis–Eupatorium cannabinum tall-herb fen None yes 2(1) Fen irrigated/waterlogged by calc water. Valley mires
S26 Phragmites australis–Urtica dioica tall-herb fen None yes 3(2) Moist, gw gleying/some winter flooding

Science Report – Methodology for the assessment of significant damage at wetlands 58
S27 Carex rostrata–Potentilla palustris tall-herb fen
Transition Mire and Quaking Bog yes 2(3) Peaty soils, topogenous or soligenous
S28 Phalaris arundinacea tall-herb fen None yes 3 Water margins, summer water table below surface
MG4 Alopecurus pratensis–Sanguisorba officianalis Lowland hay meadows yes 2 Floodplain meadows
W1 Salix cinerea–Galium palustre woodland
Alluvial woodland pp; Bog woodland pp yes 2
W2 Salix cinerea–Betula pubescens–Phragmites australis woodland
Alluvial woodland pp; Bog woodland pp yes 2 Topogenous peat fens, floodplain and valley mires
W3 Salix pentandra–Carex rostrata woodland
Alluvial woodland pp; Bog woodland pp yes 2 Peat soils kept moist by calcareous groundwater , basin mires
W4 Betula pubescens–Molinia caerulea woodland Bog woodland pp yes 1(2)
N2K bog woodland; spring fed according to EN wet woodland report
W5 Alnus glutinosa–Carex paniculata woodland Alluvial woodland pp yes 2(1)
N2K residual alluvial forest; according to EN wet woodland report, can be dependent upon groundwater discharge, especially in summer
W6 Alnus glutinosa–Urtica dioica woodland Alluvial woodland pp yes 3
N2K residual alluvial forest; Include (HS) Difficult to distinguish where water comes from, thus include
M11 Carex demissa–Saxifraga aizoides mire
Alpine pioneer formations of Caricion bicoloris–atrofuscae yes 1 Open, stony flushes
M12 Carex saxatilis mire
Alpine pioneer formations of Caricion bicoloris–atrofuscae yes 1 High montane flushes
CG10
Festuca ovina–Agrostis capillaris–Thymus praecox grassland (when not on limestone) no 1 Vegetation varies primarily due to level of flushing
CG11
Festuca ovina–Agrostis capillaris–Alchemilla alpina grassland (when not on limestone) no 1 Vegetation varies primarily due to level of flushing
CG12 Festuca ovina–Alchemilla alpina–Silene acaulis dwarf-herb community no 1 Some with springs/flushing
CG6 Dry grassland/scrub transitions (MG1-related, CG2d-related) no 1(2) Include where there are winterbournes
CG8 Sesleria albicans–Scabiosa columbaria lowland calcareous no 3

Science Report – Methodology for the assessment of significant damage at wetlands 59
grassland
CG9 Sesleria albicans–Galium sterneri lowland/upland calcareous grassland no 1(2) Frequent flushing of lime rich water from slopes
H3
Ulex minor–Agrostis curtisii heath; Ulex minor–Agrostis curtisii heath with Erica ciliaris no 3(2) EN Wet heath work; impeded drainage
H4
Ulex gallii–Agrostis curtisii heath; Ulex gallii–Agrostis curtisii heath with Erica ciliaris no 3(2) EN Wet heath work; impeded drainage
H5
Erica vagans–Agrostis curtisii heath; Erica vagans–Schoenus nigricans heath no 3(2) EN Wet heath work ;seasonal waterlogging; fluctuation
M19 Calluna vulgaris–Eriophoroum vaginatum blanket mire no 3(2) Ombrogenous, including N2K woodland
M20 Eriophoroum vaginatum blanket and raised mire no 3(2) Ombrogenous
M7 Carex curta–Sphagnum russowii mire no 1 Flushes in peaty soils
M31 Anthelia julacea–Sphagnum auriculatum spring no 1
M33 Pohlia wahlenbergii var. glacialis spring no 1
M34 Carex demissa–Koenigia islandica flush no 1
M35 Ranunculus omiophyllus–Montia fontana rill no 1
M36 Lowland springs and streambanks of shaded situations no 1
M8 Carex rostrata–Sphagnum warnstorfii mire no 1 Raw peat with drainage from
MG11
Related inland wet grassland, Festuca rubra–Agrostis stolonifera–Potentilla anserina grassland no 2(3) Flood from fresh/brackish water
MG13
Inland wet grassland, Agrostis stolonifera–Alopecurus geniculatus grassland no 3(2)
MG5 Cynosurus cristatus–Centaurea nigra lowland meadows no 3(2) Traditional meadows
MG8 Cynosurus cristatus–Caltha palustris lowland neutral grassland no 3(2)
W7 Residual alluvial forests (Alnion glutinoso–incanae) no 2(1)
N2K residual alluvial forest; According to EN wet woodland report, can depend on gw discharge in summer
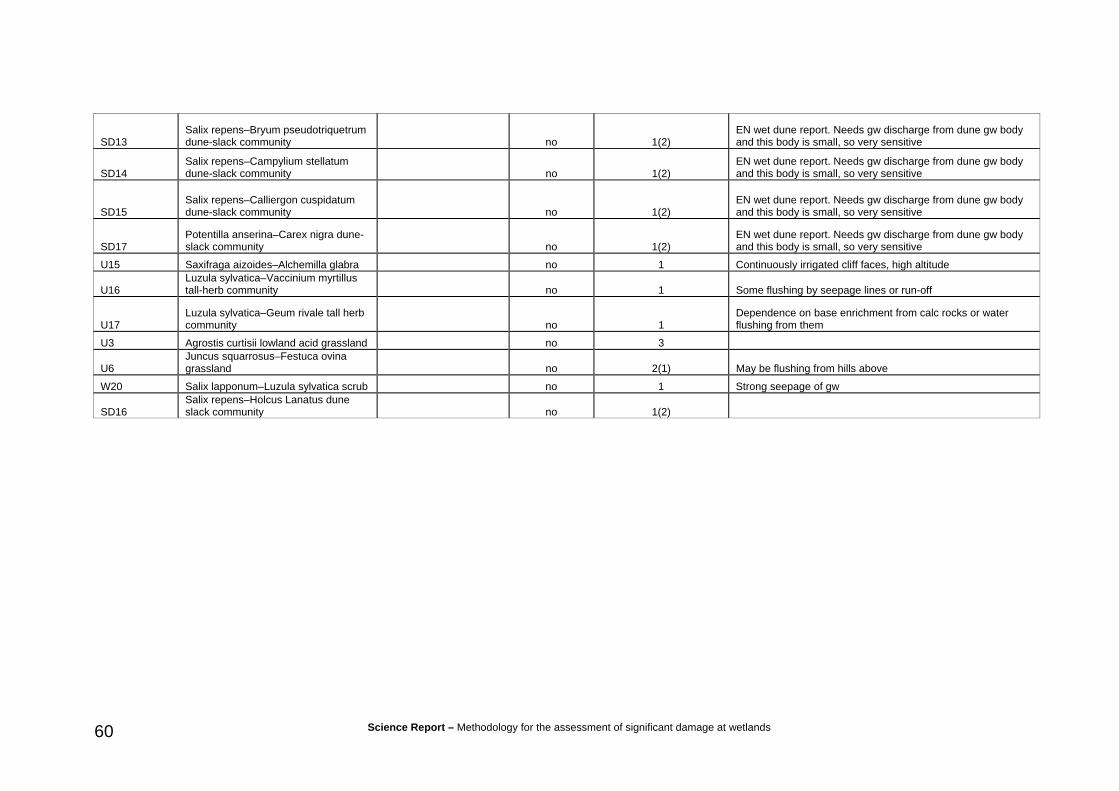
Science Report – Methodology for the assessment of significant damage at wetlands 60
SD13 Salix repens–Bryum pseudotriquetrum dune-slack community no 1(2)
EN wet dune report. Needs gw discharge from dune gw body and this body is small, so very sensitive
SD14 Salix repens–Campylium stellatum dune-slack community no 1(2)
EN wet dune report. Needs gw discharge from dune gw body and this body is small, so very sensitive
SD15 Salix repens–Calliergon cuspidatum dune-slack community no 1(2)
EN wet dune report. Needs gw discharge from dune gw body and this body is small, so very sensitive
SD17 Potentilla anserina–Carex nigra dune-slack community no 1(2)
EN wet dune report. Needs gw discharge from dune gw body and this body is small, so very sensitive
U15 Saxifraga aizoides–Alchemilla glabra no 1 Continuously irrigated cliff faces, high altitude
U16 Luzula sylvatica–Vaccinium myrtillus tall-herb community no 1 Some flushing by seepage lines or run-off
U17 Luzula sylvatica–Geum rivale tall herb community no 1
Dependence on base enrichment from calc rocks or water flushing from them
U3 Agrostis curtisii lowland acid grassland no 3
U6 Juncus squarrosus–Festuca ovina grassland no 2(1) May be flushing from hills above
W20 Salix lapponum–Luzula sylvatica scrub no 1 Strong seepage of gw
SD16 Salix repens–Holcus Lanatus dune slack community no 1(2)

Science Report – Methodology for the assessment of significant damage at wetlands 61
Appendix 3: Definition and use of Welsh subjectives The subjective scoring is based on the following categories:
1. Known/strongly suspected to have some degree of groundwater input, either from superficial drift aquifers or bedrock.
2. A degree of groundwater input inferred or suspected.
3. Indirectly dependent on groundwater. This mainly applies to 'perched' groundwater bodies supporting a conservation issue which lie upon/adjacent to a larger aquifer system and which may be partly connected to it.
4. Site supports features which may be seepage dependent and thus potentially groundwater dependent.
5. Ombrogenous, surface runoff or stream/river fed.
6. Dune system aquifer.
To enable all the Welsh wetlands to be included in the method it has been necessary to assign a groundwater dependency rating to each subjective. This has been completed as follows:
Subjective Groundwater dependency
1 3
2 3
3 1
4 2
5 1
6 3

Science Report – Methodology for the assessment of significant damage at wetlands 62
References BGS and Environment Agency Science Group, 2006. Baseline Report Series. The Natural Quality of Groundwater in England and Wales. Technical Report Series, NC/99/74.
BGS, Unpublished. Superficial thickness and rockhead models BGS.
Environment Agency, 2006. Results of Trial Method for Assessment of Significant Damage.
Environment Agency, 2007. Testing UKTAG Guidance for the Identification of Groundwater Dependent Terrestrial Ecosystems in the Ribble Basin.
Environment Agency, Unpublished. Groundwater body delineation and description.
Environment Agency, Internal publication 1. Groundwater abstraction assessment method. Water Framework Directive Programme. River Basin Characterisation Project.
Environment Agency, Internal publication 2. Water resource assessments for the Water Framework Directive, CAMS and abstraction licensing. Version 0.3, Part 1.
European Commission, 2003. Common Implementation Strategy for the Water Framework Directive (2000/60/EC). Horizontal Guidance Document on the Role of Wetlands in the Water Framework Directive. Guidance Document No. 12. Luxembourg: Office for Official Publications of the European Communities. Available from: http://europa.eu.int/comm/environment/water/water-framework/guidance_documents.html [15 November 2005]
Krause S., Heathwaite A.L., Miller F., Hulme P. and Crowe A., 2007. Groundwater-dependent wetlands in the UK and Ireland: controls, eco-hydrological functions and assessing the likelihood of damage from human activities. Accepted for publication in Journal of Water Resources and Management.
Lewis M.A., Cheney S.C. and Ódochartaigh B.É., 2006. Guide to Permeability Indices. British Geological Survey Open Report, CR/06/160. 32pp.
Meade R., McNish J, Taylor M. and Chapman C., 2006. Water and Wetlands Guidance: Nitrogen and Phosphorus Thresholds in Water Feeding Terrestrialised Wetlands. Version 4.0.
National Rivers Authority (NRA), 1995. Guide to Groundwater Vulnerability Mapping in England and Wales. HMSO, Norwich.
SNIFFER, 2006. Wetland and groundwater interactions Phase 1 Report: Knowledge base and outline framework for risk assessment of groundwater dependent terrestrial ecoystems (WFD62). http://www.fwr.org/snifrprt.htm
Stratford, C., Ratcliffe, J., Hughes, A., Roberts, J. and Robins, N., 2007. Complex interaction between shallow groundwater and changing woodland , surface water, grazing and other influences in partly wooded duneland in Anglesey, Wales. In: Chambel, A. et al.(Eds). Groundwater and Ecoystems, Proceedings of XXXV Congress International Association of Hydrogeologists, Lisbon 17-21 September 2007.
UKTAG, 2004. Guidance on the identification and risk assessment of groundwater dependent terrestrial ecosystems. UKTAG guidance paper 5a+b. http://www.wfduk.org/tag_guidance/GuidancePapers

Science Report – Methodology for the assessment of significant damage at wetlands 63
UKTAG, 2005. Draft protocol for determining 'Significant Damage' to a 'Groundwater Dependent Terrestrial Ecosystem'. UKTAG guidance paper 5c, version 9.6. http://www.wfduk.org/tag_guidance/GuidancePapers
Science Report – Methodology for the assessment of significant damage at wetlands 64
List of abbreviations AMP Asset Management Plans
BGS British Geological Survey
CAMS Catchment Abstraction Management Strategy
CCW Countryside Council for Wales
EN English Nature
GIS geographic information system
gw groundwater
GWB groundwater body
GWDTE groundwater dependent terrestrial ecosystem
N2K Natura 2000
NALD National Abstraction Licence Database
NVC National Vegetation Classification
RAM Framework Resource Assessment and Management Framework
SSSI Site of Special Scientific Interest
WFD Water Framework Directive
WIMS Water Information Management System
WLMP Water Level Management Plan
.

We are The Environment Agency. It's our job to look after your environment and make it a better place – for you, and for future generations.
Your environment is the air you breathe, the water you drink and the ground you walk on. Working with business, Government and society as a whole, we are making your environment cleaner and healthier.
The Environment Agency. Out there, making your environment a better place.
Published by: Environment Agency Rio House Waterside Drive, Aztec West Almondsbury, Bristol BS32 4UD Tel: 0870 8506506 Email: [email protected] www.environment-agency.gov.uk © Environment Agency All rights reserved. This document may be reproduced with prior permission of the Environment Agency.