methodology and theory integrating tpm and qfd for
TRANSCRIPT

METHODOLOGY AND THEORY
Integrating TPM and QFD forimproving quality in maintenance
engineeringV.R. Pramod
Department of Mechanical Engineering, N.S.S. College of Engineering,Palakkad, Kerala State, India
S.R. DevadasanDepartment of Production Engineering, P.S.G. College of Technology,
Coimbatore, Tamilnadu State, India
S. MuthuDr Mahalingam College of Engineering and Technology, Pollachi,
Tamilnadu, India
V.P. JagathyrajSchool of Management Studies, Cochin University of Science and Technology,
Cochin University, Kochi, Kerala State, India, and
G. Dhakshina MoorthyGovernment Automobile Workshop, Goundam Palayam, Coimbatore, India
Abstract
Purpose – To provide maintenance engineering community with a model named “Maintenancequality function deployment” (MQFD) for nourishing the synergy of quality function deployment(QFD) and total productive maintenance (TPM) and enhancing maintenance quality of products andequipment.
Design/methodology/approach – The principles of QFD and TPM were studied. MQFD modelwas designed by coupling these two principles. The practical implementation feasibility of MQFDmodel was checked in an automobile service station.
Findings – Both QFD and TPM are popular approaches and several benefits of implementing themhave been reported worldwide. Yet the world has not nourished the synergic power of integratingthem. The MQFD implementation study reported in this paper has revealed its practical validity.
Research limitations/implications – Since MQFD requires strategic decision making, themanagement commitment and support are required to test implement it. Since the case study wasconducted in a public sector service station, this could not be achieved due to the requirement offollowing complex administrative procedures. However, the feasibility of obtaining customer voices
The current issue and full text archive of this journal is available at
www.emeraldinsight.com/1355-2511.htm
The authors are thankful to the Professor C.K. Ramaswamy working in Chinmaya MissionCollege, Palakkad, Kerala state, India for helping us to rectify the typographical andgrammatical errors in the papers. They are thankful to the anonymous referees and ProfessorS.O. Duffuaa, editor of Journal of Quality in Maintenance Engineering, whose comments andremarks enabled them to improve the presentation quality of the paper to a significant extent.They are grateful to all the respondents of the surveys reported in this paper.
JQME12,2
150
Journal of Quality in MaintenanceEngineeringVol. 12 No. 2, 2006pp. 150-171q Emerald Group Publishing Limited1355-2511DOI 10.1108/13552510610667174

from the practising community and translating them into technical languages has revealed thepossibility of implementing MQFD in real time situations.
Originality/value – Both literature and manufacturing arenas were surveyed and found out that nomodel linking QFD and TPM has so far been brought out by theorists and practitioners. Hence thecontribution of MQFD model is original. Since there are researches establishing the power of QFD andTPM, the essence of integrating them for attaining world class maintenance quality is of high value.
Keywords Productive maintenance, Quality function deployment, House of quality, Surveys
Paper type Case study
IntroductionDuring recent years, organisations have been adopting strategies for enhancing themaintenance quality of products and processes as a means to excel in today’scompetitive world. One of the current strategies being adopted in this direction bymodern organisations is total productive maintenance (TPM) (Ahmed et al., 2005;Wang and Hwang, 2005) In essence, TPM couples the principles of maintenanceengineering and total quality management (TQM) (Seth and Tripathi, 2005). While fewTQM strategies have been adopted, the strategy of infusing customer voices is yet tofind its authentic place in TPM field. For example, customers voice the maintenancequality of products by citing the quality of service levels that they receive, against thepreferred levels (Tan and Pawitra, 2001). There is no technique or tool available inTPM to transfer this kind of customer voice into practical arena. Whereas in TQMliterature, a considerable portion of deliberations is devoted towards the use of thetechnique called “quality function deployment” (QFD), for converting the voice ofcustomers into technical requirements.(Fung et al., 1999) Majority of the researchershave reported the benefits achieved by implementing QFD (Zairi and Youssef, 1998,Kathawala and Motwani, 1994; Olhanger and West, 2002). In this context, wedeveloped the presumption that if QFD is adopted in TPM projects through a suitablemechanism, then it will be a highly beneficial proposition for achieving higher degreeof maintenance quality. Hence in this paper a model is proposed, which is named“maintenance quality function deployment” (MQFD). We carried out two phases ofactivities before designing MQFD model. First we reviewed literature and found outthat no activities have so far been reported on integrating QFD in TPM and vice versa.During the second phase we surveyed six TPM implementing companies. The surveyresults indicated that no effort on integrating QFD in TPM has been exerted inpractical arena. After completing these two phases of activities, the MQFD model wasdesigned. In order to examine the working of MQFD in real time situation, itsimplementation study was conducted in an Indian state government run public sectorautomobile service station. The details of this work are presented in this paper.
Use of QFD for TPMBoth QFD and TPM have widely been in existence during last three decades (Akao andMazur, 2003; Nakajima, 1993; Chan et al., 2005). Though their objectives are about thequality improvement aspects, their perceptions and orientations are focused onattaining different objectives. In order to enable the nourishment of their synergicbenefits, it becomes necessary to examine the use of QFD for TPM. This aspect isdepicted in Figure 1. As hinted, the objectives of QFD are largely on meeting theexternal customers’ requirements through the involvement of management staff,
IntegratingTPM and QFD
151
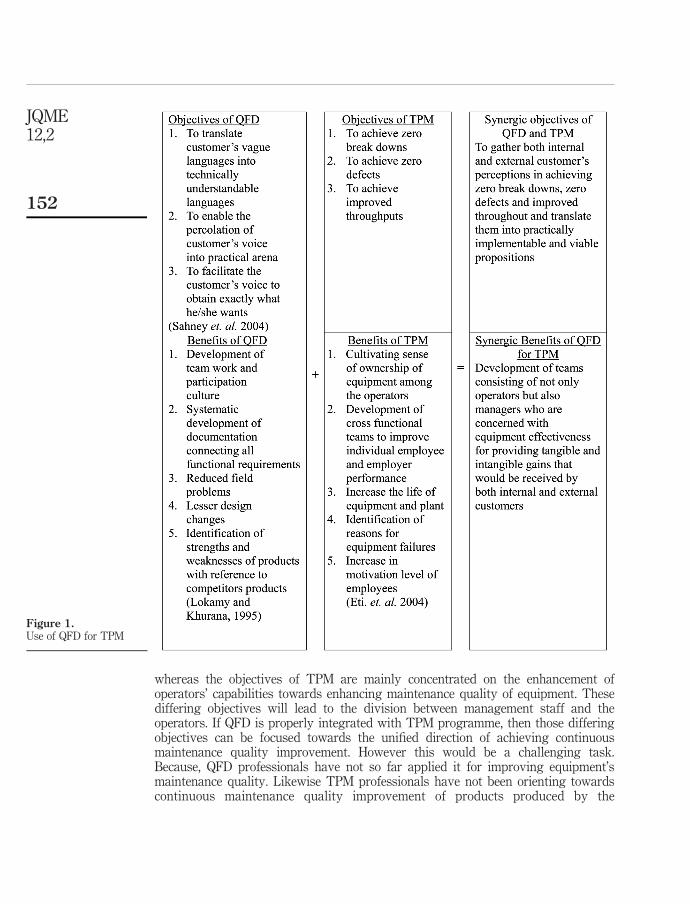
whereas the objectives of TPM are mainly concentrated on the enhancement ofoperators’ capabilities towards enhancing maintenance quality of equipment. Thesediffering objectives will lead to the division between management staff and theoperators. If QFD is properly integrated with TPM programme, then those differingobjectives can be focused towards the unified direction of achieving continuousmaintenance quality improvement. However this would be a challenging task.Because, QFD professionals have not so far applied it for improving equipment’smaintenance quality. Likewise TPM professionals have not been orienting towardscontinuous maintenance quality improvement of products produced by the
Figure 1.Use of QFD for TPM
JQME12,2
152

organizations. Hence the task of integrating QFD and TPM has to be carried out withprecautions because of their inherent divergent objectives.
QFD in TPM and vice versa: a literature perspectiveOn realizing that QFD adoption in TPM projects would be a useful contribution toTPM professionals, we developed interest to locate any work that reports the adoptionof QFD in TPM projects and vice versa. In this regard, it was very encouraging to seean article by Chan and Wu (2002). They have reviewed as many as 650 publications,which are considered to be relatively an exhaustive literature on QFD. They have dealtQFD right from its birth to its dissemination to various countries and fields. They havelisted the popular application fields of QFD, which include product development,quality management and customer need analysis. They have also identified theindustrial sectors in which QFD is applied. Some of them are transportation,communication, software systems and manufacturing. In addition to that, they havelisted articles, which report the linking of QFD with simultaneous engineering,knowledge intensive engineering, quality engineering, rehabilitation engineering,requirement engineering, quality engineering and so on. However this list does notinclude TPM. On the whole, the review of this paper clearly indicated the absence ofany work linking TPM with QFD.
In order to further confirm the absence of QFD application in TPM field, some morepapers were reviewed. Some of those reviews are briefly presented here. Terziovskiand Sohal (2000) have collected responses from approximately 400 managers. Theyhave integrated the use of seven new quality tools. Failure mode and effect analysis,QFD, creativity tools, standardization tools and “5S” for achieving continuousimprovement. They have cited that some companies use TPM as a tool for kaizen.However they have not indicated any work involving the application of QFD in TPMand vice versa. Rho et al. (2001) concentrated on various studies designed to investigatethe relationship between manufacturing strategies, practices, and performance. Theyhave compared the results from three different nations, Korea, USA and Japan. Theyhave included TPM and QFD in their studies but have not attempted to integrate them.Negri and Galli (1997) have worked on the quality improvement strategies in Italy andhave cited that TPM influences on process control on preventive basis and it minimizesdown time. They have identified QFD as one of the most effective and reliableapproach to technological development and relevant processes. However they have notmingled QFD and TPM with each other in their studies.
Voss and Blackmon (1998) studied the differences in manufacturing strategiesbetween Japanese and Western manufacturing companies. Cultural differences causeddifference in attitude towards duration of implementation, which lead to the adoptionof long term and short term strategies. They have analyzed the data from 600companies in 20 countries. They have mentioned that Japanese considered TPM as oneof the long-term strategies. They have reported a higher level of adoption of QFD thanTPM in Japan. They have also reported higher payoff of TPM than QFD, whereas thistrend is reversed in western countries. However the difference in these quantifiedparameters is very less and hence, we inferred that TPM and QFD are dominating inboth Western and Japanese companies. However, this study reveals no integrationbetween TPM and QFD principles.
IntegratingTPM and QFD
153

After realizing the absence of any article regarding the integration of QFD andTPM, we developed curiosity to check whether any attempts have been made to linkany other manufacturing strategies with them. It was quiet surprising to see fewarticles, authored my McKone et al. (1999, 2001) Cua et al. (2001) which have emerged inthis direction. These articles indicate the feasibility of linking both TPM and QFD withother similar approaches with different combination. Hence it is inferred that themarriage of QFD and TPM will also be feasible proposition.
QFD in TPM and vice versa: a perspective in the practical arenaWhile the literature review hinted the absence of any work on integrating QFD in TPMprograms, we developed interest to assess the status in practical arena. For thispurpose, we designed a feed back questionnaire. This questionnaire consisted of twocomponents. The first component consisted of ten questions and aimed to assess thelevel of TPM implementation in the responding company. The second componentcontained four questions and aimed at checking the implementation status of QFD inthe responding company. With this questionnaire, five TPM implementing companieslocated at Coimbatore City of India were visited personally by the first author and theresponses were collected from the competent authorities. Besides the questionnairewas sent through e-mail to 53 TPM implementing companies located in India. Howeverthe filled-in questionnaire was received from only one company. The responsesgathered through these filled-in questionnaires are analyzed in this section.
Since some companies are reluctant to reveal their identities, hereafter thecompanies will be referred to as Company 1, Company 2 and so on. The questions inthe first component of the questionnaire aimed to estimate the level of implementingeight pillars of TPM. It was observed that no company has fully constructed TPMpillars. In company 2 the fifth TPM pillar (titled as office TPM) has not beenimplemented at all. Also the overall percentage level of constructing TPM pillars inthe companies range from 32-61 percent. These levels affirm that these companiescan be considered as TPM implementing companies. In order to determine thefeasibility of merging TPM in QFD, the status of utilizing internal and externalcustomers’ concept was examined (Kruger, 2001). Since QFD deals with transferringcustomer’s vague language into technical language, the proportion of utilizing ofinternal and external customers’ concept while implementing the TPM programmeswas examined using a question. Except in the case of company 6, the level of utilizinginternal and external customers’ concept is either nil or very less. The overallproportion of the six TPM companies implementing internal and external customers’concept is very less (40 percent). Another question aimed to determine whether thecompany ever implemented QFD. Barring companies 2 and 4, other companies havenever implemented QFD. Hence the QFD implementation status was gathered onlyfrom companies 2 and 4 using a Likert’s scale of range 0-10. Further responses to aquestion indicated that the implementation of QFD in these companies was confinedwithin top and middle level management personnel. It was observed, company 2 hasreaped very little benefits while company 4 has gained benefits in all aspects byimplementing QFD. This observation indicates that, the benefits gained byimplementing QFD are proportional to level of its implementation. On the whole, thequestionnaire supported surveys in the above six TPM implementing companies ledto the drawing of the following inferences:
JQME12,2
154

. Though some authors have reported that TPM is one of the world classmanufacturing strategies (McKone et al., 2001; Yamashina, 2000), its level ofimplementation with reference to the eight pillars is not very appreciable.
. There exists every possibility that a company may implement TPM withoutinstalling one or more of the TPM pillars.
. TPM implementing companies possess no or very little knowledge about QFDsince TPM does not stipulate the incorporation of internal and externalcustomers’ concept.
There is no sign of the six TPM implementing companies applying QFD in theirTPM projects. On the whole, the results of literature and surveys did not reveal anydifference. In other words, both literature and practical surveys confirmed that noauthentic model linking TPM and QFD is adopted today in either research orpractice.
MQFD modelWhile ascertaining the absence of any model linking TPM and QFD in both literatureand practical arenas, two methodologies of linking these two principles wereexamined. One methodology is that, QFD can be introduced in TPM principles. Othermethodology is that, TPM can be introduced in QFD projects. In both methodologies,there is every likely chance that these two principles do not get linked so that thesynergic benefits are not gained. Hence we decided to design MQFD modelexclusively for linking these two principles. The conceptual features of MQFD modelare shown in Figure 2. As shown, the performance of a company will be heardthrough the voice of customers. Those voices of customers are used to develop thehouse of quality (Chein and Su, 2003). This process has to be accomplished by QFDteam. The outputs of QFD, which are in the form of technical languages (Rahim andBeksh, 2003), are submitted to the top management for making strategic decisions.This step is necessitated because researchers have established the need of applyingstrategic approach in both QFD (Lu and Kuei, 1998) and TPM (Murthy et al., 2002;Hunt and Xavier, 2003) projects for ensuring their success. The technical languageswhich are concerned with enhancing maintenance quality are strategically directedby the top management for progressing through the eight TPM pillars. The TPMcharacteristics developed through the development of eight pillars are fed into theproduction system. Their implementation shall be focussed on increasing the valuesof the maintenance quality parameters, namely overall equipment efficiency (OEE),mean time between failures (MTBF), mean time to repair (MTTR), performancequality, availability and mean down time (MDT). The outputs from the productionsystem are required to be reflected in the form of improved maintenance quality,increased profit, upgraded core competence, and enhanced goodwill. All thequantified values of outputs are used for developing another house of quality andcomparing with the set targets. Now the next cycle begins. Thus implementation ofMQFD model is a never-ending continuous improvement process. A unique feature ofMQFD model is that it does not envisage changing or dismantling the existingprocess of developing house of quality and TPM projects which may be underpractice in the company concerned. Thus MQFD model enables the tactical marriageof QFD and TPM.
IntegratingTPM and QFD
155

Figure 2.MQFD model
JQME12,2
156

Case studyIn order to examine the implementation aspects of MQFD, a case study was carried outin a maintenance intensive automobile service station. This service station is located atCoimbatore city of India. This service station is run by the Tamil Nadu stateGovernment of India. This service station is required to cater to the maintenancerequirements of Tamil Nadu state Government’s vehicles. This service station waschosen for the study because of the intense maintenance engineering activities beingcarried out in it. To begin with, the customer reaction was obtained using aquestionnaire. The drivers of the vehicles are the customers of this service station. Bymaking use of the long experience of the fifth author, the list containing themaintenance quality aspects was prepared. The drivers were asked to mark theirreactions against those aspects. In total, the reactions from 14 drivers were collectedpertaining to 20 maintenance quality aspects. The data collected through thisquestionnaire based survey is tabulated in Table I. As an example, the details of thedata presented against serial number 1 in Table I are illustrated here. This questionaimed to gather the reaction of each driver about the condition of the driver’s seat of thevehicle. Out of the 14 drivers, three of them have mentioned “excellent”, while five andsix of them have mentioned that it is “good” and “average” respectively. None of themhave felt that the driver’s seat of the vehicle that they drive is in bad condition. Theselection of maintenance quality aspect was prioritised on the basis of drivers’reactions in the order ranging from “Bad” to “Excellent”. That is, the maintenancequality aspects in which “Bad” reactions dominate are given the highest priority in
Number of drivers’ responsesSerialnumber Customers’ voice
Excellentpriority
Goodpriority
Averagepriority
Badpriority
Priorityscores
1 Condition of driver’s seat 3 5 6 – 312 Condition of rear-view mirror 1 11 1 1 303 Condition of headlights 1 6 4 3 374 Engine condition 4 6 3 1 315 Condition of gearbox 2 7 4 1 326 Condition of transmission 1 8 4 1 347 Condition of suspension/springs 1 6 6 1 368 Condition of tyres 2 7 3 2 339 Condition of steering 1 6 5 2 36
10 Condition of brakes – 11 3 – 3411 Condition of clutch – 12 2 – 3312 Ride comfort – 6 7 1 3713 Handling characteristics 1 11 1 1 3014 Oil leaks, if any – 10 4 – 3215 Fuel efficiency – 9 4 1 3416 Periodic maintenance 1 11 2 – 2917 Response from maintenance department
about problems 1 8 5 – 3218 Control of repeated breakdowns 1 9 4 – 3119 Consideration of drivers’ suggestions by
maintenance personnel – 9 4 1 3420 Skill of maintenance workers 1 9 3 1 32
Table I.Data on customers’ voice
IntegratingTPM and QFD
157

choosing for subsequent study. It is gradually decreased from average to excellentreactions. The priorities were quantified by assigning weightages 1, 2, 3, and 4 for thereactions “Excellent”, “Good”, “Average” and “Bad” respectively. The priority thuscomputed has been entered in the last column of Table I. As a sample the computationof the expected value against the condition of the driver’s seat is presented below.
Number of “Excellent” reactions £ 1 þ Number of “Good” reactions £ 2
þ Number of “Average” reactions £ 3 þ Number of “Bad” reactions £ 4
¼ ð3 £ 1 þ 5 £ 2 þ 6 £ 3 þ 3 £ 0Þ ¼ 31:
As shown in the last column of Table I, the “ride comfort” and “condition of the headlight” shall be the highest priorities for choosing subsequent study since their score is37. This score is the highest among all. These details were input into “House ofquality”(Besterfield et al., 2004) shown in Figure 3.
After this, the technical languages numbering 32 was prepared by the fifth author.The driver’s reactions (which are referred to customer voices in QFD terminology) andthe technical languages were entered in rows and columns of the correlation matrix.The correlation between the customers’ voice and technical languages were enteredusing three symbols, which are shown below:
(1) Strong relationship ¼ B
(2) Medium relationship ¼ D
(3) Week relationship ¼ †
In case of no relationship, the corresponding cell is left blank. These data were enteredinto the HoQ matrix shown in Figure 3. Followed by that the correlation matrix wasdeveloped using the same symbols used for constructing relationship matrix to bringout the correlation among technical languages. In order to quantify the relationshipsand correlate using numerical values, the pattern followed by Lu and Kuei (1999) forquantifying the relationships was used. Accordingly, the values 9, 3 and 1 wereassigned to strong relationship/ correlation, medium relationship/ correlation, andweek relationship/ correlation respectively. No values were assigned against blankcells. These values were used to compute customer-technical interactive scores andweighted correlated values. As a sample, the method of calculating customer-technicalinteractive score is illustrated here by considering the technical language “Goodquality fuel”. The relationship of customer voices (that is, drivers’ reactions) namely“poor engine condition” and “poor fuel efficiency” against “good quality fuel” isindicated by the symbol B, whose value is 9. While the relationship of repeatedbreakdown with “good quality fuel” is denoted by the symbol D, whose value is 3. Thecustomer technical interactive scores were calculated as follows.
FormulaCustomer technical interactive score ¼
Xn
i¼1
relationship values between
customer voice and technical lanuages £ expected value of customer voice
where n refers to the number of customer voices.
JQME12,2
158

Figure 3.House of quality matrix
IntegratingTPM and QFD
159
ExampleCustomer technical interactive score for “good quality fuel”
¼ 9 £ 13 þ 9 £ 34 þ 3 £ 31 ¼ 678
In order to visualize the relative weightages, the percentage normalized value ofcustomers technical interactive scores were computed as follows.
FormulaPercentage normalized value of customers technical interactive score
¼Customer technical interactive score £ 100
Sum of customer technical interactive score
ExamplePercentage normalized score of customers technical interactive score the
technical voice “good quality fuel” ¼ ð678=25551Þ £ 100 ¼ 2:65
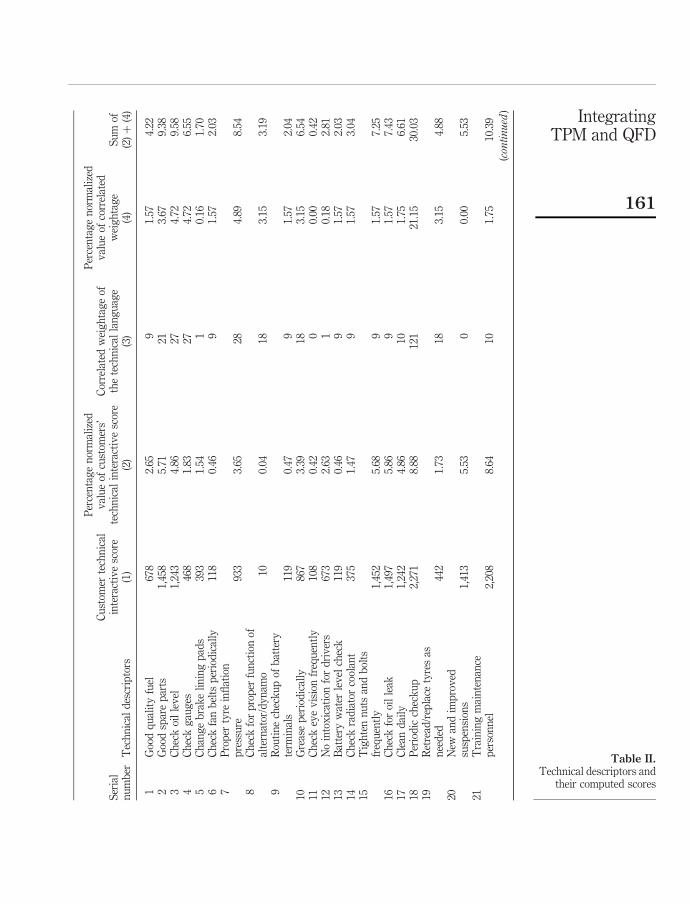
These computed scores are displayed in Table II. The weighted correlated value iscalculated by summing the values of correlations. As shown in Figure 3, the weightedcorrelated value against the technical parameter “good quality fuel” is 3.
In order to visualize the relative weightages of technical correlation, the percentagenormalized value of correlated weights were calculated using the following formula.
Percentage normalized value of correlated weightage
¼Correlated weightage of the technical language £ 100
Sum of correlated weightages
ExamplePercentage normalized of correlated weightage against the technical
parameter “good quality fuel” ¼ 9=572 £ 100 ¼ 1:57
Both percentage normalized score of customers technical interactive score andpercentage normalized value of correlated weightage have been added and entered inthe side of correlation matrix of HoQ and are termed as total normalized values.
The fifth author was interviewed to spell out the technical descriptors. These are givencode numbers P1, P2, P3, . . . P32. Though his intension was to prioritise the implicationof technical requirements based on percentage normalized value of correlated weightage,he expressed the feasibility of implementing all the technical requirements.
According to the MQFD model (see Figure 2) the fifth author was asked to makestrategic decisions to either direct the technical requirements towards the TPM eightpillars implementation or an immediate and direct implementation. Such decisionstaken by him are portrayed in Tables III and IV. However these technical requirementscould not be implemented in this service station because it is an Indian stategovernment run public sector, which requires decision making by the top levelcommittee by following long democratic procedures. Hence the fifth author was askedto anticipate the result of implementing the MQFD by considering the six maintenance
JQME12,2
160
Ser
ial
nu
mb
erT
ech
nic
ald
escr
ipto
rs
Cu
stom
erte
chn
ical
inte
ract
ive
scor
e(1
)
Per
cen
tag
en
orm
aliz
edv
alu
eof
cust
omer
s’te
chn
ical
inte
ract
ive
scor
e(2
)
Cor
rela
ted
wei
gh
tag
eof
the
tech
nic
alla
ng
uag
e(3
)
Per
cen
tag
en
orm
aliz
edv
alu
eof
corr
elat
edw
eig
hta
ge
(4)
Su
mof
(2)þ
(4)
1G
ood
qu
alit
yfu
el67
82.
659
1.57
4.22
2G
ood
spar
ep
arts
1,45
85.
7121
3.67
9.38
3C
hec
koi
lle
vel
1,24
34.
8627
4.72
9.58
4C
hec
kg
aug
es46
81.
8327
4.72
6.55
5C
han
ge
bra
ke
lin
ing
pad
s39
31.
541
0.16
1.70
6C
hec
kfa
nb
elts
per
iod
ical
ly11
80.
469
1.57
2.03
7P
rop
erty
rein
flat
ion
pre
ssu
re93
33.
6528
4.89
8.54
8C
hec
kfo
rp
rop
erfu
nct
ion
ofal
tern
ator
/dy
nam
o10
0.04
183.
153.
199
Rou
tin
ech
eck
up
ofb
atte
ryte
rmin
als
119
0.47
91.
572.
0410
Gre
ase
per
iod
ical
ly86
73.
3918
3.15
6.54
11C
hec
key
ev
isio
nfr
equ
entl
y10
80.
420
0.00
0.42
12N
oin
tox
icat
ion
for
dri
ver
s67
32.
631
0.18
2.81
13B
atte
ryw
ater
lev
elch
eck
119
0.46
91.
572.
0314
Ch
eck
rad
iato
rco
olan
t37
51.
479
1.57
3.04
15T
igh
ten
nu
tsan
db
olts
freq
uen
tly
1,45
25.
689
1.57
7.25
16C
hec
kfo
roi
lle
ak1,
497
5.86
91.
577.
4317
Cle
and
aily
1,24
24.
8610
1.75
6.61
18P
erio
dic
chec
ku
p2,
271
8.88
121
21.1
530
.03
19R
etre
ad/r
epla
cety
res
asn
eed
ed44
21.
7318
3.15
4.88
20N
ewan
dim
pro
ved
susp
ensi
ons
1,41
35.
530
0.00
5.53
21T
rain
ing
mai
nte
nan
cep
erso
nn
el2,
208
8.64
101.
7510
.39
(continued
)
Table II.Technical descriptors and
their computed scores
IntegratingTPM and QFD
161

Ser
ial
nu
mb
erT
ech
nic
ald
escr
ipto
rs
Cu
stom
erte
chn
ical
inte
ract
ive
scor
e(1
)
Per
cen
tag
en
orm
aliz
edv
alu
eof
cust
omer
s’te
chn
ical
inte
ract
ive
scor
e(2
)
Cor
rela
ted
wei
gh
tag
eof
the
tech
nic
alla
ng
uag
e(3
)
Per
cen
tag
en
orm
aliz
edv
alu
eof
corr
elat
edw
eig
hta
ge
(4)
Su
mof
(2)þ
(4)
22P
edal
boo
ts(f
orcl
utc
h,
bra
ke,
gas
ped
al)
297
1.16
223.
855.
0123
Per
iod
icm
ain
ten
ance
1,96
97.
7187
15.2
022
.91
24W
ater
serv
ice
262
1.03
91.
572.
6025
Rep
lace
fuse
db
ulb
s33
31.
300
0.00
1.30
26H
alog
enb
ulb
s33
31.
300
0.00
1.30
27E
rgon
omic
seat
s61
22.
393
0.52
2.91
28R
ear-
vie
wm
irro
rin
goo
dp
osit
ion
270
1.06
00.
001.
0629
Bet
ter
mai
nte
nan
cest
rate
gie
s1,
772
6.94
8114
.16
21.1
030
Sea
tb
elts
142
0.56
30.
521.
0831
Bod
yti
nk
erin
gan
dp
ain
tin
gw
ork
s32
71.
283
0.52
1.80
32D
riv
ers’
rest
/sle
ep1,
147
4.48
10.
184.
66
Table II.
JQME12,2
162
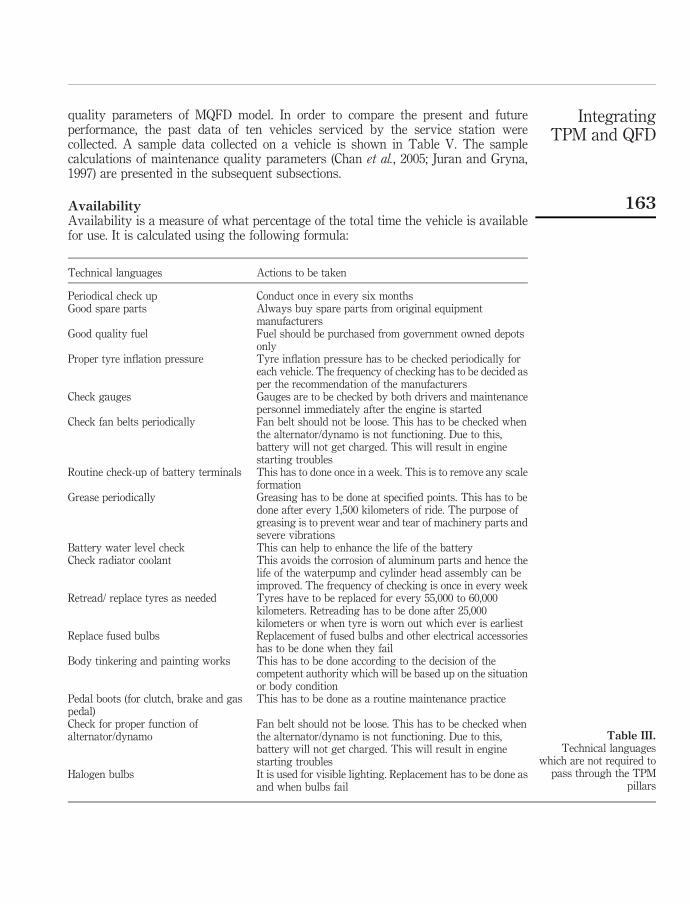
quality parameters of MQFD model. In order to compare the present and futureperformance, the past data of ten vehicles serviced by the service station werecollected. A sample data collected on a vehicle is shown in Table V. The samplecalculations of maintenance quality parameters (Chan et al., 2005; Juran and Gryna,1997) are presented in the subsequent subsections.
AvailabilityAvailability is a measure of what percentage of the total time the vehicle is availablefor use. It is calculated using the following formula:
Technical languages Actions to be taken
Periodical check up Conduct once in every six monthsGood spare parts Always buy spare parts from original equipment
manufacturersGood quality fuel Fuel should be purchased from government owned depots
onlyProper tyre inflation pressure Tyre inflation pressure has to be checked periodically for
each vehicle. The frequency of checking has to be decided asper the recommendation of the manufacturers
Check gauges Gauges are to be checked by both drivers and maintenancepersonnel immediately after the engine is started
Check fan belts periodically Fan belt should not be loose. This has to be checked whenthe alternator/dynamo is not functioning. Due to this,battery will not get charged. This will result in enginestarting troubles
Routine check-up of battery terminals This has to done once in a week. This is to remove any scaleformation
Grease periodically Greasing has to be done at specified points. This has to bedone after every 1,500 kilometers of ride. The purpose ofgreasing is to prevent wear and tear of machinery parts andsevere vibrations
Battery water level check This can help to enhance the life of the batteryCheck radiator coolant This avoids the corrosion of aluminum parts and hence the
life of the waterpump and cylinder head assembly can beimproved. The frequency of checking is once in every week
Retread/ replace tyres as needed Tyres have to be replaced for every 55,000 to 60,000kilometers. Retreading has to be done after 25,000kilometers or when tyre is worn out which ever is earliest
Replace fused bulbs Replacement of fused bulbs and other electrical accessorieshas to be done when they fail
Body tinkering and painting works This has to be done according to the decision of thecompetent authority which will be based up on the situationor body condition
Pedal boots (for clutch, brake and gaspedal)
This has to be done as a routine maintenance practice
Check for proper function ofalternator/dynamo
Fan belt should not be loose. This has to be checked whenthe alternator/dynamo is not functioning. Due to this,battery will not get charged. This will result in enginestarting troubles
Halogen bulbs It is used for visible lighting. Replacement has to be done asand when bulbs fail
Table III.Technical languages
which are not required topass through the TPM
pillars
IntegratingTPM and QFD
163

Technical languages Actions to be taken
Training maintenance people When a new vehicle is purchased, training should beimparted to drivers/maintenance personnel. Theyshould be deputed to attend those training sessionswhich will be conducted by the authorize dealers.This is achieved by the pillar “education andtraining”
Check for oil leak This has to be checked daily before the vehicle isbeing put into use. This has to be done through thepillar “education and training”
Tighten nuts and bolts frequently Everyday before starting the vehicle, nuts and boltsare to be checked and if any looseness found they areto be tightened. This has to be done by theimplementation of the pillar “autonomousmaintenance”
Check oil level This has to be implemented by the pillar“autonomous maintenance”
Change brake lining pads Checking of brakes has to de done when there arecomplaints from the drivers. In addition to that,break lining pads are to be replaced once in every20,000 kilometers of running. It has to be done byimplementation of the pillar “planned maintenance”
Check eye vision of the drivers frequently Drivers have to ensure that their eye vision is good.They have to have a check-up every year. In additionto that, drivers above the age of 40 are needed tocomplete health checkups every year. This has to bedone by implementation of the pillar “safety, healthand environment”
Ergonomic seats The seat designs of drivers are to be changed as perthe ergonomics requirements. In addition, driversshould be instructed to use seat belts. This has to beimplemented by the pillar, “safety, health andenvironment”
Drivers’ rest/sleep Drivers are advised to avoid night driving as far aspossible, especially during peak sleeping hours. Thishas to be implemented by the pillar, “safety, healthand environment”
Rear-view mirror in good position This has to be adjusted by the drivers before startingthe engine. This has to be implemented by the pillar,“autonomous maintenance”
No intoxication for drivers Drivers are instructed to avoid alcohol. This has to beimplemented by the pillar “education and training”
Clean daily Vehicles have always to be clean. For that dailycleaning is essential. Cleaning has to be done bydrivers. Extreme care has to be taken in theconditions of wind screen and glasses
Periodic maintenance This has to be executed in the interval of every threemonths. This is very important in the case of vehicleswhich are used in hilly terrains. This has to beimplemented by the pillar, “planned maintenance”
(continued )
Table IV.Technical languages,which are required topass through TPM pillars
JQME12,2
164

Availability ¼ ðScheduled running time 2 Down timeÞ=ðScheduled running timeÞ
For example, for vehicle 1 during the year 2003:
Availability ¼ ½365 days 2 ð1 þ 18 þ 1Þ days�=365 days
¼ 94:98%
Mean down time (MDT)MDT is the average down time of the vehicle. That is, the average time a vehicle wouldbe out of service during a specified year once it breaks down or is brought for service. Itwill be generally the sum of down time and idle time.
Technical languages Actions to be taken
Seat belts Drivers are instructed to use seat belts. This has to beimplemented by the pillar, “education and training”
Better maintenance strategies Maintenance personnel should be imparted trainingonce in every six months. They should be trainedabout fuel economy, economic speed, conducting ofspecial classes by Indian oil corporation adds a lot inthis regard. Their theme includes economic usage offuel and lubricants. People are deputed for the coursein every six months. This has to be implemented bythe pillar, “education and training”
Water service It has to be done in every 1,600 kilometers. This hasto be implemented by the pillar, “plannedmaintenance”
New and improved suspensions This has provided good cushioned effect for bothdrivers as well as passengers. This has to beimplemented by the pillar, “safety, health andenvironment” Table IV.
Serial numberof the vehicle Date of arrival Date of release Downtime (days)
1 200320 March, 2003 20 March, 2003 102 June, 2003 19 June, 2003 1828 July, 2003 28 July, 2003 1200420 January, 2004 13 February, 2004 2419 April, 2004 04 May, 2004 1622 July, 2004 04 August, 2004 1301 September, 2004 08 September, 2004 829 November, 2004 30 November, 2004 128 December, 2004 28 December, 2004 1
Table V.A portion of vehicle
maintenance data
IntegratingTPM and QFD
165

MDT ¼ Total down time=Number of breakdowns or service entries
¼ �10mm ¼P
ðDown timesÞ=ðNumber of down timesÞ
For vehicle 1 in 2003:
MDT ¼ ð1 þ 18 þ 1Þ days=3
¼ 6 days
Mean time between failures (MTBF)MTBF is the average time a vehicle would run trouble-free before experiencing anysort of failure. In our situation, information was available only regarding the cases offailure where the vehicle was brought into the workshop for maintenance. Hence, thiswas assumed accordingly.
MTBF ¼P
ðTBFÞ=ðNf þ 1Þ where
TBF ¼ Time between failures
Nf ¼ Number of failures
For vehicle 1 in 2003:
MTBF ¼ ð80 þ 72 þ 39 þ 173Þ days=ð3 þ 1Þ
¼ 92 days
Mean time to repair (MTTR)MTTR is the average time taken to repair a vehicle once it is brought into service.
It is given by the following formula:
MTTR ¼ Total repair time=Number of workshop visits
In this workshop, we were unable to find data required to find total repair time. Hence,it was decided to take the time to repair as the amount of time the vehicle is laid backinside the workshop. This made MTTR equal to MDT.
Overall equipment efficiency (OEE)OEE is an effective way of analyzing any vehicle. It is a product of availability,performance rate and quality rate, which are measures of equipment losses (Jonssonand Lesshammar, 1999). Thus, overall effectiveness of the vehicle was considered theultimate tool in the measuring the success of TPM implementation in the company. It isgiven by the following formula:
OEE ¼ Availability £ Performance rate £ Quality rate
Here, Performance Rate was given an assumed constant value of 0.90 and Quality Ratewas given a value of 0.95.
JQME12,2
166
Using these values, OEE for vehicle 1 in the year 2003 was calculated as follows:
OEE ¼ 94:98 £ 0:90 £ 0:95
¼ 85:48%
Like the above, the values of maintenance quality parameters concerning theremaining nine vehicles were also computed. The fifth author was shown these valuesThen he was asked to imagine that MQFD was implemented and forecast the valuesfor the year 2005. Those values (both computed and forecast) are shown in Table VI.As indicated, he anticipates improvement in maintenance quality of vehicles 1-5. Heexpects the retainment of maintenance quality values for vehicles 6-10. The reason hecites is that these vehicles are new and retaining the previous year’s maintenancequality itself is a major achievement. Finally he was asked to declare the anticipatedoutputs of MQFD implementation. According to his forecast, there will be 5 percentimprovement in maintenance quality and 20 percent increase in profit (due to lessexpenditure on maintenance activities). He is also confident that core competence willget upgraded from the current level of 2 in the Likert’s scale of range 0-10 to the level of7. Further he expects that the goodwill of the service station will enhance from thecurrent level of 4 in the Likert’s scale of range 0-10 to the level of 8. According to him,the core competence will be revealed through enhanced skill level of both maintenancestaff and drivers, increased awareness over new maintenance methods and reducednumber of breakdowns. The goodwill is revealed through increased owner satisfaction,reduced delivery time of vehicles, drivers’ satisfaction and saving in fuel cost. Thesebenefits closely coincide with the theoretical drawn predictions shown in Figure 1.
Conclusion and scope for future workAlthough maintenance engineering field had been dominant for several decades, itsimportance was highly enhanced due to the emanation of TPM principles. Before theevolution of TPM principles, maintenance engineering field was isolated from holisticoperational performance of organizations. According to this approach, only technicalaspects of maintenance engineering were adopted by personnel working inmaintenance engineering department (Dekker, 1996; Sherwin, 2000). This approachalso deviated maintenance engineering function from the main stream oforganizational performance. On presumably realizing the importance of infusingTPM into the organizational working, Nakajima (1993) contributed TPM by linkingmaintenance engineering and total quality control principles. According to the currentliterature, the ideal goal of TPM is to nourish the synergic benefits of TQM andmaintenance engineering (Hansson and Backlund, 2003). As a means of achievinggoals, various TQM strategies are infused in TPM principles. Yet few TQM strategiesare yet to be infused in TPM field. One among them is customer voice adoption. In thefield of TQM, QFD is used to nourish customer appraisal. However the situation isdifferent in TPM field wherein the sign of customer voice adoption is missing. In orderto overcome this research and practice lacuna, the MQFD model is proposed in thispaper. The implementation possibility of MQFD was checked in an Indian stategovernment run Public sector service station. The reactions of the practitioners werevery encouraging to infer that MQFD would be a feasible model for successfullyimplementing it and nourishing the synergic benefits of QFD and TPM. Future
IntegratingTPM and QFD
167

Ser
ial
nu
mb
erof
the
veh
icle
Yea
rA
vai
lab
ilit
yin
per
cen
tag
eM
DT
(day
s)M
TB
F(d
ays)
OE
EIn
per
cen
tag
eR
emar
ks
120
0394
.98
692
85.4
8S
lig
htl
yol
d20
0482
.97
1050
74.6
720
05(A
nti
cip
ated
)96
.00
511
090
.00
220
0396
.16
797
86.5
4S
lig
htl
yol
d20
0486
.39
1059
77.7
520
05(A
nti
cip
ated
)98
.00
512
092
.00
320
0399
.27
172
89.3
4S
lig
htl
yol
d20
0497
.72
389
87.9
520
05(A
nti
cip
ated
)99
.27
172
89.3
44
2003
87.2
612
7478
.53
Sli
gh
tly
old
2004
92.2
410
9383
.02
2005
(An
tici
pat
ed)
95.0
05
9588
.00
520
0382
.42
1675
74.1
8O
ld20
0477
.81
4114
270
.03
2005
(An
tici
pat
ed)
82.4
216
7574
.18
620
0397
.49
514
787
.74
Old
2004
99.1
83
222
89.2
620
05(A
nti
cip
ated
)99
.18
322
289
.26
720
0389
.68
654
80.7
1N
ew20
0499
.91
112
189
.92
2005
(An
tici
pat
ed)
99.9
11
121
89.9
28
2003
97.3
52
7587
.62
Ver
yN
ew20
0499
.82
182
89.8
420
05(A
nti
cip
ated
)99
.82
182
89.8
49
2003
99.9
51
190
89.9
6N
ew20
0491
.55
553
82.4
020
05(A
nti
cip
ated
)91
.55
553
82.4
010
2003
89.5
010
8180
.55
New
2004
95.7
54
6986
.18
2005
(An
tici
pat
ed)
95.7
54
6986
.18
Table VI.Tangible parameters tomeasure the success ofMQFD
JQME12,2
168

researchers may gather the support of practitioners implementing MQFD in variouscompanies belonging to different industrial sectors. Those kind of managementcommitted and supported practical studies would reveal the path ways for successfullyimplementing MQFD model. This venture would provide advanced solutions forenhancing maintenance quality of both equipment and products.
References
Ahmed, S., Hassan, M.H. and Taha, Z. (2005) TPM can go beyond maintenance: except from acase implementation, Journal of Quality in Maintenance Engineering, Vol. 11 No. 1,pp. 19-42.
Akao, Y. and Mazur, G.H. (2003), “The leading edge in QFD: past, present and future”,International Journal of Quality & Reliability Management, Vol. 20 No. 1, pp. 20-35.
Besterfield, D.H., Besterfield-Michna, C., Besterfield, G.H. and Besterfield-Sacro, M. (2004), TotalQuality Management, first Indian reprint, Pearson Education (Singapore) Pte. Ltd, India.
Chan, L.K. and Wu, M. (2002), “Quality function deployment: a literature review”, EuropeanJournal of Operational Research, Vol. 143, pp. 463-97.
Chan, F.T.S., Lau, H.C.W., Ip, R.W.L., Chan, H-K. and Kong, S. (2005), “Implementation of totalproductive maintenance: a case study”, International Journal of Production Economics,Vol. 95, pp. 71-94.
Chein, T.K. and Su, C.T. (2003), “Using the QFD concept to resolve customer satisfaction strategydecisions”, International Journal of Quality & Reliability Management, Vol. 20 No. 3,pp. 345-59.
Cua, K.O., McKone, K.E. and Schroeder, R.G. (2001), “Relationship between TQM, JIT, and TPM,and manufacturing performance”, Journal of Operations Management, Vol. 19, pp. 675-94.
Dekker, R. (1996), “Applications of maintenance optimization model: a review and analysis”,Reliability Engineering and System Safety, Vol. 51, pp. 229-40.
Fung, R.Y.K., Law, D.S.T. and Ip, W.H. (1999), “Design targets determination forinter-department product attributes in QFD using fuzzy interference”, IntegratedManufacturing Systems, Vol. 10 No. 6, pp. 376-87.
Hansson, J. and Backlund, F. (2003), “Management commitment: increasing the odds forsuccessful implementation of TQM, TPM and RCM”, International Journal of Quality &Reliability Management, Vol. 20 No. 9, pp. 993-1008.
Hunt, R.A. and Xavier, F.B. (2003), “The leading edge in strategic QFD”, International Journal ofQuality & Reliability Management, Vol. 20 No. 1, pp. 56-73.
Jonsson, P. and Lesshammar, M. (1999), “Evaluation and improvement of manufacturingperformance measurement systems – the role of OEE”, International Journal of Operations& Production Management, Vol. 19 No. 1, pp. 55-78.
Juran, J. and Gryna, F.M. (1997), Quality Planning and Analysis, fourth reprint, Tata McGraw-HillEdition, New Delhi.
Kathawala, Y. and Motwani, J. (1994), “Implementing quality function deployment”, The TQMMagazine, Vol. 6 No. 6, pp. 31-7.
Kruger, V. (2001), “Main schools of TQM: the big five”, The TQM Magazine, Vol. 13 No. 3,pp. 126-55.
Lu, M-H. and Kuei, C-H. (1998), “Strategic marketing planning quality function deploymentapproach”, International Journal of Quality & Reliability Management, Vol. 12 No. 6,pp. 85-96.
IntegratingTPM and QFD
169

McKone, K.E., Schroeder, R.G. and Cua, K.O. (2001), “The impact of total productive maintenancepractices on manufacturing performance”, Journal of Operations Management, Vol. 19,pp. 39-58.
Murthy, D.N.P., Atrens, A. and Eceleson, J.A. (2002), “Strategic maintenance management”,Journal of Quality in Maintenance Engineering, Vol. 8 No. 4, pp. 287-305.
Nakajima, S. (1993), Introduction to TPM, Productivity Press, Chennai.
Negri, L. and Galli, M. (1997), “Quality policies and value criterion strategies in Italianmanufacturing industry”, Technovation, Vol. 17, pp. 321-8.
Olhanger, J. and West, B.M. (2002), “The house of flexibility: using the QFD approach to deploymanufacturing flexibility”, International Journal of Operations & ProductionManagement, Vol. 22, pp. 50-79.
Rahim, A.R.A. and Beksh, M.S.N. (2003), “Application of quality function deployment (QFD)method for pultrusion machine design planning”, Industrial Management & Data Systems,Vol. 1003 No. 6, pp. 373-87.
Rho, B-H., Park, K. and Yu, Y-N. (2001), “An international comparison of the effect ofmanufacuring strategy – implementation gap on business performance”, InternationalJournal of Production Economics, Vol. 70, pp. 89-97.
Seth, D. and Tripathi, D. (2005), “Relationship between TQM and TPM implementation factorsand business performance of manufacturing industry in Indian contrast”, InternationalJournal of Quality & Reliability Management, Vol. 22 No. 3, pp. 256-77.
Sherwin, D. (2000), “A review of overall models for maintenance management”, Journal of Qualityin Maintenance Engineering, Vol. 6 No. 3, pp. 138-64.
Tan, K.C. and Pawitra, T.A. (2001), “Integrating SERQUAL and Kano’S model in to QFD forservice excellence development”, Managing Service Quality, Vol. 11 No. 6, pp. 418-30.
Terziovski, M. and Sohal, A.S. (2000), “The adoption of continuous improvement and innovationstrategies in Australian manufacturing firms”, Technovation, Vol. 20, pp. 539-50.
Voss, C. and Blackmon, K. (1998), “Differences in manufacturing strategy decisions betweenJapanese and Western manufacturing plants: the role of strategic time orientation”, Journalof Operations Management, Vol. 16, pp. 147-58.
Wang, C. and Hwang, S. (2005), “A stochastic maintenance management model with recoveryfactor”, Journal of Quality in Maintenance Engineering, Vol. 10 No. 2, pp. 154-64.
Witter, J., Clausing, D., Laufenberg, L. and de Andrade, R.S. (1999), “Reusability – the key tocorporate agility: its integration with enhanced quality function deployment”, World ClassDesign to Manufacture, Vol. 2 No. 1, pp. 25-33.
Yamashina, H. (2000), “Challenge to world-class manufacturing”, International Journal of Quality& Reliability Management, Vol. 17 No. 2, pp. 132-43.
Zairi, M. and Youssef, M.A. (1998), “Quality function deployment: a main pillar for successfultotal quality management and product development”, International Journal of Quality &Reliability Management, Vol. 12 No. 6, pp. 9-23.
Further reading
Chao, L.P. and Ishii, K. (2004), “Project quality function deployment”, International Journal ofQuality & Reliability Management, Vol. 21 No. 9, pp. 939-58.
da Silva, F.L.R., Cavalca, K.L. and Dedni, F.G. (2004), “Combined application of QFD and VAtools in the product design process”, International Journal of Quality & ReliabilityManagement, Vol. 21 No. 2, pp. 231-52.
JQME12,2
170

Eti, M., Ogagi, S.O.T. and Probert, S.D. (2004), “Implementing total productive maintenance inNigerian manufacturing industries”, Applied Energy, Vol. 79, pp. 385-401.
Lokamy, A. III and Khurana, A. (1995), “Quality function deployment: total quality managementfor new product design”, International Journal of Quality & Reliability Management, Vol. 12No. 6, pp. 73-84.
Sahney, S., Banwet, D.K. and Karunes, S. (2004), “A SERVQUAL and QFD approach to totalquality education-A student perspective”, International Journal of Productivity andPerformance Management, Vol. 53 No. 2, pp. 143-66.
Corresponding authorV.R. Pramod is the corresponding author and can be contacted at: [email protected]
To purchase reprints of this article please e-mail: [email protected] visit our web site for further details: www.emeraldinsight.com/reprints
IntegratingTPM and QFD
171