methodological aspects of the micronutrient assessment in
TRANSCRIPT

Cad. Saúde Pública 2021; 37(8):e00301120
This article is published in Open Access under the Creative Commons Attribution license, which allows use, distribution, and reproduction in any medium, without restrictions, as long as the original work is correctly cited.
Methodological aspects of the micronutrient assessment in the Brazilian National Survey on Child Nutrition (ENANI-2019): a population-based household survey
Aspectos metodológicos da avaliação de micronutrientes no Estudo Nacional de Alimentação e Nutrição Infantil (ENANI-2019): inquérito domiciliar de base populacional
Aspectos metodológicos de la evaluación de micronutrientes en el Estudio Nacional de Alimentación y Nutrición Infantil (ENANI-2019): encuesta domiciliaria de base poblacional
Inês Rugani Ribeiro de Castro 1
Paula Normando 2
Nadya Helena Alves-Santos 2
Flávia Fioruci Bezerra 1
Marta Citelli 1
Lucia de Fatima Campos Pedrosa 3
Alceu Afonso Jordão Junior 4
Pedro Israel Cabral de Lira 5
Fábio Augusto Kurscheidt 6
Paulo Ricardo Portella da Silva 6
Keronlainy Salvatte 2
Elisa Maria de Aquino Lacerda 1
Luiz Antonio dos Anjos 7
Cristiano Siqueira Boccolini 8
Gilberto Kac 2
ESPAÇO TEMÁTICO: ASPECTOS METODOLÓGICOS DO ENANI-2019THEMATIC SECTION: METHODOLOGICAL ASPECTS IN THE ENANI-2019
doi: 10.1590/0102-311X00301120
1 Instituto de Nutrição, Universidade do Estado do Rio de Janeiro, Rio de Janeiro, Brasil.2 Instituto de Nutrição Josué de Castro, Universidade Federal do Rio de Janeiro, Rio de Janeiro, Brasil.3 Departamento de Nutrição, Universidade Federal do Rio Grande do Norte, Natal, Brasil.4 Faculdade de Medicina de Ribeirão Preto, Universidade de São Paulo, Ribeirão Preto, Brasil.5 Centro de Ciências da Saúde, Universidade Federal de Pernambuco, Recife, Brasil.6 Diagnósticos do Brasil, São José dos Pinhais, Brasil.7 Departamento de Nutrição Social, Universidade Federal Fluminense, Rio de Janeiro, Brasil.8 Instituto de Comunicação e Informação Científica e Tecnológica em Saúde, Fundação Oswaldo Cruz, Rio de Janeiro, Brasil.
CorrespondenceG. KacDepartamento de Nutrição Social e Aplicada, Instituto de Nutrição Josué de Castro, Universidade Federal do Rio de Janeiro.Av. Brigadeiro Trompowsky s/n, Bloco J, 2o andar, Rio de Janeiro, RJ 21941-590, [email protected]
Abstract
This article aims to present methodological aspects on the collection, analy-ses, coverage, challenges, and the lessons learned from laboratory assessment of micronutrients on the Brazilian National Survey on Child Nutrition (ENANI-2019). This is a household survey on a probability sample of chil-dren under five years of age from 123 Brazilian municipalities in all 26 states and the Federal District. Blood samples were drawn by venipuncture at the homes of children 6 to 59 months of age. This procedure was performed by experienced phlebotomists from the laboratories located in the selected munici-palities and scheduled in advance. Blood and serum levels were measured for biomarkers of nutritional status, using the services of a clinical test laboratory with nationwide coverage, for the following micronutrients: iron (hemoglobin and ferritin), zinc, selenium, folic acid, and vitamins A, B1, B6, B12, D, and E. C-reactive protein was analyzed as a marker of inflammation. A barcode identifier was used to track the blood samples and to link the biochemical test results to the other data collected in the survey. A total of 14,558 children were studied. Of the 12,598 eligible children, 8,829 (70.1%) had blood samples drawn. Of the total number of children who had samples drawn, 91.8% (n = 8,025) have results for at least nine of the 12 analyses performed. Coverage of the analysis varied from 95% (for vitamins A and E) to 84.2% (for folic acid). Aliquots of whole blood and serum were stored in a biorepository for future analyses. The results of this pioneering study in the country will back the for-mulation and, when necessary, the reorientation of public policies in food and nutrition.
Micronutrients; Infant; Preschool Child; Methods; Laboratory Test

Castro IRR et al.2
Cad. Saúde Pública 2021; 37(8):e00301120
Introduction
Children under five years of age are among the groups at greatest risk of micronutrient deficiencies 1. According to estimates, at least 340 million children worldwide are affected 2, especially by iron, zinc, vitamin A, iodine, and folic acid deficiences 3,4,5. These deficiencies are more prevalent in develop-ing countries, where the simultaneous occurrence of two or more deficiencies is common 6. The consequences of deficiencies in this age group include serious outcomes such as growth deficit, low cognitive performance, immune system impairment, diarrhea, respiratory infection, night blindness, rickets, and others 7,8,9,10,11,12,13,14. Therefore, the prevention and control of micronutrient deficien-cies are priorities on the public health agenda 15,16. Knowledge of the magnitude and distribution of these deficiencies is essential for implementing adequate public policies based on each epidemiologi-cal profile reality.
The only nationwide survey in Brazil on micronutrient deficiency in children under five years of age was the Brazilian National Demographic and Health Survey (PNDS), conducted in 2006, which estimated the prevalence of anemia and vitamin A deficiency for Brazil and the country’s five major geographic regions 17. In addition to the 15 years since the PNDS, the assessment of hemoglobin and serum retinol was limited by the utilization of blood samples via capillary puncture and their storage in the form of dry blood spots for subsequent analysis of these biochemical markers. There has not been any estimate of nationwide population prevalence rates of their deficiencies in Brazilian for other micronutrients with relevance to public health and under-five children’s health, such as zinc, vitamin D, vitamin B12, and folic acid children.
The Brazilian National Survey on Child Nutrition (ENANI-2019) is the first nationally representa-tive Brazilian survey conducted to generate current, accurate, and more comprehensive evidence on the range of micronutrient deficiencies along with other target events related to food and nutrition in Brazilian children under five years of age. The study was structured in three domains: assessment of breastfeeding and dietary intake; anthropometric assessment of nutritional status; and assessment of micronutrient deficiencies (“micronutrients domain”). The objectives of the latter were to estimate the magnitude and distribution of anemia and micronutrient deficiencies (iron deficiency anemia and zinc and vitamins A, D, and B12 deficiencies) and to describe the status of the following micronutri-ents: vitamins B1, B6, and E, folic acid, and selenium.
Considering the study’s unprecedented nature, its relevance for reorientation of public poli-cies, and the logistic complexity for collecting, transporting, and storing samples and performing biochemical analyses under standardized conditions in an unequal and continental-size country like Brazil, the current article aims to present the methodological aspects related to the development of the micronutrients domain in the ENANI-2019, the results of the lab test coverage in the children studied, the challenges faced, and the lessons learned.
Method
Establishment of the expert group in the micronutrient domain
An expert group was established, consisting of professors from public universities from various regions of Brazil with experience in laboratory analyses of micronutrients and epidemiological stud-ies that included these analyses. Their responsibility was to support the Executive Committee of ENANI-2019 on decisions on methodological aspects of the micronutrient domain.
Study design, sampling, and population
ENANI-2019 is a population-based household survey in a probability sample of children under five years of age. A sample of 15,000 households was designed, distributed across 123 municipalities in Brazil’s 26 states and the Federal District. The sample was conceived to generate estimates for the five major geographic regions, and the weights were calibrated by the child’s age group and sex. Details of the sample design are available in Vasconcellos et al. 18.

ENANI-2019: MICRONUTRIENT ASSESSMENT 3
Cad. Saúde Pública 2021; 37(8):e00301120
Children from 6 to 59 months of age were considered eligible for drawing blood samples. Infants under 6 months were not included due to the greater difficulty with venipuncture and increased risk of post-blood draw complications (e.g., bruises) and the lack of reference values for the diagnosis of micronutrient deficiencies in this younger age group.
Ethical aspects
The study was approved by the Institutional Review Board of the Clementino Fraga Filho University Hospital of the Federal University of Rio de Janeiro (UFRJ) (CAAE n. 89798718.7.0000.5257). Data were collected after the child’s parents or guardians signed the the informed consent form. The labo-ratory test results were sent to the families. Children that presented clinical indications were referred to the public healthcare network.
Data collection and blood sample collection, processing, and storage
The Society for the Development of Scientific Research (Science) conducted the field research, hired, trained, and supervised (together with the Executive Committee) the interviewers responsible for visiting the households, obtaining the families’ consent, and performing interviews. The interviewers were responsible during the first home visit for scheduling the blood draws in children and the second visit, accompanying the blood sample collection itself, which was performed by a phlebotomist, as described below. Data were collected from March 2019 to March 2020, when the survey was inter-rupted due to the COVID-19 pandemic. Details on the study’s communication strategies before and during data collection, the overall training, data collection stages, and the implications of the survey´s interruption for the ENANI-2019 sample are available in Alves-Santos et al. 19.
Organization of the blood sample logistics
The complexity of the procedures for household blood sample collection, transportation of the samples to and analysis in a central laboratory, a requirement determined by the Brazilian Ministry of Health, demanded hiring a laboratory with a pre-established logistics plan to cover all states of the country and analytical capacity consistent with the study’s demands. Of the three preselected labora-tories, the choice was made for the central clinical testing laboratory Diagnósticos do Brasil (“DB”), which presented the technical capability for the work and a budget consistent with the project’s funds. DB analyzes biological specimens but does not directly perform the sample collection. Clinical test laboratories distributed throughout Brazil (referred to here as “partner laboratories”) were respon-sible for receiving the samples, screening, storing, and sending them to the Production Units. These partner laboratories are clients of DB and collected the biological samples. The samples were sent to DB with the support of the Regional Support Units (URA) that comprise the routine logistics system. For the test processing, DB has three Production Units located in São José dos Pinhais (Paraná State; main unit), Sorocaba (São Paulo State), and Recife (Pernambuco State).
DB conducted the following activities: selection, recruitment, and training the partner laborato-ries that conducted the blood sample collection in the 123 selected municipalities; organization of the household blood sample collection; and data recording in an information system that allowed the specimens’ traceability; transportation of the biological samples; performance of laboratory analyses; issuing individual reports with test results; generation of an identified database with the labora-tory test results; and storage of specimens in a biorepository. To advise the project in the process that culminated in the selection of DB and to monitor and support its activities, Campos D’Almeida Clinical Pathology Ltd. was hired, a company specializing in consultancy to projects involving clinical analysis services.
The procedures involved in the micronutrient domain were established jointly by DB and the Executive Committee that standardized the sample collection flows and analysis (details below). Based on these, a manual was produced with details on household blood sample collection proce-dures, processing of the biological specimens, data recording in an information system, and the pro-cess of sending the samples to DB 20. The manual was used to train the teams at DB and the partner

Castro IRR et al.4
Cad. Saúde Pública 2021; 37(8):e00301120
laboratories, as described next, and is available on the ENANI website (https://enani.nutricao.ufrj.br/wp-content/uploads/2020/07/Manual-de-Coleta-ENANI.pdf). The selection and recruitment of the partner laboratories and the training and monitoring of the work during the data collection were performed by DB supervisors and representatives, under the coordination of the Division of Strategic Operations (the “DB coordination”), supported by the Executive Committee.
Box 1 describes the criteria for the laboratories’ selection. DB’s partner laboratories that worked in the 123 municipalities in the study sample and met the listed criteria were suggested by DB and validated by the Executive Committee and were then recruited by DB to participate in the study. After formally confirming their participation in the study, the DB supervisors and representatives trained the sample collection and screening teams as well as the coordinations of the partner laboratories in face-to-face activities. Depending on the distribution of census tracts selected in each municipality and the laboratories’ capacity to cover the selected tracts, it was necessary to have more than one partner laboratory in the same city, resulting in 154 partner laboratories.
DB installed the offline system in the partner laboratories for recording the collected samples (“DB Fácil”) and produced the print forms for recording the information on blood sample collection and the kits for collecting the samples. The form contained the following information: child’s full name, date of birth, sex, weight, height, full name and taxpayer identification number of the child’s parent or guardian, date of blood sample collection, name and city of the laboratory, and the date the sample was sent to DB. The kits consisted of the following: 1 K2 EDTA tube, 2mL; 2 trace tubes, 6mL; 1 empty amber tube; aluminum foil for wrapping trace tubes; 1 10mL syringe; 1 25x7 disposable needle with safety lock; 1 21 G butterfly needle; 2 disposable Pasteur pipettes; 1 alcohol swab for antisepsis of the venipuncture site; 1 antiseptic bandage; and 5 preprinted labels with barcode: one for identifying the child (10 digits) to be attached to the information form, and four with barcodes derived from the former (12 digits each) for identification of each tube holding the biological specimens. The manuals, forms, and kits were distributed to the partner laboratories via the URA, which comprises the DB routine logistics system.
During the fieldwork, the dialogue with the partner laboratories and interviewers, supervisors, and state coordinators of Science was conducted by the DB supervisors and representatives. The
Box 1
Criteria for selection of partner laboratories that performed blood sample collection. Brazilian National Survey on Child Nutrition (ENANI-2019).
• Has a team trained to perform household blood sample collection in children under five years of age.• Has units near the target census tracts.• Has flexible sample collection hours (at least mornings, afternoons, and Saturdays).• Has favorable work hours for picking up specimens from the partner laboratory by Diagnósticos do Brasil to facilitate scheduling blood sample
collection throughout the day.• Performs complete blood counts routinely in equipment that assesses 18 parameters (red cells, white cells, platelets).• Can comply with and prove quality protocols in hematology: track record of certificates in Laboratory Excellence Program (PELM), current proof
of participation in external quality control programs, daily internal controls, batches, and expiration dates of inputs.• Has the technical capability, at the end of the data collection procedure and when the material reaches the laboratory, to monitor the
temperature in the cooler where the blood samples are held for transportation from the participant´s household to the partner laboratory.• Agrees to the prior installation of the remote access system for tracking the samples (DB Fácil).• Authorizes training the blood sample collection team on the project’s specificities and critical factors related to the sample’s temperature,
exposure to light, and delivery of the collected material within two hours, to be prepared for sending the specimens.• Is aware that the second sample collection caused by preanalytical errors under the laboratory’s responsibility, such as problems with
identification, inadequate samples, or incorrect packing and transportation, would be evaluated as compensation for the sample collection.• Agrees to use their collection materials if all the items in the supplied kit have been used in the first venipuncture attempt.

ENANI-2019: MICRONUTRIENT ASSESSMENT 5
Cad. Saúde Pública 2021; 37(8):e00301120
contact between the DB coordinators, the Executive Committee, and Science and DB teams for moni-toring the activities and solving the operational problems in the field was carried out through virtual meetings and message applications such as WhatsApp. The Executive Committee also monitored and referred fieldwork demands received through the study’s communications channels (website, e-mail, and toll-free telephone lines provided for questions and complaints).
Collection, processing, and storage of biological specimens
During the first visit to the household, based on the partner laboratory’s availability for perform-ing the household blood sample collection, the interviewer scheduled the best day and time for the participants, advised the partner laboratory, and recorded this information in a leaflet left with the family and in the mobile data collection device (MDC). Next, following the content in the leaflet, the interviewer oriented the family that fasting and changes in medication would not be necessary for drawing the blood sample. On the eve of the blood sample collection, the interviewer contacted the family by telephone to confirm the procedure. On the scheduled day and at the scheduled time, the interviewer accompanied the laboratory’s phlebotomist to the household and, when necessary, helped the phlebotomist hold the child to draw the blood sample (Figure 1).
An 8mL blood sample was drawn from each child, distributed in the trace tube (6mL) and next in the EDTA tube (2mL). When the collected volume was less than 8mL, the priority was to fill the EDTA tube with 2mL to guarantee performing the complete blood count, considered a priority in the ENANI-2019. Immediately after drawing the sample, the trace tube was wrapped in aluminum foil to avoid contact with light and guarantee the samples’ stability for the analysis of vitamins A and E. After drawing the sample, the material was stored in a cooler with a controlled temperature at 2ºC to
Figure 1
Flowchart of procedures involved in blood sample collection and processing of specimens. Brazilian National Survey on Child Nutrition (ENANI-2019).
DB: Diagnósticos do Brasil.
Castro IRR et al.6
Cad. Saúde Pública 2021; 37(8):e00301120
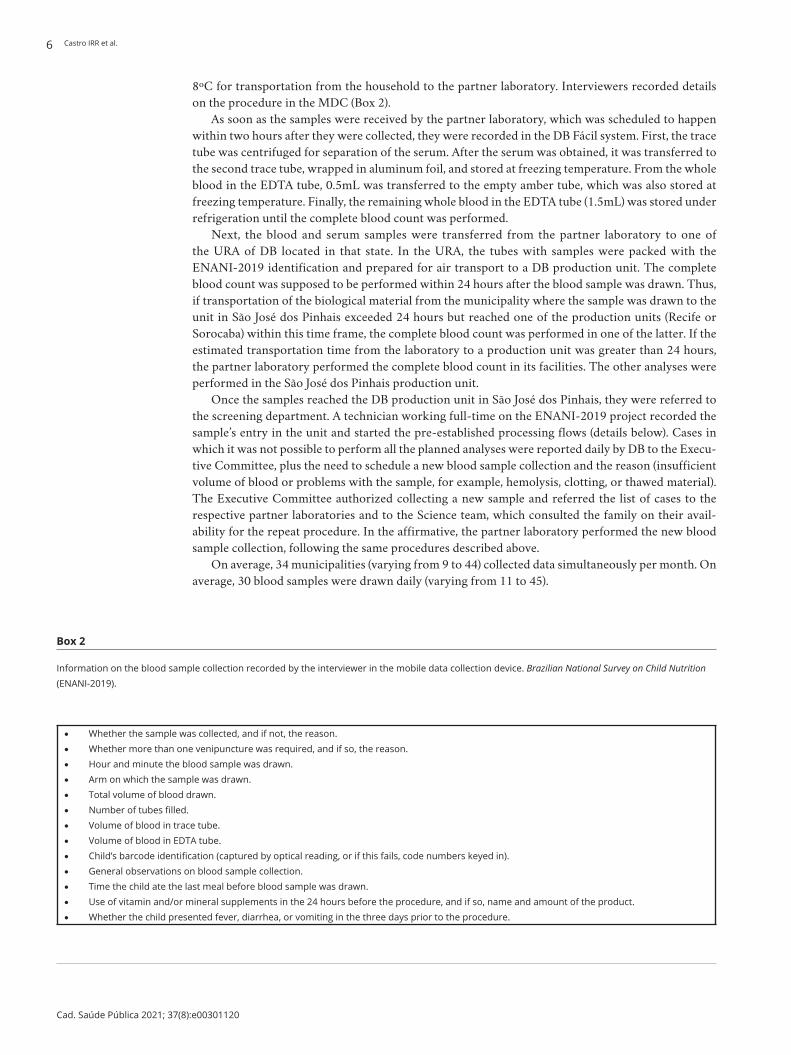
8ºC for transportation from the household to the partner laboratory. Interviewers recorded details on the procedure in the MDC (Box 2).
As soon as the samples were received by the partner laboratory, which was scheduled to happen within two hours after they were collected, they were recorded in the DB Fácil system. First, the trace tube was centrifuged for separation of the serum. After the serum was obtained, it was transferred to the second trace tube, wrapped in aluminum foil, and stored at freezing temperature. From the whole blood in the EDTA tube, 0.5mL was transferred to the empty amber tube, which was also stored at freezing temperature. Finally, the remaining whole blood in the EDTA tube (1.5mL) was stored under refrigeration until the complete blood count was performed.
Next, the blood and serum samples were transferred from the partner laboratory to one of the URA of DB located in that state. In the URA, the tubes with samples were packed with the ENANI-2019 identification and prepared for air transport to a DB production unit. The complete blood count was supposed to be performed within 24 hours after the blood sample was drawn. Thus, if transportation of the biological material from the municipality where the sample was drawn to the unit in São José dos Pinhais exceeded 24 hours but reached one of the production units (Recife or Sorocaba) within this time frame, the complete blood count was performed in one of the latter. If the estimated transportation time from the laboratory to a production unit was greater than 24 hours, the partner laboratory performed the complete blood count in its facilities. The other analyses were performed in the São José dos Pinhais production unit.
Once the samples reached the DB production unit in São José dos Pinhais, they were referred to the screening department. A technician working full-time on the ENANI-2019 project recorded the sample’s entry in the unit and started the pre-established processing flows (details below). Cases in which it was not possible to perform all the planned analyses were reported daily by DB to the Execu-tive Committee, plus the need to schedule a new blood sample collection and the reason (insufficient volume of blood or problems with the sample, for example, hemolysis, clotting, or thawed material). The Executive Committee authorized collecting a new sample and referred the list of cases to the respective partner laboratories and to the Science team, which consulted the family on their avail-ability for the repeat procedure. In the affirmative, the partner laboratory performed the new blood sample collection, following the same procedures described above.
On average, 34 municipalities (varying from 9 to 44) collected data simultaneously per month. On average, 30 blood samples were drawn daily (varying from 11 to 45).
• Whether the sample was collected, and if not, the reason.• Whether more than one venipuncture was required, and if so, the reason.• Hour and minute the blood sample was drawn.• Arm on which the sample was drawn.• Total volume of blood drawn.• Number of tubes filled.• Volume of blood in trace tube.• Volume of blood in EDTA tube.• Child’s barcode identification (captured by optical reading, or if this fails, code numbers keyed in).• General observations on blood sample collection.• Time the child ate the last meal before blood sample was drawn.• Use of vitamin and/or mineral supplements in the 24 hours before the procedure, and if so, name and amount of the product.• Whether the child presented fever, diarrhea, or vomiting in the three days prior to the procedure.
Box 2
Information on the blood sample collection recorded by the interviewer in the mobile data collection device. Brazilian National Survey on Child Nutrition (ENANI-2019).

ENANI-2019: MICRONUTRIENT ASSESSMENT 7
Cad. Saúde Pública 2021; 37(8):e00301120
Laboratory analyses
Complete blood count and analyses to determine ferritin, zinc, selenium, vitamin A, vitamin D, vita-min E, vitamin B1, vitamin B6, vitamin B12, and folic acid concentrations were performed. C-reactive protein (CRP) was assessed to define the cutoff points for the assessment of ferritin levels 21,22 and the interpretation of parameters that could potentially have their results influenced by infectious and/or inflammatory processes (zinc, selenium, and vitamin A) 23,24,25. The list of target markers was defined according to the initial demand by the Brazilian Ministry of Health, the epidemiological rel-evance in the population group, the impact on the cost of the analyses, and the total volume of blood to be drawn.
The analyses were also performed in serum samples with mild hemolysis, except for the deter-mination of vitamin B12 and folic acid levels. No analyses were performed in serum samples with moderate to intense hemolysis. After all the analyses were completed, the remaining volume of serum and whole blood was divided into aliquots in 1.5mL microtubes, labeled with barcodes identifying the child and referred to the biorepository for storage in a freezer -80ºC for future analyses. The control of the location and volume effectively stored in the freezer was done with a specific control system (Matrix Connect software; http://matrixsaude.com/).
Figure 2 shows the DB laboratory analysis flow, designed to meet the demand of the ENANI-2019. Box 3 lists the types of biological specimens and respective analytical methods.
All information produced by the partner laboratories, including monitoring the temperature of the biological samples in different stages of the process, were systematically provided by the DB to Executive Committee for monitoring purposes. For quality control of the analyses, in addition to presenting a certificate of accreditation (DICQ National Accreditation System; https://acreditacao.org.br/), the DB submitted monthly reports to the Executive Committee with the internal quality controls of the analyses performed, and batches and expiration dates of the kits use in the analyses and external quality control certificates. The partner laboratories that conducted the complete blood count internally provided the same documents as the DB for their quality control. In addition, to comply with international practices 26, the performance of the method used to analyze vitamin D was verified with an assay validated by the Vitamin D External Quality Assessment Scheme (DEQAS; http://www.deqas.org/).
The Executive Committee monitored the results provided by the DB weekly in the form of a data-base through descriptive statistical analyses, histograms, and boxplots. This monitoring was comple-mented with regular meetings, including participation by the coordinators of the DB, the Executive Committee, and, when necessary, DB supervisors and representatives, and members of Science.
Feedback of results
The results of the anthropometric assessment of the child and biological mother and the child’s blood tests were provided to the parents or guardians on the survey’s website and sent by e-mail, social net-work messages (Facebook, Instagram), a message app (WhatsApp), or when requested by the family at the time of the interview, by print document sent by post to the child’s address. Whenever alterations were detected in hemoglobin, ferritin, or vitamin A levels, the children were referred to healthcare units close to their place of residence.
Database linkage
Once the fieldwork was concluded, the database generated by DB with the results of the children’s laboratory analyses was linked to the Science database with the information from the interviews with the families. The variable used for this linkage was the child’s barcode identification present on the label attached to the blood sample collection form and on the tubes, since this barcode was also recorded on the child’s electronic interview form through image capture with the MDC.

Castro IRR et al.8
Cad. Saúde Pública 2021; 37(8):e00301120
Figure 2
Flowchart of procedures involved in blood sample collection and processing of specimens. Brazilian National Survey on Child Nutrition (ENANI-2019).
CRP: C-reactive protein.
Results
The survey studied 12,524 households and 14,558 children. Of the 12,598 children eligible for draw-ing blood samples (age ≥ 6 months), 70.1% (n = 8,829) had samples drawn.
Coverage of the blood sample collection varied according to major geographic region (from 56.1% in the South to 84% in the North) and age group and was higher in children 24 to 59 months of age (72.3%), compared to those 6 to 23 months of age (65.8%) (Table 1). Coverage rates were similar betwe-en children 24 to 47 and 48 to 59 months old and greater in younger children.
The main reasons for not drawing blood samples were abandonment or non-authorization by the parent at the time of sample collection, operational problems with the laboratory, or difficulty

ENANI-2019: MICRONUTRIENT ASSESSMENT 9
Cad. Saúde Pública 2021; 37(8):e00301120
Box 3
Type of biological material and laboratory methods used. Brazilian National Survey on Child Nutrition (ENANI-2019).
PARAMETER BIOLOGICAL MATERIAL
METHOD EQUIPMENT
Complete blood count Whole blood Hematological analyzer with flow cytometry cell analysis
UniCell DxH, Beckman Coulter (Brea, United States)
Vitamin A and vitamin E Serum High-performance liquid chromatography (HPLC) with
ultraviolet detection
HPLC, Chromsystems (Gräfelfing, Germany)
Selenium and zinc Serum Inductively coupled plasma mass spectrometry
7700 Series ICP-MS, Agilent (Santa Clara, United States)
Ferritin, vitamin D [25(OH)D], vitamin B12, and folic acid
Serum Chemiluminescence immunoassay DxI 800, Beckman Coulter (Brea, United States)
Vitamin B1 * and vitamin B6 ** Whole blood High-performance liquid chromatography (HPLC) with
detection by fluorescence
HPLC, Chromsystems (Gräfelfing, Germany)
Ultrasensitive C-reactive protein Serum Immunoturbidimetry AU5800, Beckman Coulter (Brea, United States)
* Thiamine pyrophosphate (TPP); ** Pyridoxal phosphate (PLP).
Table 1
Coverage of blood sample collection in children 6 to 59 months of age according to major geographic region and child’s age group. Brazilian National Survey on Child Nutrition (ENANI-2019).
Variables Number of eligible children Proportion of children with blood samples drawn (%)
Geographic region
North 2,362 84.0
Northeast 2,452 78.1
Southeast 2,726 64.5
South 2,380 56.1
Central West 2,768 68.6
Age group (months)
6-23 4,362 65.8
24-59 8,236 72.3
Total 12,598 70.1
performing the venipuncture, which jointly accounted for 76.2% of the reasons for failure to draw samples. Analyzing by age group (6-23 versus 24-59 months), the distribution of reasons was similar, except for difficulty performing venipuncture, which was more common in younger children, as expected (Table 2).
Among the 8,829 children who had blood samples drawn, 32.9% (n = 2,906) required a second collection for at least one parameter and 1.1% (n = 89) for all of them. The reasons for repeat blood sample collection were insufficient biological material for performing the analyses (52.6%), hemolysis

Castro IRR et al.10
Cad. Saúde Pública 2021; 37(8):e00301120
Table 2
Relative frequency of reasons for not drawing blood samples, according to age group. Brazilian National Survey on Child Nutrition (ENANI-2019).
Reason Total (n = 3,769) * 6-23 months (n = 1,492) 24-59 months (n = 2,277)
% % %
Parent/guardian did not provide authorization 53.0 50.5 54.5
Operational problems with laboratory ** 13.2 11.1 14.7
Difficulty performing venipuncture 10.0 15.5 6.3
Parent/guardian was not home or did not answer the door 8.6 8.7 8.5
Fieldwork interrupted due to COVID-19 pandemic 5.3 5.6 5.0
Child unavailable for procedure *** 3.1 2.1 3.7
Family moved 1.7 1.4 1.9
Urban violence 0.9 0.7 1.0
Others 2.1 2.7 2.0
Not reported by the interviewer 2.1 1.7 2.4
* 3,769 = 12,598 (eligible children) - 8,829 (children with blood samples drawn); ** For example, the laboratory’s visiting hours incompatible with the family’s schedule; *** Child was at daycare center/school, child was not home, child was sick or sleeping, and no new date was scheduled for blood sample collection.
of the sample (27.4%), failure of preanalytical procedures to comply with the study protocol (5.7%), and others (8.1%). Of all the cases in which a second blood sample was indicated, 28.1% (n = 623) had a second sample drawn.
The medians (and 25th and 75th percentiles) time intervals between the interview and the blood sample collection, between the interview and the repeat collection, and between the first and second sample collections were 5 (2; 8), 66 (40; 100), and 55 (35; 94) days, respectively. In 1,247 children, more than one venipuncture was necessary during the collection (or repeat collection), with the main rea-sons recorded as “difficult venous access” (46.8%), “agitated child” (30.4%), “too little blood” (16.8%), and others (5.9%).
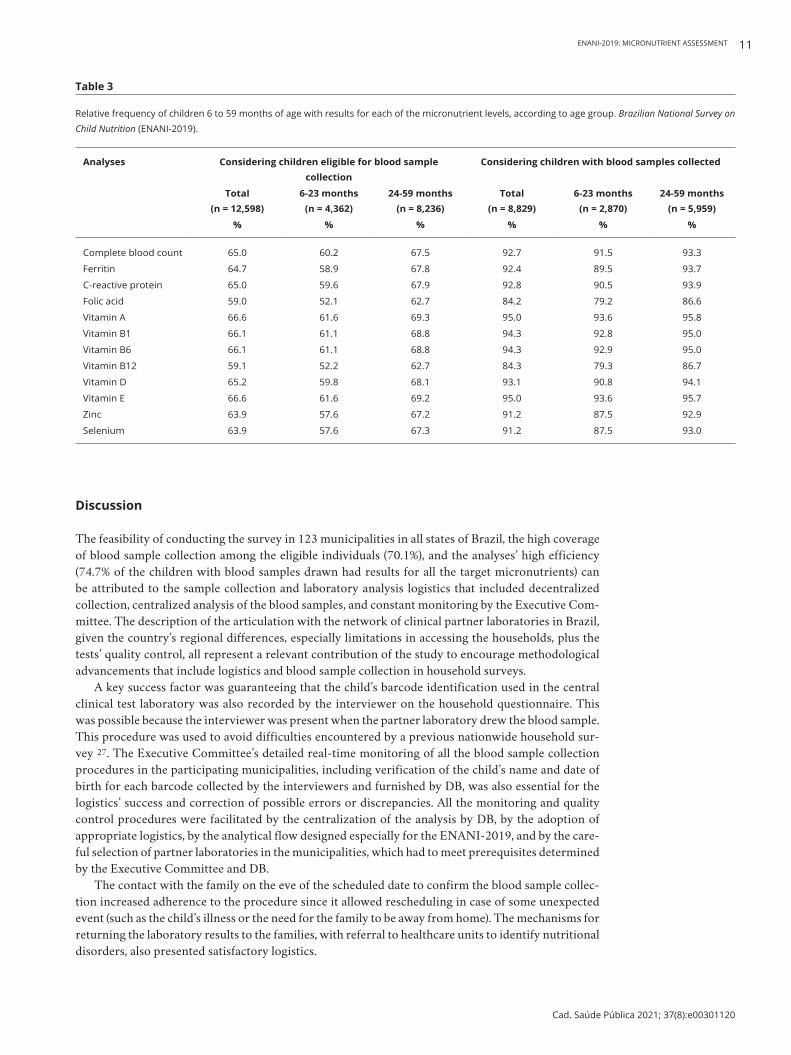
Of the 8,829 children who had blood samples drawn, 8,739 (99%) had the results for at least one of the target parameters, and 74.7% (n = 6,532) for all the parameters; 17.1% (n = 1,493) for 9 to 11; 4.3% (n = 379) for 6 to 8; and 3.8% (n = 335) for five or fewer parameters. The coverage per micronutrient ranged from 95% (for vitamins A and E) to 84.2% (folic acid) and was always higher in children 24 months or older (Table 3). Of all the complete blood counts (n = 8,187), 57.8% (n = 4,734) were per-formed by partner laboratories, and the rest by one of the DB production units.
The monthly internal quality controls for the 12 micronutrients met the criterion for acceptable analytical performance, with variation up to two standard deviations from the predetermined mean in the control sample concentrations. External controls were performed periodically and certified as adequate for all the micronutrient parameters. In the performance assessment of the 25(OH)D analysis, the results were considered satisfactory according to the DEQAS and consistent with those obtained by other laboratories participating in the external quality assessment protocol, and that used the same equipment (Beckman Unicel; https://www.beckmancoulter.com).
The biorepository has 6,969 aliquots of whole blood and 8,148 aliquots of serum stored in a fre-ezer at -80ºC for future analyses.
ENANI-2019: MICRONUTRIENT ASSESSMENT 11
Cad. Saúde Pública 2021; 37(8):e00301120
Table 3
Relative frequency of children 6 to 59 months of age with results for each of the micronutrient levels, according to age group. Brazilian National Survey on Child Nutrition (ENANI-2019).
Analyses Considering children eligible for blood sample collection
Considering children with blood samples collected
Total (n = 12,598)
6-23 months (n = 4,362)
24-59 months (n = 8,236)
Total (n = 8,829)
6-23 months (n = 2,870)
24-59 months (n = 5,959)
% % % % % %
Complete blood count 65.0 60.2 67.5 92.7 91.5 93.3
Ferritin 64.7 58.9 67.8 92.4 89.5 93.7
C-reactive protein 65.0 59.6 67.9 92.8 90.5 93.9
Folic acid 59.0 52.1 62.7 84.2 79.2 86.6
Vitamin A 66.6 61.6 69.3 95.0 93.6 95.8
Vitamin B1 66.1 61.1 68.8 94.3 92.8 95.0
Vitamin B6 66.1 61.1 68.8 94.3 92.9 95.0
Vitamin B12 59.1 52.2 62.7 84.3 79.3 86.7
Vitamin D 65.2 59.8 68.1 93.1 90.8 94.1
Vitamin E 66.6 61.6 69.2 95.0 93.6 95.7
Zinc 63.9 57.6 67.2 91.2 87.5 92.9
Selenium 63.9 57.6 67.3 91.2 87.5 93.0
Discussion
The feasibility of conducting the survey in 123 municipalities in all states of Brazil, the high coverage of blood sample collection among the eligible individuals (70.1%), and the analyses’ high efficiency (74.7% of the children with blood samples drawn had results for all the target micronutrients) can be attributed to the sample collection and laboratory analysis logistics that included decentralized collection, centralized analysis of the blood samples, and constant monitoring by the Executive Com-mittee. The description of the articulation with the network of clinical partner laboratories in Brazil, given the country’s regional differences, especially limitations in accessing the households, plus the tests’ quality control, all represent a relevant contribution of the study to encourage methodological advancements that include logistics and blood sample collection in household surveys.
A key success factor was guaranteeing that the child’s barcode identification used in the central clinical test laboratory was also recorded by the interviewer on the household questionnaire. This was possible because the interviewer was present when the partner laboratory drew the blood sample. This procedure was used to avoid difficulties encountered by a previous nationwide household sur-vey 27. The Executive Committee’s detailed real-time monitoring of all the blood sample collection procedures in the participating municipalities, including verification of the child’s name and date of birth for each barcode collected by the interviewers and furnished by DB, was also essential for the logistics’ success and correction of possible errors or discrepancies. All the monitoring and quality control procedures were facilitated by the centralization of the analysis by DB, by the adoption of appropriate logistics, by the analytical flow designed especially for the ENANI-2019, and by the care-ful selection of partner laboratories in the municipalities, which had to meet prerequisites determined by the Executive Committee and DB.
The contact with the family on the eve of the scheduled date to confirm the blood sample collec-tion increased adherence to the procedure since it allowed rescheduling in case of some unexpected event (such as the child’s illness or the need for the family to be away from home). The mechanisms for returning the laboratory results to the families, with referral to healthcare units to identify nutritional disorders, also presented satisfactory logistics.

Castro IRR et al.12
Cad. Saúde Pública 2021; 37(8):e00301120
There were some challenges in the micronutrient domain of the ENANI-2019. Some of the families’ housing conditions hindered positioning the child properly for venipuncture. The second sample collections were relatively frequent and explained by the difficulty in household blood sample collection in children, which impacted the study financially and operationally. The complete blood counts were not centralized since, in some municipalities, the transportation time of the biological material to a DB unit exceeded 24 hours. One limitation of the study was the lack of reliability and validity assessment of the complete blood counts performed in different laboratories. To attenuate this limitation, the study attempted to guarantee inter-laboratory comparability with the requirement of adopting similar quality control procedures to those of the central laboratory and the availability of equipment to perform complete blood counts with at least 18 parameters.
The obstacles faced with the partner laboratories included withdrawal by some from participat-ing in the survey, requiring selection and training of a new laboratory with the study underway; and changes in the laboratories’ routine, leading to fewer options for times to schedule household blood sample collection after the fieldwork had already begun. It was also challenging to collect data in areas with high rates of urban violence and in those in which fake news about the study circulated, spread-ing the idea that the blood sample collection aimed to transmit infectious diseases or that associated the interviewers with groups that kidnapped children or stole organs (more details in Alves-Santos et al. 19).
Another challenge was the families’ adherence to blood sample collection. Although all the fami-lies that participated in the study had agreed to the blood sample procedure when they were recruited, the procedure was not carried out in some instances due to the lack of adherence. In future studies, communication and awareness-raising strategies to increase adherence to the procedure should be implemented to expand coverage of the laboratory analyses. It is promising to link centralized and decentralized strategies. The former comprises contact with municipal administrators and local media. The later includes awareness-raising of community-based health agents that work in the target areas, awareness-raising of local organizations such as neighborhood associations, and local communication such as community radio stations and cars with loudspeakers. The reinforcement of training and monitoring the partner laboratories in the collection and transportation of the blood samples can also help improve the sample collection coverage and the performance of all the planned analyses and for all the children.
The lessons from the study featured investing in communication with the local community and with society in general as a strategic element in the study 19; considering second sample collection as a relevant element in household surveys that include children; guaranteeing that the interviewer and phlebotomist worked together when the blood sample was drawn and that the child’s identification number was recorded on both the interview form and the specimens, and providing a strategy for confirming the scheduled blood sample collection on the eve of the procedure.
Final remarks
ENANI-2019 was the first nationwide household survey in Brazil aimed to investigate the prevalence of a wide range of micronutrient deficiencies in children 6-59 months of age and that guaranteed the use of reference methods for estimating the prevalence of anemia and vitamin A deficiency, priority disorders on the public policy agenda. The results will back the formulation and reorientation of pub-lic policies aimed at preventing and controlling micronutrient deficiencies and promoting adequate and healthy diet and the population’s food and nutrition security. In addition, the database generated by the study will allow knowing the magnitude and distribution of micronutrient deficiencies. It will also allow the assessment of the nutritional status of micronutrients through examination of the association between biochemical profile, dietary intake, use of vitamin and mineral supplements and anthropometric indicators, and sociodemographic, economic, and household factors, among others. Given this national survey’s importance, complexity, and unprecedentedness, it is relevant to publish the methodological approach and the reflections on challenges and lessons learned to back future household-based epidemiological studies on the assessment of micronutrient nutritional status.
ENANI-2019: MICRONUTRIENT ASSESSMENT 13
Cad. Saúde Pública 2021; 37(8):e00301120
Contributors
All authors contributed to the study conception and design, writing and review, and approved the final version of the article.
Additional informations
ORCID: Inês Rugani Ribeiro de Castro (0000-0002-7479-4400); Paula Normando (0000-0002-6443-7733); Nadya Helena Alves-Santos (0000-0002-0098-6047); Flávia Fioruci Bezerra (0000-0002-6594-4323); Marta Citelli (0000-0003-1380-3729); Lucia de Fatima Campos Pedrosa (0000-0002-5436-5115); Alceu Afonso Jordão Junior (0000-0003-1288-0802); Pedro Israel Cabral de Lira (0000-0002-1534-1620); Fábio Augusto Kurscheidt (0000-0002-0863-7765); Paulo Ricardo Portella da Silva (0000-0002-1002-9136); Keronlainy Salvat-te (0000-0002-1314-9862); Elisa Maria de Aquino Lacerda (0000-0002-1830-4278); Luiz Antonio dos Anjos (0000-0002-5257-6912); Cristiano Siqueira Boccolini (0000-0002-4804-5641); Gilberto Kac (0000-0001-8603-9077).
Acknowledgments
To the professors of Brazilian universities who col-laborated in the planning of the research. To the institutions that allowed the central training to be carried out on their premises (Rio de Janeiro State Univesity – UERJ; Minas Gerais Federal University – UFMG; Paraná Federal University – UFPR; Ama-zonas Federal University – UFAM; São Paulo State University – USP; Pará Federal University – UFPA; and Pernambuco Federal University – UFPE). To the participating families who made this study pos-sible. To Dayana Farias, Talita Berti, Letícia Vertul-li, Maiara Freitas, Neilane Bertoni, Raquel Schin-caglia, Pedro Gomes, Juliana Mello, Ana Beatriz Rodrigues, and Letícia Ramos for their support in the fieldwork. To the Brazilian Ministry of Health/Brazilian Nacional Research Council (CPNq) – pro-cess: 440890/2017-9.
References
1. Bailey RL, West KP, Black RE. The epidemiol-ogy of global micronutrient deficiencies. Ann Nutr Metab 2015; 66 Suppl 2:22-33.
2. Keeley B, Little C, Zuehlke E. The State of the World’s Children 2019. Children, food and nu-trition: growing well in a changing world. New York: United Nations Children’s Fund; 2019.
3. Black RE, Victora CG, Walker SP, Bhutta ZA, Christian P, de Onis M, et al. Maternal and child undernutrition and overweight in low-income and middle-income countries. Lancet 2013; 382:427-51.
4. Stevens GA, Finucane MM, De-Regil LM, Pa-ciorek CJ, Flaxman SR, Branca F, et al. Global, regional, and national trends in haemoglobin concentration and prevalence of total and se-vere anaemia in children and pregnant and non-pregnant women for 1995-2011: a system-atic analysis of population-representative data. Lancet Glob Health 2013; 1:e16-25.
5. Stevens GA, Bennett JE, Hennocq Q, Lu Y, De-Regil LM, Rogers L, et al. Trends and mortality effects of vitamin A deficiency in children in 138 low-income and middle-income countries between 1991 and 2013: a pooled analysis of population-based surveys. Lancet Glob Health 2015; 3:e528-36.
6. Muthayya S, Rah JH, Sugimoto JD, Roos FF, Kraemer K, Black RE. The global hidden hun-ger indices and maps: an advocacy tool for ac-tion. PLoS One 2013; 8:e67860.
7. Tanumihardjo SA, Russell RM, Stephensen CB, Gannon BM, Craft NE, Haskell MJ, et al. Bio-markers of Nutrition for Development (BOND) – vitamin A review. J Nutr 2016; 146:1816S-48S.
8. Lynch S, Pfeiffer CM, Georgieff MK, Brit-tenham G, Fairweather-Tait S, Hurrell RF, et al. Biomarkers of Nutrition for Development (BOND) – iron review. J Nutr 2018; 148 Suppl 1:1001S-67S.
9. King JC, Brown KH, Gibson RS, Krebs NF, Lowe NM, Siekmann JH, et al. Biomarkers of Nutrition for Development (BOND) – zinc re-view. J Nutr 2015; 146:858S-85S.
10. Bailey LB, Stover PJ, McNulty H, Fenech MF, Gregory JF, Mills JL, et al. Biomarkers of Nutri-tion for Development – folate review. J Nutr 2015; 145:1636S-80S.
11. Allen LH, Miller JW, de Groot L, Rosenberg IH, Smith AD, Refsum H, et al. Biomarkers of Nu-trition for Development (BOND): vitamin B-12 review. J Nutr 2018;148 Suppl 4:1995S-2027S.
12. Brion LP, Bell EF, Raghuveer TS. Vitamin E supplementation for prevention of morbidity and mortality in preterm infants. Cochrane Da-tabase Syst Rev 2003; (4):CD003665.
13. Holick MF. The vitamin D deficiency pan-demic: approaches for diagnosis, treatment and prevention. Rev Endocr Metab Disord 2017; 18:153-65.

Castro IRR et al.14
Cad. Saúde Pública 2021; 37(8):e00301120
14. Yakoob MY, Lo CW. Nutrition (micronutrients) in child growth and development: a systematic review on current evidence, recommendations and opportunities for further research. J Dev Behav Pediatr 2017; 38:665-79.
15. World Health Organization. Guideline: inter-mittent iron supplementation in preschool and school-age children. Geneva: World Health Or-ganization; 2011.
16. World Health Organization. Guideline: vitamin A supplementation in infants and children 6-59 months of age. Geneva: World Health Organi-zation; 2011.
17. Ministério da Saúde. Pesquisa Nacional de Demografia e Saúde da Criança e da Mulher – PNDS 2006: dimensões do processo reproduti-vo e da saúde da criança. Brasília: Ministério da Saúde; 2009.
18. Vasconcellos MTL, Silva PLN, Castro IRR, Boccolini CS, Alves-Santos NH, Kac G. Sam-pling plan of the Brazilian National Survey on Child Nutrition (ENANI-2019): a population-based household survey. Cad Saúde Pública 2021; 37:e00037221.
19. Alves-Santos NH, Castro IRR, Anjos LA, Lacer-da EMA, Normando P, Freitas MB, et al. Gen-eral methodological aspects in the Brazilian Na-tional Survey on Child Nutrition (ENANI-2019): a population-based household survey. Cad Saúde Pública 2021; 37:e00300020.
20. Diagnósticos do Brasil. Manual de procedi-mentos de coleta e envio de amostras: ENANI – Estudo Nacional de Alimentação e Nutrição Infantil. https://enani.nutricao.ufrj.br/wp-con tent/uploads/2020/07/Manual-de-Coleta- ENANI.pdf/ (accessed on 18/May/2020).
21. Jaye DL, Waites KB. Clinical applications of C-reactive protein in pediatrics. Pediatr Infect Dis J 1997; 16:735-46.
22. World Health Organization. WHO guideline on use of ferritin concentrations to assess iron status in individuals and populations. Geneva: World Health Organization; 2020.
23. Galloway P, McMillan DC, Sattar N. Effect of the inflammatory response on trace element and vitamin status. Ann Clin Biochem 2000; 37(Pt 3):289-97.
24. Diana A, Haszard JJ, Purnamasari DM, Nuru-lazmi I, Luftimas DE, Rahmania S, et al. Iron, zinc, vitamin A and selenium status in a cohort of Indonesian infants after adjusting for in-flammation using several different approaches. Br J Nutr 2017; 118:830-9.
25. McDonald CM, Suchdev PS, Krebs NF, Hess SY, Wessells KR, Ismaily S, et al. Adjusting plas-ma or serum zinc concentrations for inflamma-tion: Biomarkers Reflecting Inflammation and Nutritional Determinants of Anemia (BRIN-DA) project. Am J Clin Nutr 2020; 111:927-37.
26. Carter GD, Berry J, Durazo-Arvizu R, Gunter E, Jones G, Jones J, et al. Hydroxyvitamin D as-says: an historical perspective from DEQAS. J Steroid Biochem Mol Biol 2018; 177:30-5.
27. Szwarcwald CL, Malta DC, Souza Júnior PRB, Almeida WS, Damacena GN, Pereira CA, et al. Laboratory exams of the National Health Sur-vey: methodology of sampling, data collection and analysis. Rev Bras Epidemiol 2019; 22 Sup-pl 2:e190004.

ENANI-2019: MICRONUTRIENT ASSESSMENT 15
Cad. Saúde Pública 2021; 37(8):e00301120
Submitted on 18/Oct/2020Final version resubmitted on 17/May/2021Approved on 28/May/2021
Resumo
O objetivo deste artigo é apresentar os aspectos metodológicos referentes à coleta e análise de da-dos laboratoriais do Estudo Nacional de Ali-mentação e Nutrição Infantil (ENANI-2019), a cobertura das análises laboratoriais, os desafios enfrentados e as lições aprendidas. Trata-se de um inquérito populacional de base domiciliar de crianças menores de cinco anos realizado em 123 municípios dos 26 estados da Federação e o Distri-to Federal. A coleta de sangue por punção venosa foi realizada em domicílio em crianças com idade entre 6 e 59 meses, por coletador experiente de la-boratório(s) existente(s) nos municípios amostra-dos. Foram determinadas as concentrações sanguí-neas e séricas de biomarcadores do estado nutri-cional utilizando os serviços de um laboratório de análises clínicas com abrangência nacional para os seguintes micronutrientes: ferro (hemoglobina e ferritina), zinco, selênio, ácido fólico, vitaminas A, B1, B6, B12, D e E. A proteína C reativa foi ana-lisada como marcador de inflamação. Um código de barras identificador das amostras de sangue foi utilizado para o rastreio da amostra e para a jun-ção dos resultados dos exames bioquímicos com os demais dados coletados na pesquisa. Foram estu-dadas 14.558 crianças. Das 12.598 elegíveis, 8.829 (70,1%) realizaram coleta de sangue. Do total de crianças que realizaram coleta de sangue, 91,8% (n = 8.025) têm resultados para pelo menos nove das 12 análises realizadas. A cobertura por análise variou de 95% (para vitaminas A e E) a 84,2% (pa-ra ácido fólico). Os resultados deste estudo pioneiro subsidiarão a formulação e, quando for o caso, o redirecionamento de políticas públicas de alimen-tação e nutrição.
Micronutrientes; Lactente; Pré-Escolar; Métodos; Testes Laboratoriais
Resumen
El objetivo de este artículo es presentar aspectos metodológicos, respecto a la recogida y análisis de datos de laboratorio del Estudio Nacional de Ali-mentación y Nutrición Infantil (ENANI-2019), así como la cobertura de los mismos, los desafíos enfrentados y lecciones aprendidas. Se trata de una encuesta poblacional de base domiciliaria con niños menores de cinco años, realizada en 123 municipios de los 26 estados de la Federación y el Distrito Federal. La recogida de sangre por pun-ción venosa se realizó en domicilios con niños, de edades comprendidas entre los 6 y los 59 meses, con la intervención de un flebotomista con expe-riencia en laboratorio(s) existente(s) en los muni-cipios de muestra. Se determinaron las concen-traciones sanguíneas y séricas de biomarcadores del estado nutricional, utilizando los servicios de un laboratorio de análisis clínicos con alcance na-cional para los siguientes micronutrientes: hierro (hemoglobina y ferritina), zinc, selenio, ácido fóli-co, vitaminas A, B1, B6, B12, D y E. La proteína C reactiva se analizó como marcador de infla-mación. Un código de barras identificador de las muestras de sangre se utilizó para el rastreo de la muestra y para la conjunción de los resultados de los exámenes bioquímicos con los demás datos re-cogidos en la investigación. Se estudiaron 14.558 niños. De los 12.598 elegibles, a 8.829 (70,1%) se les sacó sangre. Del total de niños, a quienes se les tomó muestras de sangre, un 91,8% (n = 8.025) obtuvieron resultados para por lo menos nueve de los 12 análisis realizados. La cobertura por análi-sis varió de un 95% (para vitaminas A y E), a un 84,2% (para ácido fólico). Los resultados de este es-tudio pionero apoyarán la formulación y, cuando fuera necesario, la redirección de políticas públicas de alimentación y nutrición.
Micronutrientes; Lactante; Preescolar; Métodos; Prueba de Laboratorio