methodological aspects and usefulness of quantitative ...465976/fulltext01.pdfmethodological aspects...
TRANSCRIPT

Methodological aspects and usefulness of Quantitative Sensory Testing in early small fiber polyneuropathy
A clinical study in Swedish hereditary transthyretin amyloidosis patients
Victoria Heldestad
Deptartment of Pharmacology and Clinical Neuroscience, Division of Clinical Neurophysiology, and Department of Public Health and Clinical Medicine, Division of Medicine, Umeå University, Umeå, Sweden, 2011

Responsible publisher under swedish law: the Dean of the Medical Faculty This work is protected by the Swedish Copyright Legislation (Act 1960:729) Copy right © Victoria Heldestad ISBN: 978-91-7459-320-4 ISSN: 0346-6612 Cover images Front: Peltier-element used in the present thesis (MSA, Thermotest®). Illustration provided by Mr. Bo Johansson., Somedic AB, Hörby, Sweden. Back: A private photo, taken at a very special occation (2010-08-13), at “Nydala lake, in Umeå”. © Victoria Heldestad and Anders Lilliesköld. Electronic version available at http://umu.diva-portal.org/ Printed by: Print & Media, Umeå University Umeå, Sweden 2011

Dedicated to my be loved daughter Linn: For giving me love and happiness every single day

i
Table of Contents
Abstract iii Abbreviations v Manuscripts vii Populärvetenskaplig sammanfattning viii 1. Introduction 1
1.1 The autonomic nervous system 1 1.2 The somatic nervous system 2
1.2.1 Cutaneous receptors 2 1.2.2 Thermal sensation 3 1.2.3 Peripheral nerves 6
1.3 Polyneuropathy 7 1.4 Clinical evaluation of peripheral nerves 7 1.5 Quantitative sensory testing 8
1.5.1 Reaction time inclusive QST methods 11 1.5.2 Reaction time exclusive QST methods 12
1.6 Transthyretin amyloidosis 14 2. Aims 19 3. Materials and methods 20
3.1 Overview 20 3.2 Material 21 3.3 Quantitative sensory testing (papers I-V) 23
3.3.1 Equipment 23 3.3.2 Testing algorithms 23 3.3.3 Tested sites 24
3.4 Nerve conduction studies and electromyography (papers III-IV) 26 3.5 Heart rate variability (paper IV) 27 3.6 Data conditioning 27 3.7 Analyses and statistical testing 28
4. Results and discussion 29 4.1 General methodological considerations 29
4.1.1 Subjects 29 4.1.2 Methods 30 4.1.3 Aspects of gender and side differences in QST testing 32
4.2 Reproducibility of thermal thresholds (Paper I) 32 4.2.1 Test sequence order 33 4.2.2 Repeated testing 34
4.3 Reference data (paper II) 39 4.3.1 Thermal perception thresholds 40
4.4 Early detection of thin fiber impairments in val30met ATTR patients (Paper III) 44

ii
4.5 Combined HRV and QST evaluation in early and late onset ATTR (Paper IV) 47
4.5.1 Heart rate variability 48 4.5.2 Early onset ATTR patients 49 4.5.3 Late onset ATTR patients 49
5. Future perspectives 52 6. Concluding remarks 54 Acknowledgements 55 References 57

iii
Abstract
Generalised polyneuropathy (PNP) is a common cause to neurological impairment, and may be an early symptom of a severe systemic disease. One such illness is hereditary transthyretin (TTR) amyloidosis (ATTR), a progressive fatal disorder caused by a mutation on the TTR gene. More than 100 such mutations have been found worldwide, of which Val30Met is the most common neuropathic variant with initial clinical manifestations indicating small fiber impairment. Differences in onset age, penetrance and phenotypes are present between endemic areas. Liver transplantation generally slows the progress of the symptom development, especially in patients with short disease duration. Ongoing research has also shown promising results with drug interventions. In any event, early diagnosis of PNP onset in ATTR patients is crucial to ensure early therapeutic interventions. Nerve conduction studies (NCS) and electromyography (EMG) provide the basis for evaluation of the functional state of the thick myelinated nerve fibres in patients with symptoms of PNP, but no such quantitative methods are available for the thin myelinated or unmyelinated fibers. Instead, a psychophysical method with thermal quantitative sensory testing (QST) can provide indirect information about the overall function in the afferent small fiber systems. The purpose of thesis was to evaluate the applicability of QST by the Method-of-limits (MLI) for early detection of PNP in Swedish ATTR patients with the Val30Met mutation.
In heal thy subjec t s the repeatability of the MLI was assessed, and reference values for thermal perception thresholds (TPT) in several body regions were determined. No significant differences in TPT or pain thresholds were found at repeated testing with MLI, indicating that the MLI is a reliable method. However, the results show that the arrangement of the testing order is of importance, as cold (CT) and warm (WT) perception thresholds were significantly elevated when tested after thermal pain assessments, instead of before. I general, the TPT was more elevated at lower parts of the body compared to the upper part, and with higher WT than CT, fully in accordance with the underlying anatomical and physiological prerequisites for QST. In biopsy verified ATTR patients lacking EMG and NCS abnormalities, significantly elevated TPT were found compared to controls. Furthermore, significantly more increased TPT were observed in patients with an early onset of the disease, compared those with a late onset.
iv
Finally, a combined detailed evaluation of QST and heart rate variability (HRV) analyses demonstrated correlations between QST and HRV abnormalities in patients with late onset, but not in those with early onset.
The present thesis emphasizes the importance of incorporating QST early in the clinical evaluation of ATTR patients with a Val30Met mutation and with symptoms of thin fiber PNP. This is particularly indicated when patients report symptoms, or show signs, of neuropathic small fiber affection, but simultaneously exhibit normal EMG and NCS findings. The results furthermore underline the importance of performing both QST and HRV for a complete evaluation of both the thin somatic and autonomic nerve fibers, as both types of nerves may be affected early in the ATTR disease.

v
Abbreviations
ANS Autonomic nervous system aTPA After thermal pain assessment ATTR Transthyretin amyloidosis CNS Central nervous system CoV Coefficient of variation CPT Cold pain thresholds CR Coefficient of repeatability CT Cold perception threshold CV Conduction velocity DA ‘Deltoid anterior part’ of the proximal part of the upper arm DF Dorsum aspect of the foot ECG Electrocardiogram EMG Electromyography FAP ‘Familial Amyloidosis with Polyneuropathy’ FT First testing GBS Guillain-Barré Syndrome GSR Galvanic skin response HPT Heat pain thresholds HRV Heart rate variability ICC Intra-class correlation JND ‘Just noticeable difference’ LL Lateral aspect of the lower part of the leg ML Medial aspect of the lower part of the leg MLE Method-of-levels MLI Method-of-limit NCS Nerve conduction studies NCV Nerve conduction velocity PHF Power of high frequency PHF(sup) Power of high frequency in supine position PLF Power of low frequency PLF(sup) Power of low frequency in supine position PNP Polyneuropathy PNS Peripheral nervous system QST Quantitative sensory testing RA ‘Radial part’ of the lower part of the arm RTE Reaction time exclusive RTI Reaction time inclusive SNA Sural nerve action potential SNS Somatic nervous system

vi
TE Thenar eminence TPT Thermal perception thresholds TTR Transthyretin UA ‘Ulnar part’ of the distal part of the fore arm VT Ventral thigh WT Warm perception thresholds
vii
Manuscripts
This thesis is based on the following publications and manuscript, referred to in the text by their Roman numerals:
I. Heldestad V, Linder J, Sellersjö L, Nordh E. Reproducibility and influence of test modality order in thermal perception and thermal pain thresholds in quantitative sensory testing with the method of limits. Clinical Neurophysiology 2010;Nov121(11):1878-1885.
II. Heldestad V, Nordh E. Thermal perception thresholds: reference data and response characteristics. In manuscript.
III. Heldestad V, Nordh E. Quantified sensory abnormalities in early genetically verified transthyretin amyloid polyneuropathy. Muscle Nerve 2007 Feb;35(2):189-195.
IV. Heldestad V, Wiklund U, Hörnsten R, Obayashi K, Suhr OB, Nordh E. Comparison of quantitative sensory testing and heart rate variability in Swedish Val30Met ATTR. Amyloid 2011 Dec;18(4):183-190.
All articles have been re-printed with permission from their publishers.
viii
Populärvetenskaplig sammanfattning
Sjukdomstillstånd med en allmän nervpåverkan (generaliserad polyneuropati) yttrar sig som bortfall av känsel och muskelfunktion, i tidiga skeden av förloppet mest markerat i ben och armar. Polyneuropati kan vara ett tidigt symptom på allvarlig generaliserad sjukdom som även drabbar vävnader utanför nervsystemet. En sådan är transtyretin-amyloidos (ATTR), vilken är en ärftlig, progressiv och dödlig sjukdom orsakad av en mutation i transtyretingenen på kromosom 18. Transtyretin är ett protein som bildas primärt i levern och har som huvuduppgift i att transportera A-vitamin och sköldkörtelhormon i kroppen. Idag är fler än 100 olika mutationer i denna gen kända, men Val30Met mutationen är den vanligaste varianten som orsakar polyneuropati.
Kliniskt manifest ATTR startar ofta med smärta i fötterna, nedsatt känsel för kyla och värme, besvärliga omväxlande diarréer och förstoppningar, samt erektionsproblem. Dessa symptom är alla indirekta tecken på förändringar i de tunna nervtrådarna inom de somatiska och autonoma delarna av perifera nervsystemet. ATTR med Val30Met mutationen finns spridd över hela världen, men är mest förekommande inom tre endemiska områden i Portugal, Japan och Sverige men med skillnader i symtom och genomslagskraft. Även medeldebutåldern skiljer sig åt mellan de tre områdena; i Sverige är den omkring 55 år men i Portugal omkring 35 år.
En levertransplantation kan bidra till en långsammare sjukdomsutveckling hos flertalet patienter med Val30Met mutation och kort sjukdomsduration. Pågående forskning har också visat lovande resultat med en uppbromsning av sjukdomsutvecklingen med farmakologisk behandling. En tidig diagnos av debuterande polyneuropati hos patienter med ATTR är därför viktig för en optimal symptomatisk behandling, och för att patienten så länge som möjligt ska kunna bibehålla en så hög funktionsgrad som möjligt i sin allmänna organfunktion.
Elektrofysiologisk utredning med neurografi och elektromyografi (EMG) utgör grunden för klinisk utvärdering av patienter med symptom på polyneuropati. Dessa två metoder analyserar tjocka myeliniserade nervtrådar, men en sådan motsvarande kvantitativ metod saknas för bedömning av tunna myeliniserade eller omyeliniserade nervtrådar.

ix
Kvantitativ sensorisk testning (QST) av temperatursinnet är en psykofysisk metod som dock indirekt kan ge detaljerad information om funktionen inom afferenta tunntrådssystem. Syftet med denna avhandling var att utvärdera användbarheten av ”method-of-limits” (MLI) vid QST för tidig detektion av polyneuropati hos svenska ATTR patienter med en Val30Met mutation.
Hos f r i ska personer undersöktes reproducerbarheten av MLI vid upprepad testning. Eftersom i huvudsak inga skillnader i temperatur-perceptionströsklar (TPT) eller temperatursmärttrösklar sågs vid upprepade testtillfällen med korta eller långa tidsintervall drogs slutsatsen att MLI är en tillförlitlig metod. Emellertid noterades förhöjda köld- (CT) och värme- (WT) perceptionströsklar när testning gjordes efter bestämningen av temperatursmärttrösklarna, vilket belyser betydelsen av den använda testordningen för undersökningens kvalitet. Vidare bestämdes referensvärden för TPT vid olika kroppsdelar. Generellt var TPT högre på benen jämfört med armarna och WT var högre än CT vid varje testpunkt.
Hos ATTR patienter undersöktes betydelsen av QST vid utredning av personer med genetiskt verifierad Val30Met mutation men avsaknad av patologiska förändringar vid neurografi- och EMG- undersökningar. Hos ATTR patienterna sågs generellt förhöjda TPT jämfört med friska personer. Vidare visade en kombinerad utvärdering av QST och hjärtfrekvensvariabilitet på skillnader mellan tidig och sen debutålder av sjukdomen. Hos patienter med en tidig debutålder sågs betydligt förhöjda TPT jämfört med patienter som hade en sen debutålder. Detta kan tyda på en mer selektiv påverkan de tunna sensoriska nervtrådarna hos yngre ATTR patienter, eller på att själva symtomprogressen är snabbare. Hos patienter med sen debutålder hittades samband mellan försämrad hjärtfrekvensvariabilitet och förhöjda temperaturtrösklar vid QST, vilket inte sågs hos de med tidig debutålder.
Resultaten i avhandlingen visar att MLI är en tillförlitlig metod för klinisk utvärdering av tunntrådsfuktionen vid misstanke på debuterande generell neuropati eller vid mer selektiv tunntrådsneuropati.
Resultaten i avhandlingen betonar också vikten av att utföra QST tidigt i förloppet under utredningen av ATTR patienter med en Val30Met mutation som uppvisar symptom på tunntrådsneuropati, i synnerhet hos dem med normalfynd vid EMG- och neurografiundersökningar.

x
Eftersom såväl både somatiska som autonoma tunna nervtrådar kan påverkas tidigt och även oberoende av varandra vid ATTR, bör dock i denna patientgrupp alltid neurografi- och EMG-undersökning utföras i kombination med både QST och HRV. I synnerhet som sjukdomen kan vara övervägande lokaliserad utom nervsystemet och endast visa en diskret neurologisk påverkan.

xi
Only a f ew people l ive today, most o f them prepare for tomorrow
“Unknown”

1
1. Introduction
In a basic approach the nervous system may be classified according to anatomical organisation, and divided into the peripheral (PNS) and the central nervous system (CNS), and/or according to physiologic function, including the somatic - (SNS) and the autonomic nervous system (ANS).
The nervous system encompass a multitude of morphological structures, acting alone or in combinations to detect extra corporal events critical for forming the individual’s conscious or sub-conscious goals, or of importance to initiate and perform body interaction with the surrounding world. The nervous system also senses intracorporal processes or conditions of importance for life-supporting processes, and thus controls critical actions for maintaining the homeostasis. Consequently, the nervous system is truly multi-dimensional, and an introduction to the structure, organisation and proposed functioning of the systems relevant for small fiber disease and dysfunction, by necessity has to be highly selective (Kandel et al., 2000).
This also holds true for the immensity of knowledge concerning generalised neuropathies - a vast group of diseases affecting specific or all types of nerve fibers in many different forms. In the present context it is thus only possible to review some of the aspects related to the specific ‘Hereditary transthyretin amyloidosis’ (ATTR), a progressive fatal disorder sometimes also denoted ‘Familial Amyloidosis with Polyneuropathy’ (FAP).
1.1 The autonomic nervous system
The ANS automatically regulates the function of our internal organs (e.g. heart rate, gastrointestinal organs, smooth muscles and secretory glands), by means of the sympathetic and the parasympathetic systems, which operate in an antagonistic way (Schmidt, 1978; Schmidt and Thews, 1983; Kandel et al., 2000).
The cell bodies of preganglionic neurons lie within the CNS, and the postsynaptic neurons have their cell bodies within ganglion in the PNS, reaching the effector organs (Schmidt and Thews, 1983; Kandel et al., 2000). The cell bodies of the shorter preganglionic sympathetic neurons lie in the lateral horn within the thoracic and lumbar segments of the

2
spinal cord. Postsynaptic sympathetic neurons are longer and consist of thin unmyelinated fibers. Cell bodies from the longer myelinated and unmyelinated preganglionic parasympathetic neurons are located in the brainstem and the sacral spinal cord (Schmidt and Thews, 1983).
1.2 The somatic nervous system
Within the SNS, the efferent motor neurons convey the voluntary motor command signals, which control body movements via the skeletal muscles. From the motor cortex, the upper motor neurons descend through the cortico-spinal tract to make synaptic connections within the spinal ventral horns to the lower motor neurons, which innervate the peripheral muscles. The afferent sensory neurons covey sensory information within different modalities; passing through different ascending pathways from receptors in the periphery to different locations within the CNS. Afferents signalling information about touch, vibration and proprioception enter the medulla through the dorsal horn, and ascend ipsilaterally in the dorsal columns, while afferents conveying information about temperature and pain cross the midline to the contralateral side, to ascend through the spino-thalamic tracts. All the peripheral afferent somatic fibers have their cell bodies within the dorsal root ganglions, with a topographical organisation where different segments/roots are peripherally represented by the different dermatomes in the skin (Schmidt and Thews, 1983; Kandel et al., 2000).
1.2.1 Cutaneous receptors
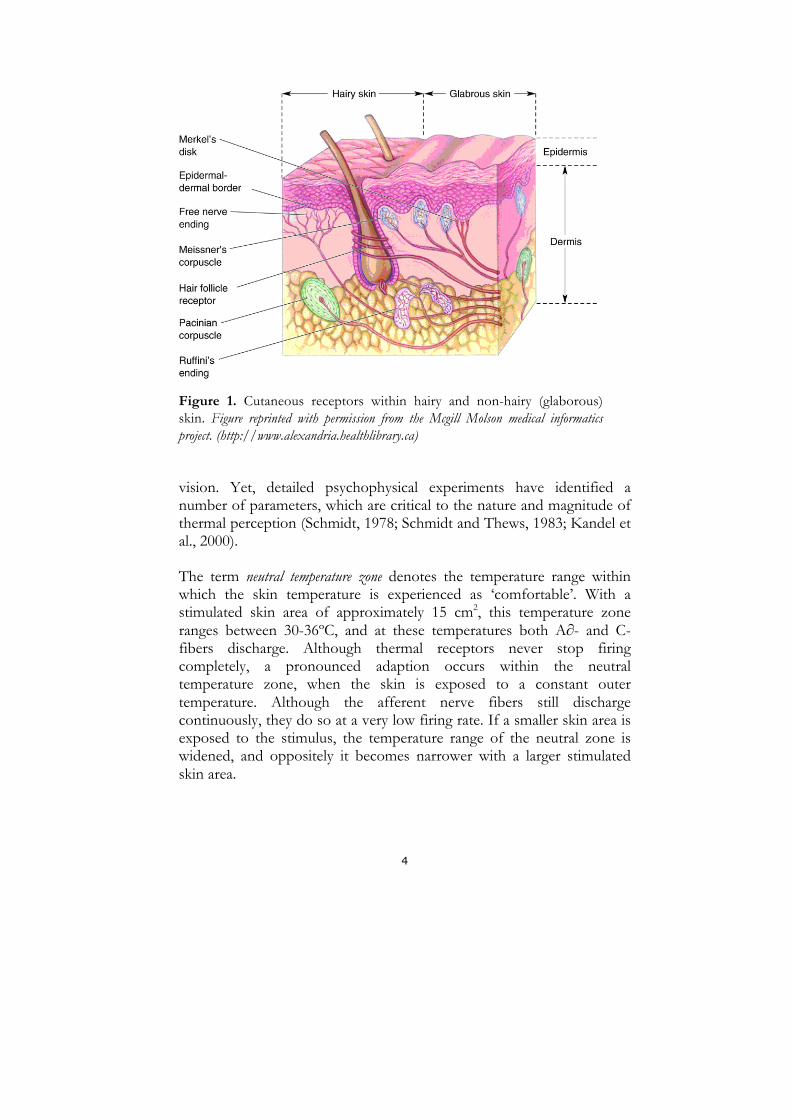
Both the glaborous (hairless) and the hairy skin contain encapsulated as well as unencapsulated (free nerve endings) receptors (Figure 1). The mechanoreceptors have encapsulated nerve endings and respond to modalities such as touch, vibration, pressure and tickle. Merkel’s discs (pressure and texture), Meissner’s- (light touch) and Pacinian corpuscles (vibration) are mainly found in glaborous skin. While tactile discs (light touch), hair-follicle receptors (position changes of hair), and Ruffini endings (deep tension) are abundant in hairy skin (Schmidt, 1978; Carpenter, 1990; Kandel et al., 2000). The Meissner’s corpuscle and Merkel’s discs have the small receptive fields, ranging approximately between 2-3 mm2 on the fingertip, compared to less sensitive areas like the forearm and back where the receptive field is around 40 mm2. All receptors show different

3
adaption characteristics, i.e. the degree of decrease in afferent neuronal firing during constant stimulation. Receptors that respond to a constant stimulus intensity with slow decline in firing rate are slowly adapting, while receptors responding with a rapid decline are fast adapting. Meissner’s- and Pacinian corpuscle’s are fast adapting, while Ruffini endings and Merkel’s discs adapts slowly (Kandel et al., 2000).
The free nerve endings responding to temperature and thermal pain are abundant in hairy skin (Schmidt, 1978; Carpenter, 1990; Kandel et al., 2000). These cold- and warm sensitive free nerve endings (“receptors”) have generally smaller receptive fields compared to the mechanoreceptors (≤ 1 mm2). Cold sensitive receptors are more frequent than the warm sensitive, and more superficially located in the dermis. In addition, the nociceptors are more abundant compared to both types of thermal receptors (Schmidt, 1978, Schmidt and Thews, 1983). The sensors are connected to the CNS via nerve fibers, running in nerves, which enter the spine via the spinal dorsal roots. The sensory neurons may thus be classified not only by their peripheral nerve branch, but also according to the root by which they enter to the cord (Schmidt and Thews, 1983; Kandel et al., 2000). The latter subdivision is denoted “dermatomes”, and the thermal dermatomes have in this respect been reported to be less overlapping than the somatic dermatomes (Carpenter, 1990).
The mechanoreceptors are all innervated by myelinated (A-∂) nerve fibers with conduction velocities (CV) between 36-72 m/sec, while cold and warm sensitive receptors as well as nociceptors are innervated by thin myelinated (A-∂) and unmyelinated (C) nerve fibers with much lower CV, ranging between 0.4-36 m/sec. The A-∂-fibers conduct impulses from cold receptors, and mechano- and thermal nociceptors. C-fibers conduct signals from warm receptors and polymodal nociceptors, and can be activated in several modalities, such as thermal, mechanical and chemical stimuli (Kandel et al., 2000).
1.2.2 Thermal sensat ion
Perception of thermal stimuli is maintained by non-specific somatosensory systems, which operate without the precise internal organisation characterising the specific sensory systems like touch or
4
Figure 1. Cutaneous receptors within hairy and non-hairy (glaborous) skin. Figure reprinted with permission from the Mcgill Molson medical informatics project. (http://www.alexandria.healthlibrary.ca)
vision. Yet, detailed psychophysical experiments have identified a number of parameters, which are critical to the nature and magnitude of thermal perception (Schmidt, 1978; Schmidt and Thews, 1983; Kandel et al., 2000).
The term neutral temperature zone denotes the temperature range within which the skin temperature is experienced as ‘comfortable’. With a stimulated skin area of approximately 15 cm2, this temperature zone ranges between 30-36ºC, and at these temperatures both A∂- and C-fibers discharge. Although thermal receptors never stop firing completely, a pronounced adaption occurs within the neutral temperature zone, when the skin is exposed to a constant outer temperature. Although the afferent nerve fibers still discharge continuously, they do so at a very low firing rate. If a smaller skin area is exposed to the stimulus, the temperature range of the neutral zone is widened, and oppositely it becomes narrower with a larger stimulated skin area.

5
Due to this the start skin temperature, also known as the adapted skin temperature, is of importance when comparing results from different experimental arrangements (Schmidt, 1978).
The thermal receptors discharge rate is a complex function of the skin temperature. Both types are sensitive to temperatures within a rather wide temperature range. The cold receptors are sensitive to temperatures between 5-40ºC, with a peak around 30º, followed by slowly declining temperature sensitivity at increasing temperatures. The warm receptors are sensitive between 29-45ºC, with a peak around 40ºC, followed by a steeper declining slope to 45ºC (Kandel et al., 2000). During dynamic temperature changes, a cooling will lead to an increased discharge in A∂-fibers, and correspondingly an increased discharge in warm-sensitive C-fibers occurs during sudden skin warming (Carpenter, 1990).
Due to this, three parameters in the experimental design of thermal psychophysical testing are of particular importance for description and interpretation of the thermal detection capacity.
First, the start skin temperature affects the perceived temperature sensation. If the skin is ‘cold’ at the start, a lower difference in temperature decrease is required before a ‘colder’ sensation is perceived. In contrast, a considerably much higher increase of the temperature is needed for perception of ‘warm’ sensation. The opposite situation applies when the skin is initially ‘warm’ from start. Second, also the rate of temperature change will affect the perceived temperature. During a very slow rate of change in thermal stimulus level (<0.1ºC/sec), the thermal receptors will partially ‘adapt’ during ongoing stimulation, thereby requiring a higher temperature alteration before a ‘cold’ or ‘warm’ sensation is perceived (Kandel et al., 2000). This seems to be most crucial for C-fibers (Harding and Loescher, 2005). Third spatial summation will affect the perceived temperature, as the size of the stimulated skin area, and hence the number of underlying receptors is crucial. A larger stimulated skin area will lower the temperature required to be detected by the CNS, most likely due spatial summation of afferent activity from several afferent fibers within the central nuclei (Kandel et al., 2000).
Other patterns of thermal sensations may occur during special conditions, such as perception of after sensations, which is the phenomena that the receptors, after that the skin has been exposed to a temperature stimulus, sometimes may continue to discharge even after re-warming or
6
re-cooling. A paradoxical cold sensation sometimes happens during rapid warming at higher temperatures (>45ºC), as silent cold receptors suddenly discharges (Schmidt, 1978).
A sensation of thermal heat pain mostly requires higher temperatures (>45ºC), and cold pain is mostly felt when our skin is affected by temperature lower than 5ºC (Kandel et al., 2000). Further these thermal pain sensitive nociceptors mostly do not adapt at all (Schmidt, 1978, Schmidt and Thews, 1983).
1.2.3 Per ipheral nerves
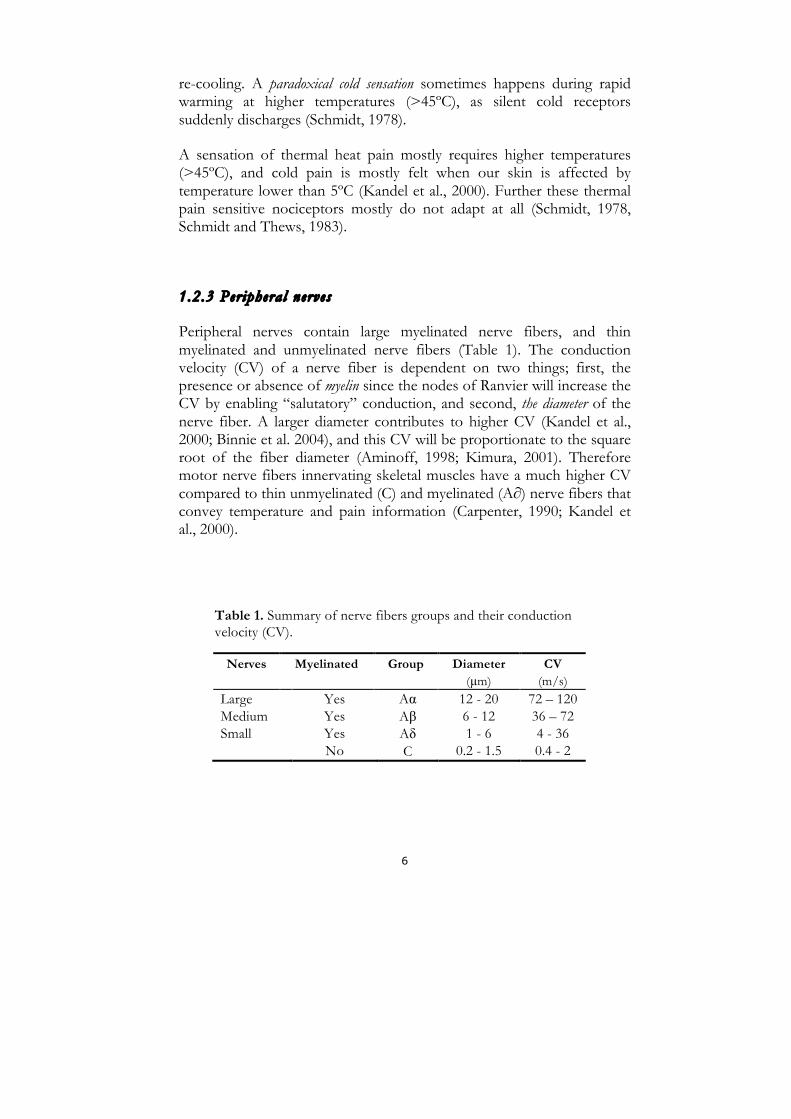
Peripheral nerves contain large myelinated nerve fibers, and thin myelinated and unmyelinated nerve fibers (Table 1). The conduction velocity (CV) of a nerve fiber is dependent on two things; first, the presence or absence of myelin since the nodes of Ranvier will increase the CV by enabling “salutatory” conduction, and second, the diameter of the nerve fiber. A larger diameter contributes to higher CV (Kandel et al., 2000; Binnie et al. 2004), and this CV will be proportionate to the square root of the fiber diameter (Aminoff, 1998; Kimura, 2001). Therefore motor nerve fibers innervating skeletal muscles have a much higher CV compared to thin unmyelinated (C) and myelinated (A∂) nerve fibers that convey temperature and pain information (Carpenter, 1990; Kandel et al., 2000).
Table 1. Summary of nerve fibers groups and their conduction velocity (CV).
Nerves Myelinated Group Diameter (µm)
CV (m/s)
Large Medium Small
Yes Yes Yes No
Aα Aβ Aδ C
12 - 20 6 - 12 1 - 6
0.2 - 1.5
72 – 120 36 – 72 4 - 36 0.4 - 2

7
1.3 Polyneuropathy The tissue changes in polyneuropathy (PNP) are likely to have numerous causes, of which only some mechanisms are clarified. The structural detoriation affect motor, sensory and/or autonomic nerves, and the consequences will be initially positive signs due to excitation of peripheral nervous tissues, like tingling or burning sensations, ‘muscle unrest’ or increased appearance of muscular cramps. Later in the course of the nerve fiber detoriation negative signs may be prominent, like “glove-and-stocking” loss of touch or sensation in the limbs, muscular wasting or loss of autonomic functions. The progress of a PNP can be acute and rapid as in Guillain-Barré syndrome (Kimura, 2001; Hughes, 2002), but mostly PNP is of ‘chronic’ character and show a slow progression. PNP acquired from diabetes is the most common (Hughes, 2002), but PNP caused by toxic (alcohol) and vitamin B12 deficiency reasons may also develop PNP. There are also hereditary conditions where PNP may be a partial symptom of the disease such as Charcot-Marie-Tooth disease and Transthyretin amyloidosis. Nerve conduction studies provide information of demyelinisation or axonal involvement of the peripheral nerves. A slow CV and temporal dispersion indicate a demyelinising process, as for example acquired PNP in the Charcot-Marie-Tooth or Guillain-Barré syndromes. In contrast PNP caused by ATTR or toxicity presents axonal involvement, with decreasing amplitude showing axonal degeneration (Liveson and Spielholz, 1980; Kimura, 2001; Hughes, 2002).
1.4 Clinical evaluation of peripheral nerves Clinical evaluations of peripheral nerves include several techniques. Nerve conduction studies (NCS) and needle electromyography (EMG) form the basis for the electrophysiological evaluation of large myelinated nerve fibers. During NCS the peripheral nerves are electrically stimulated and relevant parameters of nerve or muscle responses are measured. Recorded quantitative data provide information about the physiological state of the nerve, as axonal loss will reduce the motor and sensory amplitudes, and a demyelinisation will decrease the motor and sensory nerve conduction velocities. Needle-EMG

8
reveals the electric characteristics of the motor units in the skeletal muscle, which enables evaluation of the functional properties of the muscle tissues, but also deduction of the functional state of the efferent motor nerve fibers (Halliday et al., 1987; Aminoff, 1998; Kimura, 2001; Binnie et al., 2004). Also methods for evaluation of thin nerve fibers are available, for both the ANS and the SNS. Microneurographic nerve recordings primarily evaluate afferent- and efferent impulse traffic in individual large myelinated nerve fibers, but also intra-neurally recorded mass activity from nerves, including autonomic small fibers (Vallbo et al., 1979; Gandrevia and Hales, 1997; Vallbo et al., 2004; Mano et al., 2006). Heart rate variability (HRV) quantifies defects within the sympathic/parasympathic ANS during spontaneous and controlled breathing. The method is based on the observation that the heart rate normally increases during inspiration and decreases during expiration, due to the effect of the inhibitory vagal effect (Kimura, 2001; Rajendra et al., 2006). The galvanic (GSR) or sympathetic skin response is also a method quantifying defects within the ANS (Elie and Guiheneuc, 1990; Gutrecht, 1994). However, due to a decreased autonomic function with increasing age (Kimura, 2001) elderly healthy subjects demonstrate a decreased heart rate variation during breathing (Zhang, 2007), and may not show any detectable response in GSR at all (Drory and Korczcyn, 1993). Afferent sensory nerves may be semi quantitative assessed by quantitative sensory testing (QST), with an initiating of the peripheral impulse by different modalities, such as vibration, thermal or thermal painful stimulation, and different testing algorithms (Fruhstorfer et al., 1976; Dyck et al., 1978; Bertelsmann et al., 1985; Jamal et al., 1985; Claus et al., 1987; Claus et al., 1990; Dyck et al., 1993a; Dyck et al., 1993b; Gruener and Dyck, 1994; Yarnitsky and Sprecher, 1994; Gelber et al., 1995; Hilz et al., 1995a; Yarnitsky et al., 1995; Yarnitsky, 1997; Bartlett et al., 1998; Fillingim et al., 1999; Meier et al., 2001; Siao and Cros, 2003; Chong and Cros, 2004; Lowenstein et al., 2008; Wasner and Brock, 2008).
1.5 Quantitative sensory testing
Thermal QST is a non-invasive psychophysical method for assessment of thermal perception thresholds (Fruhstorfer et al., 1976; Dyck et al., 1978; Claus et al., 1987; Bravenboer et al., 1992; Dyck et al., 1993b; Yarnitsky and Sprecher, 1994; Yarnitsky, 1997; Reulen et al., 2003; Chong and Cros, 2004).

9
In 1976, Fruhstorfer and colleagues introduced a quantitative method for thermal sensory testing, named the ‘Marstock method’, after the names Marburg and Stockholm, the cities where it was first developed (Fruhstorfer et al., 1976). A few years later another automated method for quantitative sensory testing (QST) was introduced from a group in USA (Dyck et al., 1978), and other approaches have later been introduced (Jamal et al., 1985; Claus et al., 1990; Dyck et al., 1993b).
QST have been clinically applied during the past years (Zaslansky and Yarnitsky, 1998), particularly in patients with diabetes (Hilz et al., 1988; Hendriksen et al., 1993; Gelber et al, 1995; Abad et al., 2002; Krämer et al., 2004; Zinman et al., 2004; Ørstavik et al., 2006; Løseth et al., 2008).
The thermal stimulus is delivered by a probe equipped with an of array semiconductor elements (‘Peltier elements’; c.f. Figure 2). These components have the thermoelectric property of changing their surface temperature, depending on the direction of the driving electric current.
The most important component of the probe is the actual surface put in contact with the skin, which in the probe used in the present work (c.f Methods) was constituted by three semiconductor elements for stimulation and double sensors for detection of the surface temperature. This probe is covered by a thin sterling silver foil, to ensure a rapid distribution of temperature, also between the active thermal stimulation areas above the Peltier elements. Mainly two methodological approaches for QST are available, essentially divided into reaction time inclusive (RTI) and reaction time exclusive (RTE) methods (Yarnitsky, 1997; Chong and Cros, 2004).
Different technical and experimental details may affect the magnitude of the thresholds. The probe size is important due to spatial summation (Schmidt, 1978; Kandel et al., 2000), since a small probe size gives high thermal thresholds, and vice versa (Dyck et al., 1993b; Hilz et al., 1998b, Hilz et al., 1999). The baseline temperature of the probe has to be within the neural zone (Schmidt, 1978); as elevated cold thresholds and lowered warm thresholds will be caused by using a warmer baseline temperature, and vice versa with a colder baseline (Schmidt, 1978; Hilz et al., 1995a), but warming of the tested skin area is not necessary, unless the skin temperature is lower than 26ºC (Hilz et al., 1995a) or 27ºC (Hagander et al., 2000

10
Figure 2. The temperature stimulation probe in the equipment used in the present work (Thermotest®). The thermoelectric Peltier-element (white area on top; area 12.5 cm2) is embedded in a rubber covered metal housing, together with fluid tubes and temperature sensors in a feed-back controlled water medium cooling/heating system. Illustration provided by Mr. Bo Johansson, Somedic AB, Hörby, Sweden. (http://www.somedic.com).
The rate of temperature change is preferably set to 1°C/sec (Pertovaara and Kojo, 1985; Yarnitsky and Ochoa, 1991; Hilz et al., 1999; Palmer, 2000) as thresholds increase due to both slow and high rates of temperature change. Warm perception thresholds seem to be more influenced by the rate of change during temperature increases, than cold thresholds during temperature decreases (Palmer et al., 2000; Harding and Loescher, 2005), probably due to the lower CV in C-fibers compared to A∂-fibers.
Within thermal QST individual factors such as age, height and gender may contribute to differences in the threshold magnitudes (Bertelsmann et al., 1985; Jamal et al., 1985; Claus et al., 1987; Bravenboer et al., 1992; De Neeling et al., 1994; Yarnitsky 1997; Bartlett et al., 1998; Becser et al., 1998; Fillingim et al., 1999; Hilz et al., 1999; Lin et al., 2005; Rolke et al., 2006; Blankenburg et al., 2010; Huang et al., 2010). The anatomical location selected for testing is also crucial (Jamal et al., 1985; Claus et al., 1987; Redmond et al., 1990; Bravenboer et al., 1992; Verdugo and Ochoa, 1992; Dyck et al., 1993b; Hilz et al., 1993b; Yarnitsky and Sprecher, 1994; Yarntisky, 1997; Hilz et al., 1999; Meier et al., 2001; Lin et al., 2005; Defrin et al., 2006; Rolke et al., 2006; Blankenburg et al., 2010; Magerl et al., 2010) due to possible differences in receptor density between various body regions (Kandel et al., 2000; Chang et al., 2004).

11
Apart from different physiological and technical prerequisites, the QST can also be performed with varying rationales, which in turn may be based on different psychophysical strategies. Nevertheless, the different QST methods can be categorised into a few common groups, as expanded below.
1.5.1 React ion t ime inc lus ive QST methods
In these types of QST, the presented stimulus changes monotonously from a preset starting level, and the subject is requested to press an electric switch as soon as the accepted stimulus is perceived. This stops the change in stimulus intensity, and the probe surface temperature will start changing in the opposite direction relative to the tested modality (e.g. from heat to cold). The time required by the subject for detection, is dependent on the time from the start to the non-verbal response of closing the switch, as recorded by the electronic circuitry. Apart from technical details, this estimate also depends on several biological and psychological factors, such as afferent conduction time, concentration, mental health, and external disturbing factors (Yarnitsky, 1997; Chong and Cros, 2004).
Marstock method: The stimulus alternates between cold and warm, with continuous alternating changes in stimulus mode and intensity, while the subject controls the stimulation mode and reports ‘detection’ or ‘no detection’ by also repeatedly pressing or releasing a switch. The method thus allows the intensities prevailing at each ‘turning point’ of the stimulus intensity curve to define the average “thermal sensory limen” or the “difference limen” (Fruhstorfer et al., 1976). The method thus gives an estimate of the combined warm and cold thresholds, but cannot differentiate between the separate contributions given from each the two modalities.
Method of limits (MLI): The thermal stimulus increases or decreases constantly, with separate warm and cold stimulations (Yarnitsky, 1997; Chong and Cros, 2004). The stimulation starts from a user defined baseline temperature, usually 32ºC. Stimuli are given with a constant increment/decrement of the stimulus strength at a user defined speed,

12
usually 1ºC /sec. Detection of the thermal perception thresholds (TPT) is reported non-verbally by the subject by pressing a switch, which also causes a stop in temperature change. Each tested site is stimulated repeated times with consecutive cold and warm stimuli, and the TPT is defined as the average of the TPT of the two series of warm and cold sub-tests, after excluding possible ‘outliers’ in each series.
The MLI is often recommended for clinical use, as it is quick and easy to use (Claus et al., 1987; Levy et al., 1989; Claus et al., 1990; Verdugo and Ochoa, 1992; Hilz et al., 1999), although some prefer the Marstock method due to reported better reliability (Redmond et al., 1990). At present, mainly two systems for MLI are commercially available; the ‘Thermosensor analyzer’ (TSA-II®, Medoc, Israel), with a standard probe size of 9 cm2 (http://www.medoc-web.com), and the ‘Modular sensory analyzer’ (MSA Thermotest®, Somedic, Hörby, Sweden), with a standard probe size of 12.5 cm2 (http://www.somedic.com). As a consequence of differences in probe size (Dyck et al., 1993b; Hilz et al., 1998b; Hilz et al., 1999), it cannot be taken for granted that results from the two systems are equivalent, although this is sometimes tacitly suggested (Rolke et al., 2006)
1.5.2 React ion t ime exc lus ive QST methods
The RTE methods differ in design, but have one thing in common; only a single stimulus with a constant defined intensity is given at the time (Yarnitsky, 1997; Chong and Cros, 2004).
Method of levels: The stimulus intensity of an individual stimulus is predetermined but is increased or decreased by half of the strength of the preceding stimulus, depending on if the subject perceived that stimulus or not (Yarnitsky and Ochoa, 1991; Yarnitsky and Sprecher, 1994; Yarnitsky, 1997). The stimuli given are preferably of a ‘ramp-and-hold’ model, which keeps the target temperature for a few seconds after completing the change, thereby facilitating the actual thermal perception process (Reulen et al., 2003).
Staircases: Starting at a predefined level three predefined steps (large/medium/small) of change in stimulus amplitude are used. Initially, large steps are used until the first turn point when the subject reports stimulus perception by choosing and pressing a ‘detection switch’. Then

13
medium steps are used in the first reversed stimulus intensity, until the next ‘turn point’ (i.e. detection) is reached, at which ‘no detection’ is reported. After again reversing the stimulus intensity small steps are used. During the use of small steps, four consecutive “no” responses are needed to stop the testing procedure. The threshold value is the point ‘midway between’ on one side the mean of all “yes” responses reported after the first “no”, and on the other the mean of all “no” responses (Yarnitsky and Sprecher, 1994; Yarnitsky, 1997; Chong and Cros, 2004).
4.2.1. Stepping algorithm: This widespread method is based on the “just noticeable difference” (JND), predetermined between JND 1 (the smallest step) and JND 25, (the largest step). The stimuli are given with either a triangular shape (below JND 21.5, or a trap-shaped “ramp-and-hold”-model (above JND 22). The hold phase of the latter varies in different pre-defined lengths (1.5, 5 and 10 sec) depending on JND level, but all changes in temperature occur at 4ºC/sec.
All testing arbitrarily starts at level JND 13 (Dyck et al., 1993a; Dyck et al., 1993b; Gruener and Dyck, 1994; Yarnitsky, 1997; Chong and Cros, 2004). For cold and warm detection, JND 13 is defined to a ± 2.002ºC difference from the starting temperature of 30ºC. The JND 25 for cold and warm detection represents perception of a 22ºC difference from the starting temperature for cold and a 20ºC difference for warmth, while JND 1 represent a perception of a 0.063ºC difference from the starting temperature for both cold and warmth. Thus, the JND scale is a non-linear scale, and this complex test algorithm also includes different stimulus configurations, and different arbitrary durations of the constant hold phases during the trap-shaped stimuli. At the beginning of the test (JND level 13), the subject is required to select and press a switch to report “yes” or “no” in response to the stimulus. Depending on if the answer was “no” or “yes”, the first stimulus is followed either by an increase in stimulus strength of four steps to JND 17 (±6.328 ºC off the baseline), or a decrease to JND 9 (±0.634 ºC off the baseline). This is followed by an increase or decrease (depending on whether the stimulus was detected or not) by two JND steps, and finally all the following stimuli will continue by one step increase/decrease (again depending on whether stimuli are detected or not) in JND level. (Case IV System Manuel, Scientific Reference, Version 4.1. Stimulus Characteristics, JNDs, and Algorithms, page 4.4).

14
The threshold value is defined as the mean of the turning of the single level steps, i.e. after exclusion of detections registered after the initial four and two JND-step changes (Dyck et al., 1993b; Gruener and Dyck, 1994; Yarnitsky, 1997; Chong and Cros, 2004).
The stepping algorithm has been incorporated in a commercially available equipment (CASE IV®, WR Medical Electronics Co., Stillwater, USA). In the rationale incorporated in this machine, a first, manually operated determination of the JND level of the perceived threshold is determined, followed by a computer controlled detection with in total 20 turn points that also includes five null stimuli. In the program, a maximum of two erroneously reported stimulus responses are accepted; otherwise the program will require a restart of the test procedure. Also, a maximal difference of two JND between the manually and the computer controlled assessments are accepted, in order to achieve an approved testing.
Forced choice: In brief the subjects are presented to two stimulus presentations - one false and one correct. The subject has to make a decision about which one of the two stimuli that was perceived (the subject is forced to choose). Three out of four stimuli in a row must be correct to allow a reduction of the intensity of the stimulus, or otherwise it will increase. This is by far the most time-consuming QST test (Yarnitsky and Sprecher, 1994; Chong and Cros, 2004). Forced choice take up to six times longer to perform compared to the MLI (Claus et al., 1990) and is therefore mainly used in research settings.
1.6 Transthyretin amyloidosis
Amyloid diseases are characterised by the deposition of insoluble fibrils (amyloid) in various tissue. The amyloid fibrils consist of misfolded proteins, and the clinical presentation of the disease is related to the amyloidogenic protein. Amyloid diseases can be systemic or localizised and may be hereditary, where the point mutations of the genetic protein may facilitate misfolding and amyloid fibril formation. Transthyretin (TTR) amyloidosis (ATTR), previously formally named familial amyloidotic polyneuropathy (FAP), is a systemic inherited disease (Adams, 2001; Westermark et al., 2005). FAP was first described by Andrade in the 1950s, when he described a rare progressive and fatal neuropathic disease found in inhabitants of the small Portuguese fishing village, Pavoa Vazim (Andrade, 1952).

15
The first Swedish ATTR patient was diagnosed in 1965 (Holmgren et al., 1994). Today ATTR has been described worldwide, with major endemic foci in; Portugal, Japan, Sweden (Sousa, et al., 1993; Holmgren et al., 1994; Sousa, et al., 1995; Planté-Bordeneuve and Said, 2000; Adams, 2001; Koike, et al., 2002; Conceição and de Carvalho, 2007; Richardson and Cody, 2009), and Brazil (Palácios et al., 1999; Bittencourt et al., 2005; Zaros et al., 2008; Saporta et al., 2009). ATTR is autosomally inherited (Planté-Bordeneuve et al., 2000; Adams, 2001; Hund et al., 2001; Kimura, 2001; Suhr et al., 2003; Richardson and Cody, 2009). Recent reports have shown an increased risk of developing the disease when maternally inherited. Furthermore, these patients may also have an earlier age of onset (Hellman et al., 2008; Bonaïti et al., 2009).
Hereditary ATTR amyloidosis is caused by a mutation on the TTR-gene located on chromosome 18, and more than 100 mutations are described today (Connors, et al., 2000; Connors, et al., 2003; Ando et al., 2005; Planté-Bordeneuve and Said, 2011). The Val30Met mutation, in which the amino acid valin is substituted by methionine at position 30, is the most common variant with concomitant neuropathic affection (Connors et al., 2000; Adams, 2001; Connors et al., 2003; Suhr et al., 2003; Ando et al., 2005; Richardson and Cody, 2009). Approximately 95% of the TTR protein is synthesized in the liver, but synthesis also occur in the choroid plexus and the corpus vitreum (Benson and Kincaid, 2007). TTR amyloid fibrils accumulate in the heart, kidneys, peripheral nerves, intestines and the subcutaneous fat tissue, causing an interference with the normal functions of these organs (Hund et al., 2001; Suhr et al., 2003). Within the nerves, the amyloid deposits are primary found in the endoneurium (Coimbra and Andrade, 1971; Planté-Bordeneuve et al., 2000; Adams, 2001; Said and Planté-Bordeneuve, 2009). Over time the amyloid deposits increase with worsening of the tissue damage, and the clinical disease progression.
Differences in the penetrance of the trait and phenotype of the disease, especially for age at onset varies between endemic areas (Ikeda et al., 1987; Holmgren et al., 1994; Koike et al., 2002; Sobue et al., 2003; Sousa et al., 2003; Ando et al., 2005; Bittencourt et al., 2005; Conceição and de Carvalho, 2007; Richardson and Cody, 2009; Saporta et al., 2009; Hörnsten et al., 2010; Kawaji et al., 2010). The underlying causes to this are yet not known, but other factors than genetic ones are likely to be involved (Dardiotis et al., 2009; Olsson et al., 2009; Olsson et al.,

16
2010). Also, the transthyretin fibril composition varies between patients with early (younger than 50 years) and late onset (older than 50 years) of the disease. Where amyloid fibrils composed of full-length TTR is found predominantly in early onset patients, whereas a mixture of full light and fragmented TTR dominates in patients with a late onset (Ihse et al., 2008; Koike et al., 2009). In the Swedish population the penetrability of disease onset is about 5 percent among carriers, with a mean onset of the disease around 56 years of age (Holmgren et al., 1994; Richardson and Cody, 2009). Carriers within the Portuguese and Japanese populations have much higher penetrance (about 85%) and a lower mean onset age (Ikeda et al., 1987; Koike et al., 2002; Sobue et al., 2003; Koike et al., 2004; Ando et al., 2005; Richardson and Cody, 2009). The Swedish mutation was until recently presumed to be of Portuguese origin, but it has now been shown to have their own Swedish founder, while other studies have indicated that the Brazilian (Zaros et al., 2008) and the Japanese variants derive from Portugal (Ohmori et al., 2004; Ando et al., 2005).
Even though the mutation can be detected by PCR or direct sequencing of the gene, the diagnosis can only be sustained by histopathology of biopsy specimens displaying green birefringence when examined in polarised light after staining by Congo red or an electro microscopic detection of the typical amyloid fibrils (Adams, 2001; Planté-Bordeneuve and Said, 2011). Since Val30Met ATTR is a systemic amyloidosis, amyloid deposits can be found in all organs, except for the central nervous system. Today, fat, skin and salivatory glands is the most common site for biopsy (Planté-Bordeneuve and Said, 2011). Recent studies have also reported possible non-fibrillar cytotoxic substances in early stages of the ATTR disease (Sousa et al., 2001; Hou et al., 2007; Misumi 2009), as well as in other diseases caused by protein miss-folding processes, like in Alzheimer’s disease (Colton et al., 2000; Whalen et al., 2005; Benseny-Cases et al., 2007) and diabetes (Grudzielane et al., 2007).
In early stages, Val30Met ATTR patients’ often presents signs and symptoms like paraesthesias, foot-pain, impaired warm- and cold sensation, orthostatic hypotension, continuous constipation or altering with diarrhoea and delayed gastric emptying, that together with sexual erectile dysfunction can be presenting symptoms of the disease (Ando and Suhr, 1998; Adams, 2001; Koike et al., 2002; Sobue et al., 2003; Koike et al., 2004; Ando et al., 2005; Richardson and Cody, 2009). These

17
are all symptoms related to an affection of predominantly thin somatic and autonomic nerve fibers (Lauria, 2005). As the disease progresses, many patients experience difficulties in walking and become with time severely incapacitated bedridden or bound to a wheelchair. Severe weight loss caused by marked malnutrition and development of heart arrhythmia, necessitating pacemaker treatment are common complications of the disease. As the disease progresses, ATTR finally leads death within 5-15 years after onset (Adams, 2001; Suhr et al., 2003; Richardson and Cody, 2009).
Neurophysiologic examinations with nerve conduction recordings and electromyography are fundamental in the examination of ATTR patients, due to the axonal loss in the peripheral nerves (Blom et al., 1981; Adams, 2001; Kimura, 2001; Richardson and Cody, 2009). Early signs are decreased sensory amplitudes, particularly in the sural nerve, but later on also decreased motor amplitudes. However, in the early phases of axonal impairment, the recorded nerve signal amplitudes may well be within normal limits, as the functional state of both sensory and motor nerve fibers are assessed from thick myelinated fibers (Kimura, 2001). This means that an early detection of PNP solely by nerve conduction or EMG studies is difficult or even impossible, until the disease has significantly impaired myelinated nerve fiber function. To assess small fiber function, analyses of respiratory HRV is commonly used in all suspected or verified ATTR patients (Niklasson et al., 1989; Kinoshita et al., 1997; Morelli et al., 2002), and patients with such affection will show a decreased heart rate variability is seen early in the course of the disease, due to a loss in central parasympathic nerve fibers to the heart. However, in patients with conditions such as arrhythmia and/or implanted cardiac pacemakers this method is not an optimal option (Eriksson et al., 1984).
There is no curative treatment available for ATTR, but liver transplantation reduces the variant TTR serum concentration up to 95 percent (Holmgren et al., 1991; Adams et al., 2000), leading to a markedly prolonged survival times in ATTR patients, especially in cases with a Val30Met mutation and short disease duration at diagnosis (Holmgren et al., 1993; Ericzon et al., 1995; Tashima et al., 1999; Adams et al., 2000; Suhr, 2003; Suhr et al., 2005; Okamoto et al., 2009), with a general improvement in quality of life (Jonsén et al., 2001). Patients with other mutations, late onset and advanced complications of the disease, especially cardiomyopathy are less likely to benefit from a liver transplantation (Okamoto et al., 2009).

18
As ATTR often initially include thin nerve fibers involvement, in combination with the progressive nature of the disease, an early detection of thin fiber disturbances is of great importance. This is particularly the case in the light of improving possibilities for symptomatic surgical and/or medical treatment of ATTR, as promising results with drug interventions has been found (Richardson and Cody, 2009; Ando, 2011). Finding early screening methods might be even more important in the future, as non-fibrillar cytotoxic deposits have been found in early stages in the disease (Sousa et al., 2001; Hou et al., 2007; Misumi et al., 2009), maybe indicating that a cytotoxic affections occur long before amyloid accumulation contribute to organ destruction.
Thus, reliable techniques for identification and quantification of impaired thin somatic myelinated and unmyelinated nerve fiber function are of uttermost importance for this specific group of patients.

19
2. Aims
The general purpose of this thesis was to address methodological aspects of thermal quantitative sensory testing performed by the ‘method-of-limits’, and to elucidate the clinical usefulness of the method, when applied to a genetically defined group of Swedish Val30Met ATTR patients.
The specific aims were: I. To evaluate the reproducibility of the method-of-limit by a
test/re-test experimental design, and to assess a supposed influence of the test modality order on thermal perception thresholds and thermal cold and heat pain thresholds.
II. To define reference data at distal and proximal test sites, and
evaluate a possible age-dependence with decreased thermal perception during increased age.
III. To assess the temperature thresholds for warm and cold
perception in patients with a genetically defined Val30Met ATTR at an early clinical stage, prior to conventional electrophysiological changes in peripheral nerves.
IV. To evaluate a possible relationship between the
psychophysically determined estimates of thermal thresholds and the assessed physiological estimates of respiratory heart rate variability in early- and late-onset Val30Met ATTR patients.

20
3. Materials and methods
All volunteers had given their informed consent prior to testing. Patients were examined in the course of routine clinical protocols during specialist evaluation of possible ATTR at a university hospital clinical specialist evaluation. All studies followed the guidelines of the World Medical Association’s ‘Declaration of Helsinki’ and were approved by the local ethical committee of Umeå University (01-361, 04-092).
3.1 Overview
A summary of the four study designs adopted in the present thesis is shown in Table 2. The subjects included were subjectively healthy controls and ATTR patients. ‘Tested sites’ refer to the stimulus locations used during QST, (see also Figure 3).
Table 2. Study design overview.
Main topic Subjects N Assessments Test sites
Test/retest (Paper I)
Controls 38 CT, WT, CPT, HPT
Volar forearm
Reference data (Paper II)
Controls 70 CT and WT DF, ML, LL, VT, TE, RA, UA, DA
Early assessment of small fiber PNP (Paper III)
Controls Patients
43* 23
CT and WT (NCS+ EMG)**
DF, ML, LL, VT
Combined QST/ HRV in ATTR patients (Paper IV)
Early onset Late onset
13 15
CT and WT HRV and (NCS)***
DF, ML, LL, VT
Cold pain thresholds (CPT); cold perception thresholds (CT); deltoid part of upper arm (DA); dorsum of the foot (DF); electromyography (EMG); heat pain thresholds (HPT); heart rate variability (HRV); lateral part of the lower leg (LL); medial part of the lower leg (ML); nerve conduction studies (NCS): radial part of the forearm (RA); thenar eminence part of the hand (TE); ulnar part of the forearm (UA); ventral thigh (VT); warm perception thresholds (WT). *Included in paper II; ** ATTR patients with abnormal NCS and EMG findings were excluded; *** Evaluation of the sural nerve action potential amplitude.

21
3.2 Material
All control subjects (papers I-III) were colleagues, friends, staff or students at the department. They were all subjectively healthy; without known disease of diabetes and without signs or symptoms of PNP, neck or back injury, or disturbed thermal sense. All patients included (papers III-IV) had a genetically verified Val30Met mutation, with a biopsy verified transthyretin amyloidosis; other types of mutations were excluded. The patients were retrospectively evaluated by analyses of their digitally stored thermal QST (papers III-IV), NCS and EMG (papers III-IV) and HRV (paper IV) data.
Paper I: Thirty-eight controls, aged 22-55 years (mean 30.9) participated in the study (Table 3). Twenty-nine were tested according to the original experimental design, while nine additional subjects were tested in a complementary assessment. The test-sequences of separate cold CT and WT, and cold (CPT) and heat (HPT) pain thresholds were randomly chosen, but cold sense was always tested before warm. The original experimental set-up design was three testing sessions at three days of testing (days 1, 2 and 7). The complimentary group was added in a separate series of testing, to further elucidate the possibility of a dependence of QST subtest order, indicated by the preliminary analyses. These series only included one test-session each day of testing.
Paper II: Seventy-five controls, aged 16-72 years (mean 38.7) participated and were included in the study (Table 3). At the DF, ML and LL outliers were withdrawn from the final statistical analysis.
Table 3. A descriptive characteristic of the subjects in papers I and II.
Age Mean Median (SD)
Height Mean Median (SD)
Paper I Males (n=18) Females (n =20)
Paper II
30.3 26.5 (9.4) 31.5 28.5 (9.1)
177.6 179.5 (7.6) 166.9 167.0 (6.0)
Males (n=37) Females (n=38)
38.9 38.0 (13.3) 39.3 39.5 (14.0)
178.9 179.0 (6.5) 166.4 167.0 (7.1)
m, mean; md, median; SD, standard deviation.

22
Paper III: Thirty-one patients with a positive genetically Val30Met marker and with biopsy findings of amyloid deposits were retrospectively selected from the entire group of ATTR patients tested with QST at our department over the period 1998 to 2003. Patients for the study were further selected on the basis of normal NCV and EMG findings, according to laboratory specific reference values. Both controls and patients were divided into separate age - groups (<45 years and ≥45 years). Control subjects: The younger age - group, included 11 women and 15 men between 21-44 years of age (mean 30). The older age - group included 12 women and 5 men between 46-62 years of age (mean 53). ATTR patients: Twenty-three patients with were finally included for the study. Seven women and four men (range 27-45 years) were included in the younger group, and ten women and two men (range 46-80 years) were included in the older group (c.f. Table 4).
Paper IV: Twenty-eight ATTR patients between 25.6-73.4 years of age were included. In table 4 are descriptive data at the time of examination shown. They were sub-divided into early- (<50 years) and late onset (≥50 years), with a median disease onset of 51.0 years. Clinical data are shown in Table 5. Only patients completing all of the NCV, EMG, QST and HRV examinations were included in the study, to ensure full combined evaluation. For the estimates of HRV, patients were classified as abnormal if their overall heart rate variability was outside the 95% confidence interval, defined from a reference material of 90 healthy subjects aged between 20-80 years (c.f. Wiklund et al., 2010).
Table 4. Descriptive characteristics of all ATTR patients in papers III and IV.
Age (yrs) m md SD
Paper III <45 years (n=11) 38 40 (6.2) ≥ 45 years (n=12) 58 55 (9.0)
Paper IV Early onset (n=13) Late onset (n=15)
40 39 (7.7) 65 64 (6.4)
Data presented as: mean (m); median (md); SD, standard deviation (SD).
23
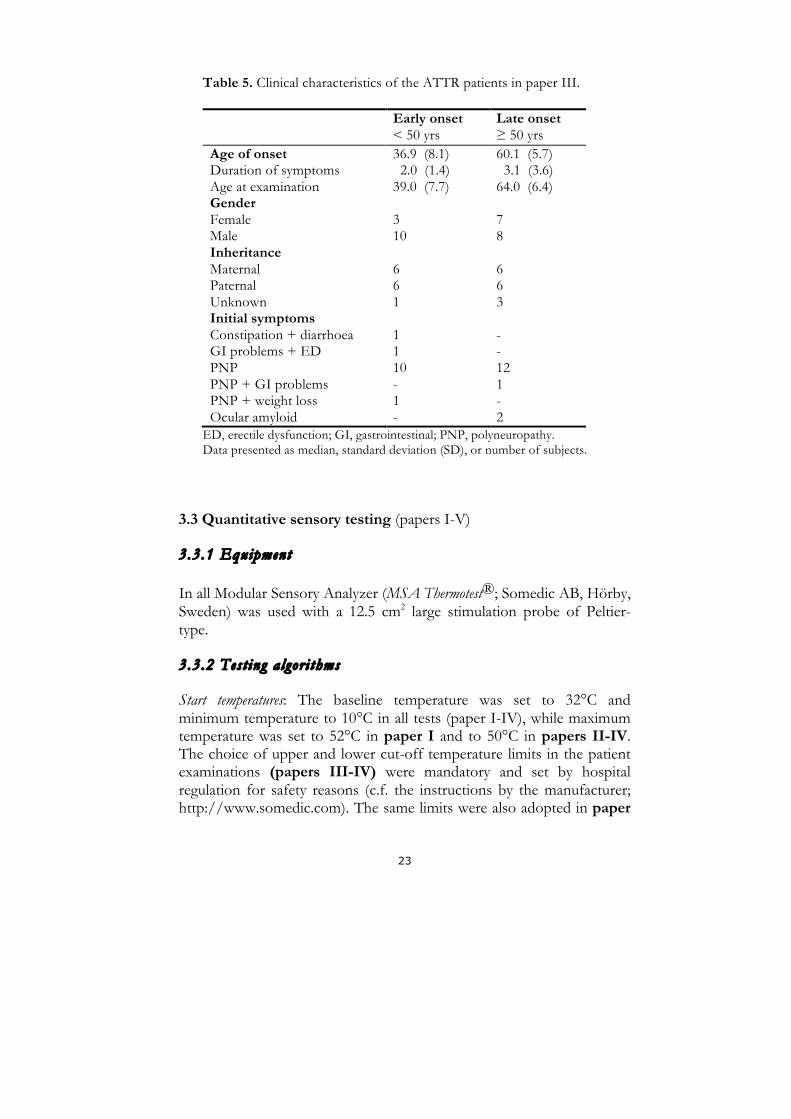
Table 5. Clinical characteristics of the ATTR patients in paper III.
Early onset < 50 yrs
Late onset ≥ 50 yrs
Age of onset Duration of symptoms Age at examination Gender Female Male Inheritance Maternal Paternal Unknown Initial symptoms Constipation + diarrhoea GI problems + ED PNP PNP + GI problems PNP + weight loss Ocular amyloid
36.9 (8.1) 2.0 (1.4) 39.0 (7.7) 3 10 6 6 1 1 1 10 - 1 -
60.1 (5.7) 3.1 (3.6) 64.0 (6.4) 7 8 6 6 3 - - 12 1 - 2
ED, erectile dysfunction; GI, gastrointestinal; PNP, polyneuropathy. Data presented as median, standard deviation (SD), or number of subjects.
3.3 Quantitative sensory testing (papers I-V)
3.3.1 Equipment
In all Modular Sensory Analyzer (MSA Thermotest®; Somedic AB, Hörby, Sweden) was used with a 12.5 cm2 large stimulation probe of Peltier-type.
3.3.2 Test ing algor i thms
Start temperatures: The baseline temperature was set to 32°C and minimum temperature to 10°C in all tests (paper I-IV), while maximum temperature was set to 52°C in paper I and to 50°C in papers II-IV. The choice of upper and lower cut-off temperature limits in the patient examinations (papers III-IV) were mandatory and set by hospital regulation for safety reasons (c.f. the instructions by the manufacturer; http://www.somedic.com). The same limits were also adopted in paper

24
II, to strive for as standardised conditions as possible during reference data collection, in view of future patient examinations. This rationale was further corroborated by the notion that changes in temperature pain perception thresholds are not routinely studied in clinical evaluations of PNP patients.
Warm and cold stimuli: In all tests, the rate of temperature change was set to 1°C/s during the actual stimulation, while the return to baseline was set to at 3°C/s (papers I-V). Two consecutive series with ten warm and ten cold stimuli were delivered, always starting with cold and followed by warmth. The inter-stimulus interval varied randomly between 3-5 s. The subjects were asked to acknowledge perception of the stimulus by pressing the switch “as soon as they perceived a change in the cold or warm temperature”. All stimuli/responses were included in the analysis, apart from those were the subject spontaneously reported mistakes caused by surrounding factors unrelated to the test situation, as for example lack of attentiveness.
Painful heat and cold stimuli (paper I): The rate of temperature change was set to 2°C/s, while the return to baseline occurred at 4°C/s. Three consecutive stimuli of each kind were given, manually started with an interval of approximately 30 seconds between stimuli (Verdugo and Ochoa, 1992; Yarnitsky et al., 1995). The subjects were asked to press the switch “as soon as the thermal stimulation was perceived as painful”. The first of the three stimuli were discarded, by reason that the perception to be expected may be different at different body sites and hence has to be considered as a trial test.
3.3.3 Tested s i t es
Stimulus locations: Test sites were defined on the basis of anatomical, physiological and pathophysiological considerations. In paper I the volar aspect of the forearm was selected, to achieve recordings from an area with a non-glaborous skin, as hairless as possible, and with a presumed average cortical representation, outside the hand and face. In papers II-IV several bilateral body sites were selected, to enable descriptions of, and discrimination between, putative generalised PNP with distal dominance and lateralised sensory disturbances in the arms or legs. Thermal testing was performed randomly at the test-sites in controls (papers I, III and IV) (c.f. Figure 3).

25
Paper I: The volar surface at the lower arm, midway between the volar midline and the ulnar border was the only body site examined.
Papers II-IV: DF: the dorsum aspect of the foot (Papers II-IV) ML: the medial part of the lower leg (Papers II-IV) LL: the lateral part of the lower leg (Papers II-III) VT: the ventral thigh (Papers II-IV) TE: the thenar eminence (Papers II-IV) UA: the ulnar aspect of the lower arm (Paper II) RA: the radial aspect of the lower arm (Paper II) DA: the deltoid anterior on the upper arm (Paper II)
Figure 3. Tested sites in papers II-IV (marked as black dots).

26
3.4 Nerve conduction studies and electromyography (papers III-IV)
All ATTR patients had been evaluated by routine electrophysiological examinations, and in the present work they were retrospective evaluated by their stored NCS and EMG data. Patients with abnormal findings of NCS and EMG were excluded in paper III, and in paper IV the sural nerve action potential amplitude was exclusively evaluated and visually re-inspected. All the NCS and EMG signals were recorded on a Nicolet Viking Select (Nicolet Biomedical®, Madison, USA).
NCV: motor nerve conduction and F-wave studies were performed at the peroneal, tibial, median and ulnar nerves, using stainless steel disc electrodes (Alpine Biomed Hush®, Skovlunde, Denmark); the filter settings were 20 Hz/2 kHz, and gain was 200 µV–5 mV/division. The sensory nerve conduction studies were performed in the median, ulnar and sural nerves, with an antidromic technique using two adhesive electrodes (Alpine Biomed Hush®, Skovlunde, Denmark). In the sural nerve recordings, the electrical stimulations were done at the calf region, and the recordings just behind the external malleolus, using two 10 mm stainless steel disc electrodes (Alpine Biomed Hush®, Skovlunde, Denmark), filter settings of 20 Hz/2 kHz, and a gain of 2–5 µV/division.
EMG: was performed with a concentric needle electrode (Alpine Biomed Hush®, Skovlunde, Denmark), bilaterally in the anterior tibial, and the gastrocnemius and/or soleus muscles, as well as in the medial vastus of the thigh and the abductor pollicis brevis muscle of the hand. A presence of abnormality was acknowledged by; 1) spontaneously occurring positive sharp waves, fibrillation potentials, or fasciculation’s at rest; or 2) increased amplitudes or durations of the compound motor unit potentials at weak contractions; or 3) a reduced EMG interference pattern at full voluntary contraction, and each of these were used as exclusion criteria in paper III.

27
3.5 Heart rate variability (paper IV)
The evaluation of HRV closely followed the rationale described by Wiklund et al. (2010). Briefly, a single-lead electrocardiogram (ECG) was recorded with a sampling rate of 500 Hz, and the respiration was recorded using ‘immediate respiration monitoring’, i.e. measuring impedance between two chest ECG electrodes.
HRV recordings started with the patient in the supine position, performing normal spontaneous breathing for six minutes (baseline), followed by two one-minute long sequences with controlled breathing. Finally, an approximately four minute’s long recording was done after a passive tilt to a 70-degree upright position.
Power spectral analyses of the HRV data were performed by auto-regressive modelling (c.f Wiklund et al., 2010 for a more detailed description of the procedure). HRV analyses were divided into power of low (PLF) and high (PHF) frequencies pattern, in the supine position (sup) and in the upright position after tilt. All computations were performed with Matlab® software package (Mathworks, Natick, Mass, USA).
3.6 Data conditioning
Prior to analyses, all thermal tests were manually reviewed to check for possible errors in stimulus detection reporting, such as single outliers among otherwise similar stimulus percept reporting’s. The CT and WT of the tested site during the stimulus sequence were defined as the mean values of the recorded individual thermal percept. Pain threshold assessments were given by the average of the two last recorded readings in a sequence. All thresholds were expressed as the absolute difference in degrees Celsius from the defined baseline temperature (|∆°C|), denoted by ∆°C (relative threshold values). This is also in accordance with an earlier recommendation (Claus et al., 1987); based on the notion that thermal perception thresholds account for the perceived change in temperature from a defined baseline. All analyses were based on such relative threshold values, but in paper II also the absolute temperature (°C) was used.

28
3.7 Analyses and statistical testing
All parametric and non-parametric statistical analyses were performed using commercially available programs (Microsoft®-Excel, Statview®,
SPSS® and Graph Pad Prism®). Differences between groups or between data were assessed by the Kolmogorov-Smirnov two-sample test (paper I), the Mann-Whitney U test (papers I-IV), the Friedman’s test (paper I), the Spearman rank correlation (papers I-III), Pearson correlation (paper IV) and multiple regressions (paper I). The significance level of p < 0.05 was used throughout to reject the null hypothesis of no differences between groups in all papers.
In paper I, descriptions of the variations in individual thermal perception and thermal pain thresholds between days and between sessions were done with the coefficient of repeatability, defined as [1.96xSDdiff] (Bland and Altman, 1986), and with the coefficient of variation, defined as [(SD/mean) x100]. As the estimates of coefficient of variation are dependent on the magnitude of the studied variable (Bland, 2000), both absolute and relative threshold values were calculated and described. In this paper inter-individual evaluations between individuals at group level were performed between days (1-2, 2-7, 1-7) and sessions (1-2, 1-3, 2-3). Intra-individual analyses were performed within individuals that had excited exactly the same test sequence order, between days (1-2-7) or sessions (1-2-3).

29
4. Results and discussion The main conclusion from this present thesis is that QST is an important complementary method for early detection of neuropathic changes in peripheral nerves. This notion is based on the finding of significantly elevated TPT in ATTR patients with genetically verified Val30Met and biopsy findings of amyloid deposits, but without abnormalities in their NCS and EMG recordings. Furthermore, repeated testing of thermal perception and thermal pain thresholds showed that the MLI is a reliable method to use in QST. No general association between QST and HRV were found in ATTR patients, albeit some findings in patients with late onset of the disease indicated such a possible relationship. Also, the ATTR patients with an early onset age showed more severely affected temperature detection and had slightly shorter disease duration, hence showing signs of a more rapidly progressing disease.
4.1 General methodological considerations
4.1.1 Subjec ts
In papers II-III fewer ‘older’ male than female contro ls were included due to difficulties in finding healthy men over 45 years of age that fulfilled the inclusion criteria. It could be argued that this could indicate that too strict criteria’s for inclusion had been adopted in the study. But although the controls were all subjectively healthy, possible unknown conditions such as tacit disc hernia, low-grade musculo-skeletal back/neck pain, or other subclinical affections may have been present. As the subject’s performance in the QST potentially may be affected by any such affection, the criteria for inclusion have to be strictly maintained. However, there is still a possibility that subclinical peripheral nerve affections or changes in central transmission properties could have initiated the focally elevated TPT found in some of the control subject’s thermal data (paper II). These thermal data were considered as outliers, and were excluded from the study on the basis of the overt asymmetrical findings in the thermal testing, in full awareness of that exclusions of subjects from a control group may contribute to fundamental inaccuracies (Palmer and Martin, 2005), although others also have deleted outliers visually ‘bye eye’ (Yarnitsky and Sprecher, 1994). As the subjects during testing reported impaired thermal warm perception at the lower part of the leg, it is likely that an initial screening with warm/cold

30
metal rods (e.g. Rolltemp®, Somedic AB, Hörby, Sweden) for cold and warmth could have avoided inclusion of such subject before the QST, but such an equipment was not available at the time of testing.
In this thesis only ATTR patients with a Val30Met mutation were included (papers III-IV), and in order to evaluate a homogenous group of patients all other types of mutations were excluded. The Val30Met mutation usually gives neuropathic symptoms (Adams, 2001; Connors et al., 2000; Connors et al., 2003; Ando et al., 2005; Richardson and Cody, 2009), and is also the most frequent mutation found in Sweden (Suhr, 2003; Ando et al., 2005; Richardson and Cody, 2009).
4.1.2 Methods NCS and EMG are both fundamental electrophysiological methods for diagnosis or verification of different types of polyneuropathies (Aminoff, 1998; Kimura, 2001). However, as particularly thin autonomic and somatic nerves may be affected early in the ATTR disease (Adams, 2001; Koike et al., 2002; Sobue et al., 2003; Koike et al., 2004; Ando et al., 2005; Richardson and Cody, 2009) methods evaluating different types of small fiber neuropathies are crucial. For this purpose HRV-testing have been used as an additional method in evaluations of autonomic sympathetic and parasympathetic function in ATTR patients (Kinoshita et al., 1997; Morelli et al., 2002), which is a logical addition to the clinical rationale, as some patients may debut with cardiac symptoms only (Ole Suhr, personal communication, 2010), and in Swedish and Japanese late onset patients cardiac involvements are more common than in those with early onset (Hattori et al., 2003; Suhr et al., 2006; Hörnsten et al., 2010). On the other hand, from clinical experience, there are also several patients with selective and longstanding symptoms of distal small fiber affection, with a disturbance of thermal seen as a prominent feature. Thus, additional methods for testing other types of nerves in the small fiber range are needed. QST has been demonstrated to be a useful tool for evaluation of patients with diabetes (Hilz et al., 1988; Hendriksen et al., 1993; Gelber et al., 1995; Abad et al., 2002; Krämer et al., 2004; Zinman et al., 2004; Ørstavik et al., 2006; Løseth et al., 2008), because these patients often suffer from sensory and autonomic small fiber neuropathy before large nerve fiber involvement. Hence, QST can be assumed to be of value in

31
other groups of patients with small fiber involvement, such as ATTR patients. To further study this, the method-of-limit (MLI) was chosen due to its usefulness in clinical practise (Claus et al., 1987; Levy et al., 1989; Verdugo and Ochoa, 1992), and also due to the possibility of separate cold (CT) and warm (WT) perception threshold estimates (Claus et al., 1987; Hilz et al., 1995a). Unfortunately, straightforward comparisons between several previous reports and the studies presented in the present thesis with the MLI are hampered by the lack of standards for clinical QST methods. Furthermore, differences in details within the MLI such as probe size, inter-stimulus interval, temperature changes during actual testing and return to baseline, further contribute to comparisons with earlier work in the field. Finally, also the different body regions used in previous studies further complicates comparisons as well as the different statistics’ and approaches in how data were presented. Measuring start skin temperature is strongly recommended prior to thermal testing (Hilz et al., 1995a), to ensure correct assessment of the temperature threshold (Schmidt, 1978). In the present work warming in a water bath was done if the skin temperature was lower than 31ºC, to as far as possible ensure comparable testing conditions between patients. This temperature was chosen to prevent cold induced reduction of nerve fiber conduction within the peripheral nerve branches in the skin (c.f. Aminoff, 1998); although recommendations of allowing even lower skin temperatures (26-27 ºC) has been earlier suggested for QST (Hilz et al., 1995a; Hagander et al., 2000). However, during the possibly prevailing pathological conditions in ATTR, the start skin temperature in patients may be more crucial than in healthy subjects, as the small fiber neuropathy may also result in impaired peripheral circulation with secondary effects on both nutrition and oxygenisation. Furthermore, in clinical practise it is often noted that many patients show a rather fast decline in their skin temperature during the actual thermal testing, again arguing for a higher start skin temperature.

32
4.1.3 Aspects o f gender and s ide di f f erences in QST tes t ing
Generally, no overall significant differences were found in TPT between sides or gender in control subjects (papers I, II and III), which is in line with previous reports using the MLI (Claus et al., 1987; Redmond et al., 1990; Becser et al., 1998; Rolke et al., 2006; Huang et al., 2010; Magerl et al., 2010). A significant difference between sides was only found for CT at the LL in the older age group (paper III).
Significant differences between genders were observed in paper II for WT at the VT, TE and RA, and for CT at the TE, and in paper III for CT at the DF, the ML, and the LL. Other studies have shown similarly inconsistent differences between genders (Yarnitsky and Sprecher, 1994; Hilz et al., 1999; Lin et al., 2005), for example males showing higher thresholds for warmth compared to women (Hilz et al., 1999), which also was in accordance with the findings in paper II. In the literature, a report has been published that may explain such gender differences; Selim et al. (2009) noted higher epidermal nerve fiber density at the thigh in females than in males, which could relate to the finding of higher TPT in males than in females (paper II). However, the gender differences in the present thesis were considered to be occasional, as the number of included men in paper II (and paper III) was low. Such aspects have also previously been considered as a confounding factor (Yarnitsky and Sprecher, 1994). In papers III and IV no systematic significant differences in TPT between sides or genders within were found in ATTR patients, apart from likely occasional differences in paper IV, between genders for WT at the right VT in early onset patients, and for CT at the right VT in late onset patients.
4.2 Reproducibility of thermal thresholds (Paper I) The main findings were a good repeatability between repeated QST testing’s, and an observation that CT and WT must be tested before any testing of pain thresholds, as both CT and WT were significantly increased if pain assessment was done before the TPT testing.

33
4.2.1 Test sequence order
Within healthy subjects (n=38) both CT and WT were significantly elevated when thermal testing was done after pain thresholds testing, instead of before, (c.f. Figure 4). No significant differences were found between CT or WT, with respect to if the thermal testing was done after cold pain or after heat pain; hence these sequences were merged as “after thermal pain assessment” (aTPA). Also the coefficient of repeatability (CR) and coefficient of variation (CoV) presented increased thermal perception thresholds aTPA. Taken together, these results implicate that TPT is influenced by the order of the tested modalities, and thus must be done prior to any assessment of cold or heat pain to avoid bias in the form of elevated thermal thresholds.
Figure 4. Box plots of thermal thresholds (n=38) for cold (CT) and warm (WT) perception threshold. Tests were done at the Volar for arm. Lines in boxes show medians, boxes 25th and 75th percentiles, whiskers 10th/90th percentiles, and dots show outliers. First test (FT, n=17), after thermal pain threshold assessments (aTPA, n=21).

34
4.2.2 Repeated tes t ing
Figure 5 A: Cold- (CT) and warm- (WT) perception thresholds; and subdivided with respect to first test (FT, n=6) and test after thermal pain assessment (aTPA, n=18). Computations based on the absolute value of the relative change in °C from an adapted skin temperature of 32°C.
As illustrated in figure 5 (A and B), at repeated testing with the MLI the thermal perception and thermal pain thresholds showed a high degree of reproducibility between days (days 1-2-7). No significant differences were found when TPT was done as first test (FT) or aTPA, neither within nor between individuals. This degree of reproducibility is in line with earlier reported studies in children (Meier et al., 2001) and adults (Hilz et al., 1995a; Lowenstein et al., 2008). These two previously studies also used similar test sites as the ones in the present work; the volar forearm. Also another report have shown a good degree of reproducibility of testing between testing days (Agostinho et al., 2009), with no significant differences between days for WT and HPT, albeit small differences were noted for CT and CPT.
The intra-class correlation (ICC), which also can be used to describe reproducibility, was not used in the present study, but such analyses have been used in other reports. ICC according to Fleiss measures the fraction of the total variance (between subjects and within subjects) (Fillingim et

35
al., 1999). In previous studies using this method it was shown that CT and WT (Becser et al., 1998), as well as CPT and HPT (Wasner and Brock, 2008), have high ICC between testing days, also indicating good reproducibility. However, a higher degree of variation was reported for cold pain rating. Recently, CT, WT, CPT and HPT were reported to demonstrate good repeatability by ICC, but again with higher intra-individual variations for CPT (Moloney et al., 2011).
Figure 5 B: Individual mean thresholds in days 1, 2 and 7, assessed at the first session in the first day of testing. Cold pain (CPT, n=8) and heat pain (HPT, n=5) thresholds. Computations based on the absolute value of the relative change in °C from an adapted skin temperature of 32°C.
When testing for differences between testing days, a poor reproducibility was reported for HPT (Fillingim et al., 1999). Furthermore, no correlation between the method-of-levels (MLE) and the MLI was noted, but significant gender differences in the MLE but not in the MLI may partly explain these findings (Fillingim et al., 1999). Repeatability studies using longer time interval has shown good reproducibility, both with the Stepping algorithm (Selim et al., 2010) and with the MLI

36
(Yarntisky et al., 1995), showing that the QST in general is apt for longitudinal trials.
In the present work, analysis of the variation in thermal threshold values between sessions (sessions 1-2-3) within the same day of testing indicated good reproducibility, as in most cases no significant differences between sessions were noted. No significant differences were found for thermal thresholds done as FT, or for pain thermal thresholds, neither between nor within individuals. For CT and WT done aTPA, in general no significant differences were found between sessions within individuals, except for CT at day 1. Between individuals no significant differences were found in an essential part of the possible session-combinations done aTPA (84%). These results further demonstrate that the MLI is a reliable method to use in QST, and that CT and WT are influenced by the test sequence order.
Previously, significant differences between repeated testing within the same day have been reported (Palmer and Martin, 2005). A resting period of 6-8 sec was introduced by Palmer and Martin (2005) between all tested modalities (CT, WT, CPT and HPT) even though for HPT a resting period of 30 sec should be preferred according to Verdugo and Ochoa (1992). On the other hand, in the same study the painful stimuli were still always applied after TPT, which is crucial factor to be taken into account, due to that the TPT is influenced by the test sequence order, as discussed above. The study design with six test-occasions within the same day was probably more time consuming for the subjects, compared to the three repeated daily sessions that was used in the present work. Palmer and Martin (2005) claimed that any observed changes of TPT between tests should be carefully re-considered, and that excluding subjects from a control group could lead to fundamental flaws, given the finding of a small, but significant difference between repeated testing. On the other hand, only women between 18-28 years were included in the study, which may have introduced a possible sampling bias. In any case, repeated testing at the same test site within a short period of time should not routinely be done in clinical practice.
The coefficient of repeatability between days was good, which corroborate previous results for CT and WT (Bravenboer et al., 1992; Bescer et al., 1998; Moravcová et al., 2005). In the present thesis the CR between days of testing was lower for both CT and WT when assessed before (range 0.62-1.35) then after assessment of pain thresholds (range 1.64-3.14).

37
The CR for CT and WT was earlier determined with the MLI and the MLE at the TE and the DF, with reports of lower CR for the MLI and at the TE (Yarnitsky and Sprecher, 1994; Moravcová et al., 2005). However, Yarnitsky and Sprecher (1994) reported slightly higher CR at the TE for testing performed with the MLI in comparison to the CR at the volar forearm in the present thesis, while Moravcová et al. (2005) reported similar results. Comparable results with the present thesis at repeated testing between days at the dorsal hand and the TE have been presented earlier. For CT the CR was 0.52 at the dorsal hand, and 0.72 at the TE, whereas for WT the CR was 1.74 at the dorsal hand and 0.62 at the TE (Becser et al., 1998).
HPT demonstrated lower CR compared to CPT in the present study (3.58-7.72 and 4.39-9.24, respectively). This corroborates recent findings by others, which show CR of 3.3 for HPT, and 6.7 for CPT in the hand (Sand et al., 2011). HPT has also been suggested to be reliable in longitudinal studies as good reproducibility was found at repeated testing, and with pain assessment showing the highest CR. (Yarnitsky et al., 1995). In this context it should also be kept in mind that threshold values for cold pain are difficult to determine, as many healthy subjects often perceive cold pain only at temperatures below 5°C (Kandel et al., 2000), and not above 10°C (Verdugo and Ochoa, 1992), which was the mandatory lower cut-off temperature that had to be used in the present work.
The coefficient of variation (CoV) between days was lower for CT and WT when done as first test (FT), compared to when done after thermal pain assessment. This was true for temperature thresholds described both with relative (∆°C) and absolute (°C) values. CoV was generally higher when determined from the absolute values, which is readily explained by the magnitudes of the studied variables (Bland, 2000). This fact brings an important implication, in that comparisons of CoV between studies are difficult, if not even impossible, unless the exact same type of underlying threshold data have been used in the reports being compared. Thus, it is also important to mention on which type of data a CoV estimate is based when such findings are reported. In the present work, the CoV based on relative temperatures ranged between 0.68-1.5% for CT and WT done as FT, and between 1.6-3.9% when done aTPA. Based on absolute temperatures, the CoV ranged between 13.0-33.6% for CT and WT done as FT, and between 20.0-55.4% for WT when done aTPA. An earlier study with similar experimental test site found no significant differences

38
of the intra-individual variability for CT and WT at repeated testing between days (Hilz et al., 1995a), with a median variation of only 0.1°C between tests. Taken together all these findings indicate a good repeatability for QST with the MLI between days.
The CoV for CT and WT between sessions within the testing day demonstrated inconsistent results, and no general trend the CoV based on FT or aTPA was seen. The CoV was generally higher for CT than for WT, which also was shown earlier (Levy et al., 1989; Redmond et al., 1990). In the present thesis the CPT, expressed as absolute values, showed very low CoV (0.72-1.7 %), compared to HPT (0.63-8.3). CoV based on relative thresholds varied between 0.34-0.74 for CPT and 5.8-24.3% for HPT.
QST with the MLI has also been shown to be reliable when used in clinical studies on patients. Studies testing the reliability of the MLI in patients with diabetes (Hilz et al., 1988), in sciatica (Zwart and Sand, 2002) and in small fiber PNP (Moravcová et al., 2005) have all demonstrated good reproducibility. However, higher inter-individual variations were reported in patients than in controls (Hilz et al., 1988).
The fact that the MLI is a reaction time dependent method has been claimed to be disadvantageous, as factors such as the subject’s concentration or mental status may risk influencing the threshold magnitudes (Yarnitsky, 1997; Chong and Cros, 2004). To elucidate this aspect, studies comparing various reaction time inclusive (RTI) and exclusive (RTE) methods have been done in healthy subjects as well as patients. High correlations between the MLI and the MLE have been reported in healthy subjects (Meier et al., 2001; Reulen et al., 2003; Lin et al., 2005), demonstrating that both types of methods are comparable in this respect, but has also been contradicted by studies with no correlation between the two (Yarnitsky and Sprecher, 1994; Fillingim et al., 1999). In patients good correlations between the RTI and the RTE methods have also been demonstrated; in diabetic patients between the MLI and forced choice (Levy et al., 1989) and between the MLI and the JND (Zinman et al., 2004); and between the MLI and the MLE in sarcoidosis patients (Hoitsma et al., 2003), and in patients without any known disease causing neural affection (Defrin et al., 2006). Interestingly, studies have also shown that thermal thresholds from both the MLI and the MLE correlate significantly with intra-epidermal skin

39
nerve fibre density in patients with diabetes (Shun et al., 2004; Vlcková-Moravcová et al., 2008).
Repeated testing with the RTE methods have demonstrated good reliability in diabetic patients and in normal subjects (Gelber et al., 1995), and in patients with pain (Geber et al., 2011). Another study in diabetes patients showed good reproducibility in the hand but poor in the foot (Bravenboer et al., 1992). Repeated testing during a longer time of period (three repeated test sessions within one year) showed no significant differences between test occasions using the stepping algorithm (Hendriksen et al., 1993), however a study with repeated testing at three occasions within one year found that both CT and WT (forced choice) correlated significantly with symptom severity at baseline, but poor correlation was seen after 17 and 52 weeks (Valk et al., 2000)
Taken together, all this indicates that QST in general, and the MLI in particular, can be considered as a reliable method for thermal perception testing, but also that CT and WT must be performed prior any testing of temperature pain thresholds, to avoid bias of false increases in TPT. Another important notion is that a strict, but yet easy, quick and reliable, methodology that promotes a low variability in the underlying data will promote a high repeatability of QST.
4.3 Reference data (paper II)
In paper II reference data were established for eight different body regions. In the lower part of the body, age generally seems to affect the magnitude of the thresholds, which show increased thresholds with increasing age, with high correlations found at the DF. The result underlines the importance of having specific reference data for different test sites. This present work is also the first report to present reference data for a more extended set of body regions, in both at the lower and upper part of the body. It is also proposed that the DF, ML, VT and the TE should be used as reference values during clinical evaluations in patients having symptoms of PNP. This notion is based on a wider clinical perspective, as the thermal QST indirectly investigates the functional state of the entire somatosensory pathways, ranging from the peripheral sensory organs to central processing mechanisms (Schmidt, 1978; Kandel et al., 2000). Due to this, also topological aspects will influence the selection of test points. This may be exemplified by the

40
polyneuropathic diseases, which typically are present as a generalized, symmetric disease with peripheral dominance. Thus, in the course of the disease, neuropathic changes will initially start distally and will later be followed by a more proximal affection, generally with symmetrical findings (Kimura, 2001; Hughes, 2002). Hence, bilateral test sites in both in the lower and upper extremities should preferably be defined, adding proximal sites to the frequently used ones at the foot and the hand (c.f. Yarnitsky and Sprecher, 1994; Hilz et al., 1999; Meier et al., 2001; Rolke et al., 2006; Lin et al., 2008). The lack of published reference data for these additional other test sites give particular importance to establishing new reference data for a wider set of test points.
4.3.1 Thermal percept ion thresholds
A general finding within all subjects was that WT was significantly higher compared to CT at all test sites. This is most likely explained by the smaller amount of warm sensitive nerve endings compared to the cold sensitive, and by the lower CV in C-fibers than in A-δ fibers (Schmidt, 1978; Guergova and Dufour, 2011). The CT and WT were significantly higher in the lower parts of the body compared to the upper, and likely to be related to a higher density of nerve terminals in the upper part of the body (Chang et al., 2004). Such differences in thresholds, with the foot having thresholds of greater magnitude than the hand, and the hand greater than the face, have also been verified earlier (Rolke et al., 2006; Magerl et al., 2010), as well as the foot having thresholds of greater magnitude than the hand (Meier et al., 2001; Lin et al., 2005). However, also the size of the cortical projection areas within the somatosensory cortex (c.f. the “cortical homunculus”) may contribute to theses differences between body sites, as the peripheral sensory resolution is considered to be related to the size of the primary projection area of a body part, with the hand and face being the most represented (Kandel et al., 2000).
There were no general systematic correlations found between the TPT and age, at the various tested sites in the present thesis. However a presumed systematic correlation between TPT and age were noted at several body regions within the lower part of the body. Highly significant correlations were found between age and CT and WT (schematic illustration, c.f. Figure 6 and B) at the DF. Significant correlations were also found between age CT and WT at the LL and the VT, and WT at

41
the RA, but with considerably smaller correlation coefficients. Previous studies have also reported significant relationships between TPT and age at different parts of the body (Jamal et al., 1985; Claus et al., 1987; Levy et al., 1989; Verdugo and Ochoa, 1992; Bartlett et al., 1998; Hilz et al., 1999; Meier et al., 2001; Lin et al., 2005; Rolke et al., 2006; Huang et al., 2010; Magerl et al., 2010), while others have not been able to describe such correlations (Yarnitsky and Sprecher, 1994; Kelly et al., 2005).
CT at the DF
0
2
4
6
8
10
12
0 10 20 30 40 50 60 70 80
Age (years)
Thr
esho
ld v
alue
ΔºC
subjects
Figure 6A. Cold perception thresholds (CT) within subjects (n=68) at the dorsum foot (DF).
Thus, essential high correlations were noted between TPT at the DF and age, corroborating findings in earlier reports (Hilz et al., 1999; Lin et al., 2005; Rolke et al., 2006; Huang et al., 2010), which may indicate a possible general age-dependent decrease in fiber density within the types of nerves conveying thermal sensory information. Most likely this is due to that the thermal perception at distal sites of the lower extremities decreases with increasing age. A decreased density of intra-epidermal nerve fibers with increasing age has been reported (Chang et al., 2004; Thomsen et al., 2009; Lauria et al., 2010), and also autonomic function decreases within elderly (Kimura, 2001).

42
WT at the DF
0
2
4
6
8
10
12
0 10 20 30 40 50 60 70 80
Age (years)
Thr
esho
ld v
alue
ΔºC
Subjects
Linjär(Subjects)
Figure 6B. Warm perception thresholds (WT) within subjects (n=68) at the dorsum foot (DF).
Furthermore, a recent review concluded that a decreased thermal sensitivity is present in elderly, warm perception in distal parts of the body being particularly more affected (Guergova and Dufour, 2011). However age has also by some been considered to be dependent on reaction time in MLI (Claus et al., 1987; Huang et al., 2010). But findings demonstrating high correlations between TPT and age in methods that not are dependant on reaction time have also been found (Bertelsmann et al., 1985; Bravenboer et al., 1992; De Neeling et al., 1994; Lin et al., 2005) further confirming that TPT are affected by age at distal parts of the body.
The suggested mean reference values at the different body regions are presented in Table 6. Thermal reference has previously been presented with respect to different age groups (Yarnitsky and Sprecher, 1994; Hilz et al., 1999; Meier et al., 2001; Lin et al., 2005), but Magerl et al., (2010) has instead suggested subdivision based on a calculation from overlapping decades. In the present work, no significant correlations were found between age and TPT in the upper part of the body, whereas this was found in most regions of the lower part of body. As discussed above several other authors have earlier demonstrated age-dependant

43
differences distally, in line with the present observations. Furthermore, elderly are also more likely to have increased frequency of sciatica (Decker and Shapiro, 1957; Kortelainen et al., 1972; Hsu et al., 1990) or other conditions that may affect the TPT. There are also technical issues to be considered when testing at the DF. For example, the whole stimulating surface of the probe may not be fully in contact with the tested skin-area, which may contribute to a smaller stimulated area, causing higher thresholds due to decreased spatial summation (Schmidt, 1978). Although this has been shown previously (Dyck et al., 1993b; Hilz et al., 1998b; Hilz et al., 1999), the magnitude of the probe pressure against the skin still doesn’t seem be a significant factor (Pavlaković et al., 2008).
Table 6. Mean values of cold (CT) and warm (WT) perception thresholds within subjects at the tested body regions; Dorsal foot (DF), Medial- (ML), Lateral (LL) aspect of the lower leg, ventral thigh (VT), thenar eminence (TE), radial- (RA), ulnar (UA) aspect of the lower arm, deltoid part of the upper arm (DA).
DF ML LL VT TE RA UA DA
CT 2.0 1.8 1.8 1.6 1.0 1.0 0.9 1.2
WT 4.6 4.1 5.1 2.8 1.4 2.1 2.1 3.3
Reference data from studies of MLI in large groups have only been presented in a few previous studies (Yarnitsky and Sprecher, 1994; Hilz et al., 1999; Lin et al., 2005; Meier et al., 2001; Blankenburg et al., 2010). However, only at the TE, the DF and the face were tested in these reports, in addition using different probe-sizes (9.0 and 12.5 cm2). The latter strategy was presumed by Rolke et al., (2006) to introduce a difference in TPT of at most 0.5°C between the probe sizes. Considering all these observations, the TPT findings at the DF and TE in the present thesis are taken to be in line with other earlier reports.

44
4.4 Early detection of thin fiber impairments in val30met ATTR patients (Paper III)
The main finding in paper III was generally highly significant increases in TPT in val30met ATTR patients, compared to age matched controls (c.f. Figure 7), except for WT at the ML in the older age group (Table 7). This was in spite of that only patients with very mild signs and symptoms of clinically manifest ATTR were evaluated; by only including patients with normal findings of EMG and NCS into the study.
In a review Benson (1991) suggested early signs of impaired thermal sense might be an early indication of a prevailing ATTR, and the results in paper III strongly corroborate this suggestion
Later, findings in patients with diabetes also demonstrated elevated TPT with the MLI before any abnormal NCS and EMG findings (Løseth et al., 2008). All these findings corroborate the observations by QST with the stepping algorithm in diabetic patients, which have shown early small nerve fiber are affectation, as 98% presented of the patients showed abnormal CT and 58% abnormal HPT, compared to 48% showing abnormal sural nerve amplitudes (Hendriksen et al., 1993).
The diagnostic value of QST in general have also been demonstrated in patients suffering from diabetes (Claus et al., 1987; Hilz et al., 1988; Levy et al., 1989; Hendriksen et al., 1993; Gelber et al., 1995; Abad et al., 2002; Krämer et al., 2004; Zinman et al., 2004; Ørstavik et al., 2006; Løseth et al., 2008), where an early diagnosis of the diabetic PNP is crucial to prevent further damage to the nerves (Hilz et al., 1988), or development of non healing foot ulcerations with ensuing amputation (Cornblath, 2004). QST with the MLI have been confirmed useful to demonstrate small fiber dysfunction after high alcohol abuse (Hilz et al., 1995b), in GBS (Pan et al., 2003; Martinez et al., 2010), sarcoidosis (Hoitsma e al., 2003), meralgia paraesthestetica (Schestatsky et al., 2009), in vibration syndrome (Ekenvall et al., 1986; Nilsson and Lindström, 2001), and in hereditary sensory and autonomic neuropathy, type V, demonstrating abnormal TPT but normal NCS (Minde et sl., 2004).
Based on all these observations, it is reasonable to conclude that bilateral QST in the upper and lower limbs should be performed at an early stage of the diagnostic procedure in suspected ATTR patients. This further emphasizes the importance of performing QST whenever a subject has

45
clinical symptoms of PNP and conventional electrophysiological examinations demonstrates normal results.
Although an early diagnosis of small fiber PNP is desirable for all patients, this is particularly crucial for ATTR patients, in order to prevent or at least minimize any ongoing large nerve fiber involvement, which together with liver and cardiac involvement presently is common at time of the diagnosis (Said, 2003). This is particularly the case, as in these patients a liver transplant may reduce the overall progress development in a majority of patients, when surgery is done early in the disease (Holmgren et al., 1993; Tashima et al., 1999; Suhr, 2003; Suhr et al., 2005; Okamoto et al., 2009). Patients having only a small fiber PNP also have a better prognosis after such a liver transplant (Okamoto et al., 2009), again emphasizing the importance of using valid methods to assess the early small fiber neuropathic changes. Finally, the recent development of pharmaceutical strategies for early interventions (Richardson and Cody, 2009; Ando, 2011), even further strengthen the need for an early diagnosis of the ATTR disease.
Table 7. P-values between controls and val30met ATTR patients.
< 45 YRS
CT WT
≥ 45 YRS
CT WT
DF <0.0001 <0.0001 0.0094 0.0125
ML <0.0001 <0.0001 <0.0001 0.0642
LL 0.0017 0.0243 0.0069 0.0114
VT <0.0001 <0.0001 0.0014 0.0050
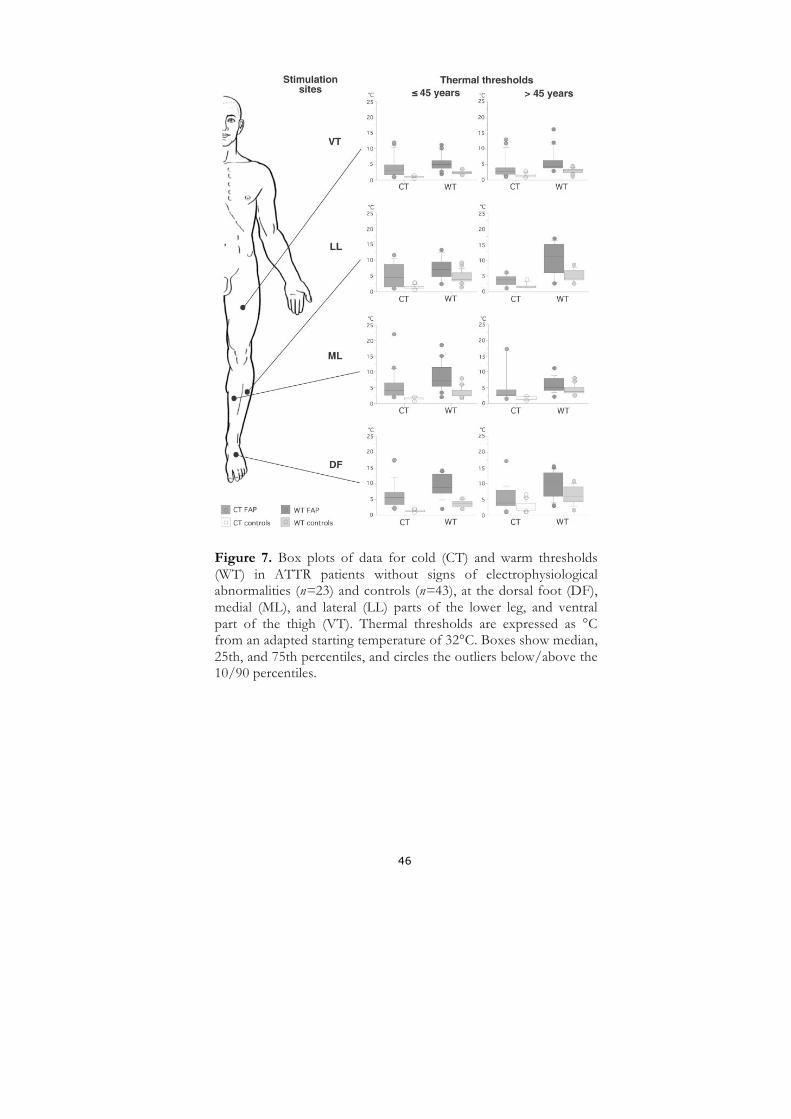
46
Figure 7. Box plots of data for cold (CT) and warm thresholds (WT) in ATTR patients without signs of electrophysiological abnormalities (n=23) and controls (n=43), at the dorsal foot (DF), medial (ML), and lateral (LL) parts of the lower leg, and ventral part of the thigh (VT). Thermal thresholds are expressed as °C from an adapted starting temperature of 32°C. Boxes show median, 25th, and 75th percentiles, and circles the outliers below/above the 10/90 percentiles.

47
4.5 Combined HRV and QST evaluation in early and late onset ATTR (Paper IV)
In paper IV, a combined comparison between HRV and QST in a strictly defined group of ATTR patients was done in Swedish patients with a Val30Met mutation. The patients were further divided according to early or late onset of the disease, since differences in phenotypes between time for onset are well known (Ikeda et al., 1987; Holmgren et al., 1994; Koike et al., 2002; Sobue et al., 2003; Sousa et al., 2003; Ando et al., 2005; Bittencourt et al., 2005; Conceição and de Carvalho, 2007; Richardson and Cody, 2009; Saporta et al., 2009; Kawaji et al., 2010; Hörnsten et al., 2010).
The main finding in all ATTR patients was that there was no general and straightforward correlation between pathological findings in the QST and the HRV analyses. However, the early onset patients presented more elevated TPT compared to late onset patients, and there was also a possible relationship between QST and HRV among the late onset patients.
Table 8. Cross-tabulation of normal and pathological findings at analyses of heart rate variability (HRV) and quantitative sensory testing (QST) in ATTR patients, separated in early (< 50 years, n=13) and late (≥ 50 years, n=15) onset cases.
Normal HRV
Pathological HRV
SUM
Early onset
Normal QST 1 0 1 Pathological QST 7 5 12 SUM 8 5 12 Late onset
Normal QST Pathological QST
4 7
0 4
4 11
SUM 11 4 15
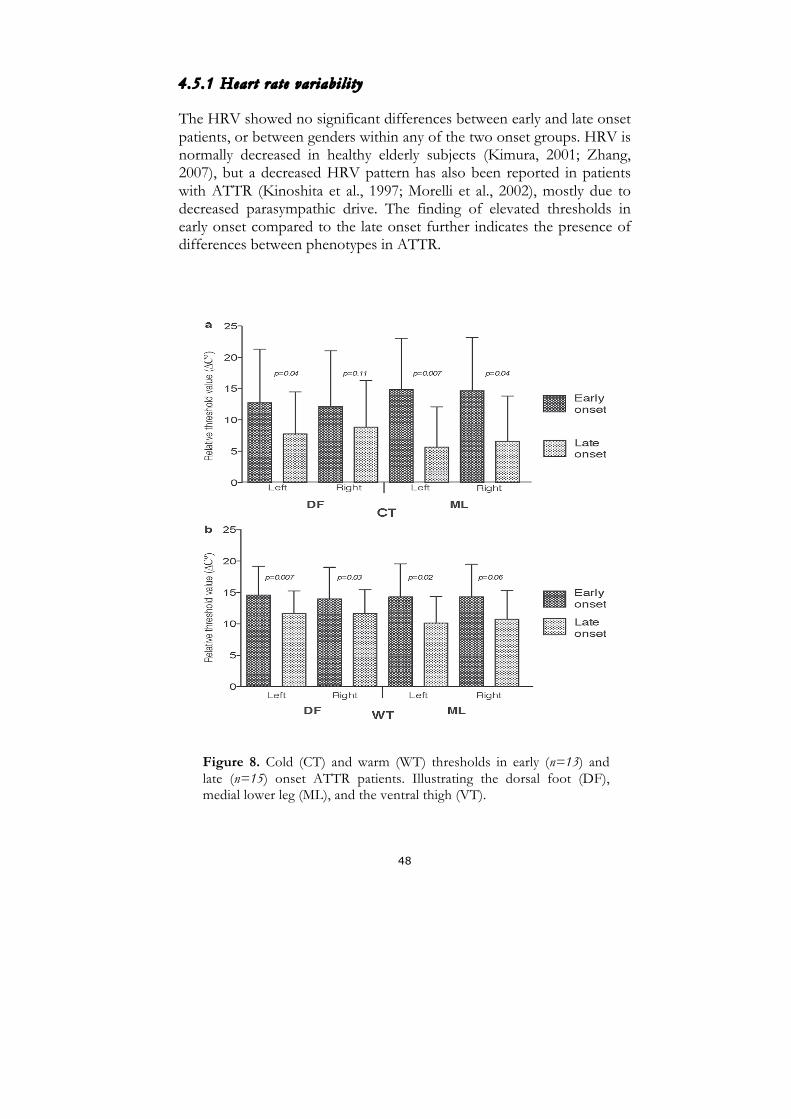
48
4.5.1 Heart rate var iabi l i ty
The HRV showed no significant differences between early and late onset patients, or between genders within any of the two onset groups. HRV is normally decreased in healthy elderly subjects (Kimura, 2001; Zhang, 2007), but a decreased HRV pattern has also been reported in patients with ATTR (Kinoshita et al., 1997; Morelli et al., 2002), mostly due to decreased parasympathic drive. The finding of elevated thresholds in early onset compared to the late onset further indicates the presence of differences between phenotypes in ATTR.
Figure 8. Cold (CT) and warm (WT) thresholds in early (n=13) and late (n=15) onset ATTR patients. Illustrating the dorsal foot (DF), medial lower leg (ML), and the ventral thigh (VT).

49
4.5.2 Early onset ATTR patients
In this selected group of patients, abnormally increased QST was found in twelve out of 15 patients (92%), compared to five out of 15 having an abnormal HRV (c.f. Table 8). Furthermore, the TPT were more elevated in this group compared to the late onset patients (c.f. Figure 8). This may be related to causes such as a more severe affection by the disease, a more selective involvement of thin peripheral somatic nerve fibers within the early onset compared to late onset group, or a more rapid disease progress, perhaps related to the variations found in amyloid fibril configuration between early and late onset ATTR patients (Ihse et al., 2008; Koike et al., 2009). However, as the inclusion criteria limited the number of subjects, only a selected group of patients were evaluated, and this can only be an assumption, but previous studies have also shown a predominant loss of small nerve fiber in early onset patients (Soube et al., 2003; Koike et al., 2004), which may confirm the findings in the present thesis.
Significant differences between early and late onset QST findings were found for CT at the left DF, bilaterally at the ML, as well as for WT bilaterally at the DF and at the left ML. For WT at the left VT a significant difference was also found between onset groups. Two of the patients with early onset did not display detectable sural nerve amplitude (SNA). The median amplitude was 6.0 µV (both side), indicating that the larger nerve fibers were in most cases fairly well preserved. Between SNA and HRV, or between SNA and TPT, no significant correlations were found. In general, no significant correlations were noted between TPT and HRV, except for WT at the right VT and PLF(sup).
4.5.3 Late onset ATTR patients
The main observation in late onset patients was a possible relationship between HRV and QST. Qualitatively, this was mostly seen between QST and HRV estimates of PLF (c.f. an example in Figure 9), compared to estimates of PHF, this is perhaps related to the mixture of sympathetic and parasympathetic responses in the low frequency component (Kinoshita el al., 1997; Wiklund et al., 2010; Hörnsten et al., 2010), and in turn caused by that both types of thin nerve fibers are involved, thereby contributing to this possible relationship between QST and HRV.

50
As shown in Table 8, eleven of the late onset patients (73%) presented abnormal QST findings, whereas four out of 13 showed abnormal HRV. Two patients did not demonstrate PNP as the first clinical sign at onset of the disease (Table 5). However, they had abnormal increased WT at the DF and the ML, but normal HRV and CT at all tested sites. Analysis of SNA demonstrated that three patients did not show any detectable compound sensory nerve action potential of the sural nerve at all, and the median SNA was 4.0 respective 3.0 µV (left/right side).
No significant correlations were noted among late onset patients between SNA and HRV findings. However, significant correlations were observed between QST and SNA, and between QST and HRV. Between QST and SNA, significant correlations were found for WT at the left DF, and the left ML, and a good (but narrow significant) correlation was noted for CT bilaterally at the DF and for WT at the right DF. Similar finding have previously been demonstrated in patients with diabetes (Zinman et al., 2004), with a significant correlation between the sural nerve amplitude and for CT at the DF.
Correlation between HRV (LFsup) and QST (CT at the right DF)
0
5
10
15
20
25
0,00 0,50 1,00 1,50 2,00 2,50 3,00 3,50
Frequency (Hz)
Thr
esho
lds Δ
ºC
late onset (n=15)
Figure 9. Scatter plot showing the correlation between HRV (LFsup) and QST (CT at the right DF (r=-0.68, p=0.005).

51
Attempts trying to correlate QST with estimates of autonomic dysfunction have been done previously (Hilz et al., 1998; Bleustein et al., 2002; Pan et al., 2003), but not for the ATTR patients. These previous reports demonstrated a possible relation between somatic and autonomic nerve fibers, which was also seen in late onset ATTR patients in the present thesis. Further, elevated TPT have been demonstrated in GBS (Redmond et al., 1990; Martinez et al., 2010), also showing affection of different types of small nerve fibers simultaneously. Redmond et al. (1990) showed that abnormal cold thresholds were seen in 66 percent versus 38 percent for warm thresholds in patients with GBS – and interestingly the one patient requiring respiratory treatment within 48 presented the most severe abnormality.
Recently Kim et al. (2009) reported a prominent somatic and autonomic small fiber dysfunction in ATTR patients. However, their study protocol was different compared to the present work, in that they included patients with all genetic mutations, only performed at QST at the DF, and used different tests of autonomic dysfunction. In addition, the median SNA in the study was 0 µV, and the patients also had longer disease duration, indicating a more severe affection by the ATTR.
The conclusion from paper IV is that early onset patients showed more elevated TPT compared to patients with late onset, and also that theirs thin nerve fibers seemed to be more severely affected. However, such an interpretation has to be made with caution, due to the small number of patients that could be included into the study. In Figure 10, early and late onset patients are compared to age matched QST data at the DF, which further demonstrate the importance of performing QST in ATTR patients.
The present work further underlines the importance of early vs. late onset ages in ATTR patients. These differences probably relate to the length in TTR fibril components (Ihse et al., 2008; Koike et al., 2009). Other causes such as polymorphisms have also been suggested to influence onset in ATTR (Dardiotis et al., 2009). Earlier it has been demonstrated that Swedish late onset patients are more likely to develop cardiomyopathy than early onset patients, possibly due to that the amyloid deposit have different pathways in the heart muscle tissue (Suhr et al., 2006), and this may also apply for the peripheral nerves.

52
Age matched data (≥ 50 yrs) at the DF
0
5
10
15
20
25
1
CT and WT
Thr
esho
lds
valu
e Δ
ºC
CT at the DF in ControlsCT at the DF in Late onsetWT at the DF in ControlWT at the DF in Late onset
Age matched data (< 50 years) at the DF
0
5
10
15
20
25
1
CT and WT
Thr
esho
lds
valu
e Δ
ºC
CT at the DF in Controls
CT at the DF in Early onset
WT at the DF in Controls
WT at the DF in Early onset
Figure 10. CT and WT at the right DF in early (< 50 years) and late (≥ 50
years) onset ATTR patients, compared to age-matched controls, showing mean thresholds and standard deviation.
53
5. Future perspectives Clearly there seem to be other factors operating beside the TTR mutation in the ATTR disease (Dardiotis et al., 2009; Olsson et al., 2009; Olsson et al., 2010). This underlined by the differences in phenotype with regard to onset age, penetrance and rate of progress of the disease (Ikeda et al., 1987; Holmgren et al., 1994; Koike et al., 2002; Sobue et al., 2003; Sousa et al., 2003; Ando et al., 2005; Bittencourt et al., 2005; Conceição and de Carvalho, 2007; Richardson and Cody, 2009; Saporta et al., 2009; Hörnsten et al., 2010; Kawaji et al., 2010). In my opinion, the disease may start even before any amyloid deposits can be demonstrated by biopsy, since cytotoxic substances may interact with the cells (Sousa et al., 2001; Sousa and Saraiva, 2003; Hou et al., 2007). In this scenario it might be even more crucial for methods enhancing early neuropathic changes. Elevated TPT might indicate an incipient sign of developing disease before amyloid deposits can be demonstrated in biopsy, but further research in this particular topic has to be done…

54
6. Concluding remarks
• Repeated testing within the same day, and between days, showed that the MLI offers a reliable method for clinical QST; albeit cold and warm thermal testing must be performed prior any testing of cold or heat pain assessment as significant increase in response variability occurred after pain threshold assessments.
• Significantly elevated TPT was found in Swedish ATTR patients having a Val30Met mutation but normal EMG and NCS findings. Hence, early QST is favoured in the clinical evaluation of suspected small fiber PNP in these patients.
• A-δ- and C-fibers seem more severely affected in early onset Swedish ATTR patients compared to late onset, as early onset patients demonstrated more elevated TPT thresholds than late onset. As the former may often be more rapidly progressing this further emphasizes the importance of performing early QST in ATTR patients, particularly in younger patients.
• Combined QST and HRV are recommended in the evaluation of ATTR patients, as there are different phenotypes in which both thin somatic and autonomic nerves may be affected simultaneously but with varying dominance.
• The findings indicate a putative relationship between impaired TPT and HRV estimates in late onset patients.
• CT and WT reference data for specific body regions for is crucial for QST with the MLI.
• No straightforward relationship was found between TPT and age or height in normal subjects, but TPT highly correlated with age at the DF - suggesting a decreased thermal perception distally in elderly.
• QST must be performed bilaterally in both the lower and upper extremities, and at both distal and proximal sites during an evaluation of a presumed PNP, in order to provide an adequate description of the distribution of the thermal impairment.

55
Acknowledgements
I wish to express my sincere gratitude to co-authors, colleagues, friends and family, which have supported me during these past years, especially during the last couple of months when I finally finished writing this Ph.D. thesis.
My supervisor Associate Professor Erik Nordh, Md, PhD, you introduced me in the area of “QST and FAP“ at the beginning, today more than ten years ago. All your scientific guidance and encouragement between “clinic work” and “research work” during all this time has been well appreciated.
My co-supervisor Associate Professor Ole Suhr, MD, PhD, thanks’ for your expertise and experience about the FAP disease. All your straightforward comments have been gratefully appreciated.
Marianne Spångberg, for always believing that “I would get through with this”.
All my colleagues and friends at the Department of Clinical Neurophysiology: you have all been supportive in so many different ways. Our laughs during coffee breaks and lunches, as well as other nice events have made things easier. Especially Anna, Emma, Inger, Karin, Katarina and Kristina – A big hug to all of you pretty girls! Thank you for all your encouraging words – these are worth more than I could ever say – but anyway “grates tantum”.
A special thank to Hans-Erik Lundgren and Christina Frykholm, at the FAP-team in Umeå.
All my dear friends, some of you mentioned here (others are not forgotten).
Lena, you’re one of my “oldest” and dearest friends. There are so many good things to say about you, and we have shared so much during all these years. And it’s comforting knowing that all the miles between us today doesn’t matter, because I know that I can always count on you - a BIG hug to you!

56
Petra and Stig, for always listening when I needed to talk, and supporting me in so many other ways. Sometimes THANKS is a little word to say, but anyway – “gratias” – I hope both of you really understand what I’m trying to say.
Madde – my twin-soul. We will always have London, Mexico, Paris, Tromsö, and “Van Gogh” (won’t we J).
Lilja, more than fifteen years ago I met someone special when I started playing floor ball with the team “Överboda” and it was you - I met a dear and close friend for a lifetime.
Peter and Linda, my dear neighbours. I am glad that you live next door, and as an extra bonus - your son Noel and my daughter Linn have become such good playmates.
Finally – all of you from the time when I worked at FOI J.
Special THANKS to my lovely family:
My mother Gudrun and her husband Janne, and my siblings, Åsa and Lars-Eric with families. You have been there for me, in good times and bad times, comforting and supporting me, and always given me help whenever I needed it - I love you all very much!
Anders, Omnia vincit amor, your love and encouragement during these past two years have meant a lot to me. I am truly, genuinely happy that we met on the stairways at Rex in August 2009. A big hug and kiss to you and your children: Sebastian, Ida and Alva.
But mostly, my beloved daughter ♥ Linn ♥, who gives me love, happiness, inspiration and joy every single day! Your lovely smile J makes my heart smile. Your wonderful laugh is like music in my ears - My love for you is endlessly! One day I hope you will understand what I was doing all these “days, evenings and nights”...
... my father Staffan (in memoriam).

57
References Abad F, Diaz-Gómez M, Rodriguerzt I, Pérezt R, Delgado JA. 2002. Subclinical pain
and thermal sensory dysfunction in children and adolescents with Type 1 diabetes mellitus. Diabet Med 19:827-831.
Adams D. 2001. Hereditary and acquired amyloid neuropathies. J Neurol 248:647-657.
Adams D, Samuel D, Goulon-Goeau C, Nakazato M, Costa PM, Feray C, et al. 2000. The course and prognostic factors of familial amyloid polyneuropathy after liver transplantation. Brain 123:1495-1504.
Agostinho CM, Scherens A, Richter H, Schaub C, Rolke R, Treede RD, et al. 2009. Habituation and short-term repeatability of thermal testing in healthy human subjects and patients with chronic non-neuropathic pain. Eur J Pain 13:779-785.
Aminoff MJ. Electromyography in clinical practice. 1998 . Churchill Livingstone, USA.
Ando Y. 2011. Therapy of ATTR amyloidosis. Amyloid (18) Suppl 1:177-179.
Ando Y, Nakamura M, Araki S. 2005. Transthyrestin-related familial amyloidotic polyneuropathy. Arch Neurol 62:1057-1062.
Ando Y, Suhr O. 1998. Autonomic dysfunction in familial amyloidotic polyneuropathy (FAP). Amyloid 5:288–300.
Andrade C. 1952. A peculiar form of peripheral neuropathy familiar atypical generalized amyloidosis with special involvement of the peripheral nerves. Brain 75:408-427
Bartlett G, Stewart JD, Tamblyn R, Abrahamowicz M. 1998. Normal distributions of thermal and vibration sensory thresholds. Muscle Nerve 21:367-374.
Becser N, Sand T, Zwart J-A. 1998. Reliability of cephatic thermal thresholds in healthy subjects. Cephalalgia 18:574-582.
Benseny-Cases N, Cócera M, Cladera J. 2007. Conversion of non-fibrillar beta-sheet oligomers into amyloid fibrils in Alzheimer's disease amyloid peptide aggregation. Biochem Biophys Res Commun 361(4):916-921.
Benson MD. 1991. Inherited Amyloidosis. J Med Genet 28:73-78.
Benson M.D. and Kincaid J.C. 2007. The molecular biology and clinical features of amyloid neuropathy. Muscle Nerve 36(4):411-423.
Bertelsmann FW, Heimans JJ, Weber EJ, van der Veen EA, Schouten JA. 1985. Thermal discrimination thresholds in normal subjects and in patients with diabetic neuropathy. J Neurol Neurosurg Psychiatry 48(7):686-690.
Binnie C, Cooper R, Mauguière F, Osselton J, Prior P, Tedman B. 2004. Clinical Neurophysiology. Volyme 1 (Revised and enlarged edition). EMG, nerve conduction and evoked potentials. Elsevier B.V. Amsterdam, the Netherlands.
Bittencourt PL, Couto CA, Clemente C, Farias AQ, Palácios SA, Mies S, et al. 2005. Phenotypic expression of familial amyloid polyneuropathy in Brazil. Eur J Neurol (4):289-293.

58
Bland JM, Altman DG. 1986. Statistical methods for assessing agreement between two methods of clinical measurement. Lancet 1(8476):307–311.
Bland M. An introduction to medical statistics. 1997. New York: Oxford University.
Blankenburg M, Boekens H, Hechler T, Maier C, Krumova E, Scherens A, et al. 2010. Reference values for quantitative sensory testing in children and adolescents: developmental and gender differences of somatosensory perception. Pain 149(1):76-88.
Bleustein CB, Arezzo JC, Eckholdt H, Melman A. 2002. The neuropathy of erectile dysfunction. International Journal of Impotence Research 14:433-439.
Blom S, Steen L, Zetterlund B. 1981. Familial amyloidosis with polyneuropathy - type 1. A Neurophysiologicalal study of peripheral nerve function. Acta Neurol Scand 63(2):99-110.
Bonaïti B, Alarcon F, Bonaïti-Pellié C, Planté-Bordeneuve V. 2009. Parent-of-origin effect in transthyretin related amyloid polyneuropathy. Amyloid 16(3):149-150.
Bravenboer B, van Dam PS, Hop J, Erkelens DW. 1992. Thermal threshold testing for the assessment of thin fibre dysfunction: normal values and reproducibility. Diabet Med 9:546-549.
Carpenter RHS. Neurophysiology. 1990. London, Great Britain.
Chang YC, Lin WM, Hsieh ST. 2004. Effects of aging on human skin innervation. Neuroreport 15(1):149-153.
Chong PST, Cros PD. 2004. Technology literature review: quantitative sensory testing. Muscle Nerve 29:734-747.
Claus D, Hilz MJ, Hummer I, Neundörfer B. 1987. Methods of measurements of thermal thresholds. Acta Neurol Scand 76:288-296.
Claus D, Hilz MJ, Neundörfer B. 1990. Thermal discrim5ination thresholds: a comparison of different methods. Acta Neurol Scand 81(6):533-40.
Coimbra A, Andrade C. 1971. Familial amyloid polyneuropathy: an electron microscope study of peripheral nerve in five cases. II. Nerve fibril changes. Brain 94:207-212.
Colton CA, Chernyshev ON, Gilbert DL. 2000. Vitek MP. Microglial contribution to oxidative stress in Alzheimer's disease. Ann N Y Acad Sci 899:292-307.
Conceicão I, de Carvalho M. 2007. Clinical variability in type I familial amyloid polyneuropathy (val30met): comparison between late- and early onset cases in Portugal. Muscle Nerve 35(1):116-118.
Connors LH, Lim A, Prokaeva T, Roskens VA, Costello CE. 2003. Tabulation of human transthyretin (TTR) variants. Amyloid 10(3):160-184.
Connors LH, Richardson AM, Théberge R, Costello CE. 2000. Tabulation of transthyretin (TTR) variants as of 1/1/2000. Amyloid 7(1):54-69.
Cornblath DR. 2004. Diabetic neuropathy: diagnostic methods. Adv Stud Med 4:650-661.

59
Dardiotis E, Koutsou P, Zamba-Papanicolaou E, Vonta I, Hadjivassiliou M, Hadjigeorgiou G, et al. 2009. Complement C1Q polymorphisms modulate onset in familial amyloidotic polyneuropathy TTR Val30Met. J Neurol Sci 284(1-2):158-162.
Defrin R, Shachal-Shiffer M, Hadgadg M, Peretz C. 2006. Quantitative somatosensory testing of warm and heat-pain thresholds: the effect of body region and testing method. Clin J Pain 22(2):130-136.
Decker HG, Shapiro SW. 1957. Herniated lumbar intervertebral discs, results of surgical treatment without the routine use of spinal fusion. Arch Surg 75:77-84.
De Neeling JN, Beks PJ, Bertelsmann FW, Heine RJ, Bouter LM. 1994. Sensory thresholds in older adults: reproducibility and reference values. Muscle Nerve 17(4):454-461.
Drory VE, Korczyn AD. 1993. Sympathetic skin response: age effect. Neurology 43(9):1818-1820.
Dyck PJ, O'Brien PC, Kosanke JL, Gillen DA, Karnes JL 1993a. A 4, 2, and 1 stepping algorithm for quick and accurate estimation of cutaneous sensation threshold. Neurology 43(8):1508-1512.
Dyck PJ, Zimmerman IR, Gillen DA, Johnson D, Karnes JL, O'Brien PC. 1993b. Cool, warm, and heat-pain detection thresholds: testing methods and inferences about anatomic distribution of receptors. Neurology 43(8):1500-1508.
Dyck PJ, Zimmerman IR, O'Brien PC, Ness A, Caskey PE, Karnes J, et al. 1978. Introduction of automated systems to evaluate touch-pressure, vibration, and thermal cutaneous sensation in man. Ann Neurol (6):502-510.
Ekenvall L, Nilsson BY, Gustavsson P. 1986. Temperature and vibration thresholds in vibration syndrome. Br J Ind Med 43(12):825-829.
Elie B, Guiheneuc P. 1990. Sympathetic skin responses: normal results in different experimental conditions. Electroencephalography and Clinical Neurophysiol 76:258-267.
Ericzon BG, Suhr O, Broomé U, Holmgren G, Duraj F, Eleborg L, et al. 1995. Liver transplantation halts the progress of familial amyloidotic polyneuropathy. Transplant Proc 27(1):1233.
Eriksson P, Karp K, Bjerle P, Olofsson BO. 1984. Disturbances of cardiac rhythm and conduction in familial amyloidosis with polyneuropathy. Br Heart J 51(6):658-662.
Fillingim RB, Maddux V, Shackelford J. 1999. Sex differences in heat pain thresholds as a function of assessment method and rate of rise. Somatosens Mot Res 16:57–62.
Fruhstorfer H, Lindblom U, Schmidt WC. 1976. Method for quantitative estimation of thermal thresholds in patients. J Neurol Neurosurg Psychiatry 39:1071-1075.
Gandevia SC, Hales JP. 1997. The methodology and scope of human microneurography. J Neurosci Methods 74:123-136.

60
Geber C, Klein T, Azad S, Birklein F, GierthmUhlen J, Huge V, et al. 2011. Test-retest and interobserver reliability of quantitative sensory testing according to the protocol of the German Research Network on Neuropathic Pain (DFNS): a multi-centre study. Pain 152(3):548-556.
Gelber DA, Pfeifer MA, Broadstone VL, Munster EW, Peterson M, Arezzo JC, et al. 1995. Components of variance for vibratory and thermal thresholds testing in normal and diabetic subjects. J Diabetes Complications 9:170-176.
Grudzielanek S, Velkova A, Shukla A, Smirnovas V, Tatarek-Nossol M, Rehage H, et al. 2007. Cytotoxicity of insulin within its self-assembly and amyloidogenic pathways. J Mol Biol. 370(2):372-384.
Gruener G, Dyck PJ. 1994. Quantitative sensory testing: methodology, applications, and future directions. J Clin Neurophysiol 11:568-583.
Guergova S, Dufour A. 2011. Thermal sensitivity in the elderly: a review. Ageing Res Rev 10(1):80-92.
Gutrecht JA. 1994. Sympathetic skin response. J Clin Neurophysiol 11(5):519-524.
Hagander LG, Midani HA, Kuskowski MA, Parry GJ. 2000. Quantitative sensory testing: effect of region and skin temperature on thermal thresholds. Clin Neurophysiol. 111(1):17-22.
Halliday AM, Butler SR, Paul R. 1987. A textbook of clinical neurophysiology. John Wiley & Sons Ltd. Printed and bound in Great Britain.
Hanson P, Backonja M, Bouhassira D. 2007. Usefulness and limitations of quantitative sensory testing: Clinical and research applications in neuropathic pain states. Pain 129:256-259.
Harding LM, Loescher AR. 2005. Adaptation to warming but not cooling at slow rates of stimulus change in thermal threshold measurements. Somatosens Mot Res 22(1-2):45-48.
Hattori T, Takei Y, Koyama J, Nakazato M, Ikeda S. 2003. Clinical and pathological studies of cardiac amyloidosis in transthyretin type familial amyloid polyneuropathy. Amyloid 10(4):229-239.
Hellman U, Alarcon F, Lundgren HE, Suhr OB, Bonaiti-Pellié C, Planté-Bordeneuve V. 2008. Heterogeneity of penetrance in familial amyloid polyneuropathy, ATTR Val30Met, in the Swedish population. Amyloid 15(3):181-186.
Hendriksen PH, Oey PL, Wieneke GH, Bravenboer B, van Huffelen AC. 1993. Subclinical diabetic polyneuropathy: early detection of involvement of different nerve fibre types. J Neurol Neurosurg Psychiatry 56:509-514.
Hilz MJ, Claus D, Neundörfer B. 1988. Early diagnosis of diabetic small fiber neuropathy by disturbed cold perception. J Diabetic Complications 1:38-43.
Hilz MJ, Glorius S, Berić A. 1995a. Thermal perception thresholds: influence of determination paradigm and reference temperature. J Neurol Sci 129:135-140.

61
Hilz MJ, Kolodny EH, Neuner I, Stemper B and Axelrod FB. 1998a. Highly abnormal thermotests in familial dysautonomia suggest increased cardiac autonomic risk. J Neurol Neurosurg Phychiatry 65:338-343.
Hilz MJ, Stamper B, Axelrod FB, Kolodny EH, Neundörfer B. 1999. Quantitative thermal perception testing in adults. J Clin Neurophysiol 16:462-471.
Hilz MJ, Zimmermann P, Claus D, Neundörfer B. 1995b. Thermal thresholds determination in alcoholic polyneuropathy: an improvement of diagnosis. Acta Neurol Scan 91:389-393.
Hilz MJ, Stemper B, Schweibold G, Neuner I, Grahmann F, Kolodny EH. 1998b. Quantitative thermal perception testing in 225 children and juveniles. J Clin Neurophysiol 15(6):529-534.
Hoitsma E, Drent M, Verstraete E, Faber CG, Troost J, Spaans F, Reulen JPH. 2003. Abnormal warm and cold sesation thresholds suggestive of small-fibre neuropathy in sarcoidosis. Clin Neurophysiol 114:2326-2333.
Holmgren G, Costa PM, Andersson C, Asplund K, Steen L, Beckman L, et al. 1994. Geographical distribution of TTR met30 carriers in northern Sweden: discrepancy between carrier frequency and prevalence rate. J Med Genet 31(5):351-4.
Holmgren G, Ericzon BG, Groth CG, Steen L, Suhr OB, Andersen O, et al. 1993. Clinical improvement and amyloid regression after liver transpolantation in hereditary transthyretin amyloidosis. Lancet 341:1113-1116.
Holmgren G, Steen L, Ekstedt J, Groth CG, Ericzon BG, Eriksson S, et al. 1991. Biochemical effect of liver transplantation in two Swedish patients with familial amyloidotic polyneuropathy (FAP-met30). Clin Genet 40(3):242-246.
Hou X, Aguillar MI, Thin DH. 2007. Transthyretin and familial amyloidotic polyneuropathy. Recent progress in understanding the molecular mechanisms of neurodegeneration. FEBS J 274:1637-1650.
Hsu K, Zucherman J, Shea W, Kaiser J, White A, Schofferman J, Amelon C. 1990. High lumbar disc degeneration. Incidence and etiology. Spine 15(7):679-682.
Huang HW, Wang WC, Lin CC. 2010. Influence of age on thermal thresholds, thermal pain thresholds, and reaction time. J Clin Neurosci (6):722-726.
Hughes RA. 2002. Peripheral neuropathy. 324(7335):466-469.
Hund E, Linke RP, Willig F, Grau A. 2001. Transthyretin-associated neuropathic amyloidosis. Pathogenesis and treatment. Neurology 56(4):431-435.
Hörnsten R, Pennlert J, Wiklund U, Lindqvist P, Jensen SM, Suhr OB. 2010. Heart complications in familial transthyretin amyloidosis: impact of age and gender. Amyloid 17(2):63-68.
Ihse E, Ybo A, Suhr OB, Lindqvist P, Backman C, Westermark P. 2008. Amyloid fibril composition is related to the phenotype of hereditary thransthyretin V30M amyloidosis. Journal of Pathology 216(2):253-261.
62
Ikeda S, Hanyu N, Hongo M, Yoshioka J, Oguchi H, Yanagisawa N, et al. 1987. Hereditary generalized amyloidosis with polyneuropathy. Clinicopathological study of 65 Japanese patients. Brain 110 ( Pt 2):315-337.
Jamal GA, Weir AI, Hansen S, Ballantyne JP. 1985. An improved automated method for the measurement of thermal thresholds. 2. Patients with peripheral neuropathy. J Neurol Neurosurg Psychiatry 48:361-366.
Jonsén E, Suhr OB, Tashima K, Athlin E. 2001. Early liver transplantation is essential for familial amyloidotic polyneuropathy patients' quality of life. Amyloid 8(1):52-57.
Kandel ER, Schwartz JH, Jessell TM. 2000. Principles of Neural Science. United States of America: McGraw-Hill Companies Ink.
Kawaji T, Ando Y, Ando E, Sandgren O, Suhr OB, Tanihara H. 2010. Transthyretin-related vitreous amyloidosis in different endemic areas. Amyloid 17(3-4):105-108.
Kelly KG, Cook T, Backonja MM. 2005. Pain ratings at the thresholds are necessary for interpretation of quantitative sensory testing. Muscle Nerve 32:179-184.
Kim DH, Zeldenrust SR, Low PA, Dyck PJ. 2009. Quantitative sensation and autonomic test abnormalities in transthyretin amyloidosis polyneuropathy. Muscle Nerve (3):363-370.
Kimura J. Electrodiagnostics in diseases of nerve and muscle: principles and practice. 2001. New York: Oxford University Press.
Kinoshita O, Hongo M, Saikawa Y, Katsuyama T, Tanaka M, Takeda M, et al. 1997. Heart rate variability in patients with Familial Amyloid Polyneuropathy. Paceing Clin Electrophysiol 20(12 Pt 1):2949-2953.
Koike H, Ando Y, Ueda M, Kawagashira Y, Iijima M, Fujitake J, et al. 2009. Distinct characteristics of amyloid deposits in early- and late onset transthyretin Val30Met familial amyloid polyneuropathy. Journal of Neurol Sci 287:178-184.
Koike H, Misu K, Ikeda S, Ando Y, Nakazato M, Ando E, et al. 2002. Study Group for Hereditary. Neuropathy in Japan. Type I (transthyretin Met30) familial amyloid polyneuropathy in Japan: early- vs. late-onset form. Arch Neurol 59:1771–1776.
Koike H, Misu K, Sugiura M, Iijima M, Mori K, Yamamoto M, et al. 2004. Pathology of early- vs late-onset TTR Met30 familial amyloid polyneuropat. Neurology 13;63(1):129-138.
Kortelainen P, Puranen J, Koivisto E, Lahde S. 1985. Symptoms and signs of sciatica and their relation to the localization of the lumbar disc herniation. Spine 10:88-92.
Krämer H.H, Rolke R, Bickel A, Birklein F. 2004. Thermal thresholds predict painfulness of Diabetic neuropathies. Diabetes Care 27:2386-2391.
Lauria G. 2005. Small fiber neuropathies. Curr Opin Neurol 18(5):591-597.

63
Lauria G, Bakkers M, Schmitz C, Lombardi R, Penza P, Devigili G, et al. 2010. Intraepidermal nerve fiber density at the distal leg: a worldwide normative reference study. J Peripher Nerv Syst 15(3):202-207.
Levy D, Abraham R, Reid G. 1989. A comparison of two methods for measuring thermal thresholds in diabetic neuropathy. J Neurol Neurosurg Psychiatry 52(9):1072-1077.
Lin HJ, Chiu HC, Tchen PH, Fu CC. 1990. Cutaneous thermal thresholds in normal subjects and diabetic patients without symptoms of peripheral neuropathy. J Formos Med Assoc 89(10):857-862.
Lin YH, Hsieh SC, Chao CC, Chang YC, Hsieh ST. 2005. Influence of aging on thermal and vibratory thresholds of quantitative sensory testing. J Peripheral Nerv Syst 10:269-281.
Liveson and Spielholz. Peripheral neurology. 1980. Case studies in electrodiagnosis. USA.
Lowenstein L, Jesse K, Kenton K. 2008. Comparison of perception threshold testing and thermal-vibratory testing. Muscle Nerve 37:514-517.
Løseth S, Ståhlberg E, Jorde R, Mellgren SI. 2008. Early diabetic Neuropathy: thermal thresholds and intraepidermal nerve fiber density in patients with normal nerve conduction velocity. J Neurol 255:1197-1202.
Magerl W, Krumova EK, Baron R, Tölle T, Treede RD, Maier C. 2010. Reference data for quantitative sensory testing (QST): refined stratification for age and a novel method for statistical comparison of group data. Pain 151(3):598-605.
Mano T, Iwase S, Toma S. 2006. Microneurography as a tool in clinical neurophysiology to investigate peripheral neural traffic in humans. Clin Neurophysiol 117(11):2357-2384.
Martinez V, Fletcher D, Martin F, Orlikowski D, Sharshar T, Chauvin M. 2010. Small fiber impairments predicts neuropathic pain in Guillain-Barré syndrome. Pain 151:53-60.
Meier P, Berde C, Di Canzio J, Zurakowski D, Sethna N. 2001. Quantitative assessment of cutaneous thermal and vibration sensation and thermal pain detection thresholds in healthy children and adolescents. Muscle Nerve 24:1339-1345.
Minde J, Toolanen G, Andersson T, Nennesmo I, Remahl IN, Svensson O, Solders G. 2004. Familial insensitivity to pain (HSAN V) and a mutation in the NGFB gene. A Neurophysiologicalal and pathological study. Muscle Nerve 30(6):752-760.
Misumi Y, Ando Y, Ueda M, Obayashi K, Jono H, Su Y, et al. 2009. Chain reaction of amyloid fibril formation with induction of basement membrane in familial amyloidotic polyneuropathy. J Pathol 219(4):481-490.
Moloney NA, Hall TM, O'Sullivan TC, Doody CM. 2011. Reliability of thermal quantitative sensory testing of the hand in a cohort of young, healthy adults. Muscle Nerve 44(4):547-552.

64
Moravcová E, Bena�ík J, Svobodník A, Dušek L. 2005. Reproducibility of thermal threshold assessment in thin-fibre neuropathy patients. Scipta Medica 3:177-184.
Morelli S, Carmenini E, Sgreccia A, Francia A. 2002. Heart rate variability and familial amyloidosis. Int J Cardiol 83(3):295-297.
Niklasson U, Olofsson BO, Bjerle P. 1989. Autonomic neuropathy in familial amyloidotic polyneuropathy. A clinical study based on heart rate variability. Acta Neurol Scand 79(3):182-187.
Nilsson T, Lundström R. 2001. Quantitative thermal perception thresholds relative to exposure to vibration. Occup Environ Med 58:472-478.
Ohmori H, Ando Y, Makita Y, Onouchi Y, Nakajima T, Saraiva MJ, et al. 2004. Common origin of the Val30Met mutation responsible for the amyloidogenic transthyretin type of familial amyloidotic polyneuropathy. J Med Genet 41(4):e51.
Olsson M, Hellman U, Planté-Bordeneuve V, Jonasson J, Lång K, Suhr OB. 2009. Mitochondrial haplogroup is associated with the phenotype of familial amyloidosis with polyneuropathy in Swedish and French patients. Clin Genet 75(2):163-168.
Olsson M, Norgren N, Obayashi K, Plante-Bordeneuve V, Suhr OB, Cederquist K, Jonasson JA. 2010. Possible role for miRNA silencing in disease phenotype variation in Swedish transthyretin V30M carriers. BMC Med Genet 1411:130.
Okamoto S, Wixner J, Obayashi K, Ando Y, Ericzon BG, Friman S, et al. 2009. Liver transplantation for familial amyloidotic polyneuropathy: impact on Swedish patients' survival. Liver Transpl 15(10):1229-1235.
Palácios SA, Bittencourt PL, Cançado EL, Farias AQ, Massarollo PC, Mies S, et al. 1999. Familial amyloidotic polyneuropathy type 1 in Brazil is associated with the transthyretin Val30Met variant. Amyloid 6(4):289-291.
Palmer ST, Martin DJ. 2005. Thermal perception thresholds recorded using method of limits change over brief time intervals. Somatosens Mot Res 22:327-334.
Pan CL, Tseng TJ, Lin YH, Chiang MC, Lin WM, Hsieh ST. 2003. Cutaneous innervation in Guillain-Barré syndrome: pathology and clinical correlations. Brain 126:386-397.
Pavlaković G, Klinke I, Pavlaković H, Züchner K, Zapf A, Bachmann CG, et al. 2008. Effect of thermode application pressure on thermal threshold detection. Muscle Nerve 38(5):1498-1505.
Pertovaara A, Kojo I. 1985. Influence of the rate of temperature change on thermal thresholds in man. Exp Neurol 87:439-445.
Planté-Bordeneuve V, Ferreira A, Lalu T, Zaros C, Lacroix C, Adams D, et al. 2007. Diagnostic pitfalls in sporadic transthyretin familial amyloid polyneuropathy (TTR-FAP). Neurology 69(7):693-698.
Planté-Bordeneuve V, Said G. 2000. Transthyretin related familial amyloid polyneuropathy. Curr Opin Neurol 13(5):569-573.

65
Planté-Bordeneuve V, Said G. 2011. Familial amyloid polyneuropathy. Lancet Neurol 10(12):1086-1097.
Rajendra Acharya U, Paul Joseph K, Kannathal N, Lim CM, Suri JS. 2006. Heart rate variability: review. Med Biol Eng Comput 44(12):1031-1051.
Redmond J, Cros D, Shahani BT. 1990. Variability of quantitative sensory testing: implications for clinical practice. Henry Ford Hosp Med J 38:62-67.
Reulen JPH, Lansbergen MDI, Verstraete E, Spaans F. 2003. Comparison of thermal threshold tets to assess small nerve fiber function: limits vs. levels. Clin Neurophysiol 114: 556-563.
Richardson SJ, Cody V, editors. 2009. Recent advances in Transthyretin evolution, structure and biological functions. Berlin Heidelberg: Springer-Verlag.
Rolke R, Baron R, Maier C, Tölle TR, Treede RD, Beyer A, et al. 2006. Quantitative sensory testing in the German research network on neuropathic pain (DFNS): Standard protocol and reference values. Pain 123:231-243.
Said G. 2003. Familial amyloid polyneuropathy: mechanisms leading to nerve degeneration. Amyloid 10 Suppl 1:7-12.
Said G, Planté-Bordeneuve V. 2009. Familial amyloid polyneuropathy: a clinico-pathologic study. J Neurol Sci 284(1-2):149-154.
Sand T, Nilsen KB, Hagen K, Stovner LJ. 2010. Repeatability of cold pain and heat pain thresholds: The application of sensory testing in migraine research. Cephalalgia 30(8):904-909.
Saporta MA, Zaros C, Cruz MW, André C, Misrahi M, Bonaïti-Pellié C, et al. 2009. Penetrance estimation of TTR familial amyloid polyneuropathy (type I) in Brazilian families. Eur J Neurol 16(3):337-341.
Schestatsky P, Lladó-Carbó E, Casanova-Molla J, Álvarez-Blanco S, Valls-Solé J. 2009. Small fiber function in patients with merlagia paresthetica. Pain 139:342-348.
Schmidt RF. 1978. Fundamentals of Sensory Physiology. Springer -Verlag New York Heidelberg-Berlin.
Schmidt RF, Thews G. 1983. Human Physiology. Springer -Verlag New York Heidelberg-Berlin.
Schüller TB, Hermann K, Baron R. 2000. Quantitative assessment and correlation of sympathetic, parasympathetic, and afferent small fiber function in peripheral neuropathy. J Neurol 247:267-272.
Selim MM, Wendelschafer-Crabb G, Hodges JS, Simone DA, Foster SX, Vanhove GF, Kennedy WR. 2010. Variation in quantitative sensory testing and epidermal nerve fiber density in repeated measurements. Pain 151(3):575-581.
Shun CT, Chang YC, Wu HP, Hsieh SC, Lin WM, Lin YH, et al. 2004. Skin denervation in type 2 diabetes: correlations with diabetic duration and functional impairment. Brain 127:1593-1605.
Siao P, Cros DP. 2003. Quantitative sensory testing. Phys Med Rehabil Clin N Am 14(2):261-86.

66
Sobue G, Koike H, Misu K, Hattori N, Yamamoto M, Ikeda S, Ando Y, et al. 2003. Clinicopathologic and genetic features of early- and late-onset FAP type I (FAP ATTR Val30Met) in Japan. Amyloid 10 Suppl 1:32-38.
Suhr OB. 2003. Impact of liver transplantation on familial amyloidotic polyneuropathy (FAP) patients' symptoms and complications. Amyloid 10 Suppl 1:77-83.
Suhr OB, Friman S, Ericzon BG. 2005. Early liver transplantation improves familial amyloidotic polyneuropathy patients' survival. Amyloid 12(4):233-238.
Suhr OB, Lindqvist P, Olofsson BO, Waldenström A, Backman C. 2006. Myocardial hypertrophy and function are related to age at onset in familial amyloidotic polyneuropathy. Amyloid 13(3):154-159.
Suhr OB, Svendsen IH, Andersson R, Danielsson A, Holmgren G, Ranløv PJ. 2003. Hereditary transthyretin amyloidosis from a Scandinavian perspective. J Intern Med 254(3):225-235.
Sousa A, Andersson R, Drugge U, Holmgren G, Sandgren O. 1993. Familial amyloidotic polyneuropathy in Sweden: geographical distribution, age of onset, and prevalence. Hum Hered 43:288–294.
Sousa A, Coelho T, Barros J, Sequeiros J. 1995. Genetic epidemiology of familial amyloidotic polyneuropathy (FAP)-type I in Póvoa do Varzim and Vila do Conde (north of Portugal). Am J Med Genet 60:512–521.
Sousa MM, Cardoso I, Fernandes R, Guimarães A, Saraiva MJ. 2001. Deposition of transthyretin in early stages of familial amyloidotic polyneuropathy: evidence for toxicity of non-fibrillar aggregates. Am J Pathol 159:1993-2000.
Sousa MM, Saraiva MJ. 2003. Neurodegeneration in familial amyloid polyneuropathy: from pathology to molecular signaling. Prog Neurobiol 71(5):385-400.
Tashima K, Ando Y, Terazaki H, Yoshimatsu S, Suhr OB, Obayashi K, et al. 1999. Outcome of liver transplantation for transthyretin amyloidosis: follow-up of Japanese familial amyloidotic polyneuropathy patients. J Neurol Sci 171(1):19-23.
Thomsen NO, Englund E, Thrainsdottir S, Rosén I, Dahlin LB. 2009. Intraepidermal nerve fibre density at wrist level in diabetic and non-diabetic patients. Diabet Med 26(11):1120-1126.
Valk GD, Grootenhuis PA, van Eijk JT, Bouter LM, Bertelsmann FW. 2000. Methods for assessing diabetic polyneuropathy: validity and reproducibility of the measurement of sensory symptom severity and nerve function tests. Diabetic Res and Clin Pract 47:87-95.
Vallbo AB, Hagbarth KE, Torebjörk HE, Wallin BG. 1979. Somatosensory, proprioceptive, and sympathetic activity in human peripheral nerves. Physiol Rev 59(4):919-957.
Vallbo AB, Hagbarth KE, Wallin GB. 2004. Microneurography: how the technique developed and its role in the investigation of the sympathetic nervous system. J Appl Physiol 96:1262-1269.

67
Verdugo R, Ochoa JL. 1992. Quantitative somatosensory thermotest. A key method for functional evaluation of thin calibre afferent channels. Brain 115:893-913.
Vlcková-Moravcová E, Bednarík J, Dusek L, Toyka KV, Sommer C. 2008. Diagnostic validity of epidermal nerve fiber densities in painful sensory neuropathies. Muscle Nerve 37(1):50-60.
Wasner G, Brock J. 2008. Determinants of thermal pain thresholds in normal subjects. Clin Neurophysiol 119:2389-2395.
Westermark P, Benson MD, Buxbaum JN, Cohen AS, Frangione B, Ikeda S, et al. 2005. Amyloid: toward terminology clarification. Report from the Nomenclature Committee of the International Society of Amyloidosis. Amyloid 2:1-4.
Whalen BM, Selkoe DJ, Hartley DM. 2005. Small non-fibrillar assemblies of amyloid beta-protein bearing the Arctic mutation induce rapid neuritic degeneration. Neurobiol Dis 20(2):254-266.
Wiklund U, Hörnsten R, Olofsson BO, Suhr OB. 2010. Cardiac automonic function does not improve after liver transplantation for familial amyloidotic polynueropathy. Autonom Neurosci 156:124-130.
Yarnitsky D. 1997. Quantitative sensory testing. Muscle Nerve 20:198-204.
Yarnitsky D, Ochoa JL. 1991. Warm and cold specific somatosensory systems. Psychophysical thresholds, reaction times and peripheral conduction velocities. Brain 114:1819-1826.
Yarnitsky D, Sprecher E. 1994. Thermal testing: normative data and repeatability for various test algorithms. J Neurol Sci 125:39-45.
Yarnitsky D, Sprecher E, Zaslansky R, Hemli JA. 1995. Heat pain thresholds: normative data and repeatability. Pain 60:329-332.
Zinman LH, Bril V, Perkins BA. 2007. Cooling detection thresholds in the assessment of Diabetic Sensory Polyneuropathy. Diabetes Care 27(7) 1674-1679.
Zaros C, Genin E, Hellman U, Saporta MA, Languille L, Wadington-Cruz M, et al. 2008. On the origin of the transthyretin Val30Met familial amyloid polyneuropathy. Ann Hum Genet 72(Pt 4):478-484.
Zaslansky R, Yarnitsky D. 1998. Clinical applications of quantitative sensory testing (QST). J Neurol Sci 153(2):215-238.
Zhang J. 2007. Effect of age and sex on heart rate variability in healthy subjects. J Manipulative Physiol Ther 30(5):374-379.
Zwart J-A and Sand T. 2002. Repeatability of dermatomal warm and cold sensory thresholds in patients with sciatica. J Eur Spine 11:441-446.
Ørstavik K, Namer B, Schmidt R, Schmelz M, Hilliges M, Weidner C et al. 2006. Abnormal function of C-fibers in patients with Diabetic neuropathy. J Neurosci 26(44):11287-11294.

68