method for the determination of air-phase petroleum hydrocarbons
TRANSCRIPT

METHOD FOR THE DETERMINATIONOF AIR-PHASE PETROLEUM HYDROCARBONS (APH)
Massachusetts Department of Environmental Protection
Office of Research and Standards
Bureau of Waste Site Cleanup
Commonwealth of Massachusetts
Executive Office of Energy & Environmental AffairsIan A. Bowles
Secretary
Department of Environmental ProtectionLaurie Burt
Commissioner
December 2009Final
Revision 1

METHOD FOR THE DETERMINATION OFAIR-PHASE PETROLEUM HYDROCARBONS (APH)
TABLE OF CONTENTS
Topic Page
1.0 Scope and Application 1
2.0 Summary of Method and Data Quality Objectives 2
3.0 Definitions and Units of Measure 3
4.0 Interferences and Method Limitations 5
5.0 Health and Safety Issues 5
6.0 Apparatus and Materials 5
7.0 Reagents and Standards 6
8.0 Sample Collection and Handling 8
9.0 Analytical Procedure 10
9.1 Sample Preparation and Concentration 10
9.2 GC/MS Conditions 10
9.3 Retention Time Windows 11
9.4 Calibration 11
9.5 GC/MS Analysis of Samples 16
9.6 Calculations 17
10.0 Quality Control 20
11.0 Data Production and Reporting 22
12.0 Reporting Limits 24
13.0 Method Performance 25
14.0 References 25
Tables 27-33
Appendix 1 APH Method Detection Limit Studies
Appendix 2 APH Method Chromatogram
Appendix 3 Required APH Data Reporting Information
Appendix 4 Recommended SOP For Cleaning, Certification, and Calibration of APH Air SamplingEquipment
Appendix 5 APH Method Calculations
Appendix 6 APH Method Calibration and Analysis Using Linear Regression
DISCLAIMERMention of trade names or commercial products does not constitute endorsement by the Massachusetts Department ofEnvironmental Protection (MassDEP). Trade names and commercial products specified in this method are based upontheir use in validation studies conducted by MassDEP. Equipment and materials cited in this method may be replacedby similar products, as long as adequate data exist or have been produced documenting equivalent or superiorperformance.

Air-Phase Petroleum Hydrocarbons (APH), Rev1 FinalMassachusetts DEP December 2009
LIST OF ACRONYMS
APH Air-Phase Petroleum Hydrocarbons
BFB 4-Bromofluorobenzene
CAM Compendium of Analytical Methods
%D Percent Difference
DF Dilution Factor
GC/MS Gas Chromatography / Mass Spectrometry
HPLC High Pressure Liquid Chromatography
IDLC Initial Demonstration of Laboratory Capability
IS Internal Standard
LCS Laboratory Control Sample
LMB Laboratory Method Blank
MassDEP Massachusetts Department of Environmental Protection
MCP Massachusetts Contingency Plan
MDL Method Detection Limit
MTBE Methyl tertiary butyl ether
NIST National Institute of Standards and Technology
QA/QC Quality Assurance / Quality Control
%R Percent Recovery
r Correlation Coefficient
r2 Coefficient of Determination
RL Reporting Limit
RPD Relative Percent Difference
RRF Relative Response Factor
RRT Relative Retention Time
%RSD Percent Relative Standard Deviation
Rt Retention Time
SOP Standard Operating Procedure
UHP Ultra High Purity
VPH Volatile Petroleum Hydrocarbons
NOTE: Abbreviations of units (e.g., amu, in. or mm Hg, m/e, μg/m3, mL, min, ng, ppbV,psia, psig, etc.) are not included.

Air-Phase Petroleum Hydrocarbons (APH), Rev1 Page 1 FinalMassachusetts DEP December 2009
METHOD FOR THE DETERMINATION OFAIR-PHASE PETROLEUM HYDROCARBONS (APH)
MASSACHUSETTS DEPARTMENT OF ENVIRONMENTAL PROTECTION (MassDEP)
1.0 SCOPE AND APPLICATION
1.1 This method is designed to measure the gaseous-phase concentrations of volatile aliphatic and aromaticpetroleum hydrocarbons in air and soil gas. Volatile aliphatic hydrocarbons are collectively quantified withintwo carbon number ranges: C5 through C8 and C9 through C12. Volatile aromatic hydrocarbons arecollectively quantified within the C9 to C10 range. These aliphatic and aromatic hydrocarbon rangescorrespond to a boiling point range between approximately 28°C (isopentane) and 218°C (naphthalene).
1.2 This method is based on the collection of whole air samples in passivated stainless steel canisters, withsubsequent analysis by gas chromatography/mass spectrometry (GC/MS). This method should be used by, orunder the direct supervision of, analysts experienced in the use of GC/MS instrumentation for theidentification and quantification of contaminant concentrations in air.
1.3 This method is designed to complement and support the toxicological approach developed by theMassachusetts Department of Environmental Protection to evaluate human health hazards that may resultfrom exposure to petroleum hydrocarbons (MassDEP, 1994 and Updated Petroleum Hydrocarbon FractionToxicity Values For VPH/EPH/APH Methodology, November 2003). The method is intended to produce datain a format suitable for the characterization of risk at sites undergoing evaluation under the MassachusettsContingency Plan (MCP, 310 CMR 40.0000) using the aforementioned toxicological approach.
1.4 This method may also be used to directly quantify the individual concentrations of the Target APH Analytes1,3-butadiene, methyl-tert-butylether (MTBE), benzene, toluene, ethylbenzene, m- & p-xylenes, o-xylene andnaphthalene in air and soil gas samples.
1.5 Petroleum products suitable for evaluation by this method include gasoline, as well as the volatile fractions ofmineral spirits, kerosene, #2/diesel fuel oil, jet fuels, and certain petroleum naphthas. This method is notsuitable for the identification and quantification of entrained aerosols, particulate-phase hydrocarbons, andpetroleum products with a significant percentage of hydrocarbons with boiling points > 218°C.
1.6 The Reporting Limit (RL) of this method for each of the Target APH Analytes is determined by the lowestapplicable Calibration standard. The nominal RL for the individual target analytes is approximately 2 to 5g/m3. The RLs for the collective hydrocarbon ranges are empirically determined based on the number andlowest concentration of the component standards used in the calibration of the individual ranges. The nominalRLs for the aliphatic and aromatic ranges are 12 µg/m3 and 10 µg/m3, respectively.
1.7 This method includes a series of data adjustment steps to determine the concentrations of the collectivealiphatic and aromatic hydrocarbon ranges of interest. These steps must be taken by the laboratory.
1.8 Data reports produced using this method must contain all of the information presented in Appendix 3. Theformat of these reports is left to the discretion of individual laboratories (but must include the samecertification statement presented in the aforementioned Appendix and must be provided in a clear, concise,and succinct manner).
1.9 There may be better, more accurate, and/or less conservative ways to produce APH target and range data.MassDEP encourages methodological innovations that: (a) better achieve method and/or data qualityobjectives, (b) increase analytical precision and accuracy, (c) reduce analytical uncertainties and expenses,and/or (d) reduce the use of toxic solvents and generation of hazardous wastes.
All significant modifications to this method, however, must be disclosed and described on the data report, asdetailed in Section 11.1.2. Laboratories that make such modifications, and/or develop and utilize alternativeapproaches and methods, are further required to demonstrate that:

Air-Phase Petroleum Hydrocarbons (APH), Rev1 Page 2 FinalMassachusetts DEP December 2009
Such modifications or methodologies adequately quantify the petroleum hydrocarbon target ranges, asdefined in Sections 3.1.9 through 3.1.11 of this document, ensuring that any methodological uncertaintiesor biases are addressed in a manner that ensures protective (i.e., conservative) results and data (e.g., over,not under-quantification of the more toxic ranges);
Such modifications and/or methodologies employ and document initial method demonstration andongoing quality control (QC) procedures consistent with approaches detailed in the MassDEPCompendium of Analytical Methods (CAM); and
Such method and procedural modifications are fully documented in a detailed standard operatingprocedure (SOP).
1.10 This method is one way to quantify collective concentrations of volatile aliphatic and aromatic petroleumhydrocarbons within specified carbon number ranges. It has been designed in a manner that attempts to strikea reasonable balance between analytical method performance and utility. In this manner, assumptions andbiases have been structured into the method to help ensure protective, though not overly conservative, data.
As an example, MassDEP recognizes that branched alkanes have lower boiling points than their n-alkanecounterparts while many of the cycloalkane constituents of gasoline-range volatile organics have higher boilingpoints than their n-alkane counterpart. As a consequence:
(1) Depending upon the specific chromatographic column used, most branched C9 alkanes areexpected to elute before n-nonane, the beginning marker compound for the C9 through C12
aliphatic hydrocarbon range, and will be conservatively counted in the more toxic C5 through C8
aliphatic hydrocarbon range;
(2) Depending upon the specific chromatographic column used, most branched C5 alkanes will elutebefore n-pentane and before isopentane, the beginning marker compound for the C5 through C8
aliphatic hydrocarbon range, and will not be counted at all in the C5 through C8 aliphatichydrocarbon range; and
(3) Depending upon the specific chromatographic column used, most cycloalkanes within the C5
through C8 and C9 through C12 aliphatic hydrocarbon ranges will be counted within their properrange, with the exception of some C12 cycloalkanes which will elute after dodecane, the endmarker compound for the C9 through C12 aliphatic hydrocarbon range.
Based on the nature of petroleum releases encountered in the environment, the collective concentrations of thevolatile aliphatic ranges as measured by the APH Method are considered to be suitable, along withconcentrations of target analytes, for the evaluation of the risks posed by these releases, consistent with thetoxicological approach developed by MassDEP to evaluate human health hazards that may result from exposureto petroleum hydrocarbons (MassDEP, 1994, and Updated Petroleum Hydrocarbon Fraction Toxicity ValuesFor VPH/EPH/APH Methodology, November 2003).
1.11 This method should be used in conjunction with the current version of WSC-CAM-IX A, Quality ControlRequirements and Performance Standards for the Analysis of Air-Phase Petroleum Hydrocarbons (APH) byGas Chromatography/Mass Spectrometry (GC/MS). WSC-CAM-IX A was developed by MassDEP tocomplement the APH (MassDEP-APH-09) and to provide more detailed guidance regarding compliance withthe quality control requirements and performance standards of the MassDEP APH Method.
2.0 SUMMARY OF METHOD AND DATA QUALITY OBJECTIVES
2.1 Samples are collected in pre-cleaned, evacuated, passivated stainless steel canisters.
2.2 A concentrator system capable of the automated collection, trapping, focusing, and injection of measuredaliquots of the sample that employs a suitable mechanism for sample moisture control is recommended.Depending on the water retention properties of the packing material, some or most of the water vaporcontained in the sample should completely pass through the concentrator during sample processing.Additional drying of the “trapped” sample aliquot, if required, can be accomplished by forward purging the

Air-Phase Petroleum Hydrocarbons (APH), Rev1 Page 3 FinalMassachusetts DEP December 2009
trap with clean, dry helium (or other inert gas). Other water management approaches are also acceptableproviding their use does not compromise method performance (see Section 10.2).
2.3 Following preconcentration, the sample is then transferred and cryogenically refocused onto the inlet of thesystem’s capillary column, further concentrating the sample.
2.4 The sample is then released by thermal desorption and carried onto the gas chromatographic capillary column,which separates the individual compounds and hydrocarbon ranges of interest. All compounds are detectedusing a mass spectrometer. Target APH Analytes are identified and quantified using characteristic ions.Collective concentrations of C9-C10 aromatic hydrocarbons are quantified using extracted ions. Collectiveconcentrations of aliphatic hydrocarbon ranges are quantified using the total ion chromatogram.
2.5 This method is based on USEPA Method TO-15, Determination of Volatile Organic Compounds (VOCs) inAir Collected in Specially-prepared Canisters And Analyzed by Gas Chromatography/Mass Spectrometry(GC/MS).
2.6 Data Quality Objectives should be developed and applied for sampling and analytical efforts involving the useof this method. Key parameters of interest include: (a) the need for and extent of time-integrated air samples,(b) the acceptability of RLs achievable by the laboratory for the contaminants of interest, and (c) theidentification and reporting of target and non-target analytes.
3.0 DEFINITIONS AND UNITS OF MEASURE
3.1 Definitions
3.1.1 Absolute Pressure is defined as the pressure measured with reference to absolute zero pressure(as opposed to atmospheric pressure), usually expressed as, mm Hg, or psia.
3.1.2 Air-Phase Petroleum Hydrocarbons are defined as collective ranges of hydrocarbon compoundseluting from isopentane to n-dodecane, excluding Target APH Analytes. APH is comprised of C5-C8 aliphatic hydrocarbons, C9-C12 aliphatic hydrocarbons, and C9-C10 aromatic hydrocarbons.
3.1.3 Aliphatic Hydrocarbon is defined as acyclic or cyclic, saturated or unsaturated compounds,excluding aromatic compounds that contain only carbon and hydrogen atoms.
3.1.4 APH Calibration Check Standard is defined as a gaseous-phase mixture of APH componentsthat is used to periodically check the calibration state of the GC/MS system. The APH CalibrationCheck Standard is prepared from the APH working standards and is generally one of the mid-levelconcentrations.
3.1.5 APH Calibration Standard is defined as a gaseous-phase mixture of APH components that isused to calibrate the GC/MS system. The APH calibration standards are prepared from the APHworking standards and are prepared at a minimum of five or six different concentrations,depending on the method used to evaluate the calibration.
3.1.6 APH Components are defined as the 26-component mixture of the aliphatic and aromaticcompounds listed in Table 1. The APH components are used to (a) define the individual retentiontimes and response factors for each of the target APH analytes, (b) define and establish the retentiontime windows for the collective aliphatic and aromatic hydrocarbon ranges of interest, and (c)determine average response factors which are used to calculate the collective concentrations ofhydrocarbons within these ranges.
3.1.7 APH Working Standards are defined as gaseous-phase mixtures of all APH components, whichare used in the preparation of calibration standards (see Tables 3a and 3b). These standards areprepared with concentrations over the working range of the calibration curve by dynamic dilutionof the gaseous stock standard with humidified ultra zero air or ultra high purity (UHP) nitrogen.The stock standard is delivered to a clean, passivated canister using a pump and mass flowcontroller.

Air-Phase Petroleum Hydrocarbons (APH), Rev1 Page 4 FinalMassachusetts DEP December 2009
3.1.8 Aromatic Hydrocarbons are defined as compounds whose structures include a cyclic structureand a closed conjugated system of double bonds containing only carbon and hydrogen atoms.
3.1.9 C5 through C8 Aliphatic Hydrocarbons are defined as all aliphatic petroleum hydrocarboncompounds that elute from isopentane to just before n-nonane (C9).
3.1.10 C9 through C12 Aliphatic Hydrocarbons are defined as all aliphatic petroleum hydrocarboncompounds that elute from just before n-nonane to just after n-dodecane.
3.1.11 C9 through C10 Aromatic Hydrocarbons are defined as all aromatic petroleum hydrocarboncompounds that elute from just after o-xylene to just before naphthalene.
3.1.12 Cryogen is defined as the refrigerant used to obtain very low temperatures in the cryogenic trap ofan analytical system. A typical cryogen is liquid nitrogen (boiling point = -196C).
3.1.13 Gauge Pressure is defined as the pressure measured above atmospheric pressure (as opposed toabsolute pressure). Zero gauge (0 psig) is equal to ambient atmospheric (barometric) pressure.
3.1.14 Humidified Canister is defined as a passivated stainless steel canister containing ultra zero air orUHP nitrogen pressurized to 30 psig with a relative humidity of 30 - 40% at 25C to simulatemoisture conditions in real-world samples. For example, a 6-liter humidified canister may beprepared by fortifying a certified-clean passivated canister with 130 L of high pressure liquidchromatography (HPLC)-grade water and pressurizing to 30 psig. Alternatively, ultra zero airpassed through HPLC-grade water contained in an in-line bubbler (humidifier) may be used topressurize a certified-clean passivated canister to 30 psig.
3.1.15 Laboratory Control Sample (LCS) is defined as a humidified canister containing a separatesource gaseous standard obtained from a different source than that used to prepare the APHworking standards.
3.1.16 Laboratory Method Blank (LMB) is defined as a humidified canister pressurized with ultra zeroair or UHP nitrogen to 30 psig.
3.1.17 Nominal Sample Volume is defined as the routine sample volume employed by the laboratory forAPH Method sample analysis and calibration.
3.1.18 Petroleum Hydrocarbon is a generic term used to describe the complex mixture of chemicalcompounds derived from crude oil containing only carbon and hydrogen atoms.
3.1.19 Stock Standard is a gaseous cylinder containing the APH components (all aliphatic and aromaticrange calibration compounds and target analytes) and is used to prepare working standards.
3.1.20 Target APH Analytes are defined as 1,3-butadiene, MTBE, benzene, toluene, ethylbenzene, m-& p-xylene, o-xylene, and naphthalene.
3.2 Units of Measure
3.2.1 The units of measure referenced in this method for volume, concentration, and pressure arereflective of the conventions and standards that are commonly used by practitioners within thisfield, and/or the conventions and standards associated with commonly available instrumentationand equipment.
3.2.2 Concentrations of APH target analytes must be reported in g/m3. Collective aliphatic andaromatic hydrocarbon range data can only be reported in g/m3 (See Section 9.6.2).
3.2.3 Other physical measurements (pressure, volume, etc.) should only be reported in units specificallyreferenced in the APH Method.

Air-Phase Petroleum Hydrocarbons (APH), Rev1 Page 5 FinalMassachusetts DEP December 2009
4.0 INTERFERENCES AND METHOD LIMITATIONS
4.1 Contamination may occur in the sampling system if canisters are not properly cleaned before use.Additionally, all other sampling equipment (e.g., pump and flow controllers) must be thoroughly cleaned toensure that the filling apparatus will not contaminate samples.
4.2 System carryover can be a potential problem, particularly for heavier molecular weight hydrocarbons such asnaphthalene. Carryover can occur after the analysis of high concentration standards or samples. Measuresthat must be taken to remove this system contamination can include the analysis of multiple blanks, the use ofhumidified air through the system, and occasional bake out or replacement of the concentrator systemcomponents.
4.3 High methane levels and/or carbon dioxide levels may interfere with the chromatography. Dilution may beperformed on samples to minimize this effect; however, the RLs for diluted samples will be proportionatelyincreased. It should be noted that although the concentrator systems must be designed to minimize elevatedlevels of carbon dioxide, the potential still exists to have interfering levels.
4.4 Certain organic compounds not associated with the release of petroleum products, including chlorinatedsolvents, ketones, and ethers may be detected by this method and may contribute to the collective responsequantified within an aliphatic or aromatic hydrocarbon range. When requested by the data user, theidentification of such non-APH compounds must be disclosed on the laboratory report form or laboratorynarrative. See Table 7 for a list of potential non-petroleum compounds, which may contribute to hydrocarbonrange concentrations.
5.0 HEALTH AND SAFETY ISSUES
5.1 The toxicity and carcinogenicity of each reagent used in this method has not been precisely defined.However, each chemical compound should be treated as a potential health hazard. From this viewpoint,exposure to these chemicals must be reduced to the lowest possible level by whatever means available. Thelaboratory is responsible for maintaining a current file of OSHA regulations regarding the safe handling of thechemicals specified in this method. A reference file of material safety data sheets should also be madeavailable to all personnel involved in the chemical analysis.
6.0 APPARATUS AND MATERIALS
6.1 Sample Canisters
Certified clean, leak-free, stainless steel polished or silica–lined, passivated air sampling canisters of 1.0, 2.7,3.0, and 6.0 liter capacity are most commonly used for the collection of APH Method samples, depending onproject requirements.
6.2 Canister Sample Concentrator
6.2.1 Two current systems include: Tekmar-Dohrmann AutoCan Autosampler & CryogenicConcentrating Trap and Entech 7100A Preconcentrator/7016 Canister Autosampler. The mentionof these canister sample concentrator systems by name does not preclude the use of otherequivalent technologies for the APH Method.
6.2.2 Minimum Sample Concentrator Capabilities
Concentrator system must have the ability to remove moisture.
Internal standards must be added to all standards, field samples, and QC samples using thesame technique.
Concentrator system must have the ability to minimize elevated levels of carbon dioxide(can affect integration of C5-C8 aliphatic range).
Air-Phase Petroleum Hydrocarbons (APH), Rev1 Page 6 FinalMassachusetts DEP December 2009
6.3 Gas Chromatograph System
6.3.1 An analytical system complete with a temperature programmable gas chromatograph for use witha capillary column is required.
6.3.2 The required chromatographic column phase is 100% dimethyl polysiloxane (e.g., RTX-1, DB-1,etc.); required column dimensions are 60 meters, 0.25 mm ID, 1-micron film thickness, or acolumn with demonstrated and documented equivalent chromatographic properties (i.e., samecompound elution order).
NOTE: Based upon data obtained from the MassDEP Volatile Petroleum Hydrocarbon(VPH) Method Round Robin testing programs, the choice of chromatographic columnmay have a significant impact on the apportionment and quantification of aliphatic andaromatic compounds within the collective hydrocarbon ranges specified in the method.Substitution of the required column is not allowed, unless it can be demonstrated thatthe selected column has equivalent chromatographic properties and elution order forthe aliphatic and aromatic compounds and ranges of interest.
To demonstrate equivalency of column chromatography, a mid-range APH calibration standardmust be analyzed on both the required column and the proposed substitute column, with all other runand system parameters held constant. The concentrations of C5-C8 and, C9-C12 aliphatichydrocarbons, C9-C10 aromatic hydrocarbon ranges and target analytes must be determined for eachcolumn. The relative percent difference (RPD) between the concentrations of each hydrocarbonrange and target analyte, excluding naphthalene, obtained from each column must be ≤25. The RPDfor naphthalene must be ≤40. The elution order of APH Components on the proposed substitutecolumn must be equivalent to the elution order on the required column.
6.4 Mass Spectrometer System
6.4.1 The mass spectrometer must be capable of scanning from 35 to 250 amu every three seconds orless, utilizing 70 eV in the electron impact ionization mode and producing a mass spectrum whichmeets all the criteria in Table 2 when at least 50 ng of 4-bromofluorobenzene (BFB) is injected.
6.4.2 A data station is required that is capable of storing and reintegrating chromatographic data andcapable of determining peak areas using a forced baseline projection.
7.0 REAGENTS AND STANDARDS
7.1 Reagents
7.1.1 HPLC-grade water for canister humidification.
7.1.2 UHP helium for the GC/MS system.
7.1.3 Liquid nitrogen for the concentrator system and GC.
7.1.4 Ultra zero air or UHP nitrogen for the concentrator system and standard preparation.
7.2 Stock Standard
7.2.1 Gaseous cylinder containing all aliphatic and aromatic range calibration compounds and targetanalytes (see Table 1). Recommended concentration is 1 mg/m3 for all components.
7.2.2 At the time this document was published, National Institute of Standards and Technology (NIST)-certified APH Stock Standards were commercially available from Air Liquide America SpecialtyGases (formerly Scott Specialty Gases, Plumsteadville, PA) and Spectra Gases, Inc. (Branchburg,NJ). The mention of any trade name, product or vendor in this document does not constitute anendorsement or recommendation by the MassDEP.

Air-Phase Petroleum Hydrocarbons (APH), Rev1 Page 7 FinalMassachusetts DEP December 2009
7.3 APH Working Standards
7.3.1 The preparation of gaseous working standards and calibration standards described in the followingsections is based on the use of mass flow controllers to accurately measure and dispense volumesof the gaseous standards used in the preparation of intermediate (working) and final (calibration)standards. Other gas metering or measuring devices may be used to prepare working standardsand calibration standards for the APH Method so long as the accuracy and precision of standardsprepared using these devices is documented and consistent with the overall quality objectives ofthe method.
NOTE: It is unacceptable to use methanol-based stock standards for preparation ofworking standards due to fluctuations observed in the analytical system response when highlevels of methanol are present in the canister. This option was acceptable in the Draftversion of the APH Method but is no longer acceptable.
7.3.2 Prepare gaseous-phase APH working standards in pre-evacuated passivated canisters. The usuallaboratory practice is to prepare working standards at two concentration levels (20 µg/m3 and 500µg/m3, as shown in Tables 3a and 3b).
7.3.3 Using a mass flow controller, flow-inject a measured volume (flow rate * time) of the Stock
Standard(s) into a pre-evacuated passivated canister using ultra zero air or UHP nitrogen fordilution/pressurization. For example, the working standard concentration to be used to establishthe lower end of the calibration range (20 µg/m3 nominal concentration) should allow for a flow-injection volume of at least 25 mL over a minimum of 10 seconds (150 mL/min x 10 seconds) forthe lowest calibration point (the target RL). The working standard concentration to be used toestablish the higher end of the calibration range (500 µg/m3 nominal concentration) should allowfor a flow-injection volume of at least 25 mL over 10 seconds (150 mL/min x 10 seconds) for themid-range calibration point. In practice a known flow rate of ultra zero air or UHP nitrogen isadded concurrently with the Stock Standard in most automated devices.
NOTE 1: Other mass flow controllers may allow for lower volumes to be injected. At aminimum, the laboratory should not exceed the mass flow controller manufacturer’sminimum flow rate or volume.
NOTE 2: Gas-tight syringes can also be used in lieu of mass flow controllers in certaininstances. Syringes may be more appropriate when preparing standards in low volumecanisters (e.g., 1-liter canisters). In general, the use of the mass flow controllers ispreferred for preparation of all working standards.
7.3.4 All working standards must be humidified to a minimum of 30% relative humidity. A ratio of 7.2µL water/liter of gaseous standard is acceptable for humidification of working standards if thelaboratory’s calibration preparation system is not equipped with a humidification chamber (e.g., 6-liter canister = 18 liters when pressurized and therefore requires 7.2 µL x 18 L = 130 µL of water).After the addition of the stock standard, dilution gas, and humidification liquid (if required), theworking standard canister must be pressurized (maximum 30 psig) with ultra zero air or UHPnitrogen. The internal pressure of the working standard canister should be accurately measuredand documented.
7.3.5 It is recommended that all working standard canisters be allowed to equilibrate for at least 24hours before use.
7.4 APH Calibration Standards
7.4.1 APH calibration standards consist of a series of measured flow-injected volumes of the APHworking standards directly injected into the concentrator/GC/MS system.

Air-Phase Petroleum Hydrocarbons (APH), Rev1 Page 8 FinalMassachusetts DEP December 2009
7.4.2 For the individual APH calibration standards, a pre-designated concentration is directly flow-injected into the concentrator/GC/MS by varying the volumes of the working standards. At aminimum, five different concentrations are required for a valid calibration curve. If non-linear(i.e., quadratic) regression is used, a minimum of six (6) concentrations are required for a validcalibration curve (see Section 9.4.11.1). In either case, the calibration concentrations must beevenly dispersed over the full working range of the detector with the lowest calibration pointcorresponding to the target RL. Tables 3a and 3b provide recommended concentrations andpreparation methods for each calibration standard used for a 5-point initial calibration ofhydrocarbon ranges and Target analytes, respectively.
7.4.3 The range of volumes used for the APH calibration standards must be inclusive of the minimumand maximum sample volumes that will be used during routine sample analysis (e.g., as shown inTables 3a and 3b, the minimum volume is 25 mL and the maximum volume is 250 mL). If samplevolumes outside the range of calibration volumes are utilized, the laboratory must statisticallydemonstrate acceptable recovery of all target analytes over the full dynamic range of thecalibration curve using the out-of-range injection volume. This statistical demonstration will beperformed using the procedure described in Section 10.4, using the injection volume of interestwith the higher concentration working standard. In any case, the minimum sample volume usedshould not be less than the manufacturer’s recommendation for the concentrator (typically 20-25mL).
7.5 Internal Standard and MS Tuning Standard
The recommended internal standards (IS) are Bromochloromethane, 1,4-Difluorobenzene, and Chlorobenzene-d5. The required MS tuning standard is BFB. Stock standards of these compounds should be prepared orpurchased in a humidified canister at a concentration to accurately flow-inject a concentration of 10 ppbV or 10µg/m3 into the trap during the collection time for all calibration, blank, and sample analyses, whether through amass flow controller or a sample loop injector. The volume of internal standard mixture added for eachanalysis must be the same from run to run. The concentrations of internal standards can be assigned a nominalvalue of 10 ppbV or 10 µg/m3 for comparison and consistency with the laboratory’s selected reporting units.This will vary among laboratories depending on which units are used during the calibration of the instrument.
8.0 SAMPLE COLLECTION AND HANDLING
8.1 Canister and Flow Controller Cleaning
All canisters must be leak tested and certified clean prior to being used for sampling. Associated canister samplingequipment (e.g., flow controllers, critical orifice assemblies) must also be deemed clean and appropriate for useprior to sampling. Cleaning techniques and acceptance criteria may vary between laboratories but, in general,procedures should include backflushing with humidified ultra zero air or UHP nitrogen. Flow controllers arecalibrated with NIST-traceable flow meters. A detailed procedure for canister cleaning and maintenance ispresented in Appendix 4.
8.2 Sample Collection
8.2.1 All samples must be accompanied by a chain-of-custody form, or equivalent, that documents thecanister and flow controller serial numbers, date and time of sample collection, and all otherpertinent sampling information.
8.2.2 Grab samples are collected by opening the sampling valve of a pre-evacuated canister (initialvacuum ≥ 28 in. Hg) and allowing the canister to fill to ambient pressure. Equalization toatmospheric pressure under these conditions may be completed in a minute or less.
8.2.3 Time-integrated samples require the use of a properly calibrated flow controller. The flowcontroller’s calibration must be performed and verified (by the laboratory) prior to samplecollection. Upon receipt at the laboratory, a post-sampling flow controller calibration verificationmust be performed. The RPD between the initial and post sampling calibration readings must becalculated. As long as the RPD is < 20, the calibration and associated time interval are consideredvalid. If the RPD is >20, a notation must be provided in the data report form and laboratory

Air-Phase Petroleum Hydrocarbons (APH), Rev1 Page 9 FinalMassachusetts DEP December 2009
narrative disclosing the deficient RPD value. The flow controller RPD is one line of evidence inthe proper collection of samples for APH analysis. If the canister vacuum is acceptable aftersampling and the flow controller RPD is outside of the acceptance criteria, data quality is notadversely affected.
Sampling Note:
Flow controllers will be calibrated such that a small amount of vacuum willremain in the canister at the end of sampling (approximately 5 in. Hg). Thepost-sampling canister vacuum will be measured by the laboratory using anannually calibrated, NIST-traceable vacuum/pressure gauge. The vacuumshould be approximately 5 in. Hg to ensure a consistent flow rate throughoutthe measured time interval. However, due to temperature/pressure differencesin the field, as well as site-specific conditions for various sampling applications(e.g., moisture levels, soil type, site access issues), the actual post-samplingcanister pressure may be slightly different than 5 in. Hg.
8.2.4 Upon receipt at the laboratory, all samples must be assigned unique laboratory identificationnumbers.
8.2.5 The canister pressure of all grab and time-integrated samples must be measured and documentedupon receipt at the laboratory. An annually calibrated NIST-traceable vacuum/pressure gauge isattached to the canister inlet, the sampling valve is briefly opened and the pressure is recorded. Ifthe canister vacuum on receipt is > 15 in. Hg, or if the canister vacuum measured on receipt at thelaboratory differs from the final canister vacuum measured in the field by more than ±5 in. Hg, theclient should be contacted to determine if analysis should proceed. If the client indicates that theanalysis should proceed, the noted anomalies should be documented on the data report form or thelaboratory narrative.
8.2.6 Samples may be pressurized to a maximum of 5 psig with humidified ultra zero air or UHPnitrogen after receipt in the laboratory. Refer to Section 9.5.1.3 for the calculation of dilutionfactors for pressurized samples.
8.2.7 Documentation Requirements
8.2.7.1 Pre-Sampling Information: Provided by the LaboratoryCanister serial numberIndividual or batch certification resultsCanister volumePre-sampling canister vacuumFlow controller serial numberDate canister released by the laboratory
8.2.7.2 Sampling Information: Provided by the Sampler
Site locationSampling dateSampling locationSample identification (ID)Canister serial number for each sample IDCanister volume (liters) for each sample IDSampling durationFlow controller identification number (if utilized) for each sample IDSampling start and end timesInitial and final ambient temperatures and atmospheric pressuresInitial and final interior temperaturesInitial and final canister vacuums (in. Hg)Date shipped to laboratory

Air-Phase Petroleum Hydrocarbons (APH), Rev1 Page 10 FinalMassachusetts DEP December 2009
8.2.7.3 Post Sampling Information: Provided by the Laboratory
Date receivedLaboratory IDVacuum of canister upon receipt at laboratoryFlow controller calibration RPD
8.3 Holding Time
Canisters should be used in the field in a timely manner (i.e., they should not be stockpiled at the site prior touse). The maximum holding time for the analysis of passivated canister samples for APH analyses is 30days from the date of sample collection.
9.0 ANALYTICAL PROCEDURE
9.1 Sample Preparation and Concentration
9.1.1 Ensure the integrity of the canister sample as described in Section 8.0.
9.1.2 Connect the canister(s) valve to the concentrator autosampler or sample inlet line. The canistermust remain closed.
9.1.3 Leak check all canister inlet connections. Analysis may not begin until the leak check has passedfor each canister being tested. Refer to the concentrator manufacturer’s specifications for leakcheck criteria. For example, the pressure change should not exceed 2.0 psia over a 30 secondperiod for an Entech 7100A concentrator.
9.1.4 Open the canister valves.
9.1.5 For the analysis of low concentration samples, set up the concentrator system to withdraw thenominal sample volume (i.e., “1x” volume) of air from each canister. If high concentrations areexpected, lower volumes may be used, but they should be within the range of volumes used for theinitial calibration standards (See Section 7.4.3). The nominal (1x) volume for typical analyticalapplications is 0.25 liters.
9.1.6 General description of the whole-air sample concentration procedure: commercially availablesystems typically consist of a 2- to 3-stage trapping procedure that “freezes out” analytes ofinterest while simultaneously removing as much of the matrix (i.e., nitrogen, oxygen, carbondioxide, methane, and moisture) as possible. Sample volume and flow rates are controlled via amass flow controller, which negates the effect of variations in the pressure and temperature of thesamples and calibration standards. The sample is withdrawn from the canister by creating apressure differential with a vacuum pump across the mass flow controller which is in line with thecanister. An aliquot of sample is withdrawn at a constant flow rate onto a trap containing asorbent material capable of adsorbing the analytes of interest. After equilibration, the targetanalytes are transferred to a cryofocusing unit, and when the GC is ready, the sample is injected byballistic heating of the cryofocuser. The heating of the cryofocuser transfers the target analytes tothe GC/MS system.
9.2 GC/MS Conditions
NOTE: Conditions described below are for an Agilent 6890/5973 GC/MS system.
9.2.1 Gas Chromatograph
9.2.1.1 Recommended oven program: initial temperature 25C, hold for 5.0 min. Increasetemperature to 100C at 8.0C/min, and then increase temperature to 220C at25C/minute. Hold for 4.0 min.
Air-Phase Petroleum Hydrocarbons (APH), Rev1 Page 11 FinalMassachusetts DEP December 2009
GC conditions may vary, but a minimum separation requirement of 50% (maximum peakheight to valley height) must be met, particularly for hexane and bromochloromethane(IS1) in a 20 µg/m3 Calibration standard.
9.2.1.2 Gas Flows: Helium carrier gas flow of 2 mL/min is the recommended flow rate.
9.2.1.3 Recommended Sample Injection
Injection mode: splitless.Injection port temperature: 220C.Inlet pressure: 25.77 psi.Purge flow: 36.3 mL/min at 0 minutes.Gas saver flow: 20 mL/min.
9.2.1.4 Recommended MS Conditions
Temperature of MS transfer line: 240C.Temperature of MS Quad: 150C.Temperature of MS Source: 230C.Solvent Delay: 4.0 minutes.Scanning Parameters: minimum range 35-250 amu.MS must be tuned to pass BFB criteria listed in Table 2.
9.3 Retention Time Windows
The APH retention time (Rt) window for the C5 - C8 aliphatic hydrocarbons is defined as beginning0.1 minutes before the elution of isopentane and ending 0.01 minutes before the elution of nonane.The C9 - C12 aliphatic hydrocarbon range begins 0.01 minutes before the elution of nonane; thereforethere is no overlap of the two ranges and the nonane peak is only included in the C9 - C12 aliphatichydrocarbon range. The C9 - C12 aliphatic hydrocarbon range ends 0.1 minutes after the elution ofdodecane.
The APH Rt window for the C9 - C10 aromatic hydrocarbons is defined as beginning 0.1 minutesafter the Rt of the beginning marker compound (o-xylene) and ending 0.1 minutes before the Rt ofthe ending marker compound (naphthalene).
APH marker compounds and windows are summarized in Table 4.
9.4 Calibration
NOTE: Calibration and sample analysis calculations presented in this section are based on the GC/MSsystem response to multiple calibration standards expressed in units of “nominal” concentration (μg/m3).Other quantitative approaches such as GC/MS system response to multiple calibration standards expressedin units of on-column mass (μg) are also acceptable.
9.4.1 The APH working standards are used to calibrate the GC/MS system. Two distinct calibrationoperations are necessary:
9.4.1.1 Target APH Analytes: Relative Response Factors (RRFs) are calculated for the TargetAPH Analytes, based upon a correlation between the concentration of analyte and areacounts for the relevant quantitation ions. This allows for the individual identification andquantitation of these specific compounds. It is not necessary to develop response factorsfor any other individual APH Components.
9.4.1.2 Collective Aliphatic/Aromatic Hydrocarbon Ranges: RRFs are calculated for C5-C8
aliphatic hydrocarbons and C9-C12 aliphatic hydrocarbons based upon a correlationbetween the TOTAL concentration of aliphatic APH Components eluting within the rangeof interest and the total ion area count. An RRF is calculated for C9-C10 aromatichydrocarbons based upon a correlation between the TOTAL concentration of aromatic

Air-Phase Petroleum Hydrocarbons (APH), Rev1 Page 12 FinalMassachusetts DEP December 2009
APH Components eluting within this range and the total area count of extracted ions 120and 134. Specified APH Components are designated marker compounds to define thebeginning and end of the hydrocarbon ranges (see Table 4).
9.4.2 Primary (quantitation) and secondary extracted ions for all APH Components and therecommended internal standards are provided in Table 5. The recommended internal standardsused for quantitation of each Target APH Analyte and hydrocarbon range are provided in Table 6.A listing of the hydrocarbon range compounds used to establish response factors for eachhydrocarbon range of interest and their individual component concentration (µg/m3) is provided inTable 3a.
Initial Calibration
The use of RRFs is the preferred approach to determine the relationship between the detectorresponse and the analyte and collective range concentrations for the APH Method. It is alsopermissible to utilize linear or non-linear regression (see Section 9.4.11.1). The linear regressionapproach for APH target analytes and collective ranges is described in Appendix 6. Detailedguidance regarding the use of a non-linear regression calibration model, may be found in SW-846Method 8000B, Section 7.5.3.
NOTE: A sample calculation demonstrating the proper application of the equations shown in thefollowing sections is presented in Appendix 5, APH METHOD CALCULATIONS.
9.4.3 In all but the most extreme cases, an initial calibration is performed using a minimum of fivedifferent concentrations prepared using various volumes of the APH working standards.Recommended range and target analyte calibration standard concentrations are provided in Tables3a and 3b, respectively. If non-linear (quadratic) regression is used under the circumstancesdescribed in Section 9.4.11.1, a minimum of six (6) calibration concentrations must be used. Ineither case, the calibration concentrations must be evenly dispersed over the full working range ofthe detector with the lowest calibration point corresponding to the target RL.
9.4.4 Analyze each Calibration standard according to the procedures specified in Sections 9.1 and 9.2.
9.4.5 Target APH Analytes - Tabulate the area response of the primary (or quantitation) ions against theconcentration for each Target APH Analyte and internal standard, and calculate an RRF for eachcompound using Equation 1. Perform this calculation for each Target APH Analyte.
Equation 1: Relative Response Factor for Target APH Analytes
where:
RRF = relative response factorAEC = area count of the primary (quantitation) ion for the analyte of interestCI = concentration of the associated internal standard (µg/m3): See Sec. 7.5AEI = area count of the primary (quantitation) ion for the associated internal
standardCC = concentration of analyte of interest (µg/m3): refer to last column of
Table 3b
9.4.6 Hydrocarbon Ranges - Establish retention time windows for the hydrocarbon ranges using theAPH Component marker compounds shown in Table 4.
9.4.7 Calculate an RRF for the C5-C8 aliphatic hydrocarbon range using the following steps.
RRF A C A CEC I EI c [( ) *( )] / [( ) *( )]

Air-Phase Petroleum Hydrocarbons (APH), Rev1 Page 13 FinalMassachusetts DEP December 2009
9.4.7.1 Using total ion integration, sum the individual peak areas of the six APH Componentsthat are used to establish an average range RRF for C5-C8 aliphatic hydrocarbons, asdesignated in Table 3a. Do not include the peak areas of internal standards (all of therecommended internal standards elute in this range).
9.4.7.2 Using the total area generated in Section 9.4.7.1, calculate the C5-C8 aliphatichydrocarbon range RRF using Equation 2.
Equation 2: Relative Response Factor for C5-C8 Aliphatic Hydrocarbons
where:
AT = total ion area count of the six aliphatic APH Components which elutewithin this range (see Table 3a)
CT = summation of the concentrations of the six aliphatic APH Components(µg/m3) which elute within this range: refer to the last column of Table3a
9.4.8 Calculate an RRF for the C9-C12 aliphatic hydrocarbon range using the following steps.
9.4.8.1 Using total ion integration, sum the individual peak areas of the six APH Componentsthat are used to establish an average range RRF for C9-C12 aliphatic hydrocarbons, asdesignated in Table 3a. Do not include the peak area of BFB.
9.4.8.2 Using the total area generated in Section 9.4.8.1, calculate the C9-C12 hydrocarbon rangeRRF using Equation 3.
Equation 3: Relative Response Factor for C9-C12 Aliphatic Hydrocarbons
9.4.9 Calculate an RRF for the C9-C10 aromatic hydrocarbon range using the following steps.
9.4.9.1 Using extracted ion m/e 120, sum the individual peak areas of the five APH Componentsthat are used to establish an average range RRF for C9-C10 aromatic hydrocarbons, asdesignated in Table 3a.
9.4.9.2 Using extracted ion m/e 134, sum the individual peak areas of the five APH Componentsthat are used to establish an average range RRF for C9-C10 aromatic hydrocarbons, asdesignated in Table 3a.
9.4.9.3 Sum the area counts from Sections 9.4.9.1 and 9.4.9.2.
9.4.9.4 Using the area count generated in 9.4.9.3, calculate the C9-C10 aromatic range RRF usingEquation 4.
Equation 4: Relative Response Factor for C9-C10 Aromatic Hydrocarbons
where:
AT = summation of area counts for extracted ions 120 and 134 for the fivearomatic APH Components which elute within this range (see Table3a)
Range )](*)/[()](*)[( TEIIT CACARRF
Range )](*)/[()](*)[( TEIIT CACARRF
Range )](*)/[()](*)[( TEIIT CACARRF

Air-Phase Petroleum Hydrocarbons (APH), Rev1 Page 14 FinalMassachusetts DEP December 2009
CT = summation of the concentrations of the five aromatic APH Components(µg/m3), which elute within this range: refer to the last column of Table3a
9.4.10 Calculate the average RRF for each of the Target APH Analytes and each hydrocarbon range.
9.4.11 Calculate the percent relative standard deviation (%RSD) of the RRFs over the working range ofthe curve for each of the Target APH Analytes and each hydrocarbon range using Equation 5.
Equation 5: Percent Relative Standard Deviation
where:
%RSD = percent relative standard deviationSDn-1 = standard deviation (n-1 degrees of freedom)AVGx = average RRF from the initial calibration curve
9.4.11.1 If the %RSD is 30, linearity can be assumed for the associated Target APH Analyte orhydrocarbon range. For naphthalene, the %RSD can be 40.
If, under extenuating analytical circumstances (e.g., extending the RL beyond the expectedlinear range of the detector, difficult analytes with non-linear mass/response ratios), the%RSD criteria specified in Section 9.4.11.1 cannot be achieved, then a linear (leastsquares) or non-linear (quadratic) regression may be used to generate a calibration curveconsistent with the guidance provided in SW-846 Method 8000B, Sections 7.5.2 and7.5.3. Use of the non-linear calibration alternative must be documented in thelaboratory narrative.
NOTE: It is not the intent of this alternative calibration approach to allow for a non-linear calibration model to be used to compensate for detector saturation or toavoid proper instrument maintenance. As such, non-linear regression must notbe employed for analytes that consistently met %RSD criteria specified inSection 9.4.11.1 in previous calibrations.
9.4.11.2 In order for the linear or non-linear regression model to be used for quantitative purposes, r(Correlation Coefficient) or r2 (Coefficient of Determination) must be greater than or equalto 0.99. In addition, the resulting calibration curve from the linear or non-linear regressionmust be verified by recalculating concentrations of the target analytes and hydrocarbonranges in the lowest calibration standard using the final calibration equation. Recoveriesmust be 70-130% (except naphthalene 60-140%).
If recalculated concentrations from the lowest calibration standard are outside 70-130%(or 60-140% for naphthalene) recovery range, either:
Report the RL as an estimated value, or
Raise the RL to the concentration of the next highest calibration standard that exhibitsacceptable recoveries when recalculated using the final calibration equation.
9.4.11.3 The statistical considerations in developing non-linear calibration curves require moredata than the linear calibration approach. As described in Section 9.4.3, the linearregression model requires five equally distributed calibration concentrations for initialcalibration while the non-linear regression model requires a minimum of six equallydistributed calibration concentrations.
For the linear or non-linear regression calculation, the origin (0,0) can not be included asa calibration point.
100*)]/()[(% 1 Xn AVGSDRSD

Air-Phase Petroleum Hydrocarbons (APH), Rev1 Page 15 FinalMassachusetts DEP December 2009
9.4.11.4 For any calibration model, the concentration of the lowest initial calibration standard,adjusted for sample size, dilution, etc., establishes the method RL.
9.4.12 The initial calibration must be verified through the analysis of an LCS. This analysis must beperformed every time an initial calibration is performed and prior to sample analyses on a dailybasis.
9.4.12.1 The LCS must be prepared in a certified-clean canister from a different stock standardthan that used to prepare the calibration standard. The LCS should be prepared at a mid-range calibration curve concentration.
9.4.12.2 At a minimum, the LCS must contain 1,3-butadiene, benzene, toluene, ethylbenzene, m-xylene, p-xylene, o-xylene, and naphthalene, and at least one compound from eachhydrocarbon range (recommended representative range compounds: heptane for C5-C8
aliphatics, decane for C9-C12 aliphatics, and 1,3,5-trimethylbenzene for C9-C10 aromatics).The concentration of the representative range compounds must be greater than the lowestsummed range concentration in Table 3a (suggest using 20-50 µg/m3).
9.4.12.3 Calculate the percent recovery of each Target APH Analyte and hydrocarbon range usingEquation 6. Percent recoveries must be between 70-130% for target analytes except fornaphthalene, which must exhibit percent recoveries between 50-150%.
Equation 6: Percent Recovery
where:
%R = Percent RecoveryCfound = Concentration of the analyte or hydrocarbon range detected in the LCS
(µg/m3)Ctrue = True concentration of the analyte or hydrocarbon range in the LCS
(µg/m3)
Continuing Calibration
9.4.13 A continuing calibration check must be performed daily prior to sample analysis. It should benoted that the Percent Differences (%Ds) are calculated (Equation 7) when RRFs are used for theinitial calibration and Percent Drifts (Equation 6-5, Appendix 6) are calculated when calibrationcurves using linear or non-linear regression are used for the initial calibration.
9.4.14 The concentration of the APH Calibration Check Standard must be near the midpoint of thecalibration curve.
9.4.15 Calculate the RRF for each APH Target analyte and hydrocarbon range from the CalibrationCheck Standard using Equations 1 through 4.
9.4.15.1 Calculate the %D of the Calibration Check Standard RRF from the initial calibrationaverage RRF using Equation 7.
Equation 7: Percent Difference
where:
%D = Percent DifferenceRRFC = RRF from the APH Calibration Check Standard
100*)]/[()]()[(% IIC RRFRRFRRFD
% [( ) / ( )]*R C Cfound true 100

Air-Phase Petroleum Hydrocarbons (APH), Rev1 Page 16 FinalMassachusetts DEP December 2009
RRFI = average RRF from the initial calibration curve
9.4.16 The %D or Percent Drift for each APH Target analyte and hydrocarbon range must be ≤30. Ifmore than one compound fails to meet the applicable criterion, or if the %D or Percent Drift forany one compound is greater than 50, the instrument must be recalibrated. Otherwise, sampleanalysis may proceed.
Retention Time Windows
9.4.17 The range retention time windows must be established daily based upon the retention time of themarker compounds in the APH Calibration Check Standard. The marker compounds used foreach range are defined in Table 4.
Daily GC/MS Performance Check
9.4.18 A check of the GC/MS tuning must be performed daily prior to sample analyses. The GC/MSsystem is checked to confirm that acceptable performance criteria for mass spectral ion abundanceratios are met for BFB. These criteria must be met prior to analyzing any additional standards,blanks and samples.
9.4.19 Performance criteria for the required tuning standard, BFB, are provided in Table 2. If the tuningcriteria are not met, the GC/MS must be retuned and the analysis repeated.
9.5 GC/MS Analysis of Samples
9.5.1 Pre-concentrate the pre-established nominal volume of sample (typically 0.25 liters) on theconcentrator and inject it onto the GC column. When the nominal volume of the sample isanalyzed, the dilution factor is 1.0.
Dilution Factors and Sub-Atmospheric Samples
9.5.1.1 For dilutions, sample volumes smaller than the nominal volume can be analyzed. Thesmallest volume used should not be less than that used for the initial calibration. SeeSection 7.4.3 for further instructions on sample volumes. When volumes less than thenominal sample volume are analyzed, the dilution factor is calculated as follows:
DF = nominal sample volume/actual volume analyzed
9.5.1.2 For more concentrated samples where analysis of smaller volumes will not be adequate toensure concentrations are within the calibration range, the canister must be pressurizedand an aliquot of sample removed and injected into another canister. The dilution factoris calculated using the following steps:
1. Calculate the dilution factor (DF1) due to the pressurization of the sample usingEquation 8 below.
2. Calculate the dilution factor (DF2) of the prepared sample:
DF(2) = DF(1) * volume of sample removed from original canistervolume of new canister
3. Calculate the final dilution factor:
DF = DF(2)* (nominal sample volume/actual volume analyzed)

Air-Phase Petroleum Hydrocarbons (APH), Rev1 Page 17 FinalMassachusetts DEP December 2009
9.5.1.3 Samples which arrive at the laboratory with a high vacuum (i.e., > 15 in. Hg) must bepressurized with ultra zero air or UHP nitrogen. The laboratory may also choose topressurize all canisters upon receipt. This pressurization results in sample dilution. Theresultant dilution factor is calculated using Equation 8.
Equation 8: Dilution Factor for Pressurization of Subatmospheric Samples
where:
Pi = pressure reading of canister prior to pressurization (units = psig)Pf = pressure reading of canister after pressurization (units = psig)DF = dilution factor
Note: To convert from in. Hg to psig:
psig = in. Hg * 0.491159
9.5.2 Identification of APH Target Analytes
The Target APH analytes in field samples must be identified by a qualified mass spectrometrist competentin the interpretation of chromatograms and mass spectra.
9.5.2.1 The laboratory must report all APH target analytes that meet the following criteria:
(1) The relative retention time (RRT) of the target analyte in the sample agrees with theRRT of the target analyte in the associated Calibration Check Standard within + 0.33minutes; and
(2) The relative intensities of the primary (quantitation) and secondary ions (Table 5) forthe target analyte in the sample agree within 20% of the relative intensities of thesame ions in the Calibration Check Standard.
9.5.2.2 If co-elution of interfering components prohibits accurate identification of the samplecomponent RRT from the total ion chromatogram, the RRT should be assigned usingextracted ion current profiles for the ion unique to the component of interest.
9.5.2.3 If the above-referenced criteria are met but in the analyst’s opinion a false positive resultis suspected, this must be reported and explained in the laboratory narrative.
9.5.2.4 For comparison of the target analyte’s mass spectra between samples and standards, massspectra of standards obtained on the GC/MS under the same instrument conditions arerequired (e.g., from the calibrations). Once obtained, these standard spectra must be usedfor identification and reference purposes.
9.6 Calculations
The concentration of Target APH Analytes and hydrocarbon ranges in a sample may be determined from thepeak area response, using the RRF determined in Section 9.4. If linear regression was used for calibration,refer to Appendix 6 for sample concentration calculations. If non-linear regression was used, refer to SW-846 Method 8000B, Section 7.5.3 for guidance. Use of non-linear regression for concentrationcalculations must be reported in the laboratory narrative.
9.6.1 Individual Target APH Analytes: The average response factor from the initial calibration is usedto calculate the concentration of an analyte detected in the sample. Equation 9 is used to calculatethe concentration of Target APH Analytes in µg/m3. Equation 10 is used to convert g/m3 toppbV.
DF=(Pf + 14.7)/(Pi + 14.7)

Air-Phase Petroleum Hydrocarbons (APH), Rev1 Page 18 FinalMassachusetts DEP December 2009
Equation 9: Calculation of Sample Concentration (g/m3)-
where:
Cx= concentration of target analyte, µg/m3
Ax = area of primary (quantitation) ion for the Target APH Analyte (seeTable 5)
CIS = concentration of the associated internal standard, µg/m3: See Section7.5
AIS = area of primary (quantitation) ion for the associated internal standard(see Table 5)
RRFavg = average RRF for the Target APH analyte to be measuredDF = dilution factor (See Section 9.5.1)
Equation 10: Conversion of g/m3 to ppbV
where:
MW = molecular weight of the compound of interest, g/mol (see Table 1 for alist of the molecular weights of the Target APH Analytes)
24.45 = molar gas constant; assumes R = 0.08206 L-atm/mole-K, T = 298K andP = 1 atm
9.6.1.1 The integration of Target APH Analytes and internal standards must be performed fromvalley to valley.
9.6.2 Hydrocarbon Ranges
When calculating the APH Method aliphatic and aromatic hydrocarbon range concentrations, thelaboratory must include the area of all peaks eluting within the retention time windows specifiedfor these ranges, excluding internal standards and target analytes, as described in Sections 9.6.2.1,9.6.2.2, and 9.6.2.3 below.
The average hydrocarbon range RRF from the initial calibration is used to calculate theconcentration (µg/m3) of hydrocarbon ranges in samples. Collective peak area integration forthe hydrocarbon ranges must be from baseline (i.e., must include the unresolved complexmixture).
NOTE: Hydrocarbon range concentrations can only be reported in µg/m3.
At the discretion of the data user, the contribution of non-APH compounds (compounds notmeeting the definitions in Sections 3.1.9, 3.1.10 and 3.1.11) that elute within the method-definedretention time windows for the aliphatic and aromatic ranges may be excluded from collective rangeconcentration calculations. Specifically, the total ion area counts (aliphatic ranges) and the 120/134m/e area counts (aromatic range) for these non-APH compounds may be excluded providing thecompound is positively identified by GC/MS. However, if the non-APH compound co-elutes withan aliphatic petroleum hydrocarbon, the total ion area count cannot be subtracted from the range. Inaddition, in complex sample matrices (i.e., many co-eluting peaks, complex petroleum patterns), thistype of data adjustment may not be possible. All data adjustments and the presence of these non-APH compounds must be disclosed on the laboratory report form and laboratory narrative. A listof common non-APH compounds that elute within the aliphatic and aromatic ranges is presented inTable 7.
DFRRFACACx avgISISx *)](*)/[()](*)[(
MWCxppbV /45.24*

Air-Phase Petroleum Hydrocarbons (APH), Rev1 Page 19 FinalMassachusetts DEP December 2009
Detailed guidance regarding the identification criteria for these non-APH compounds is presented inSection 11.2.
9.6.2.1 C5-C8 Aliphatic Hydrocarbons
Using total ion integration, sum all peaks in the appropriate retention time window, asspecified in Section 9.3 and Table 4.
From this sum, subtract the total ion area counts of all internal standards which elute in thisrange (all of the recommended internal standards elute in this range).
Calculate a preliminary concentration in µg/m3 using Equation 11.
Equation 11: Calculation of Preliminary Sample Concentration (µg/m3)
where:
Cx= concentration of hydrocarbon range, µg/m3
Ax = C5-C8 aliphatics: total ion area count of all peaks eluting withinaliphatic hydrocarbon range window (excluding the internal standards)
CIS = concentration of the associated internal standard (µg/m3): See Section7.5
AIS = area count of the primary (quantitation) ion for the associated internalstandard
RRFavg = average RRF for the hydrocarbon range of interest
From the preliminary concentration (µg/m3), calculate an adjusted concentration of C5-C8
aliphatic hydrocarbons by subtracting the concentrations of target APH analytes, which elutein this range (typically MTBE, benzene, toluene, ethylbenzene, and m-, p- & o- xylenes forthe C5-C8 aliphatic hydrocarbons).
9.6.2.2 C9-C10 Aromatic Hydrocarbons
Using extracted ion 120, sum all peaks in the appropriate retention time window, as specifiedin Section 9.3 and Table 4.
Using extracted ion 134, sum all peaks in the appropriate retention time window, asdetermined in Section 9.3 and Table 4.
Sum the area counts of extracted ions 120 and 134 from the above two steps.
Calculate the concentration in µg/m3 using Equation 11, using the summed areas of extractedions 120 and 134 for Ax.
9.6.2.3 C9-C12 Aliphatic Hydrocarbons
Using total ion integration, sum all peaks in the appropriate retention time window, asspecified in Section 9.3 and Table 4.
From this sum, subtract the total ion area count of the BFB peak.
Calculate a preliminary concentration in µg/m3 using Equation 11, using the area countgenerated from the previous step for Ax.
From the preliminary concentration, calculate an adjusted concentration of C9-C12 aliphatichydrocarbons by subtracting the concentrations of target APH analytes, which elute in this
)](*)/[()](*)[( avgISISx RRFACACx

Air-Phase Petroleum Hydrocarbons (APH), Rev1 Page 20 FinalMassachusetts DEP December 2009
range (possibly naphthalene depending on GC conditions), and by subtracting out theconcentration of C9-C10 aromatic hydrocarbons.
10.0 QUALITY CONTROL
10.1 General Requirements and Recommendations
10.1.1 Each laboratory that uses this method is required to operate a formal quality control program. Theminimum requirements of this program consist of an Initial Demonstration of LaboratoryCapability (IDLC) and an ongoing analysis of prepared QC samples to evaluate and document thequality of data. The laboratory must maintain records to document the quality of the dataproduced. Ongoing data quality checks are compared with established performance criteria todetermine if the results of analyses meet the performance standards for the method.
10.1.2 At a minimum, for each analytical batch (every 24 hours), an Initial Calibration or Calibration CheckStandard, LMB, LCS, and a Matrix Duplicate must be analyzed. The Initial Calibration orCalibration Check Standard, LMB, and LCS must be analyzed prior to samples.
10.1.3 The recommended sequence of analysis is as follows:
(1) Analytical batch calibration standards (initial) or mid-range Calibration CheckStandard (daily check of initial calibration), either of which are used to evaluate BFBfor GC/MS tuning. [REQUIRED]
(2) Analytical batch LCS. [REQUIRED](3) Analytical batch LMB. [REQUIRED](4) Batch samples (up to 20).(5) Matrix Duplicate. [REQUIRED]
All analytical sequences and data must be recorded in a daily run log.
10.2 Minimum Instrument QC
10.2.1 Internal standards
10.2.1.1 Internal standards must be adequately resolved from individual compounds in the APHCalibration standard. A minimum separation requirement of 50% (maximum peak heightto valley height) must be met, particularly for hexane and bromochloromethane (IS1) in a20 µg/m3 calibration standard.
10.2.1.2 Internal standard recoveries must be evaluated with each field sample, blank, LCS andSample Duplicate. The internal standard area counts in each field sample, blank, andLCS must be evaluated. The internal standard area counts must be within 50-200% of theinternal standard area counts in the corresponding Calibration Check Standard. If theinternal standard area counts fall outside of this range, check calculations to locatepossible errors, check the sample introduction system for leaks or other malfunctions, andcheck for changes in instrument performance. If the cause cannot be determined,reanalyze the sample unless one of the following exceptions applies:
(1) Obvious interference is present on the chromatogram (e.g., unresolved complexmixture).
(2) The internal standard exhibits high recovery and associated target analytes orhydrocarbon ranges are not detected in the sample.
If a sample with an internal standard recovery outside of the acceptable range is notreanalyzed based on any of these aforementioned exceptions, this information must benoted on the data report form and discussed in the laboratory narrative.

Air-Phase Petroleum Hydrocarbons (APH), Rev1 Page 21 FinalMassachusetts DEP December 2009
Analysis of the sample on dilution may diminish matrix-related internal standard recoveryproblems. This approach can be used as long as RLs less than or equal to the applicable MCPstandards will still be achieved with the dilution. If not, reanalysis without dilution must beperformed, unless the concentrations of target analytes do not allow an undiluted run.Recoveries of internal standards outside of the acceptable range after re-analysis must also benoted on the data report form and discussed in the laboratory narrative.
10.2.2 Mass spectrometer tuning must be performed daily (once every 24 hours) before any analysesare conducted. Acceptance criteria for the recommended tuning standard, BFB, are provided inTable 2.
10.2.3 Laboratory Method Blanks must be analyzed daily (once every 24 hours) prior to sampleanalyses and after samples, which are highly contaminated (i.e., at concentrations above thehighest calibration standard) to determine if sample carryover has occurred. If samples have beenanalyzed using an autosampler, data should be evaluated for potential carryover and reanalysisconducted, as appropriate. The laboratory method blank must be free of target APH analyte andhydrocarbon range contamination at or above the RL. However, C12 hydrocarbons andnaphthalene may be present at up to two times the RL.
10.2.4 Relative Retention Times must be established for each analyte and hydrocarbon range of interesteach time a new GC column is installed and must be verified and/or adjusted on a daily basis.(See Section 9.3).
10.2.5 Calibration
10.2.5.1 Initial Calibration: RRFs must be calculated for each APH target analyte andhydrocarbon range based upon the analysis of a minimum of 5 calibration standards (or 6calibration standards for non-linear regression). With the exception of naphthalene, thelinearity of RRFs may be assumed if the %RSD over the working range of the calibrationcurve is ≤ 30. (See Section 9.4). For naphthalene, the %RSD must be ≤ 40. For linear ornon-linear regression, r or r2, respectively, must be ≥0.99.
10.2.5.2 Calibration Check Standard: The Calibration Check Standard must be analyzed priorto sample analysis to verify the accuracy of the calibration of the instrument. Foranalytes of interest, the %D must be ≤ 30. If more than one compound fails to meet thiscriterion, or if the %D for any one compound is greater than 50, the instrument must berecalibrated. Otherwise, sample analysis may proceed.
10.2.6 Laboratory Control Samples must be analyzed daily (once every 24 hours) prior to sampleanalyses. Recoveries of APH target analytes and representative aliphatic and aromatic rangecompounds must be between 70 and 130% (or 50-150% for naphthalene).
If the recoveries are low and outside of the acceptance limits, reanalyze the LCS andassociated samples. If still outside of the acceptance limits, recalibrate.
If the recoveries are high and outside of the acceptance limits and the affected compoundwas detected in the associated samples, reanalyze the LCS and the associated samples. Ifrecoveries are still outside of the acceptance limits, recalibrate.
If the recoveries are high and sample results were nondetect, data can be reported withoutqualification; however, the high recoveries should be noted in the laboratory narrative.
10.2.7 Matrix Duplicate - One matrix duplicate must be analyzed once every 24 hours per matrix.Matrix duplicates are prepared by analyzing one sample in duplicate. The purpose of the matrixduplicates is to determine the homogeneity of the sample matrix as well as analytical precision.Equation 12 is used to calculate the RPD of the target APH analyte and hydrocarbon rangeconcentrations. The RPD of detected results in the matrix duplicate samples must not exceed 30when the results are >5x the RL.

Air-Phase Petroleum Hydrocarbons (APH), Rev1 Page 22 FinalMassachusetts DEP December 2009
If the RPD exceeds 30 and both results are >5x the RL, the sample analysis must be repeated.
If an analyte is detected in one analysis at >5x the RL and not detected in the duplicateanalysis, the analysis must be repeated.
If an analyte is detected in one analysis at ≤5x the RL and not detected in the duplicateanalysis, the RPD is not calculable and the analysis does not have to be repeated.
If an analyte is not detected in both the original and duplicate analyses, the RPD is notcalculable. No further action is required.
Equation 12. Relative Percent Difference Calculation:
where:
Cs = concentration in original sample analysisCd = concentration in duplicate sample analysis
10.3 If any of the performance standards specified in Section 10.2 are not met, the cause of the non-conformancemust be identified and corrected before any additional samples may be analyzed. Any samples run betweenthe last QC samples that met the criteria and those that are fallen out must be rerun. These QC samplesinclude the Calibration Check Standard, LMB and LCS. If this is not possible, that data must be reported assuspect.
10.4 Initial and Periodic Method QC Demonstrations
The procedure specified below must be conducted, successfully completed and documented as an IDLC prior tothe analysis of any samples by the APH Method. Subsequent to this initial demonstration, additionalevaluations of this nature should be conducted on a periodic basis, in response to changes in instrumentation oroperations, training new analysts, and/or in response to confirmed or suspected systems, method, or operationalproblems.
The IDLC includes an initial demonstration of accuracy and precision. The following procedure must be used:
10.4.1 Analyze a minimum of four (4) replicate samples of a Calibration Check Standard.
10.4.2 Calculate the measured concentrations of each analyte and hydrocarbon range in all replicates, themean accuracy (as a percentage of the true value) for each analyte and hydrocarbon range, and theprecision (as %RSD) of the measurements for each analyte and hydrocarbon range.
10.4.3 For each analyte and hydrocarbon range, the mean accuracy, expressed as a percentage of the truevalue (i.e., recovery), must be between 70% and 130%, and the replicate precision, expressed as%RSD, must be ≤25. The IDLC must meet these conditions for analysis to proceed.
NOTE: Method detection limit (MDL) studies are not required to be performed for the APH method.
11.0 DATA PRODUCTION AND REPORTING
11.1 General Reporting Requirements
11.1.1 The required data report content for the APH Method is presented in Appendix 3. While it ispermissible to alter the form and presentation of the data, all of the information must be providedin a clear, concise, and succinct manner. This information provides data users with a succinct andcomplete summary of pertinent information and data, as well as a clear affirmation that the QCprocedures and standards specified in this method were evaluated and achieved.
100*]]2/)/[()[( dsds CCCCRPD
Air-Phase Petroleum Hydrocarbons (APH), Rev1 Page 23 FinalMassachusetts DEP December 2009
11.1.2 If a significant modification to the APH Method is utilized, an attachment to the analytical reportmust be included to demonstrate compliance with the method performance requirements ofSection 1.9 on a matrix-specific and petroleum product-specific basis.
“Significant Modifications” to the APH Method shall include, but are not limited to, any of thefollowing:
(1) The use of sample collection devices other than evacuated, passivated stainless steelcanisters (i.e., Tedlar bags).
(2) The use of alternative detectors other than GC/MS to quantify target APH analytesand/or hydrocarbon range concentrations.
(3) The use of extracted ions other than 120 and 134 to quantify C9-C10 aromatichydrocarbons.
(4) The failure to provide all of the data and information required in the report formpresented in Appendix 3.
Data produced using an analytical method incorporating any of the “Significant Modifications”described above may not be reported as APH data. APH range concentrations are method-definedparameters and as such may only be reported as APH data when produced using the method without“Significant Modifications.”
11.1.3 Positive affirmation that all required QA/QC procedures and performance standards were followedand achieved means that all of the required steps and procedures detailed in Sections 9.0 and 10.0have been followed, and that all data obtained from these steps and procedures were within theacceptance limits specified for these steps and procedures.
11.1.4 In addition to sample results, the APH data report must contain the following items:
LMB results.
LCS results.
Matrix duplicate results.
Internal standard results (for all field samples and QC samples).
Results of re-analyses or dilutions must be reported as follows:
(1) If re-analysis due to internal standard issues yields similar non-conformances, thelaboratory must report both results.
(2) If re-analysis due to internal standard issues is performed outside of holding timeand yields acceptable internal standard recoveries, the laboratory must reportresults of both analyses.
(3) If sample is not re-analyzed for internal standard issues due to obviousinterference, the laboratory must provide the chromatogram in the data report.
(4) If diluted and undiluted analyses are performed, the laboratory must report resultsfor the lowest dilution within the valid calibration range for each analyte. Theassociated QC (e.g., method blanks, LCS, etc.) for each analysis must be reported.This may result in more than one analysis per sample being reported.
If a significant modification to the analytical method is utilized, demonstration ofcompliance with analytical performance standards specified in Section 1.9 on a matrix-specific and petroleum product-specific basis must be included as an attachment to theanalytical report. If the modification was not an analytical modification (e.g., use oftedlar bags), the demonstration of compliance is not required; however, themodification must be noted in the laboratory narrative.
11.1.5 General laboratory reporting requirements are outlined in WSC-CAM-VII A, Quality Assuranceand Quality Control Guidelines for the Acquisition and Reporting of Analytical Data.

Air-Phase Petroleum Hydrocarbons (APH), Rev1 Page 24 FinalMassachusetts DEP December 2009
11.2 Reporting Requirements for Non-APH Compounds
As described in Section 9.6.2, the contribution (i.e., area count) of compounds not meeting the regulatorydefinition of the aromatic and/or aliphatic hydrocarbons, defined in Sections 3.1.9, 3.1.10 and 3.1.11, that elutewithin the method-defined retention time windows for these hydrocarbon ranges, may be excluded fromcollective range concentrations at the discretion of the data user, providing the compound meets therequirements for positive GC/MS identification as described in Section 11.2.1.
If the non-APH compound co-elutes with an aliphatic petroleum hydrocarbon, the total ion areacount may not be subtracted from the aliphatic range.
In complex sample matrices (i.e., many co-eluting peaks, complex petroleum patterns), this typeof data adjustment may not be possible.
All data adjustments and the presence of these positively identified non-APH compounds must be disclosed onthe laboratory report form and laboratory narrative. If this data adjustment is requested by the data user, thelaboratory will be required to evaluate those peaks with a peak height ≥ ½ of the peak height of the closestinternal standard. Refer to Table 7 for a list of common non-APH compounds that elute within the aliphatic andaromatic hydrocarbon ranges.
11.2.1 Requirements for Positive GC/MS Identification of Non-APH Compounds:
Spectral identification must be evaluated by a qualified mass spectrometrist.
The spectral library match must be 85% for an identification to be made.
The major ions in the reference spectrum (i.e., ions greater than 10% of the most abundant ion)should be present in the sample spectrum.
The relative intensities of the major ions should agree within 20%.
Molecular ions present in the reference spectrum should be present in the sample spectrum.
Ions present in the sample spectrum but not in the reference spectrum should be reviewed forpossible background contamination or for the presence of co-eluting compounds.
Ions present in the reference spectrum but not in the sample spectrum should be reviewed forpossible subtraction from the sample spectrum because of background contamination or co-eluting peaks.
Structural isomers that produce very similar mass spectra can be explicitly identified only if theyhave sufficiently different chromatographic retention times. Acceptable resolution is achieved ifthe height of the valley between two peaks is less than 25% of the average height of the twopeaks. Otherwise, structural isomers are identified as isomeric pairs (as a mixture of twoisomers).
NOTE: The analyst may use professional judgment for the identification of non-APHcompounds. If non-APH compounds are identified using criteria different than thecriteria listed above, this should be disclosed in the laboratory narrative.
If the data user determines that the presence of the non-APH compound reported by thelaboratory may appreciably increase the overall risk posed by the site or the utility/cost of thepotential remedial measures under consideration, additional analytical work is recommended toverify the identification and/or concentration of the reported non-APH compound, either byreanalysis or resampling. This contingency will require additional coordination andcommunication between the laboratory and the data user.
12.0 REPORTING LIMITS
The RLs for Target APH Analytes and hydrocarbon ranges will be determined as follows.
12.1 Target APH Analyte RLs
The RLs for the Target APH Analytes shall be based upon the concentration of the lowest calibrationstandard for the analyte of interest. The RL must be greater than or equal to the concentration of the lowestcalibration standard.

Air-Phase Petroleum Hydrocarbons (APH), Rev1 Page 25 FinalMassachusetts DEP December 2009
Example: Benzene:
Lowest calibration standard concentration = 2 µg/m3
RL for benzene = 2 µg/m3
12.2 C9-C10 Aromatic Hydrocarbons
The RL for the C9-C10 aromatic hydrocarbons range is determined empirically and is based upon theconcentration of the lowest range calibration standard for the components which make up this range. The RLis calculated by multiplying the concentration of the lowest calibration standard by the number of APH rangecomponent compounds used in the calibration of the range.
Example: C9-C10 aromatic hydrocarbons:
Lowest calibration standard concentration = 2 µg/m3
Number of APH components in this range = 5 Total concentration of lowest calibration standard = 2 µg/m3 * 5 = 10 µg/m3
RL for C9-C10 aromatic hydrocarbons = 10 µg/m3
12.3 C5-C8 and C9-C12 Aliphatic Hydrocarbons
The RLs for the C5-C8 aliphatic and C9-C12 aliphatic hydrocarbons range are determined empirically and arebased upon the concentration of the lowest range calibration standard for the components which make upthese ranges. The RLs are calculated by multiplying the concentration of the lowest calibration standard bythe number of APH range component compounds used in the calibration of these ranges.
Example: C5-C8 aliphatic hydrocarbons:
Lowest calibration standard concentration = 2 µg/m3
Number of APH components in this range = 6 Total concentration of lowest calibration standard = 2 µg/m3 * 6 = 12 µg/m3
RL for C5-C8 aliphatic hydrocarbons = 12 µg/m3
NOTE: The empirical determination of RLs for the aliphatic and aromatic hydrocarbon ranges is supported by pastMDL studies performed by laboratories. Appendix 1 summarizes the results of MDL studies performed by fivedifferent laboratories for the hydrocarbon ranges. In all cases, the calculated RLs (3x the MDL) were below or closeto the empirically determined RLs above.
13.0 METHOD PERFORMANCE
MDL study results from five laboratories for APH Method aliphatic and aromatic hydrocarbon ranges are provided inAppendix 1. An example APH Method chromatogram is provided in Appendix 2.
14.0 REFERENCES
(1) ENSR, 1999: Laboratory Method Validation Study for the Determination of Volatile Petroleum Hydrocarbonsin Indoor Air, ENSR Corporation, June 1999.
(2) EPA, 1987: Compendium of Methods for the Determination of Toxic Organic Compounds in Ambient Air, USEPA, EPA-600/4-84-041, 1987. Research Triangle Park, NC.
(3) MassDEP, 1994: Interim Final Petroleum Report: Development of Health-Based Alternative to the TotalPetroleum Hydrocarbon (TPH) Parameter, Massachusetts Department of Environmental Protection, August1994.
(4) MassDEP, 1998: Report on Results of the Fall 1997 VPH/EPH Round Robin Testing Program, MassachusettsDepartment of Environmental Protection, January 12, 1998.

Air-Phase Petroleum Hydrocarbons (APH), Rev1 Page 26 FinalMassachusetts DEP December 2009
(5) MassDEP, 2002a: Indoor Air Sampling and Evaluation Guide, Massachusetts Department of EnvironmentalProtection, WSC Policy # 02-430, April 2002.
(6) MassDEP, 2002b: Characterizing Risks Posed by Petroleum Contaminated Sites: Implementation of theMADEP VPH/EPH Approach, Massachusetts Department of Environmental Protection, WSC Policy # 02-411,October 31, 2002
.(7) MassDEP, 2003: Updated Petroleum Hydrocarbon Fraction Toxicity Values For VPH/EPH/APH
Methodology, Massachusetts Department of Environmental Protection, November 2003.
(8) MassDEP, 2004: Method for the Determination of Volatile Petroleum Hydrocarbons (VPH), MassachusettsDepartment of Environmental Protection, May 2004.
(9) MassDEP, 2007: Standard Operating Procedure for Indoor Air Contamination, Massachusetts Department ofEnvironmental Protection, SOP BWSC-07-01, August 2007.

Air-Phase Petroleum Hydrocarbons (APH), Rev1 Page 27 FinalMassachusetts DEP December 2009
TABLES

Air-Phase Petroleum Hydrocarbons (APH), Rev1 Page 28 FinalMassachusetts DEP December 2009
Table 1. APH Components
CompoundCAS
NumberBoiling
Point (oC)Mol. Wt.(g/mol)
APHAnalysisFunction
RetentionTime
(minutes)1
ConcentrationConversion2
(ppbV → µg/m3)
1,3-Butadiene 106990 - 4.4 54.09 TA 5.76 2.21
Isopentane 78784 28 72.15 RC/RM 7.27 2.95
Methyl tertiary butyl ether (MTBE) 1634044 55 88.15 TA 9.64 3.61
n-Hexane 110543 69 86.17 RC 10.71 3.53
Benzene 71432 80 78.11 TA 12.37 3.19
Cyclohexane 110827 81 84.16 RC 12.66 3.44
2,3-Dimethylpentane 565593 90 100.20 RC 12.91 4.10
n-Heptane 142825 98 100.20 RC 13.81 4.10
Toluene 108883 111 92.14 TA 15.44 3.77
n-Octane 111659 126 114.23 RC 16.29 4.67
Ethylbenzene 100414 136 106.17 TA 17.28 4.34
2,3-Dimethylheptane 3074713 141 128.26 RC 17.32 5.25
m-Xylene 108383 139 106.17 TA 17.42 4.34
p-Xylene 106423 138 106.17 TA 17.42 4.34
o-Xylene 95476 144 106.17 TA/RM 17.78 4.34
n-Nonane 111842 151 128.26 RC/RM 17.91 5.25
Isopropylbenzene 98828 152 120.20 RC 18.21 4.92
1-Methyl-3-ethylbenzene 620144 161 120.20 RC 18.65 4.92
1,3,5-Trimethylbenzene 108678 165 120.20 RC 18.74 4.92
n-Decane 124185 174 142.28 RC 19.08 5.83
1,2,3-Trimethylbenzene 526738 176 120.20 RC 19.36 4.92
p-Isopropyltoluene 99876 177 134.22 RC 19.35 5.49
Butylcyclohexane 1678939 181 140.27 RC 19.54 5.74
n-Undecane 1120214 196 156.32 RC 20.03 6.39
Naphthalene 91203 218 128.17 TA/RM 21.043 5.24
n-Dodecane 112403 216 170.33 RC/RM 20.923 6.97
1 Results obtained using the RTX-1 column and chromatographic conditions described in Sections 6.3 and 9.2, respectively.2 Conversion factors assume standard temperature and pressure (R = 0.08026 L-atm/mole-K; T = 298K; P = 1 atm).3 The elution order of naphthalene and dodecane may be reversed, depending on the exact chromatographic conditions.
TA- Target Analyte RC - Range Calibration AliphaticRM - Range Marker RC - Range Calibration Aromatic

Air-Phase Petroleum Hydrocarbons (APH), Rev1 Page 29 FinalMassachusetts DEP December 2009
Table 2. BFB Key Ions and Abundance Criteria
Mass Ion Abundance Criteria
50 8.0 to 40.0 percent of m/e 95
75 30.0 to 66.0 percent of m/e 95
95 Base peak, 100 percent relative abundance
96 5.0 to 9.0 percent of m/e 95
173 Less than 2.0 percent of m/e 174
174 50.0 to 120.0 percent of m/e 95
175 4.0 to 9.0 percent of m/e 174
176 93.0 to 101.0 percent of m/e 174
177 5.0 to 9.0 percent of m/e 176

Air-Phase Petroleum Hydrocarbons (APH), Rev1 Page 30 FinalMassachusetts DEP December 2009
Table 3a. Initial Calibration of APH Hydrocarbon Range Components
Calibration StandardPreparation
Component Standard CalibrationConcentration
(based on a 0.25 liter “nominal” samplevolume)Hydrocarbon
Range
HydrocarbonRange CompoundsUsed to EstablishRange Response
Factor
Calib.Level
WorkingStandard
Concentration(µg/m3)
InjectionVolume(mL)*
Individual RangeComponent
Concentration(µg/m3)
HydrocarbonRange Total
Concentration(µg/m3)
Isopentane 1 20 25 2.0 12
n-Hexane 2 20 50 4.0 24
Cyclohexane 3 20 250 20.0 120
2,3-Dimethylpentane 4 500 25 50.0 300
n-Heptane 5 500 125 250 1500
C5-C8 Aliphatic
n-Octane 6 500 250 500 3000
2,3-Dimethylheptane 1 20 25 2.0 12
n-Nonane 2 20 50 4.0 24
n-Undecane 3 20 250 20.0 120
n-Dodecane 4 500 25 50.0 300
Butylcyclohexane 5 500 125 250 1500
C9-C12
Aliphatic
n-Decane 6 500 250 500 3000
Isopropylbenzene 1 20 25 2.0 10
1-Methyl-3-ethylbenzene 2 20 50 4.0 20
1,3,5-Trimethylbenzene 3 20 250 20.0 100
1,2,3-Trimethylbenzene 4 500 25 50.0 250
C9-C10
Aromatic
p-Isopropyltoluene 5 500 125 250 1250
* nominal sample volume for purposes of this calibration is 250 mL** concentration of the individual hydrocarbon range compound multiplied by the total # of hydrocarbon range compounds used to
generate the range response factor
Table 3b. Initial Calibration of APH Target Analytes
APH Target Analytes Level Working Standard Calibration Standard
Concentration(µg/m3)
Volume(mL)* Concentration (µg/m3)
1 20 25 2.0
2 20 50 4.0
3 20 250 20
4 500 25 50
5 500 125 250
1,3-Butadiene
Methyl tertiary butyl ether(MTBE)
Benzene
Toluene
Ethylbenzene
m-Xylene
p-Xylene
o-Xylene
Naphthalene 6 500 250 500
* nominal sample volume for purposes of this calibration is 250 mL

Air-Phase Petroleum Hydrocarbons (APH), Rev1 Page 31 FinalMassachusetts DEP December 2009
Table 4. APH Range Marker Compounds and Range Retention Time Windows
Hydrocarbon Range Beginning Marker Ending Marker
C5-C8 Aliphatic Hydrocarbons 0.1 min. before isopentane 0.01 min. before n-nonane
C9-C12 Aliphatic Hydrocarbons 0.01 min. before n-nonane 0.1 min. after dodecane
C9-C10 Aromatic Hydrocarbons 0.1 min. after o-xylene 0.1 min. before naphthalene

Air-Phase Petroleum Hydrocarbons (APH), Rev1 Page 32 FinalMassachusetts DEP December 2009
Table 5. Primary (Quantitation) & Secondary Ions for APHComponents/Internal Standards
APH Components CAS Number Target APHAnalyte
Primary(Quantitation)
Ion
SecondaryIon(s)
Bromochloromethane (IS #1) 74975 128 49, 130
1,3-Butadiene 106990 54 53, 50
Isopentane 78784 43 42, 41, 57
Methyl tertiary butyl ether (MTBE) 1634044 73 45
n-Hexane 110543 57 41, 43, 56
Cyclohexane 110827 56 84, 41
1,4-Difluorobenzene (IS #2) 540363 114 63
2,3-Dimethylpentane 565593 56 43, 57, 41
Benzene 71432 78 52, 51
n-Heptane 142825 43 71, 57, 100
Toluene 108883 91 92
Chlorobenzene-d5 (IS #3) 3114554 117 119, 82
n-Octane 111659 43 85, 57, 71
2,3-Dimethylheptane 3074713 43 84, 85
Ethylbenzene 100414 91 106
m- & p-Xylene 1330207 91 106, 105
n-Nonane 111842 43 57, 85
o-Xylene 95476 91 106, 105
Isopropylbenzene 98828 105 120
1-Methyl-3-ethylbenzene 620144 105 120
1,3,5-Trimethylbenzene 108678 105 120
n-Decane 124185 57 43, 71, 85
Butylcyclohexane 1678939 83 55, 82
p-Isopropyltoluene 99876 119 105, 134
1,2,3-Trimethylbenzene 526738 105 120
n-Undecane 1120214 57 43, 71, 85
n-Dodecane 112403 57 43, 71, 85
Naphthalene 91203 128
NOTE: All APH Components are listed in Table 5 for reference purposes. Only the RRFs forTarget APH Analytes need to be determined on a compound-specific basis.

Air-Phase Petroleum Hydrocarbons (APH), Rev1 Page 33 FinalMassachusetts DEP December 2009
Table 6. Internal Standards and Associated Target APH Analytes andHydrocarbon Ranges
Bromochloromethane(IS #1)
1,4-Difluorobenzene(IS #2)
Chlorobenzene-d5(IS #3)
1,3-ButadieneMethyl tertiary butyl ether (MTBE)
BenzeneC5-C8 Aliphatics
TolueneEthylbenzene
m-&p-Xyleneso-Xylene
NaphthaleneC9-C12 AliphaticsC9-C10 Aromatics
Table 7. List of Common Non-APH Compounds That Elute Within theAPH Method Ranges
Hydrocarbon Range Potential Non-APH Compounds
C5-C8 AliphaticHydrocarbons
Acetone may co-elute/interfere with isopentane.
Isopropyl alcohol, methyl ethyl ketone, trichloroethene, tetrachloroethene,tetrahydrofuran, hexanal, 1-butanol, hexamethylsiloxane
C9-C12 AliphaticHydrocarbons
Terpenes (e.g., a-pinene, d-limonene), phenol, benzaldehyde, n-chainaldehydes, 2-ethyl-1-hexanol, siloxanes, dichlorobenzenes
C9-C10 AromaticHydrocarbons
Siloxanes, a-pinene, and d-limonene may slightly interfere if present athigh concentrations (contribute to the area of ions 120/134)

Air-Phase Petroleum Hydrocarbons (APH), Rev1 Page 1-1 FinalMassachusetts DEP December 2009
APPENDIX 1APH METHOD DETECTION LIMIT (MDL) STUDIES
Results from five laboratories
MDL MDL MDL
C5-C8 Aliphatics C9-C12 Aliphatics C9-C10 Aromatics
(μg/m3) (μg/m
3) (μg/m
3)
Lab 1 1.8 1.0 0.67
Lab 2 3.7 1.0 0.29
Lab 3 5.7 5.0 1.9
Lab 4 4.6 6.3 1
Lab 5 4.1 4.7 5.9
MDL Calculated RL MDL Calculated RL MDL Calculated RL
C5-C8 Aliphatics C5-C8 Aliphatics C9-C12 Aliphatics C9-C12 Aliphatics C9-C10 Aromatics C9-C10 Aromatics
(μg/m3) (μg/m
3) (μg/m
3) (μg/m
3) (μg/m
3) (μg/m
3)
Lab 1 1.8 5.4 1.0 3 0.67 2.01
Lab 2 3.7 11.1 1.0 3 0.29 0.87
Lab 3 5.7 17.1 5.0 15 1.9 5.7
Lab 4 4.6 13.8 6.3 18.9 1 3
Lab 5 4.1 12.3 4.7 14.1 5.9 17.7
Calculated RL = 3xMDL
MDL studies performed in Fall 2008.

Air-Phase Petroleum Hydrocarbons (APH), Rev1 Page 2-1 FinalMassachusetts DEP December 2009
APPENDIX 2APH METHOD CHROMATOGRAM

Air-Phase Petroleum Hydrocarbons (APH), Rev 1 FinalMassachusetts DEP Page 3 - 1 December 2009
APPENDIX 3REQUIRED APH DATA REPORTING INFORMATION
SAMPLE INFORMATION (check all that apply)
Sample Type(s) q Grab q Time-integrated: î 2 hour î 4 hour î 8 hour î 24 hour î Other:
Sample Container(s) q Canister(s) size: q Other:
Sampling Flow Controller(s) q Mechanical q Fixed-Orifice q Electronic q Other:
Sampling Flow Meter(s) RPD of pre- & post-sampling calibration check(s): q < 20% q > 20%
APH ANALYTICAL RESULTSClient ID
Internal Standards: Lab IDDate CollectedDate ReceivedDate Analyzed
Pre-sample vacuum (field) in. Hg in. HgMS Tuning Standard: Post-sample vacuum (field) in. Hg in. Hg
Lab receipt vacuum in. Hg in. HgDilution Factor
Reporting Limit Sample Results Sample ResultsTarget APH Analytes &Hydrocarbon Ranges g/m3 ppb v/v g/m3 ppb v/v g/m3 ppb v/v
1,3-Butadiene
Methyl tertiary butyl ether (MTBE)
Benzene
Toluene
Ethylbenzene
m- & p- Xylenes
o-Xylene
Naphthalene
C5-C8 Aliphatic Hydrocarbons1, 2 N/A N/A N/A
C9-C12 Aliphatic Hydrocarbons1, 3 N/A N/A N/A
C9-C10 Aromatic Hydrocarbons N/A N/A N/A1Hydrocarbon range data from total ion chromatogram excluding any internal/tuning standards eluting in that range2C5-C8 aliphatic hydrocarbons exclude the concentration of Target APH Analytes eluting in that range3C9-C12 aliphatic hydrocarbons exclude concentration of Target APH Analytes eluting in that range AND concentration of C9-C10 aromatic hydrocarbons
CERTIFICATION
Were all QA/QC procedures REQUIRED by the APH Method followed? Yes No - Details Attached
Were all performance/acceptance standards for required QA/QC procedures achieved? Yes No - Details Attached
Were any significant modifications made to the APH method, as specified in Sect 11.1.2? No Yes - Details Attached
I attest under the pains and penalties of perjury that, based upon my inquiry of those individuals immediately responsible for obtaining the information, the
material contained in this report is, to the best of my knowledge and belief, accurate and complete.
SIGNATURE: ____________________________________________ POSITION: ____________________________________________
PRINTED NAME: ____________________________________________ DATE: ____________________________
(mm/dd/yyyy)

Air-Phase Petroleum Hydrocarbons (APH), Rev 1 FinalMassachusetts DEP Page 4 - 1 December 2009
APPENDIX 4RECOMMENDED SOP FOR CLEANING, CERTIFICATION,AND CALIBRATION OF APH AIR SAMPLING EQUIPMENT
1.0 Canister Cleaning
All canisters must be certified clean and verified as leak free prior to being used for sampling.
1.1 Recommended Equipment and Supplies
Flow Manifold – For attaching canisters and conveying flow during evacuation andflushing.
Flushing Gas Source – Ultra zero air or UHP Nitrogen (compressed cylinder or on-sitesource) with appropriate cleaning media in line to ensure gas cleanliness.
Roughing Pump – For initial evacuation stage.
High Vacuum Pump – For final evacuation. Alcatel or equivalent molecular dragrecommended. Alternatively, a non-oil equivalent pump may be used.
Controls/Gauges:
♦ Control valves or solenoids for enacting cycles.
♦ Electronic gauges for measuring rough pressures (in psia or mm Hg) and fine pressure values (millitorrs).
♦ Rough vacuum/pressure gauges used for field pressure and vacuum measurements.
Humidification Device – Fixture or device to add humidity to canisters and flushing gasduring cleaning and batch certification. Water should be deionized double distilled orHPLC grade.
Canister Heaters – Heating belts or ovens for heating canisters to 100 degrees C toenhance removal of organic compounds.
Laboratory Notebook/Log Book – Used to record dates and canister conditioning actionsand certifications. Canisters last use must be tracked.
1.2 Recommended Procedures
Empty all canisters to ambient pressure and attach to the manifold. Make sure that thereare no leaks. This can be performed in one of two ways:
♦Pressurize canisters with ultra zero air or UHP nitrogen to 30 psig. The canister pressure cannot vary by more than ±2 psig over a 24 hour period.
♦Apply vacuum pimp to the manifold to reduce manifold pressure. The system is leak freeif the vacuum prior to cleaning is less than 500 mtorr.
Evacuate canisters to at least 1 torr (1 mm Hg).
Pressurize with humidified UHP nitrogen or ultra zero air up to 30 psig. Activate heatingsource during cleaning cycle.
Repeat above two steps (evacuating and pressurizing). Note cycle numbers and ensurethat a minimum of three cleaning cycles are completed. On the final cycle, turn off

Air-Phase Petroleum Hydrocarbons (APH), Rev 1 FinalMassachusetts DEP Page 4 - 2 December 2009
heating source and pump down with high vacuum pump to a maximum of 0.05 mm Hg(50 mtorr). This vacuum would correspond to 30 in. Hg. Close canister sampling valveprior to turning off high vacuum pump or placing the system in a standby mode.
Remove treated canisters from the manifold. A properly evacuated canister should havea canister pressure of ≤ 0.05 mm Hg (50 mtorr; vacuum of 30 in. Hg).
Associated canister sampling equipment (e.g., flow controllers, critical orifice assemblies) shouldalso be deemed clean and appropriate for use prior to sampling. Cleaning techniques may varybetween laboratories but all procedures will include backflushing with humidified ultra zero air orUHP nitrogen. All flow controllers will be calibrated by the laboratory such that a small amount ofvacuum (approximately 5 in. Hg) will remain in the canister at the end of sampling.
2.0 Recommended Equipment Certification Procedures
Batch or individual canister certification may be required depending on the requirements of the testing program.
2.1 Batch Canister Certification
After the cleaning process is completed, a minimum of one canister per batch must betested. A batch size of up to 20 canisters is allowed.
Remove the canister from the manifold that exhibited the highest levels of contaminationprior to cleaning (according to the analytical results). Pressurize the canister to amaximum of 30 psig with humidified ultra zero air or UHP nitrogen and analyze as aLaboratory Method Blank. Record in a laboratory notebook the serial number of thiscanister used for batch certification. If any of the APH target analytes or hydrocarbonrange concentrations are detected at a concentration greater than one-half of theirrespective RLs, the entire batch of canisters must be rejected and recleaned. If threeconsecutive certifications fail, system maintenance is required.
If the batch certification canister passes certification, batch canisters should be held for24 hours uncapped prior to issue for field use. The vacuum in each canister should berechecked prior to release for field use. The acceptance criterion for the “stored” canistervacuum is ≥ 28 in. Hg. Canisters not meeting this criterion must be retained for leakrepair and not released for field use.
At a minimum, the following information regarding canister certification should bepermanently recorded and retained for a minimum of 5 years:
Processing DateCanister Serial NumberCanister Volume (liters)Serial Number for Canister used for Batch CertificationPost-cleaning Vacuum (in. Hg)Results of the Certification Analysis
2.2 Individual Canister Certification
After the cleaning process is completed, each canister from the batch must be tested.
Remove each canister from the manifold. Pressurize the canister to a maximum of 30psig with humidified ultra zero air or UHP nitrogen and analyze as a Laboratory MethodBlank. Record in a laboratory notebook the serial number of the canisters beingcertified. If any of the APH Target analytes or hydrocarbon range concentrations are

Air-Phase Petroleum Hydrocarbons (APH), Rev 1Massachusetts DEP P
detected at a concentration greater than one-half of their respective RLs, the individualcanister must be recleaned and re-certified.
If the individual canister passes certification, it must be reevacuated and held for 24 hoursuncapped prior to issue for field use. The vacuum in each canister should be re-checkedprior to release for field use. The acceptance criterion for the “stored” canister vacuumis ≥ 28 in. Hg. Canisters not meeting this criterion must be retained for leak repair andnot released for field use.
At a minimum, the same information listed above for Batch Canister Certification shouldbe permanently recorded and retained for a minimum of 5 years.
Certification procedures associated with canister sampling equipment (e.g., flow controllers, criticalorifice assemblies) will vary between laboratories. If certification is required, the data user must requestthis from the laboratory when ordering the sampling equipment.
3.0 Flow Controller Calibration
Flow controllers may be calibrated by either simulating a vacuum on the outlet side of the flow controller (the endthat attaches to the canister) or by applying positive pressure to the inlet side of the flow controller. Using a NIST-traceable primary standard flow calibrator (e.g., BIOS Dry-Cal), the flow rate of air passing through the flowcontroller is measured. The flow rate may be adjusted by changing the size of the critical orifice used and/orperforming coarse/fine adjustments on the flow controller itself. Specific procedures will vary depending on themodel flow controller that is used.
The NIST-traceable primary standard flow calibrator is a mass flow meter used to accurately measure flow rates of 0to 200 cubic centimeters per minute. This device must be constructed of inert materials. These flow calibrators mustbe calibrated at least annually using a certified volumetric measuring device (soap film or equivalent) and anaccurate stopwatch.
The flow controller’s calibration must be verified prior to sample collection by the laboratory. Upon receipt of thecanister and associated flow controller back at the laboratory, a post-sampling calibration verification must beperformed and the relative percent difference (RPD) between the initial and post sampling calibration calculated.
| Ff – Fi |
(Fi + Ff)/2
The flow calibration and associated sample collec>20, re-sampling may be required to achieve datnotation must be provided in the laboratory narrflow controller RPD is one line of evidence in thvacuum is acceptable after sampling and the flownot adversely affected.
RPD =Fi = Pre-sampling Flow Rate
Finalage 4 - 3 December 2009
tion interval are considered valid if the RPD is <20. If the RPD isa quality objectives. If the “elevated RPD” sample is analyzed, aative documenting the “compromised RPD” flow rate value. Thee proper collection of samples for APH analysis. If the canistercontroller RPD is outside of the acceptance criteria, data quality is
X 100Ff = Post-Sampling Flow Rate

Air-Phase Petroleum Hydrocarbons (APH), Rev 1 FinalMassachusetts DEP Page 5 - 1 December 2009
APPENDIX 5APH METHOD CALCULATIONS
This Appendix provides, (1) example RRF calculations for APH aliphatic and aromatic ranges and the target analyte Benzenebased on multi-point calibration data, and (2) example calculations of sample concentrations for APH aliphatic and aromaticranges and the target analyte Benzene based on the calculated RRFs, simulated area counts, and other sample-specific data.The APH Method Analytical Flow Chart is shown in Figure 5-1.
Example CalculationsRefer to information found on Tables 5-1 through 5-4. An APH Method Calculation Worksheet in Microsoft Excel formatusing the analytical data presented in Tables 5-1 through 5-4 is available on the APH Method web page.
Equation 1: Relative Response Factor for Target APH AnalytesRRFs are calculated for each APH Target analyte using the area response of the analyte’s characteristic ion, its trueconcentration, the area response of the associated internal standard’s characteristic ion, and its concentration, using Eq. 1.
RRF calculated for Benzene, Calibration Level 1, using data found in Tables 5-2 and 5-3:
AEC = 3556 area count of the primary quantitation ion for Benzene (m/e 78)CI = 37 μg/m3 concentration of internal standard (IS2)AEI = 143419 area count of the primary quantitation ion for the associated internal standard
(m/e 114)CC = 2 μg/m3 concentration of Benzene, Calibration Level 1
)]2(*)143419/[()]37(*)3556[(BenzeneRRF
4587.0BenzeneRRF
Equation 2: Relative Response Factor for C5-C8 Aliphatic HydrocarbonsThe RRF for the C5-C8 Aliphatic range is based on a correlation between the total concentration of aliphatic componentseluting within this range and their total ion area counts.
RRF calculated for C5-C8 Aliphatic Hydrocarbons, Calibration Level 1, using data found in Tables 5-2 and 5-3:
AT = 18097 total ion area count of C5-C8 Aliphatic range (six aliphatic components)CI = 37 μg/m3 concentration of internal standard (IS2)AEI = 143419 area count of the primary ion for the associated internal standard (m/e 114)CT = 12 μg/m3 total concentration of C5-C8 Aliphatic range, Calibration Level 1 (six aliphatic
components)
)]12(*)143419/[()]37(*)18097[(RangeRRF
3891.0RangeRRF
Equation 3: Relative Response Factor for C9-C12 Aliphatic HydrocarbonsThe RRF for the C9-C12 Aliphatic range is based on a correlation between the total concentration of aliphatic componentseluting within this range and their total ion area counts.
RRF calculated for C9-C12 Aliphatic Hydrocarbons, Calibration Level 1, using data found in Tables 5-2 and 5-3:
)](*)/[()](*)[( TEIITRange CACARRFx
)](*)/[()](*)[( TEIITRange CACARRFx
)](*)/[()](*)[( cEIIECBenzene CACARRF

Air-Phase Petroleum Hydrocarbons (APH), Rev 1 FinalMassachusetts DEP Page 5 - 2 December 2009
AT = 32296 total ion area count of C9-C12 Aliphatic range (six aliphatic components)CI = 38 ug/m3 concentration of internal standard (IS3)AEI = 316020 area count of the primary ion for the associated internal standard (m/e 117)CT = 12 ug/m3 total concentration of C9-C12 Aliphatic range, Calibration Level 1 (six aliphatic
components)
)]12(*)316020/[()]38(*)32296[(RangeRRF
3236.0RangeRRF
Equation 4: Relative Response Factor for C9-C10 Aromatic HydrocarbonsThe RRF for the C9-C10 Aromatic range is calculated using a summation of the m/e 120 and m/e 134 extracted ion area countsfor the APH aromatic components eluting within this range (see Table 3a of the method).
RRF calculated for C9-C10 Aromatic Hydrocarbons, Calibration Level 1, using data found in Tables 5-2 and 5-3:
AT = 54343 summation of extracted ion area counts (m/e 120 + m/e 134: five aromatic components)CI = 38 ug/m3 concentration of internal standard (IS3)AEI = 316020 area count of the primary ion for the associated internal standard (m/e 117)CT = 10 ug/m3 total concentration of C9-C10 Aromatic range, Calibration Level 1 (five aromatic
components)
)]10(*)316020/[()]38(*)54343[(RangeRRF
6535.0RangeRRF
Equation 5: Percent Relative Standard DeviationFor each target compound and range a percent relative standard deviation (%RSD) is calculated from the RRFs generated foreach point of the curve using equation 5 below.
Example: Benzene from Table 5-1:
Compound Cal 1 Cal 2 Cal 3 Cal 4 Cal 5 Cal 6 Mean SDBenzene 0.4587 0.5119 0.5167 0.4679 0.5540 0.5083 0.5029 0.03490
%RSD = percent relative standard deviationSDn-1 = 0.03490 standard deviation (n-1 degrees of freedom)AVGx = 0.5029 mean response factor from the initial calibration
100*)5029.0/03490.0(% BenzeneRSD
9.6% BenzeneRSD
Equation 7: Percent DifferenceCalculate a percent difference for Benzene in a continuing calibration standard having a calculated RRF of 0.4769:
%D = percent differenceRFC = 0.4769 response factor from the continuing calibrationRFI = 0.5029 mean response factor from the initial calibration
)](*)/[()](*)[( TEIITRange CACARRFx
]100*)]/()[(% 1 XnBenzene AVGSDRSD
100*)]/[()]()[(% IICBenzene RRFRRFRRFD

Air-Phase Petroleum Hydrocarbons (APH), Rev 1 FinalMassachusetts DEP Page 5 - 3 December 2009
100*)]5029.0/[()]5029.0()4769.0[(% BenzeneD
2.5% BenzeneD
Equation 8: Dilution Factor for Pressurization of Subatmospheric Samples
DF = (Pf + 14.7) / (Pi = 14.7)
Pi = pressure reading of canister prior to pressurization (in psig)Pf = pressure reading of canister after pressurization (in psig)DF = dilution factor
Note: To convert from in. Hg to psig: psig = in. Hg * 0.491159
Example Canister Dilution Calculation Final Pressure >0
Pi = -2.5 in. Hg = -1.28 psigPf = 10 psig
)7.1428.1/()7.1410( DF
84.1DF
Example Canister Dilution Calculation Final Pressure <0
Pi = -2.5 in. Hg = -1.28 psigPf= -0.5 in. Hg = -0.246 psig
)7.1428.1/()7.14246.0( DF
08.1DF
Equation 9: Calculation of Sample Results in g/m3: Target Analyte (Benzene)Calculate a final µg/m3 concentration for Benzene using data found in the Sample Data Table 5-4 (Note: sample aliquotvolumes are assumed to be 0.250 L):
Ax = 60285 area count of the primary ion for Benzene (m/e78)CIS = 37 µg/m3 concentration of internal standard (IS2)Ax = 115082 area count of the primary ion for the associated internal standard (m/e 114)RRFavg = 0.5029 average RRF for benzeneDF = 1.0 dilution factor
0.1*)]5029.0(*)115082/[)]37(*)60285[(3/ Benzene
mg
5.383/ Benzene
mg
Equation 11: Calculation of Sample Results in g/m3: C5-C8 Aliphatic RangeA. Calculate a preliminary µg/m3 concentration for C5-C8 Aliphatic range using data found in the Sample Data Table 5-
4 (Note: sample aliquot volumes are assumed to be 0.250 L):
DFRRFACAmg avgISISxBenzene
*)](*)/[()](*)[(3/
DFRRFACAmg avgISISxAliphatic
*)](*)/[()](*)[(3/

Air-Phase Petroleum Hydrocarbons (APH), Rev 1 FinalMassachusetts DEP Page 5 - 4 December 2009
Ax = 823563 total ion area count of all peaks eluting within this range (excluding internalstandard areas)
CIS = 37 µg/m3 concentration of internal standard (IS2)AIS = 115082 area count of the primary ion for the associated internal standard (m/e 114)RRFavg = 0.4177 average RRF for C5-C8 Aliphatic rangeDF= 1.0 dilution factor
0.1*)]4177.0(*)115082/[()]37(*)823563[(3/ Aliphatic
mg
6343/ Aliphatic
mg
B. Calculate a final µg/m3 concentration for C5-C8 Aliphatic range using data found in the Sample Data Table 5-4:
Final C5-C8 Aliphatic range µg/m3 concentration = (Preliminary µg/m3 concentration) – (concentrations of targetanalytes which elute within the C5-C8 Aliphatic range)
Final C5-C8 Aliphatic range µg/m3 concentration = (634 µg/m3) – (concentrations of MTBE, benzene, toluene,ethylbenzene, xylenes)
Final C5-C8 Aliphatic range µg/m3 concentration = (634 µg/m3) – (44.5 + 38.5 + 37.7 + 41.0 + 78.0 + 37.9 µg/m3)
Final C5-C8 Aliphatic range µg/m3 concentration = 356 µg/m3
Equation 11: Calculation of Sample Results in g/m3: C9-C10 Aromatic RangeCalculate a final µg/m3 concentration for C9-C10 Aromatic range using data found in the Sample Data Table 5-4 (Note:sample aliquot volumes are assumed to be 0.250 L):
Ax = 3217570 summation of extracted ion area counts (m/e 120 + m/e 134) eluting withinrange
CIS = 38 µg/m3 concentration of internal standard (IS3)AIS = 289465 area count of the primary ion for the associated internal standard (m/e 117)RRFavg = 0.8187 average RRF for C9-C10 Aromatic rangeDF= 1.0 dilution factor
0.1*)]8187.0(*)289465/[()]38(*)3217570[(3/ Aromaticmug
5163/ Aromaticmug
Equation 11: Calculation of Samples Results in g/m3: C9-C12 Aliphatic RangeA. Calculate a preliminary µg/m3 concentration for C9-C12 Aliphatic range using data found in the Sample Data Table
5-4 (Note: sample aliquot volumes are assumed to be 0.250L):
Ax = 1971741 total ion area count of all peaks eluting within this range (excluding BFB)CIS = 38 µg/m3 concentration of internal standard (IS3)AIS = 289465 area count of the primary ion for the associated internal standard (m/e 117)RRFavg = 0.3677 average RRF for C9-C12 Aliphatic rangeDF= 1.0 dilution factor
0.1*)]3677.0(*)289465/[()]38(*)1971741[(3/ Aliphatic
mg
DFRRFACAmg avgISISxAliphatic
*)](*)/[()](*)[(3/
DFRRFACAmg avgISISxAromatic
*)](*)/[()](*)[(3/

Air-Phase Petroleum Hydrocarbons (APH), Rev 1 FinalMassachusetts DEP Page 5 - 5 December 2009
7043/ Aliphatic
mg
B. Calculate a final µg/m3 concentration for C9-C12 Aliphatic range using data found in the Sample Data Table 5-4:
Final C9-C12 Aliphatic range µg/m3 concentration = (Preliminary µg/m3 concentration) – (concentrations ofnaphthalene and C9-C10 Aromatics)
Final C9-C12 Aliphatic range µg/m3 concentration = (704 µg/m3) – (38 + 516 µg/m3)
Final C9-C12 Aliphatic range µg/m3 concentration = 150 µg/m3
Equation 6: Percent RecoveryFrom information found in Table 5-4 (Sample Data Table), calculate a percent recovery for Benzene having a true, or spikedconcentration of 40 µg/m3.
%R = percent recoveryCfound = 38.5 concentration of the analyte or range (µg/m3)Ctrue = 40 true concentration of the analyte or range (µg/m3)
100*)]40/()5.38[(% BenzeneR
96% BenzeneR
Equation 10: Conversion of g/m3 to ppbVTo convert target analyte results from µg/m3 into ppbv, use the flowing equation. NOTE: this equation is not applicable tothe hydrocarbon ranges.
µg/m3Benzene= 38.5MWBenzene= 78.1
1.78/45.24*5.38BenzeneppbV
05.12BenzeneppbV
BenzeneBenzeneBenzene MWmgppbV /45.24*)3/(
100*)]/()[(% truefoundBenzene CCR

Air-Phase Petroleum Hydrocarbons (APH), Rev 1 FinalMassachusetts DEP Page 5 - 6 December 2009
TABLE 5-1: RELATIVE RESPONSE FACTORS
Compound Cal 1 Cal 2 Cal 3 Cal 4 Cal 5 Cal 6 Mean %RSD
1,3-Butadiene 3.7454 4.2517 3.8698 3.7343 4.0661 2.5931 3.7101 15.7
Methyl tertiary butyl ether (MTBE) 3.9877 5.0958 4.6380 4.4756 5.9072 5.0969 4.8669 13.5
Bromochloromethane (IS1)
Benzene 0.4587 0.5119 0.5167 0.4679 0.5540 0.5083 0.5029 6.9
1,4-Difluorobenzene (IS2)
Toluene 0.3663 0.3700 0.3991 0.3792 0.4910 0.4887 0.4157 14.1
Chlorobenzene-d5 (IS3)
Ethylbenzene 0.9927 1.0447 1.1267 1.0705 1.0902 0.9343 1.0432 6.7
Xylene (m, p) 0.7869 0.8913 0.9613 0.9133 0.9041 0.7809 0.8730 8.4
Xylene (o) 0.7809 0.8473 0.9138 0.8682 0.9504 0.8417 0.8671 6.8
4-Bromofluorobenzene (BFB)
Naphthalene 0.4234 0.2969 0.3203 0.3043 0.3681 0.3530 0.3443 13.8
C5-C8 Aliphatic Hydrocarbons 0.3891 0.4618 0.4662 0.4221 0.4073 0.3594 0.4177 10.0
C9-C12 Aliphatic Hydrocarbons 0.3236 0.3598 0.3881 0.3687 0.4018 0.3640 0.3677 7.3
C9-C10 Aromatics (m/e 120) 0.5452 0.6602 0.7121 0.6765 0.7895 0.6795 0.6772 11.7
C9-C10 Aromatics (m/e 134) 0.1082 0.1330 0.1435 0.1363 0.1668 0.1612 0.1415 14.9
C9-C10 Aromatic Hydrocarbons 0.6535 0.7932 0.8555 0.8128 0.9563 0.8406 0.8187 12.1
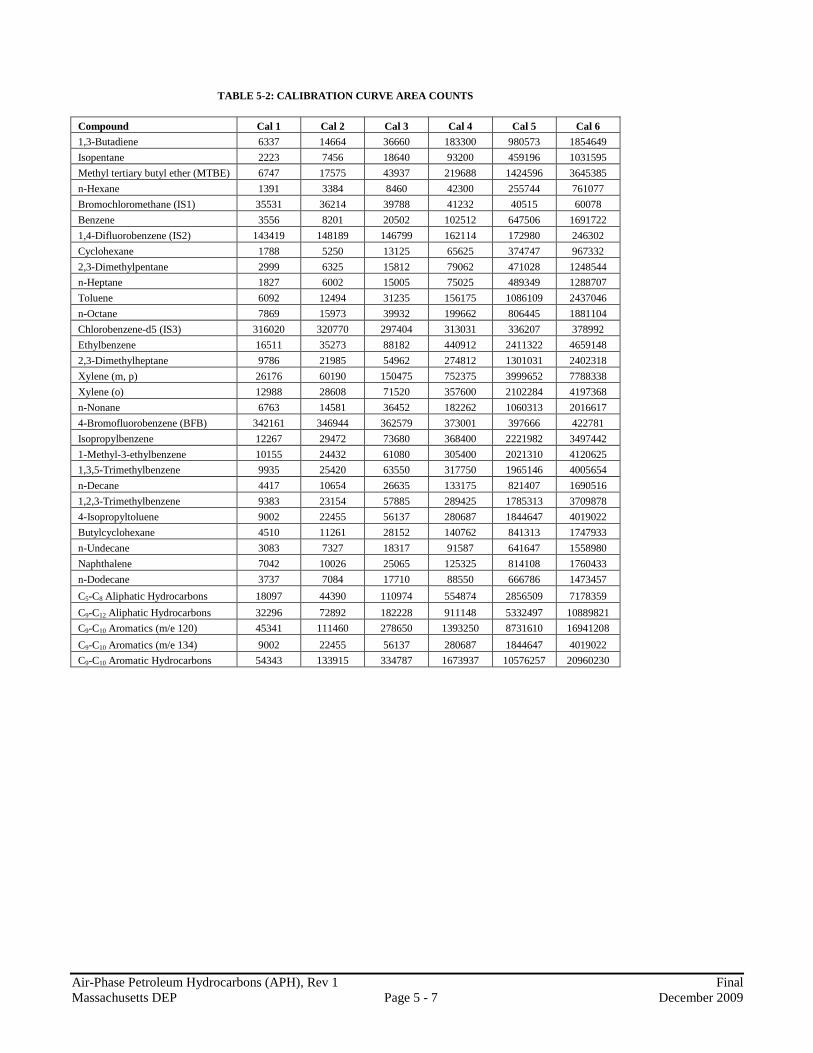
Air-Phase Petroleum Hydrocarbons (APH), Rev 1 FinalMassachusetts DEP Page 5 - 7 December 2009
TABLE 5-2: CALIBRATION CURVE AREA COUNTS
Compound Cal 1 Cal 2 Cal 3 Cal 4 Cal 5 Cal 6
1,3-Butadiene 6337 14664 36660 183300 980573 1854649
Isopentane 2223 7456 18640 93200 459196 1031595
Methyl tertiary butyl ether (MTBE) 6747 17575 43937 219688 1424596 3645385
n-Hexane 1391 3384 8460 42300 255744 761077
Bromochloromethane (IS1) 35531 36214 39788 41232 40515 60078
Benzene 3556 8201 20502 102512 647506 1691722
1,4-Difluorobenzene (IS2) 143419 148189 146799 162114 172980 246302
Cyclohexane 1788 5250 13125 65625 374747 967332
2,3-Dimethylpentane 2999 6325 15812 79062 471028 1248544
n-Heptane 1827 6002 15005 75025 489349 1288707
Toluene 6092 12494 31235 156175 1086109 2437046
n-Octane 7869 15973 39932 199662 806445 1881104
Chlorobenzene-d5 (IS3) 316020 320770 297404 313031 336207 378992
Ethylbenzene 16511 35273 88182 440912 2411322 4659148
2,3-Dimethylheptane 9786 21985 54962 274812 1301031 2402318
Xylene (m, p) 26176 60190 150475 752375 3999652 7788338
Xylene (o) 12988 28608 71520 357600 2102284 4197368
n-Nonane 6763 14581 36452 182262 1060313 2016617
4-Bromofluorobenzene (BFB) 342161 346944 362579 373001 397666 422781
Isopropylbenzene 12267 29472 73680 368400 2221982 3497442
1-Methyl-3-ethylbenzene 10155 24432 61080 305400 2021310 4120625
1,3,5-Trimethylbenzene 9935 25420 63550 317750 1965146 4005654
n-Decane 4417 10654 26635 133175 821407 1690516
1,2,3-Trimethylbenzene 9383 23154 57885 289425 1785313 3709878
4-Isopropyltoluene 9002 22455 56137 280687 1844647 4019022
Butylcyclohexane 4510 11261 28152 140762 841313 1747933
n-Undecane 3083 7327 18317 91587 641647 1558980
Naphthalene 7042 10026 25065 125325 814108 1760433
n-Dodecane 3737 7084 17710 88550 666786 1473457
C5-C8 Aliphatic Hydrocarbons 18097 44390 110974 554874 2856509 7178359
C9-C12 Aliphatic Hydrocarbons 32296 72892 182228 911148 5332497 10889821
C9-C10 Aromatics (m/e 120) 45341 111460 278650 1393250 8731610 16941208
C9-C10 Aromatics (m/e 134) 9002 22455 56137 280687 1844647 4019022
C9-C10 Aromatic Hydrocarbons 54343 133915 334787 1673937 10576257 20960230

Air-Phase Petroleum Hydrocarbons (APH), Rev 1 FinalMassachusetts DEP Page 5 - 8 December 2009
TABLE 5-3: CALIBRATION STANDARD CONCENTRATIONS (µg/m3)
Compound Cal 1 Cal 2 Cal 3 Cal 4 Cal 5 Cal 6
1,3-Butadiene 2 4 10 50 250 500
Isopentane 2 4 10 50 250 500
Methyl tertiary butyl ether (MTBE) 2 4 10 50 250 500
n-Hexane 2 4 10 50 250 500
Bromochloromethane (IS1) 42 42 42 42 42 42
Benzene 2 4 10 50 250 500
1,4-Difluorobenzene (IS2) 37 37 37 37 37 37
Cyclohexane 2 4 10 50 250 500
2,3-Dimethylpentane 2 4 10 50 250 500
n-Heptane 2 4 10 50 250 500
Toluene 2 4 10 50 250 500
n-Octane 2 4 10 50 250 500
Chlorobenzene-d5 (IS3) 38 38 38 38 38 38
Ethylbenzene 2 4 10 50 250 500
2,3-Dimethylheptane 2 4 10 50 250 500
Xylene (m, p) 4 8 20 100 500 1000
Xylene (o) 2 4 10 50 250 500
n-Nonane 2 4 10 50 250 500
4-Bromofluorobenzene (BFB) 57 57 57 57 57 57
Isopropylbenzene 2 4 10 50 250 500
1-Methyl-3-ethylbenzene 2 4 10 50 250 500
1,3,5-Trimethylbenzene 2 4 10 50 250 500
n-Decane 2 4 10 50 250 500
1,2,3-Trimethylbenzene 2 4 10 50 250 500
4-Isopropyltoluene 2 4 10 50 250 500
Butylcyclohexane 2 4 10 50 250 500
n-Undecane 2 4 10 50 250 500
Naphthalene 2 4 10 50 250 500
n-Dodecane 2 4 10 50 250 500
C5-C8 Aliphatic Hydrocarbons 12 24 60 300 1500 3000
C9-C12 Aliphatic Hydrocarbons 12 24 60 300 1500 3000
C9-C10 Aromatics (m/e 120) 10 20 50 250 1250 2500
C9-C10 Aromatics (m/e 134) 10 20 50 250 1250 2500
C9-C10 Aromatic Hydrocarbons 10 20 50 250 1250 2500

Air-Phase Petroleum Hydrocarbons (APH), Rev 1 FinalMassachusetts DEP Page 5 - 9 December 2009
TABLE 5-4: SAMPLE ANALYSIS DATA
Compound RT AreaISTDµg/m3
Concentrationµg/m3*
1,3-Butadiene 5.262 100452 36.1
Methyl tertiary butyl ether (MTBE) 7.572 162682 44.5
Bromochloromethane (IS1) 8.332 31534 42
Benzene 9.654 60285 38.5
1,4-Difluorobenzene (IS2) 9.852 115082 37
Toluene 12.724 119314 37.7
Chlorobenzene-d5 (IS3) 15.399 289465 38
Ethylbenzene 16.098 325648 41.0
Xylene (m, p) 16.447 518803 78.0
Xylene (o) 17.374 250488 37.9
4-Bromofluorobenzene (BFB) 18.317 425176 57
Naphthalene 29.274 99759 38.0
C5-C8 Aliphatic Hydrocarbons 823563 634
C9-C12 Aliphatic Hydrocarbons 1971741 704
C9-C10 Aromatics (m/e 120) 2256810
C9-C10 Aromatics (m/e 134) 960760
C9-C10 Aromatic Hydrocarbons 3217570 516
*Sample aliquot volume = 0.250 L
From Table 4 of Method. APH Range Marker Compounds and Range RetentionTimes
C5-C8 Aliphatic Hydrocarbons 0.1 min. before isopentane 0.01 min. before n-nonane
C9-C12 Aliphatic Hydrocarbons 0.01 min. before n-nonane 0.1 min. after dodecane
C9-C10 Aromatic Hydrocarbons 0.1 min. after o-xylene 0.1 min. before naphthalene
Ranges for Sample Data Range Start RT Range End RT
C5-C8 Aliphatic Hydrocarbons 6.028 17.744
C9-C12 Aliphatic Hydrocarbons 17.744 29.724
C9-C10 Aromatic Hydrocarbons 17.474 29.174

Air-Phase Petroleum Hydrocarbons (APH), Rev 1 FinalMassachusetts DEP Page 5 - 10 December 2009
Figure 5-1: Air-Phase Hydrocarbons (APH) Method Analytical Flow Chart
GC/MS TuningBFB
APH ComponentStandards
Internal StandardsIS1, IS2 and IS3
Identify and QuantifyTarget Analytes
GC/MS Analysis
Perform Initial Calibration
GC/MSCalibration
Quantify C5-C8 and C9-C12
Aliphatic Ranges
Quantify C9-C10
Aromatic Range
Analyze Method Blank
Daily GC/MSPerformance Checks
Area CountsQuantitation Ions
Total IonArea Counts
Total Area CountsOf Extracted Ions120 and 134
Relative Retention Time (RRT) –Target Analytes
Retention Time (Rt) Windows –Hydrocarbon Ranges
Relative Response Factors (RRFs) Percent Relative Standard Deviation
(%RSD)
Target Analytes and Aliphaticand Aromatic Ranges

Air-Phase Petroleum Hydrocarbons (APH), Rev1 Page 6 - 1 FinalMassachusetts DEP December 2009
APPENDIX 6APH METHOD CALIBRATION AND ANALYSIS USING LINEAR
REGRESSION
Use of linear regression is permissible to calculate the slope and y-intercept that best describes the linear relationshipbetween APH target analytes or range concentrations and instrument responses.
1. Prepare APH Calibration Standards as described in Tables 3a and 3b at a minimum of five concentrationlevels in accordance with the procedures and specifications contained in Section 9.4. The APH markercompounds for the C5-C8 aliphatic, C9-C12 aliphatic and C9-C10 aromatic ranges are presented in Table 4.
Analyze each APH calibration standard following the procedures outlined in Section 9.4. Tabulate arearesponse ratios (area of target analyte/ area of internal standard) against the concentration ratio (concentrationof the target analyte/concentration of internal standard). These data are used to calculate a calibration curvefor each target analyte (Equation 6-1). The correlation coefficient (r) of the resultant calibration curve must begreater than or equal to 0.99.
Equation 6-1: Linear Regression: APH Target Analytes
b+Ca=A
CAS
IS
ISs
where:
a = the calculated slope of the lineb = the calculated y intercept of the “best fit” lineCS = Concentration of the target analyte (µg/m3)AS = Area count of the primary (quantitation) ion for the analyte of interestCIS = Concentration of associated internal standard (µg/m3
)
AIS = Area count of the primary (quantitation ion) for the associated internal standard
A calibration curve may also be established for each aliphatic and aromatic hydrocarbon range of interest.Calculate the calibration curve for C5-C8 Aliphatic Hydrocarbons and C9-C12 Aliphatic Hydrocarbons usingthe total ion integration and sum of the individual peak areas of the APH components within each range.Calculate the calibration curve for the C9-C10 Aromatic Hydrocarbons using the sum of the 120 and 134extracted-ion chromatograms within the designated window for the range. Tabulate the ratio of thesummation of the peak areas to the area of the internal standard of all components in that fraction (i.e., C5-C8
Aliphatic Hydrocarbons, 6 components) against the ratio of the total concentration of the range to theconcentration of the internal standard. These data are used to calculate a calibration curve for each APHhydrocarbon range (Equation 6-2). The correlation coefficient (r) of the resultant calibration curve must begreater than or equal to 0.99.
Note: Do not include the area of BFB when determining the calibration curve for C9-C12 AliphaticHydrocarbons. Do not include the area of the three internal standards when determining thecalibration curve for C5-C8 Aliphatic Hydrocarbons.

Air-Phase Petroleum Hydrocarbons (APH), Rev1 Page 6 - 2 FinalMassachusetts DEP December 2009
Equation 6-2: Linear Regression: APH Aliphatic and Aromatic Hydrocarbon Ranges
b+aC=A
CAT
IS
IST
where:
a = the calculated slope of the lineb = the calculated y intercept of the “best fit” lineCT = summation of the concentrations (µg/m3) of the six aliphatic APH components
which elute within this range for C5-C8 or C9-C12 Aliphatic Hydrocarbons orsummation of the concentrations of the five APH components which elute withinthis range for C9-C10 Aromatic Hydrocarbons
AT = total ion area of the six aliphatic APH components which elute within this range forC5-C8 or C9-C12 Aliphatic Hydrocarbons or summation of areas of the extracted ions120 and 134 for five APH components which elute within this range for C9-C10
Aromatic Hydrocarbons
2. The concentration of a specific target analyte or hydrocarbon range may be calculated using linear regressionanalysis by applying Equation 6-3.
Equation 6-3: Determination of APH Target Analyte and Hydrocarbon Range Concentrations usingLinear Regression
)/(. 3mgRangeHCorAnalyteConcDabA
CA
IS
ISX
where:
Ax = Response for the analyte or hydrocarbon range in the sample. Units are in areacounts for APH Target Analytes and the hydrocarbon ranges.
D = Dilution factor; if no dilution was made, D = 1, dimensionlessa = Slope of the line for APH Target Analyte or hydrocarbon rangeb = Intercept of the line for APH Target Analyte or hydrocarbon range
3. At a minimum, the working calibration curve must be verified every 24 hours prior to the analysis of samplesto verify instrument performance and linearity. If the Percent Drift (% Drift) for more than one compoundvaries from the predicted response by more than ±30 or if the % Drift for any one compound is greater than50, as determined using Equation 6-5, a new five-point calibration must be performed for that analyte.
Equation 6-5: Percent Drift
100xionconcentratlTheoretica
ionconcentratlTheoretica-ionconcentratCalculated=Drift%