method determining weight individual yeastaem.asm.org/content/1/3/153.full.pdf · amethod for...
TRANSCRIPT
A Method for Determining the Weight of an Individual Yeast Cell*SAMIR A. HADDAD AND CARL C. LINDEGREN
Biological Research Laboratory, Southern Illinois University, Carbondale, Illinois
Received for publication February 23, 1953
A method has been developed by which the densityand weight of an individual yeast cell can be measuredwith a reasonable degree of accuracy. The averageweight of yeast cells in a cake is rather easily-determinedby weighing out a gram of yeast and counting thenumber of cells with a hemacytometer, but measuringthe weight of an individual cell presents a differentproblem, the solution of which is presented below.A resisting force is exerted on a body falling through a
viscous fluid at rest. If the body is a sphere and if theflow is streamlined, i.e., no turbulence or eddying occursin the wake of the sphere, the force exerted by the fluidis expressed by the following equation:
(1) F = 6irr
where r is the radius of the sphere, n the viscosity of thefluid, and v the rate of fall. This relationship was firstpointed out by Stokes (1845) and is called Stokes'Law.The force is due to the co-action of the weight of the
sphere and the buoyant effect of the fluid. Hence:
(2) weight = Yirr3dlgwhere d, is the density of the sphere and g the accelera-tion due to gravity
(3) buoyant force = %irr3dogwhere do is the density of the fluid.The difference between these two forces is essentially
that deduced by Stokes in the original equation:
(4) w'(d, - do)g = 6rrnv
where r is in cm., di and do in g. per cc., g in cm. per
second, n in poises and v in cm. per second.It follows that when a sphere of a known radius falls
freely through a fluid of measurable viscosity anddensity, the density of the sphere can be determined ifthe velocity of descent is measurable, provided thevelocity is not so great as to cause turbulence.The rate of fall of yeast cells suspended in a viscous
fluid can be measured with a high degree of accuracy.From the measurements of density and diameter, theweight of an individual cell can be calculated.
* This work was supported by research grants from theSouthern Illinois University, the Office of Naval Research, De-partment of the Navy, Contract (NR 164-140) and Anheuser-Busch, Inc.
The cells used were from haploid culture No. 13778.The majority of cells are spherical in shape, and theculture contains very few clumps. This condition wasideal since single free cells could be photographed duringtheir descent.
MATERIALS AND METHODSThe cells were suspended in an approximately 1 per
cent dextrose solution with a density of 1.0038 at 30 C.The viscosity was measured with a modified Ostwald-Cannon-Fenske viscosimeter pipette calibrated againstdistilled water. The viscosity of the dextrose solution at30 C was found to be 0.86191 centipoises. All experi-ments were carried out in a constant temperature roomat 30 C.
Since the time elapsed from the moment the suspen-sion is prepared until the cells are photographed isonly five or ten minutes, and any carbon dioxide pro-duced is not likely to be in the gaseous phase and hencewould not cause appreciable errors in buoyancy, theuse of glucose was not a source of error. More recentexperiments, using salt solutions, have yielded densityvalues of the same magnitude as those cited above.A loopful of cells was suspended in 5 ml of the solu-
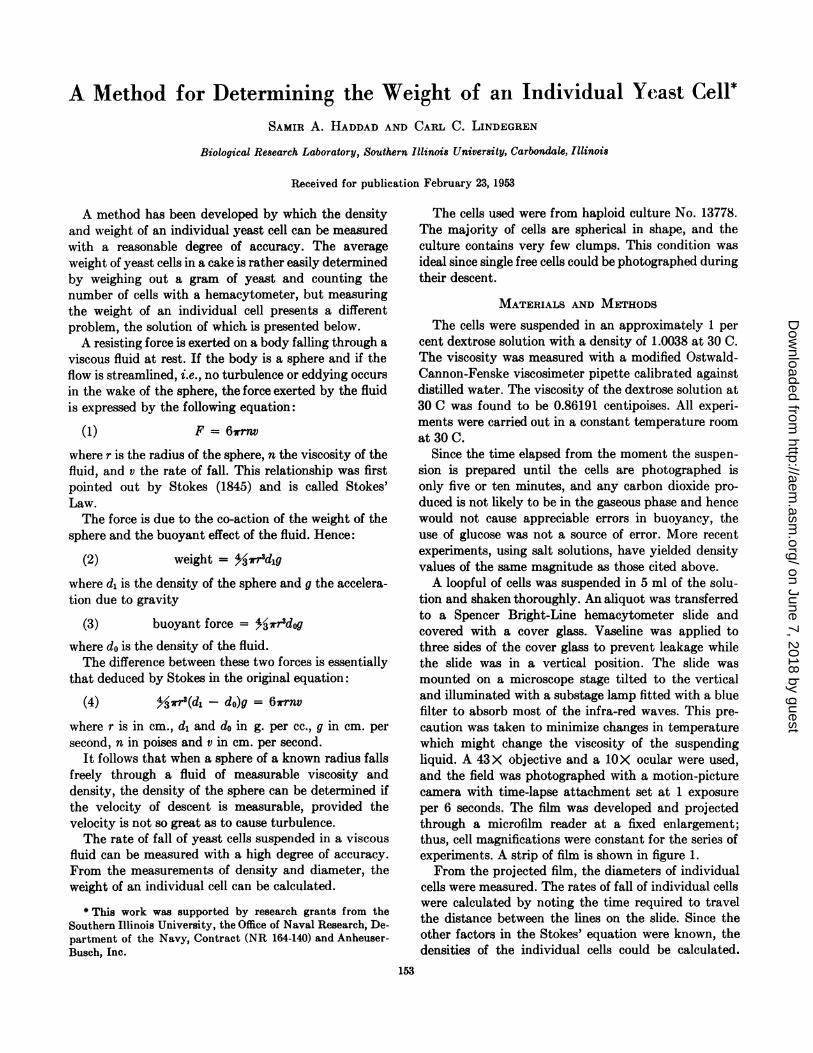
tion and shaken thoroughly. An aliquot was transferredto a Spencer Bright-Line hemacytometer slide andcovered with a cover glass. Vaseline was applied tothree sides of the cover glass to prevent leakage whilethe slide was in a vertical position. The slide wasmounted on a microscope stage tilted to the verticaland illuminated with a substage lamp fitted with a bluefilter to absorb most of the infra-red waves. This pre-caution was taken to minimize changes in temperaturewhich might change the viscosity of the suspendingliquid. A 43X objective and a 1oX ocular were used,and the field was photographed with a motion-picturecamera with time-lapse attachment set at 1 exposureper 6 seconds. The film was developed and projectedthrough a microfilm reader at a fixed enlargement;thus, cell magnifications were constant for the series ofexperiments. A strip of film is shown in figure 1.From the projected film, the diameters of individual
cells were measured. The rates of fall of individual cellswere calculated by noting the time required to travelthe distance between the lines on the slide. Since theother factors in the Stokes' equation were known, thedensities of the individual cells could be calculated.
153
on June 7, 2018 by guesthttp://aem
.asm.org/
Dow
nloaded from
SAMIR A. HADDAD AND CARL C. LINDEGREN
From the calculated densities and measured diameters,the weights of the individual cells were computed(table 1). The diameters of the cells were measured to
The maximum absolute error of approximately 25per cent would occur if a cell of diameter 3.75 wereplaced in cl range 3.5. If it were classified as 4.0,
FIG. 1. A single cell falling between the lines of a hemacytometer slide, %o mm. apart. Photographs taken with a motion picturecamera with time-lapse attachment set at 1 exposure per 6 seconds. Magnification 400 X.
the nearest half micron and since they range from 3.5 to7.0 microns, 8 classes were established; the discon-tinuities in the calculated volumes and the gaps in thehistogram (fig. 3) arise from the fact that it is not feasi-ble with the available equipment to measure the di-ameters more precisely.
the error would be approximately 16.5 per cent. Anerror of approximately 10 per cent would occur if acell of 6.75 diameter were clified as 7.0. With thepresent apparatus, it is highly improbable that errorsof more than 0.25 microns would be made in classifica-tion.
154
on June 7, 2018 by guesthttp://aem
.asm.org/
Dow
nloaded from

METHOD FOR DETERMINING WEIGHT OF YEAST CELL15
TABLE, 1. Diameter, volume, density and weight of 67individual yea-ot cells
CZLLNO. )'UZAHTERt IVOLUME DENSITY WEIGHTCELLNO. IN ]MICRONS 'CC X 1011l g/cc gX 10~iIl
________ ___ ~~~ ~~~~~~~~~~~~~~~~~~~~~~~~~~~~~~~~~~~I _
123456789101112131415161718192021222324252627282930313233343536373839404142434445464748495051525354555857585960
3.53.54.04.04.04.04.04.04.04.54.54.54.54.54.54.54.54.54.55.05.05.05.05.05.05.05.05.05.05.05.05.05.05.05.05.05.05.05.05.55.55.55.55.55.55.55.55.55.55.55.55.55.55.55.55.56.06.06.06.0
2.22.23.33.33.33.33.33.33.34.84.84.84.84.84.84.84.84.84.86.56.56.56.56.56.56.56.56.56.56.56.56.56.56.56.56.56.56.56.58.78.78.78.78.78.78.78.78.78.78.78,78.78.78.78.78.711.311.311.311.3
1.0721.1161.0881.1021.1061.1261.1481.1501.1891.0591.0841.0871.0901.0911.0911.0921.0961.1061.1091.0561.0571.0631.0711.0721.0741.0751.0801.0811.0831.0851.0851.0871.0971.1021.1091.1111.1171.1361.1411.0591.0591.0591.0641.0651.0651.0691.0711.0771.0781.0791.0801.0811.0891.0931.0931.0951.0501.0531.0571.060
2.42.53.63.73.73.73.83.84.05.05.25.25.25.25.25.25.25.35.36.96.96.97.07.07.07.07.17.17.17.17.17.17.2
7.27.27.37.37.47.49.29.29.23.
9.39.39.39.39.49.49.49.49.49.59.5
9.611.811.911.912.0
CZLLNO. DIAMETER IVOLUME DENSITY WEIGHTCELLNO. ~N~,uciows cc X 10"1 g/cc g X 10-11
61 6.0 11.3 1.065 12.062 6.0 11.3 1.081 12.263 6.0 11.3 1.089 12.364 6.0 11.3 1.094 12.365 6.5 14.3 1.057 15.266 6.5 14.3 1.095 15.767 7.0 17.9 1.074 19.2
Average .........7.3 1.087 7.9Std. dev .........3.0 0.026 3.2
It
is-IA
20l
~1%
(.
h..
U.
1.06 .0y .06 JI .51. IIU 1.17 US1
Density gI/CC.cFIG. 2
2-3 6-7 10-Il 14-15Weight gmu,ao"1FIG. 3
18-I9
4
DISCUSSIONA frequency distribution of the density and weight
values of different cells is presented in the histograms(figures 2 and 3). The s5kewness may be due to the factthat fewer favorable obiservations can be made in thelarger cells because of their more rapid rates of fall.The average value for densities was 1.087 g per ml:standard deviation 0.026. The average weight was7.922 X 10-"1 g: standard deviationi 3.188 X 10⁻¹¹.This distribution of densities showed a reasonably nar-row spread despite the number of factors which had tobe determined experimentally prior to substitution in
I ~~I II r9
F
b
II
155
on June 7, 2018 by guesthttp://aem
.asm.org/
Dow
nloaded from
KITOS, CAMPBELL, AND TOMLINSON
the Stokes' equation (4). The anomalous appearance ofthe curves might suggest that a non-random samplehad been selected, but examination of the frequenciesof cells appearing in different size ranges reveals anormal distribution indicating that a random samplehad been selected. The diameters of cells and the cor-respondent frequencies are: 3.5-2; 4.0-7; 4.5-10; 5.0-20;5.5-17; 6.0-8; 6.5-2; and 7.0-1.
Correlation studies revealed a high degree of correla-tion between volumes and weights, indicating a highdegree of accuracy of the observations. The weight ofeach cell was calculated by multiplying its volume byits density as determined independently by experiment.Had all individual volumes been multiplied by theaverage density, then correlation would automaticallybe complete, but since densities of individual cells werecalculated by a series of independent and unrelatedobservations and measurements, a coefficient of correla-
tion approaching 1 is indicative of the accuracy of thedifferent measuremen.ts.
Spot diagrams of weights and densities and of volumesand densities did not reveal a high degree of correlation,although there is some indication that the larger, andhence heavier, cells are less dense than the smaller,lighter cells.
SUMMARY
A method is presented by which the density of indi-vidual yeast cells can be calculated by the use of Stokes'law for falling spheres through a viscous fluid. Fromdensity measurements the weights of the respectiveindividuals cells can be computed. A high degree ofaccuracy of the method is revealed by correlationstudies of weights and volumes computed independentlyfrom experimental data.
Influence of Temperature on the Trace Element Requirements forCitric Acid Production by Aspergillus Niger*
PAUL A. KITOS, JACK J. R. CAMPBELL AND NEIL TOMLINSON
Department of Dairying, The University of British Columbia
Received-for publication February 23,1953
Our knowledge of the trace element requirements formaximum citric acid production by Aspergillus niger hasbeen gained in experiments where temperature w'as keptconstant. In general this temperature has been from 24to 30 C although there are reports of good yields ofcitric acid beyond this range (Eisenmann and Blumen-field, 1944; Szticz, 1944). Kovats (1946) obtained goodyields of citrate by incubating the cultures for 3 daysat 28 C and then lowering the incubation temperatureto 20 C for the remaining time. 'Tomlinson, Campbelland Trussell (1950, 1951) using stationary cultures ofA. niger 72-4, established the requirement of zinc, iron,copper and manganese for maximum acid productionat 30 C. However, at this temperature it was possible toobtain maximum acid production over only a very nar-row range of mineral concentrations. Small excesses,ofmanganese in particular were very detrimental to highyields of acid. The present work on A. niger 7274 wasundertaken in an effort to determine -whether or not itwould be possible to find a temperature at which high,yields of citrate could be obtained even in the presenceof increased amounts of the trace elements. It was alsohoped that the influence of temperature on the mineral
* This study was carried out under a grant from the British'Columbia Research Council.
requirements for maximum citric acid accumulationmight be determined.
METHODS AND MATERIALS
As in previous work Aspergillus niger strain 72-4,(Perlman, Kita and Peterson) was used. The methodsemployed were, in general, those reported earlier (Tom-linson et at, 1950, 1951).The composition of the sporulation medium and the
fermentation medium were similar except that 2.0 percent agar was added to the sporulation medium, thetrace elements were omitted and the pH was adjustedto 6.0. Fine granular commercial cane sugar was used ascarbon source. It was purified for use in the fermenta-tion medium by cation exchange through 645 ml wetvolume of permutit Q and 232 ml wet volume ofAmberlite IRC 50 at the rate of 80 ml per hour. Thechemicals used were of reagent grade. Ferric chloridewas purified by cation exchange. The basal mediumused was that developed by Tomlinson et al (1951). Itconsisted of 15 g sucrose, 0.28 g NH4NO3, 0.06 gK2HPO4, 0.03 g MgSO4 7H20, HCl to pH 2.0, andwater to 100 ml.At the end of the fermentation time the contents of
the flasks were filtered and the mycelium was washed
156
on June 7, 2018 by guesthttp://aem
.asm.org/
Dow
nloaded from