metco merits more - prrac - poverty & race …prrac.org/pdf/metcomeritsmore.pdfno. 74 june 2011...
TRANSCRIPT

No. 74June2011
by Susan Eaton and Gina Chirichigno
METCO Merits More
A Pioneer Institute White Paperin collaboration with The Houston Institute for Race and Justice at Harvard Law School
The History and Status of METCO

Pioneer’s Mission
Pioneer Institute is an independent, non-partisan, privately funded research organization that seeks to improve the quality of life in Massachusetts through civic discourse and intellectually rigorous, data-driven public policy solutions based on free market principles, individual liberty and responsibility, and the ideal of effective, limited and accountable government.
Pioneer’s Centers
This paper is a publication of the Center for School Reform, which seeks to increase the education options available to parents and students, drive system-wide reform, and ensure accountability in public education. The Center’s work builds on Pioneer’s legacy as a recognized leader in the charter public school movement, and as a champion of greater academic rigor in Massachusetts’ elementary and secondary schools. Current initiatives promote choice and competition, school-based management, and enhanced academic performance in public schools.
The Center for Better Government seeks limited, accountable government by promoting competitive delivery of public services, elimination of unnecessary regulation, and a focus on core government functions. Current initiatives promote reform of how the state builds, manages, repairs and finances its transportation assets as well as public employee benefit reform.
The Center for Economic Opportunity seeks to keep Massachusetts competitive by promoting a healthy business climate, transparent regulation, small business creation in urban areas and sound environmental and development policy. Current initiatives promote market reforms to increase the supply of affordable housing, reduce the cost of doing business, and revitalize urban areas.
Pioneer Institute is a tax-exempt 501(c)3 organization funded through the donations of individuals, foundations and businesses committed to the principles Pioneer espouses. To ensure its independence, Pioneer does not accept government grants.

Susan Eaton
Gina Chirichigno
Contents Executive Summary 1 Introduction 3
The METCO Story 3
What is METCO? 4
METCO by the Numbers 8
METCO Demographics 10
METCO’s Enabling Legislation: “The METCO Bill” 15
METCO’s Track Record 16
How Do Families, Students and Alumni Assess METCO 22
METCO in the Context of Intense Regional Inequalities in Metro Boston and Springfield 24
Conclusion and Recommendations 25
About the Authors 29
Endnotes 30
METCO Merits More
The History and Status of METCO

1
METCO Merits More
Executive SummaryMassachusetts’ METCO program (Metropolitan Council for Educational Opportunity) enables about 3,300 students who live in Boston and Springfield to attend opportunity-rich suburban schools. Since the vast majority of the students in METCO are either African American or Latino and most suburban districts remain overwhelmingly white, METCO fulfills two goals: it creates a degree of racial and ethnic diversity and provides students who’d otherwise attend challenged school districts the opportunity to attend schools with reputations for rigor and excellence.
METCO is one of eight voluntary interdistrict school desegregation programs in the United States and the second longest-running program of its kind. This paper describes the structure and history of METCO and summarizes what is known about the academic achievement and experiences of students who participate in the program. We argue that given METCO’s generally positive track record, its enduring popularity and the well-established benefits of racial and ethnic diversity in schools, educational leaders should seriously consider expanding METCO, should provide more incentives to suburban districts to participate and should conduct more rigorous, transparent analyses of the program.
METCO Merits More makes the following findings: Popularity & Funding: METCO enjoys enduring popularity among urban families, suburban educators and state legislators. In the program’s initial year, just seven suburban communities participated in METCO. In 2011, 37 districts are participating in METCO.
In 2011, about 900 students were on the METCO waiting list for kindergarten placement for the following school year; about 600 were on the list for first grade, and 600 for second grade. Most METCO students are placed in suburban schools between kindergarten and second grade.
In spite of its popularity, METCO has faced budget cuts in recent years, forcing local communities to cut back on services. In 2008, METCO’s budget was $20.2 million. Three years later, in 2011, lawmakers slashed METCO’s budget to $16.5 million.
Achievement: Before outlining the encouraging data on METCO student performance, it is important to stress that these trends are likely the result of many factors and cannot be attributed solely to the METCO program. In order to remove the other potential influences on achievement, it would be necessary to compare METCO with a control group made up of students who are similar to METCO students but who did not participate in the program. (This study is beyond the scope of this brief). Thus, we present data only to demonstrate that METCO students are performing well in what are highly competitive academic environments, and doing so in spite of the stresses that long bus rides and early morning risings that the program requires.
METCO students consistently graduate high school at far higher rates than the state average and higher than students in Boston and Springfield. In 2009, 93 percent of METCO students graduated high school on time compared with 81.5 percent of students statewide, 61 percent in Boston and 61 percent in Springfield.
Test scores from 3rd, 6th and 10th grades show that on average, from 2006 to 2010, METCO students, who are overwhelmingly African American and Latino, tended to dramatically outperform their African American and Latino counterparts both in Boston and Springfield. With rare exceptions in Math in some years, METCO students, on average, also outperformed Boston and Springfield students overall on the MCAS, even after factoring in the MCAS scores of White and Asian students in those cities.
Diversity & Long-Standing Inequality: More than half of METCO students come from low-income families, compared with 74 percent in Boston and 84 percent in Springfield.

2
Pioneer Institute for Public Policy Research
A higher share of METCO students are categorized as having “special education” needs (25 percent in 2010) than the share of students so designated in Boston (19.4 percent) and Springfield (22.8 percent).
METCO is the only program designed to redress the long-standing racial and economic segregation of the Commonwealth’s public schools. As recent reports in 2009 and 2010 show, the state’s schools are intensely segregated and African American and Latino families are far more likely even than low-income white families to live in “low-opportunity” neighborhoods characterized by unemployment, higher crime rates, fewer job opportunities, poorer transportation infrastructure, low graduation rates and inadequate school resources.
As discussed in this report, racial and economic diversity are associated with a host of educational and social benefits, while racial and economic segregation tends to contribute to lower achievement and graduation rates.
METCO Merits More makes the following recommendations: The state should provide adequate, reliable funding for the METCO program and state educational leaders should publicly endorse and promote the program.
The state should find new ways to support school districts participating in METCO program, possibly by tying building reimbursements to participation and offering competitive grants for teacher training or innovative programs that enhance the educational experience of METCO students and help foster positive relationships between METCO students and resident students.
State officials should appoint a working group or advisory committee to explore the feasibility, cost and community interest in expanding the METCO program to provide more students from other challenged urban communities access to high-performing public schools.
The state and the METCO officials should provide accessible data and information about the structure of the program, the student-selection process and student performance.

3
METCO Merits More
IntroductionThe nation’s second longest-running program of its kind, Metropolitan Council for Educational Opportunity (METCO) enables approximately 3,300 students from Boston and Springfield, the vast majority of them either African American or Latino, to attend opportunity-rich suburban schools. This research paper describes the structure and history of METCO, and summarizes what is known about academic achievement and the experiences of students who choose to take part in this program.
Given METCO’s generally positive track record, its enduring popularity, and the well-established educational benefits of racial and ethnic diversity, we urge educational leaders to seriously consider expanding the program and providing more funding to participating suburban districts. Meanwhile, we urge the Massachusetts Department of Elementary and Secondary Education (DESE) to conduct regular analyses of METCO student performance, tracking educational attainment, attendance, graduation, and suspension rates and other outcomes, methods for student selection, and processes for maintaining the waiting list. Similarly, we urge educators in suburban districts that enroll METCO students to confront the challenges METCO students often face in overwhelmingly white suburban schools – challenges that might best be resolved through careful attention to school climate.
The METCO StoryNearly a half century ago, a group of African-American parents took action to remedy educational inequality in Boston, laying the groundwork for what would later become METCO. In the mid-1960s the “Operation Exodus” movement began with mothers and fathers organizing to transport their children from overcrowded predominantly African-American schools to under-used and better-resourced city schools.1 Under the leadership of Exodus
organizers Ruth Batson and Ellen Jackson, this grassroots movement was institutionalized. With cooperation from suburban educators, the program (operating under the name “METCO”) transferred African-American students out of the city into affluent, white schools just beyond the city line. In its first official year, 1966, the Carnegie Foundation funded the program, enabling about 220 African-American children to attend suburban schools in Arlington, Braintree, Brookline, Lexington, Lincoln, Newton, and Wellesley. Soon afterward, the state began paying for METCO by providing annual grants to a growing number of participating suburban districts. Forty-four years after its start, 37 suburban communities enroll 3,300 students who live in Boston and Springfield.
METCO’s story of grassroots protest, interracial coalition building, peaceful voluntary desegregation and growing popularity has long been overshadowed by Boston’s infamously violent busing struggle of the 1970s. METCO, born about a decade before “busing,” has enjoyed growing political support over the decades. Many Boston state legislators, such as Senator Sonia Chang-Diaz (D-Boston) and Representative Shirley Owens-Hicks (D-Boston), along with legislators from affluent suburban districts, such as Representative Jay Kaufman (D-Lexington) and Representative Kay Kahn (D-Newton) have been strong supporters of the program. United States Senator Scott Brown (R-MA) also supported METCO as a state legislator representing Wrentham. In 2007, United States Senator John Kerry (D-MA) called METCO a “success story and national model.”2
However, with each budget cycle, the program’s advocates must lobby for adequate funding and the program has suffered cutbacks in recent years, leading to reductions in services – such as tutoring, staffing and late transportation. As this brief shows, the state dollars provided for METCO fall far short of actual per-pupil costs. This means that suburban METCO communities, increasingly struggling with budget concerns

4
Pioneer Institute for Public Policy Research
themselves, are underwriting a share of the costs related to the program. Curiously, METCO has been largely left out of public discourse and policy discussions related to education reform in the state. As policymakers pay positive attention to other choice-based measures such as charter schools, we argue that METCO should receive at least equal attention and adequate funding. Further, educational leaders should give serious, careful attention to expanding METCO in the future so that it might provide more families meaningful educational choices in a context of well-documented, long-standing, and vast regional inequalities.
What is METCO?Goals, Participation, Admission, and Structure
Goals - METCO has two distinct, but compatible goals. It is both a school-choice program and a purposeful school desegregation program. As a school-choice program, METCO provides students who live in Boston and Springfield access to smoothly functioning, often quite affluent schools that enjoy reputations for academic excellence and rigor. Meanwhile, METCO creates some degree of racial and ethnic diversity in suburban communities where otherwise there would be little to none.
Participation -
Why do parents and children participate in METCO?
In recent decades, journalists have written perennial stories of African-American and Latino parents’ apparent disenchantment with mandatory “busing” in Boston and elsewhere. However, reporters tend to miss another revealing story: METCO is extremely popular among students and their families, even though it buses students much farther distances than typical desegregation plans. In 2011, about 900 students were on the waiting list for kindergarten placement for the following school year; approximately 600 were on the list for first grade, and 600 for second grade placement.
Surveys show that urban parents tend to enroll their children in METCO so their children might receive a better education. In a 1996 study conducted by the Civil Rights Project at Harvard, 73 percent of parents surveyed cited a school’s “academic program(s)” as the “most important” reason for sending their children to METCO.3 A quarter of parents surveyed had signed up their children for METCO before their sons and daughters were a year old.4
Why do suburban districts participate in METCO?
In the suburbs, support for METCO has grown over time. In its initial year, just seven suburban districts participated in METCO. In 2011, 37 districts participated in the program, 33 located within the Boston metropolitan area and four near Springfield.
Since the beginning, educational leaders in the suburbs have spoken publicly about the benefits METCO brings to their communities. The 2007 comments of Tom Scott, executive director of the Massachusetts Association of School Superintendents and a former superintendent in the METCO-participating district, Concord-Carlisle, are typical. Speaking at a meeting with state education officials, Scott said: “I know that the program has been highly successful and has huge benefit not just for the kids coming into the district, but for all the kids in the district. . . I know that that’s felt by virtually all of the superintendents. . .”
Generally, METCO enjoys the support of the educational leadership in its participating suburban communities. Occasionally, elected leaders and residents have questioned their districts’ participation in METCO. However, even when community members publicly reexamine their participation in METCO, as they have in Lincoln and Lynnfield, elected leaders invariably decide to continue their participation in the program. Some districts engage in community education related to METCO, sponsoring forums or information sessions for interested residents.

5
METCO Merits More
The events in the suburban community of Lynnfield most clearly underscored the basically strong support for METCO. In 1999, the school superintendent in this nearly all-white, middle-class town complained of the poor relative academic achievement of some METCO students and threatened to end its program. The reaction was swift. Hundreds of people showed up to protest the superintendent’s statements, including many white Lynnfield residents. The school committee members immediately refocused the debate on how to improve METCO students’ academic performance. During the controversy, a racially diverse collection of educational leaders from other suburban METCO communities spoke on television and radio broadcasts, acknowledging some of the METCO students’ academic difficulties while focusing on ways the program benefits both students from Boston and the otherwise isolated white students who are living in an increasingly diverse country.6
Admission – Families in Boston begin their application process by placing their children’s names on the METCO waiting list. Each year, METCO officials invite several thousand families who are date eligible from that waiting list to information sessions, which are held in the fall for the upcoming school year at the METCO, Inc. office in Boston. Parents must then complete a folder with more detailed information and supply various forms of documentation in order to be referred to a district. These folders are forwarded to suburban districts where officials had projected open seats. Suburban districts then offer placements based upon available seats in the district. Students do not have a choice about which district they will attend, but they do have the choice to accept or decline a placement and remain on the waiting list. METCO officials do attempt to keep siblings in the same district.
The METCO waiting list “rolls over” each year, so older students do remain on this list. It takes an average of five years for students on the METCO waiting list to start the admissions process and be referred to a district. However,
according to METCO officials, districts prefer to enroll students in the earliest grades. Thus, a student’s chance of being placed in METCO decreases considerably after the second grade. As said, about 2,100 students are currently on waiting lists for grades K through 2, according to METCO officials. (At the time of publication, it is unclear how many seats will be available in suburban districts next year, but, according to officials, the program places about 350-400 students annually).7
In Springfield, the application process is different. There, families apply to the METCO program through the Springfield Public Schools. Participants are selected through a random lottery.
There are no entrance examinations or other requirements for entering METCO. Students with special education needs are permitted to enroll in the METCO program, as are students who have limited English proficiency (LEP).
Since METCO is a vehicle for meeting the goals of the state’s Racial Imbalance Act (RIA), which promotes racial and ethnic diversity in public schools, applicants to METCO are nearly always “nonwhite.” In keeping with the stated purpose of the RIA, METCO places participating students into predominantly white suburban districts.
Structure – The Massachusetts Department of Elementary and Secondary Education (DESE) oversees the METCO program and ensures that participating suburban school districts get METCO funds. The DESE contracts with METCO, Inc., a non-profit corporation based in the Roxbury neighborhood, to be the Boston-based service provider. METCO, Inc. handles registration and referral of students, and also offers academic counseling, tutorial services, summer school and other support services to participating students. In Springfield, the city’s public school district administers its METCO program. Until the early 2000s, DESE employed a staff person who was responsible for monitoring and/or communicating with METCO districts and METCO, Inc. on the Department’s behalf.8

6
Pioneer Institute for Public Policy Research
Soon after the federal No Child Left Behind Act (NCLB) went into effect, DESE eliminated this position as part of a larger restructuring effort.
The central office, METCO, Inc., with a FY2011 budget of approximately $1,151,000 is located in Boston’s predominantly African-American Roxbury neighborhood. (METCO, Inc. receives about 6 percent of the state’s overall allocation to the program.) METCO, Inc. staff members accept applications to the program, hold regular information sessions, oversee placement and transportation, coordinate special programs such as college tours, work directly with state officials who allocate funding and counsel and advise parents and students considering the program. METCO, Inc. also coordinates tutoring services and summer academic support programs for METCO students in Boston. Each year, the METCO Parent Legislative Committee (MPLC) organizes an event at the Massachusetts Statehouse where METCO supporters, parents, and students give presentations and meet with elected leaders and other officials to talk about METCO. METCO, Inc. staff also coordinates meetings of METCO directors and superintendents in host districts. A 22-member board of directors, which includes former METCO parents, superintendents, suburbanites and alumni, oversees METCO, Inc.
In 2003, the Massachusetts Commissioner of Education created the 12-member METCO Advisory Committee (MAC). The committee includes representatives from METCO Inc. and also suburban-based METCO directors, suburban superintendents, and parents of METCO students. Members are designated by METCO’s various stakeholder groups, with a chair (a superintendent from one of the METCO receiving districts) appointed by the Commissioner of Education. The state created MAC in response to suburban districts’ concerns about the security of program funding. Unlike the state’s advisory councils, MAC does not have legal status and represents an organized, but largely informal, means of increasing communication amongst METCO’s
major stakeholders. In the beginning, MAC met 4-5 times a year with DESE representatives to discuss funding and other aspects of METCO, including issues related to transportation, enrollment and program administration.9 In more recent years, however, MAC has been largely inoperative (the last meeting was held in Fall 2009). Jeff Wulfson, the associate commissioner for school finance and district support, has facilitated MAC for the Department.
In the suburbs, METCO directors, counselors and tutors work with METCO students and their families, maintain files and keep track of student progress. They often act as advocates for students and coordinate informational or social programs for students and families. Some directors and counselors attend parent teacher conferences. District level METCO staff members represent METCO’s interests at school committee meetings and other district meetings. Most METCO directors have offices within METCO schools; others, stationed at district central offices, make frequent visits to students and teachers at the schools. Some METCO directors and coordinators belong to the METCO Directors’ Association (MDA), which was founded in 1975.10 The MDA aims to ensure that METCO offers a high quality educational and social experience for all students, by providing professional development and student/parental empowerment opportunities. The METCO Directors’ Association Conference, held annually, provides staff development and information for educators and community members who work with METCO students in suburban school settings. The MDA has also held conferences for high school and middle school students, to help them develop leadership skills and “[enhance] the continual development of students toward responsible and informed citizenship in the urban and suburban environments in which they live and learn.”11

7
METCO Merits MoreTable 1: 2009-2010 Student Demographics, METCO Sending & Receiving Districts
(including METCO students)% White % Black % Latino % Asian % Multi-
Race% Low Income
# of METCO Students
# of Students in District
BOSTON 13.1 36.5 39.6 8.6 1.8 75.6 n/a 55,371SPRINGFIELD 14.7 22.3 56.7 2.2 4.1 81.4 n/a 25,141BROOKLINE 59.3 7.4 9.1 18 6.1 11.6 302 6,472LEXINGTON 62.2 4.5 3.4 26.2 3.6 4.8 255 6,182LINCOLN 65.3 12.1 9.3 6.4 6 11 91 1,050NEWTON 68.8 5.1 6.3 14.7 5 10.3 422 11,765BEDFORD 72.8 8.5 4.2 10.7 2.9 8.1 89 2,429SHARON 73.8 5.5 3 14.9 2.7 6.7 67 3,426BELMONT 73.9 3.8 4 13.6 4.6 7.7 112 3,974WESTON 76.7 6.2 3.1 10 3.9 4.2 167 2,388WAYLAND 76.8 4.5 3.7 11.9 3.1 5.1 133 2,738ARLINGTON 78.5 3.7 5.2 9.5 2.9 10.8 88 4,713CONCORD 80.7 5.6 4.2 6.2 3.1 5.9 108 1,894BRAINTREE 81.7 4 3.9 9.2 1 13.6 37 5,377WELLESLEY 81.8 3.8 3.8 7.2 3.2 4.3 159 4,868CONCORD CARLISLE 83.5 5.2 3.1 5.9 2.2 3.9 74 1,245NEEDHAM 84.4 3.1 3.2 6.3 2.8 5.7 147 5,311LINCOLN SUDBURY 85.9 5.4 2.1 4.2 2.4 4.4 91 1,615DOVER 86.5 3.1 1.4 7.7 1 2.4 13 572MELROSE 86.9 4.7 2.5 3.1 2.3 12.7 121 3,767NATICK 87.2 2.4 2.7 4.9 2.6 8.2 50 4,734LONGMEADOW 88.1 2.8 2.1 5.9 1.1 3.4 40 3,102SUDBURY 88.2 2.1 1.9 4.7 3 3.7 64 3,164HAMPDEN WILBRAHAM 88.9 3 3.4 2.8 1.6 10 38 3,600WESTWOOD 88.9 2.4 1.9 6.1 0.7 4.1 43 3,100WALPOLE 89.6 3.8 3.1 2.7 0.7 9.5 55 3,954SHERBORN 90 2 0.7 2.9 4.4 2.9 8 450SWAMPSCOTT 90.4 3.2 3.5 1.8 0.8 9 69 2,256FOXBOROUGH 90.8 3 2 2.9 0.5 10.5 45 2,867LYNNFIELD 90.8 1.6 2.7 3.6 1.1 4.7 34 2,353EAST LONGMEADOW 91 3.1 1.9 3.6 0.2 9.6 48 2,850READING 91.7 1.8 1.4 3.8 1.1 4.6 67 4,392DOVER SHERBORN 91.8 1.7 1.4 4.3 0.6 1.7 17 1,150MARBLEHEAD 92 2.7 3 1.5 0.8 7.6 78 3,232WAKEFIELD 92.5 1.9 2 2.3 1 12.9 42 3,360HINGHAM 92.6 1.3 1.8 1.5 2.7 3.9 37 4,058SOUTHWICK TOLLAND 93.4 2 2.5 0.8 1 14.8 20 1,797COHASSET 94.3 3.2 0.7 1.3 0.3 1.8 47 1,496SCITUATE 94.9 2.2 0.7 0.8 1.3 5.7 58 3,278
Sources: METCO Numbers: http://www.doe.mass.edu/metco/funding.htmlRace Demo: http://profiles.doe.mass.edu/state_report/enrollmentbyracegender.aspx?year=2010&mode=district&Continue.x=0&Continue.y=0 SES Demo: http://profiles.doe.mass.edu/state_report/selectedpopulations.aspx?year=2010&mode=district&Continue.x=7&Continue.y=7 District Size: http://profiles.doe.mass.edu/state_report/enrollmentbygrade.aspx?year=2010&mode=district&Continue.x=4&Continue.y=4

8
Pioneer Institute for Public Policy Research
METCO by the NumbersDemographics and Funding
Demographics - Since 1966, tens-of-thousands of men and women from Boston and Springfield have graduated from suburban high schools through METCO.12 During the 2010-11 school year, 3,336 students from those cities are enrolled in nearby suburban schools through METCO.13 The vast majority of these students live in Boston, with just 146 from Springfield. In 2007-2008, 75 percent of METCO students were Black, 17 percent were Latino, 3 percent were Asian, with 5 percent classifying themselves as “other,” which could include biracial/multiracial students.14
Among the 37 school districts that currently accept METCO students, enrollments range from a high of 422 METCO students in Newton to a low of eight students in Sherborn’s elementary and middle schools. The town of Lincoln has the largest share of METCO students relative to its overall enrollment (9 percent).15 Other districts where METCO students make up a relatively large share of overall enrollment include Weston (7 percent), Concord (6 percent) and Wayland (5 percent). (See Table 1 on previous page for a breakdown of 2009-2010 METCO enrollments in each suburban district.)16
Even with the addition of METCO students, the vast majority of the student enrollment in these suburban districts remains overwhelmingly White. Currently, 13 of the 37 METCO districts are more than 90 percent White, even with the addition of METCO students. In only two of the districts (Brookline and Lincoln) do Black and/or Latino students make up more than 15 percent of the enrollment.17 In several districts, METCO students make up nearly the entire Black and Latino school enrollment.18
The two METCO sending districts – Boston and Springfield – have racial, ethnic and socioeconomic profiles that differ markedly from most of their suburban neighbors (and the
Commonwealth as a whole). Tables 2 and 3 detail these demographics.
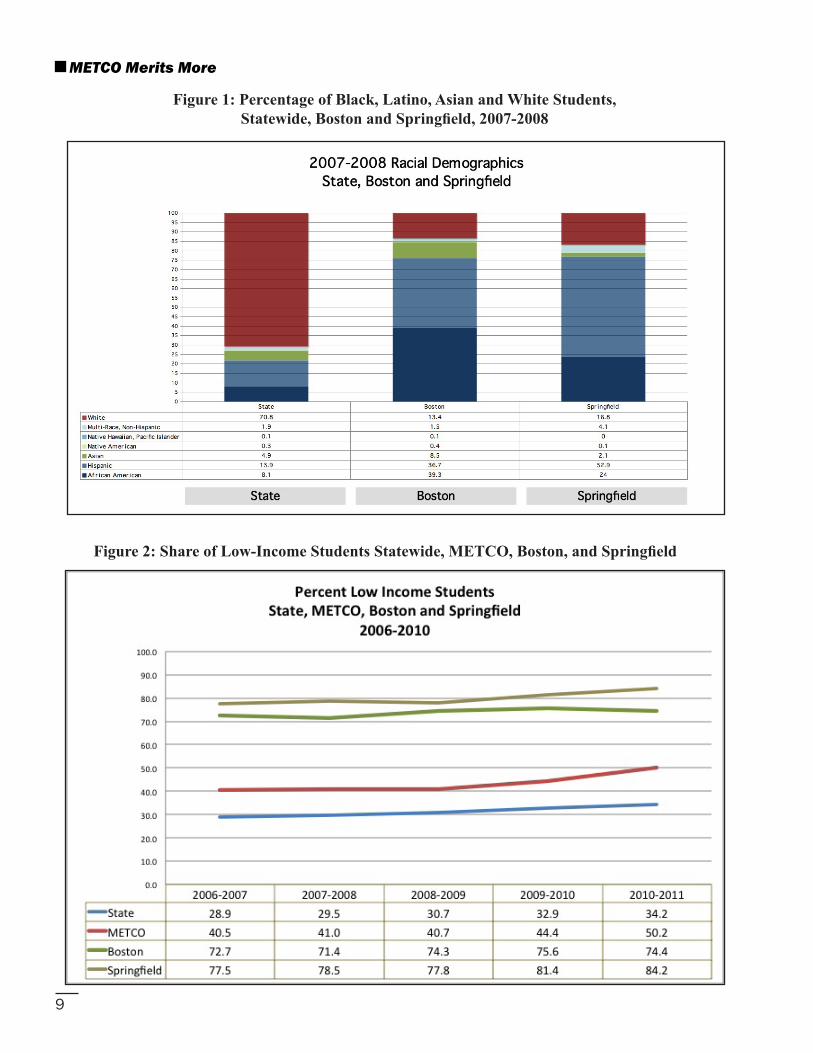
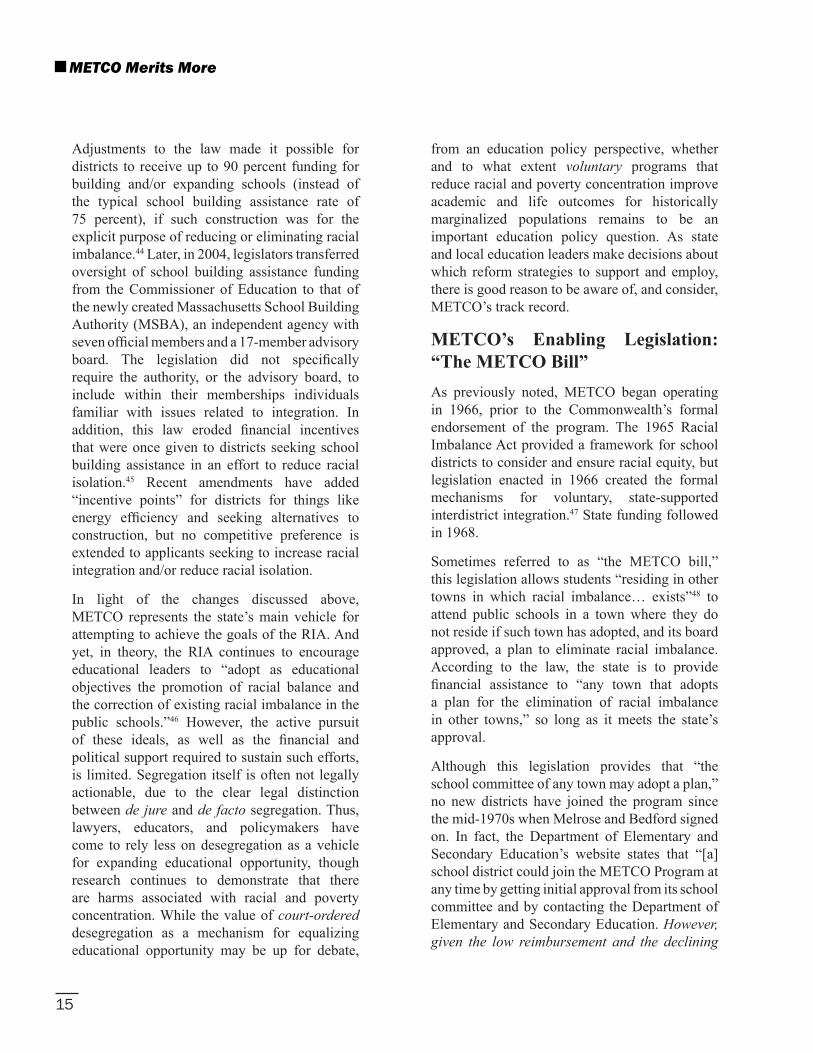
In 2007-08, Massachusetts public school students, on average, had student populations comprised of 13.9 percent Hispanic students, 8.1 percent Black, students and 4.9 percent Asian students. (See Figure 1) On average in 2007-2008, 29.5 percent of students in Massachusetts public schools came from families with low incomes. (See Figure 2)
Boston Black Latino Asian White Low Income
2006-2007 40.9 35.2 8.5 13.5 72.72007-2008 39.3 36.7 8.5 13.4 71.42008-2009 37.9 38.1 8.5 13.3 74.32009-2010 36.5 39.6 8.6 13.1 75.62010-2011 35.5 40.9 8.4 12.9 74.4
Springfield Black Latino Asian White Low Income
2006-2007 25.5 49.9 2.1 18.3 77.52007-2008 22 57 2 15 78.52008-2009 23.2 54.8 2.2 15.7 77.82009-2010 22.3 56.7 2.2 14.7 81.42010-2011 21.4 58.3 2.2 14.2 84.2
Tables 2 and 3: 2006-2010 Student Demographics, METCO Sending Districts
Source: “Enrollment By Race/Gender Report,” Massachusetts Department of Elementary and Secondary Education, accessed on May 5, 2011, http://profiles.doe.mass.edu/state_report/enrollmentbyracegender.aspx; “Selected Populations Report” Massachusetts Department of Elementary and Secondary Education, accessed on May 5, 2011, http://profiles.doe.mass.edu/state_report/selectedpopulations.aspx
9
METCO Merits More
Figure 1: Percentage of Black, Latino, Asian and White Students, Statewide, Boston and Springfield, 2007-2008
Figure 2: Share of Low-Income Students Statewide, METCO, Boston, and Springfield

10
Pioneer Institute for Public Policy Research
METCO Demographics
There are substantial differences in income levels and English language proficiency between the METCO population and the general student population in Springfield and Boston. Students in the urban schools are more likely to come from low-income families and to be English language learners (ELL). However, neither could METCO students be categorized as an elite group, as some detractors have charged.
Income - In 2010, more than 50 percent of METCO students came from families that earned low-incomes that qualified students for free or reduced-price lunch (FRL). Also important, is that the share of low-income METCO students qualifying for FRL has increased slightly since 2006. (See Figure 2). The share of low-income students is far higher in Boston and Springfield – currently 74.4 and 84.2, respectively.
Parent Education - A 1997 Harvard survey found parent education levels of a sample of METCO parents to be similar to the education levels found among parents in Boston.19 However, no current data exists with which to compare METCO parent education levels with those of public school parents in Boston and Springfield.
Special Education - Meanwhile, a higher share of METCO students are categorized as having “Special Education” needs (25 percent in 2010) than the share of students so designated in Boston (19.4 percent in 2010) and Springfield (22.8 percent in 2010).20 (See Figure 3)
English Language Proficiency - In 2010, about 30 percent of students in Boston and 14 percent in Springfield had limited proficiency in English. Less than 3 percent of METCO students have limited English proficiency. (See Figure 4)
The data offers a complex picture. Boston and Springfield educate far higher shares of students with limited English proficiency, a challenge that METCO districts do not confront in nearly the same concentrations. Meanwhile, 1 in
2 METCO students come from low-income families and 1 in 4 METCO students have special educational needs. It is crucial to acknowledge that demographic realities place enormous burdens upon urban educators. But this data also challenges the assumption that METCO students represent an elite educational group.
Funding & Supporting LegislationFunding - There are three components to METCO funding. First, the state funds METCO in the form of special METCO grants allocated to suburban districts on a per-pupil basis. Two, the state also provides receiving districts a transportation reimbursement. Third, since the suburban METCO districts count METCO students in their official enrollment each year, this can increase the amount of a district’s so-termed Chapter 70 aid that the state provides to cities and towns.
In Fiscal Year 2011, the “per pupil” METCO grant is about $3,100 for each enrolled METCO student.
As part of the METCO reimbursement, the state also provides each district an allocation for transportation, with specific amounts being determined on a district-by-district basis. In the past, adjustments have been made at the request of districts, and are based on the number of METCO students served by the district, the sizes and number of buses needed, and the distances traveled. (The total grant for transportation in FY 2011 is about $6 million – an average of about $1,800 per METCO student).
Each school district receives some funding from the state for education under the Chapter 70 Aid program. Because METCO receiving districts count METCO students as part of their official enrollment, and enrollment is one factor in determining how much Chapter 70 money a district gets, METCO students may very well bring in more state money to a district, albeit indirectly. However, whether or not METCO students increase the size of Chapter 70 allocations and by how much would depend on a range of

11
METCO Merits More
11
Figure 3: Share of METCO and Urban Students with Special Educational Needs
Figure 4: Share of METCO and Urban Students with Limited English Proficiency

12
Pioneer Institute for Public Policy Research
12
factors particular to a district. State officials use a complex multi-variable formula to determine the size of each grant. Such variables include enrollment, share of students with special needs, share of low-income students and the ability of a community to raise a state-determined adequate amount of education funding through local taxes. The sizes of these Chapter 70 allocations vary widely, depending upon these and other variables. For example, if one were to divide Chapter 70 allocations for 2010 by official enrollment, the city of Newton received about $1,200 per student and the towns of Concord and Lynnfield received $1,177. By comparison, Boston received about $3,570 in Chapter 70 aid per student and Springfield received $9,610 per student.
Even with the addition of Chapter 70 aid, though, METCO-related dollars (typically $4,900 per student for a METCO grant plus transportation allocation) coming into receiving districts does not begin to match the per-pupil expenditures either in the suburbs or urban areas.
To give a sense of the funding gap, in 2010, Lincoln spent $21,811 per student, Concord spent $16,438 per student, Newton spent $16,597, and Wayland spent $15,219. The per-pupil
expenditure for Boston in 2010 was $16,666. Springfield spent $13,605 per student.
In FY 2011, total funding for METCO was about $16.5 million, which represents a reduction from recent years.21 (See Figure 5)
In addition to the per-pupil costs, state allocations must cover the salaries of METCO directors/coordinators in each school district.
Supporting Legislation – METCO is best understood as part of Massachusetts’ long and mixed history of efforts to address entrenched racial inequalities in educational opportunity. Massachusetts’ struggle with educational opportunity is part of a larger, rich history in which issues of political inclusion and national identity were “debated, decided, and contested” in the context of public education.22 The complexity of this history is especially pronounced in Boston and its surrounding areas. Here in the “birthplace of public education,” state and local commitments to the concept of common schools collided with a conflicting discomfort with racial integration. What happened in Massachusetts shaped our nation and its education system in important ways, and thus continues to have far-reaching implications.
Figure 5: METCO Funding Levels FY 2005- FY 2011

13
METCO Merits More
Despite having effectively abolished slavery in 178323 and established by law the nation’s first free public school system six years later,24 intentionally segregated schools operated in Massachusetts until 1855, with varying levels of state and local government involvement.25 Massachusetts’ first segregated school was a private school created by African-American parents who were frustrated that the benefits of citizenship, in the form of public education, did not extend to their children. Opened in Boston in 1788, this school (which operated for only a short time), was created in response to a failed petition seeking legislative recognition that African-American children were equally entitled to public education. Another private school (later to be known as the Abiel Smith School) opened in 1798, educating Boston’s African-American children as parents continued to petition the city for public funding.26 Between 1810 and 1820, segregated schools began to receive public funding.27 This period of ostensibly voluntary segregation was short lived, though the issue of integration sharply divided the African-American community.28 Charging that Boston’s African-American schools were inadequate, African-American parents began petitioning the Boston School Committee in 1844, requesting the abolition of separate schools. However, the Committee resolved that, “separate schools for colored children… [are] not only legal and just, but [are] best adapted to promote the education of that class of our population.”29 This was reinforced in 1849 when the Massachusetts Supreme Judicial Court, in Roberts v. Boston, found no constitutional basis for the civil rights lawsuit that had sought to end segregation in schools.30 There, segregated schools were found not to run afoul of an 1845 state statute prohibiting “unlawful exclusion” from education.31 And so, Roberts gave rise to the “separate but equal” doctrine, which was adopted by the United States Supreme Court some 40 years later in Plessy v. Ferguson, the decision that defined the rights of African Americans across the nation from 1896 to 1954.32
State lawmakers in 1855 responded to Roberts by passing the nation’s first law prohibiting segregated schools (a similar bill had been rejected in 1851, not long after Roberts was decided). The Legislature’s reaction signals that attitudes about race and education in Massachusetts were not in line with the Roberts decision. The United States Supreme Court chose to ignore the Massachusetts Legislature’s direct rejection of Roberts when it sanctioned segregation in Plessy. Despite the theoretical protection the 1855 law afforded, it did not always alter the way that school districts operated. About a century passed with little or no active enforcement of the 1855 law. Many schools in Massachusetts would remain more or less racially separate institutions for about a century. While racial isolation undoubtedly arises from a mix of tangled forces, some of them linked to historical discrimination, others due to economic inequalities, suburban zoning policies and personal choice, history suggests that educational leaders in Massachusetts continued to engage in acts of intentional segregation for years to come.
Two legal scholars writing about desegregation in Boston in the 1970s noted that, even after the United States Supreme Court’s 1954 ruling in Brown v. Board of Education, “much of this nation was unwilling to deal affirmatively with the problems of racial segregation in public education.”33 Achieving desegregation in Northern cities, they wrote, “clearly would necessitate a remedy more drastic than anything attempted in the first decade after Brown.”34 This was, in part, due to the fact that the Brown decision applied to de jure segregation – segregation that is enforced or supported by law. However, the demography of the North was largely considered to be the result of de facto segregation (segregation in practice or actuality as opposed to codified and/or supported by law) and thus far more difficult to prove and to remedy through the courts. In part because of the de jure/de facto distinction, racial isolation and its attendant, social inequality, remained largely intact in Massachusetts’ metropolitan areas.

14
Pioneer Institute for Public Policy Research
In 1965, Massachusetts took a bold step to address this longstanding and tacitly accepted educational equity and racial isolation by passing the Racial Imbalance Act (called “An Act Providing for the Elimination of Racial Imbalance in the Public Schools”). Unaddressed educational inequalities in Boston were a major impetus for the law and its passage came after black parents’ protests about low school quality and lack of access to more successful, better-resourced schools.35 Boston’s African-American parent activists and civil rights advocates voiced their complaints about inequality and segregation to the state and asked lawmakers for relief. The resulting Racial Imbalance Act authorized the Massachusetts Board of Education to do two things: 1) fund voluntary efforts to increase racial diversity and/or reduce racial isolation;36 and 2) require local school districts to adopt their own integration plans.37
The Racial Imbalance Act was the product of bi-partisan cooperation and the first state law of its kind.38 A prior version of the law had been proposed by Governor John Volpe. Its writing was informed by a 132-page report, Because It Is Right—EDUCATIONALLY, issued in 1965 by the Advisory Committee on Racial Balance in Education.
As passed, the law compelled school districts to address segregation, regardless of its cause, in any school with a student body comprised of more than 50 percent students of color (referred to as “non-white students”).39 Thus, it became official Commonwealth policy to “encourage all school committees to adopt as educational objectives the promotion of racial balance and the correction of existing racial imbalance in the public schools.”40 Importantly, the law also required racial balance to be an objective in all decisions involving the drawing or altering of school attendance lines, establishing of grade levels, and the selection of new school sites.41
As part of the law, school district officials each year were required to submit statistics on student
demographics for each of their schools. If any schools were out of compliance, school districts were notified in writing by the Massachusetts Board of Education, and were required to devise corrective plans. Districts maintained control over how to accomplish racial balance. The Racial Imbalance Act provided support to racially imbalanced districts (including consultation with the Board of Education, which could make recommendations to districts when proposed plans were deemed insufficient), but it also provided for judicial enforcement and allowed the Board of Education to withhold funding from districts that “[did] not show progress within a reasonable amount of time.” The Act also established an advisory committee on racial imbalance, which was to inform the Massachusetts Board of Education in its pursuit of racial balance.42
As legislators and educators learned lessons about the challenges of reducing segregation, the law evolved. In fact, a considerable amount of state funding was once available to facilitate district compliance with the Racial Imbalance Act. In 1974, a near rewrite of the original law eliminated the Massachusetts Board of Education’s authority to order school redistricting in place of increased financial support for districts attempting to reduce and/or eliminate racial imbalance. Grants made available through the 1974 amendments became known as “Chapter 636 funding,” which provided funds to school districts with approved racial balance plans. These funds were used to create parent information centers, assist in recruiting, training and supporting teachers of color and provide in-service trainings, among other things. Financial incentives also included subsidies for school building construction and improvement, as well as grants for magnet school programs. In November 2001, however, the Board of Education voted to approve the Commissioner’s FY 2003 state education budget, which eliminated Chapter 636 funding (some funding for parent resource centers remained intact, but was moved under a different line item).43
15
METCO Merits More
Adjustments to the law made it possible for districts to receive up to 90 percent funding for building and/or expanding schools (instead of the typical school building assistance rate of 75 percent), if such construction was for the explicit purpose of reducing or eliminating racial imbalance.44 Later, in 2004, legislators transferred oversight of school building assistance funding from the Commissioner of Education to that of the newly created Massachusetts School Building Authority (MSBA), an independent agency with seven official members and a 17-member advisory board. The legislation did not specifically require the authority, or the advisory board, to include within their memberships individuals familiar with issues related to integration. In addition, this law eroded financial incentives that were once given to districts seeking school building assistance in an effort to reduce racial isolation.45 Recent amendments have added “incentive points” for districts for things like energy efficiency and seeking alternatives to construction, but no competitive preference is extended to applicants seeking to increase racial integration and/or reduce racial isolation.
In light of the changes discussed above, METCO represents the state’s main vehicle for attempting to achieve the goals of the RIA. And yet, in theory, the RIA continues to encourage educational leaders to “adopt as educational objectives the promotion of racial balance and the correction of existing racial imbalance in the public schools.”46 However, the active pursuit of these ideals, as well as the financial and political support required to sustain such efforts, is limited. Segregation itself is often not legally actionable, due to the clear legal distinction between de jure and de facto segregation. Thus, lawyers, educators, and policymakers have come to rely less on desegregation as a vehicle for expanding educational opportunity, though research continues to demonstrate that there are harms associated with racial and poverty concentration. While the value of court-ordered desegregation as a mechanism for equalizing educational opportunity may be up for debate,
from an education policy perspective, whether and to what extent voluntary programs that reduce racial and poverty concentration improve academic and life outcomes for historically marginalized populations remains to be an important education policy question. As state and local education leaders make decisions about which reform strategies to support and employ, there is good reason to be aware of, and consider, METCO’s track record.
METCO’s Enabling Legislation: “The METCO Bill”As previously noted, METCO began operating in 1966, prior to the Commonwealth’s formal endorsement of the program. The 1965 Racial Imbalance Act provided a framework for school districts to consider and ensure racial equity, but legislation enacted in 1966 created the formal mechanisms for voluntary, state-supported interdistrict integration.47 State funding followed in 1968.
Sometimes referred to as “the METCO bill,” this legislation allows students “residing in other towns in which racial imbalance… exists”48 to attend public schools in a town where they do not reside if such town has adopted, and its board approved, a plan to eliminate racial imbalance. According to the law, the state is to provide financial assistance to “any town that adopts a plan for the elimination of racial imbalance in other towns,” so long as it meets the state’s approval.
Although this legislation provides that “the school committee of any town may adopt a plan,” no new districts have joined the program since the mid-1970s when Melrose and Bedford signed on. In fact, the Department of Elementary and Secondary Education’s website states that “[a] school district could join the METCO Program at any time by getting initial approval from its school committee and by contacting the Department of Elementary and Secondary Education. However, given the low reimbursement and the declining

16
Pioneer Institute for Public Policy Research
funding for the program, it is unclear exactly how a school district could afford to join unless METCO funding were increased.49
METCO’s Track RecordExplanation of Data Limitations, Student Achievement as Measured by the MCAS, Graduation Rates and College Attainment
Summary
MCAS data from 3rd, 6th and 10th grades show that on average, from 2006 to 2010, METCO students, who are overwhelmingly African American and Latino, tended to dramatically outperform their African American and Latino counterparts both in Boston and Springfield. With rare exceptions in Math in some years (discussed below), METCO students, on average, also outperformed Boston and Springfield students overall on the MCAS, even after factoring in the MCAS scores of White and Asian students in those cities. The most notable differences, though, are observed in the strikingly high graduation rates earned by METCO students. These rates far surpass not only the rates found in urban centers, but also surpass state averages recorded in each of the five years examined.
While these data are encouraging signs for METCO, it is also extremely important to recognize the limitations of this data. Because of “self-selection” bias, the high relative performance of METCO students revealed here cannot be fairly attributed to the METCO program itself. This is because the very qualities that plausibly cause METCO students and their families to choose the program – say, perseverance, foresight, planning, drive, ambition – might themselves be factors contributing to higher relative academic performance. So, in order to remove those potential influences, it would be necessary to compare the performance of METCO students to a control group that is similar in important ways, but whose members did not attend METCO. This might include students who signed up for METCO but who
did not get in and thus remained in their home districts of Boston or Springfield. Absent this kind of analysis, which is beyond the scope of this brief, we cannot conclude definitively that participation in METCO itself explains METCO students’ higher student achievement. In other words, it is plausible that METCO students would be performing at similar levels if they had remained in the Boston or Springfield schools. That said, this data does paint a clear picture of METCO students’ relative academic success in what are typically highly competitive college-preparatory academic environments. What’s more, METCO students tend to perform well even given the host of challenges they face, including early risings and long bus rides to and from school. As discussed in this brief, METCO students, while perceiving increased opportunities in suburban schools, also are commonly challenged by cultural conflicts, stereotyping and feelings that they are not fully accepted by teachers and students in their school communities.
Because of the media’s and policymakers’ predictable focus upon short-term data outcomes, we must make it doubly clear here, that we are not arguing that METCO, alone, drives higher test scores. Similarly, we recognize that the comparably lower scores registered by students in Boston and Springfield’s public schools are likely in large part due to immense challenges beyond the control of educators. Suburban educators simply do not face such challenges in concentration, which is precisely one reason why we are recommending that more students be given the chance to attend less overwhelmed public schools of the sort found not far from the city line.
A regular and more thorough exploration of METCO student achievement would be immensely valuable and likely enhance the program by allowing local educators to see where students might be making progress and where they might not be reaching their full potential. This could drive a more effective allocation

17
METCO Merits More
of resources. Moreover, even in spite of the encouraging data we present here, we do not believe it fair to judge METCO’s worth – or any program’s worth – on test scores and shorter-term quantitative data alone. Rather, we argue that it is important to preserve METCO and put energy and resources into improving it because it effectively provides thousands of students access to well-functioning, opportunity rich schools and creates racial and ethnic diversity, which is linked to numerous educational benefits for students of all racial backgrounds. Interviews with graduates of METCO, explored in this brief, demonstrate that many of METCO’s benefits were manifest long after graduation and while tangible, are not easily quantifiable. METCO’s worth, we argue, should thus be judged over the long term and based on multiple measures, including assessments from students who experienced the program.
MCAS Reading and English Language Arts
In Reading and English Language Arts, far higher shares of METCO students consistently scored in
the Proficient and/or Advanced categories on the MCAS when compared with Black and Latino students in Boston and Springfield. This is true in all three grades and all consecutive five years examined. Similarly, METCO students outperform Boston and Springfield students overall in these subjects in all five years. Importantly, the small gap between METCO student performance and state overall performance is largest in third grade (5 percentage points in 2010) but consistently narrows or else disappears entirely and in one year even reverses by 6th and 10th grades, with METCO students scoring above the state average. (See Figures 6-8).
MCAS Math
In Math, the share of METCO students scoring in the Advanced and/or Proficient categories on MCAS has fluctuated during the five years examined. Again, though, the gap between state average performance and METCO performance is largest in grade 3 (in 2010 a difference of 14
Figure 6: MCAS Reading 3rd Grade 2006-2010. METCO, Boston, Springfield and State Averages

18
Pioneer Institute for Public Policy Research
Figure 7: MCAS English Language Arts 6th Grade 2006-2010. METCO, Boston, Springfield and State Averages
Figure 8: MCAS English Language Arts 10th Grade 2006-2010. METCO, Boston, Springfield and State Averages

19
METCO Merits More
percent points) but, in most years, tends to narrow by 6th and 10th grades. (See Figure 9).
In 6th grade Math, METCO students outperformed all categories of students except for the state average. (See Figure 10).
By 10th grade, the gap between METCO and state average performance narrowed considerably since third grade. (For example, in third grade in 2007, the gap here was 21 percentage points but in 10th grade that year, the gap was just 6 percentage points).
In 10th grade, METCO students outperformed all categories of students (except for the state average) in four of the five years. In 2009 and 2010 METCO students outperformed all categories of students, except for the state average where a 9 percentage point gap remained. (See Figure 11).
High School Graduation
METCO students consistently graduate high school at far higher rates than the state average and all other categories of students we examine here. For example, in 2009 (2010 graduation data was not yet available for METCO students), 93 percent of METCO students graduated high school on time compared with 81.5 percent of students statewide, 61 percent in Boston and approximately 61 percent in Springfield.
The lowest graduation rates and highest dropout rates are observed in Springfield, particularly for Latino students, with 33 percent dropping out in 2009. The dropout rate for METCO students – 2.8 percent in 2009 – is by far the lowest among all categories of students in all years for which data is available. For example, in 2009, 9.3 percent of students statewide dropped out. (See Figure 12)
Figure 9: MCAS Math 3rd Grade 2006-2010, METCO, Boston, Springfield and State

20
Pioneer Institute for Public Policy Research
Figure 11: MCAS Math 10th Grade 2006-2010, METCO, Boston, Springfield and State
Figure 10: MCAS Math 6th Grade 2006-2010, METCO, Boston, Springfield and State

21
METCO Merits More
Figure 12: Graduation Rates 2006-2009, METCO students, Boston, Springfield and State
Figure 13: College Attainment, State, Boston and Springfield, 2006-07 to 2008/2009

22
Pioneer Institute for Public Policy Research
College Attainment
Internal surveys reported by METCO Inc., suggest that 90 percent of METCO graduates go on to post-secondary education, including 2- and 4-year colleges.50 In 2009, the Boston Globe reported that METCO students were far more likely than their suburban resident peers to attend 2-year schools.51
How Do Families, Students and Alumni Assess METCO?Since METCO is a voluntary school-choice program, one important test of METCO’s success is obviously whether or not families and graduates consider METCO to be a worthy program. Existing research into these questions shows that from the perspective of families and former METCO students, the program is well worth the inconvenience and numerous challenges it introduces.
In 1997, Harvard researchers surveyed about three-quarters of METCO parents and students (about 2,400 people) in three suburban districts. The survey considered the demographics of participants and their satisfaction with the program, and asked respondents to suggest improvements for the program.52
About 75 percent of parents surveyed said that the suburban schools’ “academic program” was the principal reason for placing their child in the METCO program. More than 90 percent of parents and students surveyed reported that METCO had been a positive experience. About 85 percent of students reported that their experiences with suburban families had been “excellent.” As for improvements, about 40 percent of parents and students surveyed suggested that suburban districts hire more teachers and administrators of color. The survey results also showed that students and families had income and education levels that were, on average, similar to families in Boston.
For her doctoral dissertation in sociology, Simone Ispa-Landa53 compared the experiences of 38 students enrolled in METCO to the experiences of 26 students who had been waitlisted for METCO. She found that, compared to waitlisted students, METCO students had benefited from what she described as the “entitlement culture” of affluent suburban schools.
Waitlisted students in schools where black and/or Latino students were in the majority tended to perceive that school policies were unchangeable. In contrast, METCO students had learned two important lessons typically associated with upper-middle class youth.54 First, they had learned that they could negotiate with authority figures to further their academic interests. Second, METCO had helped them gain “specific tools” that enabled them to negotiate with teachers more confidently and effectively. For example, METCO students treated teachers as partners rather than adversaries, and knew how to appeal to their teachers’ interest in fairness.
Ispa-Landa also found gender differences in the everyday experiences of students in METCO. Boys in METCO tended to feel embraced by their suburban peers and to enjoy a high social status. In contrast, girls in METCO often reported feeling excluded and marginalized from suburban peer groups. She suggests that open discussion of gendered and racial stereotypes in suburban schools could increase levels of interethnic tolerance, friendliness and friendship in suburban schools.
In the 2001 book, The Other Boston Busing Story: What’s Won and Lost Across the Boundary Line (by Susan Eaton, this paper’s co-author), former METCO students talked about the benefits and the challenges associated with their experiences. This interview study with 65 African-American men and women finds that past participants perceive several tangible benefits from their experience in METCO. Most often, it was not until the adults began learning and living on college campuses and working in
23
METCO Merits More
business or other social institutional that they more fully understood the reasons they were in suburban schools in the first place. Specifically, the adults tended to perceive that prior, sustained experience interacting in an environment that imitated college and the workforce made them more likely to enter similar settings, feel more comfortable once they were there and be more likely to succeed (and less likely to be intimidated or scared off) by initial awkwardness related to racial and cultural difference. Adults quite often said that information they have received in their suburban schools – details and guidance about college, career paths and connections – had been crucial for accessing opportunity in their lives. Similarly, the students perceived that their ability to associate themselves with a well-regarded learning institution forced other authority figures the opportunity to see them as capable of success in an academically or professionally competitive environment. That said, moving between distinct “white” and “black” worlds often made the METCO students feel they truly belonged in neither. The majority of adults resolved these conflicts over time. However, many of the complaints expressed by METCO graduates in this study – such as stereotypes voiced by suburban students and lack of racial diversity among teachers – remain to be salient concerns among current METCO parents, students and advocates.55
Research Findings on the Educational Benefits of Diversity
Diversity and/or reductions in concentrated poverty certainly do not guarantee either that a student’s academic achievement will improve or that he or she will find success in high school and beyond.
However, research strongly suggests that lower poverty schools that do not enroll disproportionate shares of African-American and Latino students offer more favorable conditions than high-poverty schools, where a host of challenges threaten to undermine learning. For example, in 2007,
the National Academy of Education reviewed the research on the impact of racial diversity in schools. The Academy concluded:
“[T]he research evidence supports the conclusion that the overall academic and social effects of increased racial diversity are likely to be positive. Racial diversity does not guarantee such positive outcomes, but it provides the necessary conditions under which other educational policies can facilitate improved academic achievement, improved intergroup relations, and positive long-term outcomes.”56
More recently, new research published in the peer-reviewed journal, Teachers College Record, augments previous findings. This research, published in 2010, is particularly rigorous. It draws from several strong databases and employs cutting-edge statistical methods. This comprehensive collection of studies pays meticulous attention to separating the discrete contributions that schools, teachers, families, and students themselves make to a variety of important educational outcomes, such as test scores and graduation rates.57
The TCR research found that schools that were racially diverse and that did not enroll disproportionate shares of low-income students tended to be positively associated with math, science and verbal achievement, and lower drop-out rates.58 Over the long term, the TCR research showed, adults who had been exposed to diversity were more likely to desire racially mixed neighborhoods and schools and work in racially diverse settings.59 It appears, too, that the particular nature of a school environment – for example, whether the school is a model of inclusion and equal participation – helps determine whether or not its graduates develop the skills to navigate and find comfort in racially diverse settings later in life.60
Certainly, some high-poverty schools are able to overcome the myriad challenges associated with segregation and concentrated poverty. However,

24
Pioneer Institute for Public Policy Research
research also strongly suggests numerous short and longer-term benefits associated with racial and economic diversity. In recent years, journalists and commentators have greatly favored stories about “beat the odds” urban schools. However, research shows that high-scoring, high-poverty schools are still less prevalent than the media’s focus on them might suggest.61
METCO in the Context of Intense Regional Inequalities in Metro Boston and SpringfieldMETCO is one of eight voluntary inter-district school desegregation programs operating in the United States and the second oldest continually running program of its kind in the nation.62 These inter-district programs differ from each other in some ways. But they all share two complementary goals: To provide a high quality education to students from challenged urban communities, while creating opportunities for urban and suburban students to benefit from racial and economic diversity. Like METCO, all of the programs are located in regions that are sharply segregated by race, ethnicity and socio-economic status. In each region, school boundary lines that require students to attend school where they live have historically been intractable barriers to educational equity.
Previous sociological research brings to light the way that government-enforced school district boundary lines, coterminous with racially and economically segregated housing patterns, perpetuate racial segregation and contribute to educational inequality in myriad ways.63 The high levels of racial and economic segregation and its negative consequences for both the Boston and Springfield regions have been well documented. In spite of these repeated findings, local and state officials in recent years have made few, if any, sustained public efforts to systematically explore and discuss, much less reduce, the intensity of racial and economic segregation and its attendant inequalities. METCO is in fact the only state-funded program explicitly designed
to reduce racial and economic isolation in the Commonwealth’s schools. Researchers based at Northeastern University and affiliated with the demographic analysis group diversitydata.org recently released two reports about school segregation.64 The first report found that, of the nation’s 100 largest metro areas, the Boston region in 2010 was the fourth most segregated for Latino students and the twenty-eighth most segregated for African-American students.65 According to this report, the typical Latino student in metropolitan Boston attends an elementary school where 65 percent of students are poor. This rate is 3.8 times that experienced by the typical white student in the Greater Boston area. Similarly, the typical African-American student in the region attends a school where 61 percent of students are poor, which is 3.5 times the rate found in the school of a typical white student in the metropolitan area.66
The Springfield region’s public schools are also intensely segregated. Diversitydata.org’s report on school segregation rates nationwide found that Springfield ranked second behind Los Angeles for the most segregated for Latino students and ninth for the most segregated schools for African-American students.67
Diversitydata.org’s second report, among other things, showed that the breadth of educational options would expand if Boston Public School students in particular neighborhoods were given access to schools within a five mile radius, notwithstanding district lines.68 Importantly, the authors also observed that schools in the Boston metropolitan region are some of the most fragmented in the country, with approximately one school district per 3,500 students.69 Because most racial isolation exists between school districts, not within them,70 the authors recognize the limitations of racial and economic desegregation efforts that do not extend beyond district boundaries. There is only so much that individual school districts can do to effectively promote integration in the context of intense racial and economic segregation between districts. Without

25
METCO Merits More
programs like METCO, it is extremely difficult for families in Boston and Springfield to gain access to the types of educational opportunities that many families living in nearby suburbs take for granted.
In 2009, the Kirwan Institute for the Study of Race and Ethnicity at the Ohio State University released a study showing that more than 90 percent of African Americans and Latinos in Massachusetts lived in so-defined “low-opportunity” neighborhoods.71 Only 31 percent of Whites lived in such neighborhoods. Whites with low incomes were not nearly as concentrated in low-opportunity communities, as were African-Americans and Latinos who had low incomes. Just 42 percent of low-income White households lived in low-opportunity communities, while 33 percent of low-income White households lived in high-opportunity communities. Meanwhile, more than 95 percent of low-income Latinos and more than 93 percent of low-income African-Americans lived in low-opportunity communities in the state, according to the report.
The Kirwan Institute researchers classified the state’s neighborhoods by measuring almost 20 indicators related to education, housing, economic/job opportunity and health (including such variables as the share of students in poverty, the share of students meeting standards in reading and math, unemployment rates, and crime rates). The report found that high opportunity neighborhoods – characterized by low crime rates, high graduation and test passage rates, generous school funding, high home values and low unemployment rates – concentrated just outside Boston. These included many of the affluent suburbs attended by METCO students such as Newton, Lexington, Lincoln, Weston, and Wayland. Low opportunity communities included Boston, Lynn, Lowell to the north and Springfield and Holyoke in western Massachusetts. In western Massachusetts, the high opportunity neighborhoods included some suburbs on the periphery of Springfield, such as Longmeadow. METCO is explicitly designed to intervene in this
well-documented, highly unequal distribution of opportunity.
Conclusion and Recommendations Provide Adequate Funding
Typically, school districts that accept METCO students receive about $4,900 for each student they enroll in addition to whatever small additional state aid they might receive by including METCO students in enrollment counts. With this money, suburban districts fund the salary of METCO directors, in addition to assuming all other typical educational costs.
The state’s development of charter public schools as a core component of its educational reform agenda demonstrates a clear commitment to choice-based measures. In February 2011, for example, the state’s education commissioner Mitchell Chester endorsed 17 new charter schools, including 10 to be located in Boston. It is not clear why METCO, which is popular among families, has a strong track record and established commitment within local communities, receives little to no public endorsements and continues to suffer budget cuts.72
Create Incentives for Suburban Participation in METCO
The state’s Racial Imbalance Act encourages communities to pursue diversity, but provides few incentives for districts to do so. In the recent past, the state had provided Chapter 636 money to aid diversifying school districts, but that funding has been eliminated. The state can, however, find new ways to support districts pursing integration. To start, policymakers should ensure that school integration experts are included as members of the School Building Authority advisory committee. State leaders, for example, could encourage suburban districts to enroll METCO students by tying school building funds to a district’s commitment to guarantee a set number of seats for METCO students. Also, the state could strengthen incentives for school districts to seek

26
Pioneer Institute for Public Policy Research
school building assistance funds for the purpose of reducing racial and socio-economic isolation.
Government could provide more benefits to METCO districts as well, such as offering grant programs for teacher training or competitive grants that fund locally designed innovative educational programs that enhance the experience of METCO students and foster stronger relationships between students in METCO schools.
Educators and government officials can show their support for METCO and its goals by simply talking about its importance. Acknowledging the context of regional inequality and calling attention to the need to create a sense of collective responsibility for our education system are important–and relatively easy–things for educators and policymakers to do.
As they demonstrate support of METCO, government officials should take time to investigate the extent to which and under what kinds of conditions educators, parents and students in Massachusetts support racial diversity. Understanding these perspectives might lead to more responsive policies and programs. For example, in 2009, the Ohio State Board of Education turned to the Kirwan Institute for the Study of Race and Ethnicity to help it revise its diversity policy statewide. After facilitating a series of regional meetings with superintendents, administrators and other stakeholders, the Kirwan Institute submitted a comprehensive set of recommendations to the state board. Similarly, several school districts (such as Montgomery County, Maryland and Portsmouth, New Hampshire) worked with the Hartford, Connecticut-based civic engagement group, Everyday Democracy to craft policies such as student assignment plans and parental/community engagement efforts.
Systematically Explore METCO Expansion
Educational leaders should appoint a working group or advisory committee to explore the feasibility, cost and community interest in
expanding the METCO program to provide more students from other challenged urban communities access to high-performing, rigorous public schools. Other potential sending communities might include Holyoke, Brockton, Lynn, Lawrence, and Lowell. The working group and advisory committee should include METCO administrators, transportation and housing experts, scholars, elected officials and public school educators from urban and suburban communities. Consulting with programs such as the Steppingstone Foundation and A Better Chance (the program that enabled Massachusetts Governor Deval Patrick to attend Milton Academy), which both have similar approaches to METCO, might also provide valuable insights.
By studying other existing inter-district models, the state might consider expanding METCO in the future. In nearby Connecticut, inter-district magnet schools located in cities such as Hartford and New Haven attract students with distinct educational offerings that appeal to both urban and suburban students.73 In addition, Hartford’s Project Choice is similar to METCO, in that it enables Hartford students to attend schools in nearby suburbs. Connecticut’s programs are part of a legal remedy resulting from a state constitutional case called Sheff v. O’Neill, thus Connecticut funds the creation of its inter-district magnet schools. The state also provides transportation for participating students. Making METCO a “two-way program” (where both urban and suburban schools can choose to participate in the program) would likely increase suburban participation and help strengthen community support. Long term, the state might consider expanding METCO to include inter-district magnet schools, which would be open to students who attend participating METCO districts. Through the Magnet Schools Assistance Act, federal funding might be available to help support these efforts.

27
METCO Merits More
Actively Advocate for Federal Funding for Voluntary School Desegregation
Educators and policymakers might also consider lobbying federal officials to provide more support for voluntary, choice-based, measures that provide equal educational opportunities and create racial diversity. In 2007, the United States Supreme Court affirmed achieving diversity and avoiding racial isolation as a “compelling government interest” in the oft-misunderstood Parents Involved in Community Schools v. Seattle School District No. 1 (hereinafter referred to as “Parents Involved”).74 Indeed, that decision did place limits on a school district’s ability to use the race of individual students in assigning them to particular schools. However, Parents Involved did not prohibit educators from pursuing integration altogether. Educators may still consider race in recruiting students to schools of choice, in marketing their programs and through providing educational programs that are tailored and responsive to the needs of particular student populations. Several tools are available to help educators and policymakers understand which avenues for pursuing integration are legally and politically viable. This includes a 2008 manual from the Civil Rights Project at the University of California, Los Angeles and the Legal Defense Fund, Still Looking to the Future: Voluntary K-12 School Integration: A Manual for Parents, Educators and Advocates.
The National Coalition for School Diversity (NCSD) is an emerging voice in advocating for increased federal support for racial and economic integration. This network of national civil rights organizations, university-based research institutes and local educational advocacy groups has produced numerous policy recommendations and briefs about racial and economic integration in K-12 schools. For more information on NCSD, see school-diversity.org.
In recent years, METCO Inc. representatives have been part of a loose network that helps inter-district programs share information, discuss
federal and local education policy and consult with one another about common challenges and ways to strengthen their programs. In 2010, METCO, along with three other inter-district programs that participate in this collaborative, applied for a development grant from the U.S. Department of Education under its Investing in Innovation Fund grant program (also known as “i(3)”).75 The programs sought funding to improve the quality of their individual programs and to sustain continued collaboration, including: 1) thorough and systematic research and program evaluation; 2) strengthening ties with urban school districts; 3) improving students’ educational experiences and increasing educator effectiveness; 4) expanding program capacity through the use of technology/media; and 5) improving community outreach and education efforts. A three-part research agenda was designed to produce a comprehensive and useful analysis of student performance (broadly defined) and the student experience. Though the grant application was ultimately denied by the Department of Education, the application provides a research and program development framework, showing that METCO (and programs like it) could benefit from increased federal funding in concrete (and already contemplated) ways.
Provide Publicly Accessible Data on Selection Process, Student Performance and Growth
Data transparency about selection processes, student performance and growth may increase public support and program visibility. If METCO is to receive adequate funding, policymakers and the public deserve more easily accessible information about the procedures that govern the program, its organizational structure and the performance of students. Data may reveal areas where educators should commit more resources and attention. Districts where METCO students are experiencing success could thus share practices with other districts. Currently, the state is equipped to conduct analyses of METCO student outcomes. Such analyses should be required, conducted regularly and

28
Pioneer Institute for Public Policy Research
made immediately available to the public. Also, a more detailed analysis that uses proper control groups and would allow comparisons of METCO students and similar peers would also be useful and informative. In such an analysis, it would be important to study a cohort of METCO students as they progress through a system over time. Though this is costly and time consuming, such a study is more informative than mere “snapshot” that report data in a given year.
Address Longstanding Concerns About METCO Students’ Experiences
Surveys and qualitative research strongly suggests that students believe they are receiving a high quality education through the METCO program; however, this research has also consistently uncovered aspects of the program that need improvement. Participation in METCO is often grueling, with early mornings and late arrivals home. Students report experiences of stereotyping and cultural insensitivities, suggesting that that METCO students might benefit from more support, which could take on many forms. First, METCO students would benefit if teachers in receiving districts had increased access to professional development and training. Next, METCO students might be given more opportunities to discuss and process their experiences in safe and supportive environments, possibly with the help of trained facilitators. Finally, receiving districts could make efforts to hire and mentor more staff of color. Importantly, the responsibility for strengthening support services for METCO students (including the costs of professional development opportunities and support services) cannot be reasonably expected of individual school districts—the state should play more of an active role in ensuring that METCO students are adequately supported.
Skilled, caring educators can mitigate the types of challenges consistently voiced by METCO students, through development of constructive forums for METCO students and suburban students to safely discuss their daily experiences, conflicts
and challenges, in addition to the positive aspects of their experience. Such educational exercises often bring stereotypes to light and break them down, helping to foster positive relationships and harness the educational potential of racially and culturally diverse settings.
Many teachers and administrators in METCO districts have benefited from courses offered by Waltham-based Educational Collaborative of Greater Boston (EDCO) and other professional development providers offer courses to assist both teachers and students address these topics.
To spur discussion and foster understanding between students films, books, and courses that provide thought provoking exploration of METCO through the eyes of students are helpful.
Similarly, METCO districts should actively explore opportunities for hiring and mentoring staff of color, not only for the sake of providing important role models and possibly increasing METCO students comfort levels, but so that the educational institution more accurately reflects the true demographics of the region and the state.
Increase Awareness and Understanding of METCO in the Suburbs
METCO has generally received strong support from educational leaders in many suburban districts. However, letters to the editor and other public discourse suggests that some suburban residents do not have a complete understanding of the goals, funding structure and underlying justification for the METCO program in their communities. Well-marketed, regular information sessions and public presentations or speakers’ series are an effective and inviting way to inform the public about METCO and its role in the community. Such presentations should allow for public feedback and questions. Presentations should include the story of METCO’s genesis, and history, its enduring popularity and its goals. To increase understanding of the justification for METCO, presentations should place METCO within the context of regional inequalities and

29
METCO Merits More
racial segregation. Including research findings about the educational benefits of racial and economic diversity would also be a positive contribution. Many districts have included METCO alumni and current students on panel discussions to great success.
About the Authors:Susan Eaton is research director at the Charles Hamilton Houston Institute for Race and Justice (CHHIRJ) at Harvard Law School. She is author of “The Other Boston Busing Story” (Yale, 2001), which explores the adult lives of African American men and women who had participated in METCO. Her most recent book, The Children in Room E4: American Education on Trial (Algonquin, 2009) weaves the stories of an urban neighborhood school and a contemporary civil rights trial in Hartford, Connecticut. She holds a doctorate in education from Harvard.
Gina Chirichigno, formerly a researcher and program coordinator at CHHIRJ, is a post-doctoral researcher at the Kirwan Institute for the Study of Race and Ethnicity at The Ohio State University. She is also a member of the Massachusetts Racial Imbalance Advisory Council, which reports to the State Department of Elementary and Secondary Education.* Additionally, she is a consultant to research institutes and other educational programs on issues related to race, equal opportunity and the law. Gina is a graduate of Hampshire College in Amherst, MA and earned her law degree at Howard University.* The opinions expressed here are those of the writers, and do not necessarily reflect the views and opinions of the Massachusetts Department of Elementary and Secondary Education and/or those of the Racial Imbalance Advisory Council.
Acknowledgments:The authors would like to thank Kelly Garvin of the Charles Hamilton Houston Institute for Race and Justice at Harvard Law School, Professor Hilary Moss at Amherst College, Nancy McArdle, and the anonymous peer reviewers who took the time to critique this work and offer their insights and suggestions.
About Pioneer:Pioneer Institute is an independent, non-partisan, privately funded research organization that seeks to improve the quality of life in Massachusetts through civic discourse and intellectually rigorous, data-driven public policy solutions based on free market principles, individual liberty and responsibility, and the ideal of effective, limited and accountable government.
About The Houston Institute:The Charles Hamilton Houston Institute for Race and Justice aspires to help build a society in which all members enjoy equal access to the privileges, rights and responsibilities of full membership. We produce research, provide public presentations, and convene advocates, practitioners, litigators and scholars engaged in contemporary civil rights work.
Recent Pioneer PublicationsThe Big Shrink: Declining Establishment Size in Massachusetts, White Paper, May 2011
Testimony to the Joint Committee on Health Care Financing, Testimony, May 2011
Dumping the Know-Nothing Amendments: Church, State and School Reform, Transcript, May 2011
Be Not Afraid: A History of Catholic Schooling in Massachusetts, White Paper, March 2011
Fixing the Massachusetts Health Exchange, White Paper, March 2011

30
Pioneer Institute for Public Policy Research
Endnotes1. Through Fair Housing groups based at Freedom House in Boston, suburban residents met and agreed to begin voluntary school integration immediately rather than waiting for housing to open up for people of color. This grassroots movement initially operated within Boston. In 1965, “a group of black parents decided to bypass the [Boston School Committee.] Parents from the overcrowded schools, led by Mrs. Ellen Jackson and Mrs. Betty Johnson, organized the privately funded busing of black children to underused white schools…. [i]n early September the Boston Globe pitched in by publishing detailed tables showing where vacancies existed in every school in the city, and the new grassroots program, called “Operation Exodus’ began.” Ronald P. Formisano, Boston Against Busing: Race, Class, and Ethnicity in the 1960s and 1970s (Chapel Hill: University of North Carolina Press, 1991), 37-38.
2. Marla A. Goldberg, “Mass. Balks at ruling on schools,” The Republican (Springfield), June 29, 2007.
3. Gary Orfield et al., “City-Suburban Desegregation: Parent and Student Perspectives in Metropolitan Boston,” The Civil Rights Project at Harvard University, 1997.
4. Ibid.
5. Laura Crimaldi, “METCO Fate Unclear as Foe Mulls Legal Fight,” Boston Herald, July 8, 2007.
6. Susan Eaton, “The Legacy of METCO,” The Boston Globe, March 9, 1999, 11.
7. John Shandorf (METCO associate director), phone interview with author, April 13, 2011.
8. Jeff Wulfson (Associate Commissioner for School Finance and District Support, Massachusetts Department of Elementary and Secondary Education), phone interview with author, February 17, 2011.
9. Jeff Wulfson (Associate Commissioner for School Finance and District Support, Massachusetts Department of Elementary and Secondary Education), phone interview with author, February 17, 2011.
10. The METCO Directors’ Association operates a website at http://www.mda-ma.org.
11. For more information, see “High School Youth Conference,” METCO Directors’ Association, accessed February 29, 2011, http://www.mda-ma.org/high-school-conference.htm.
12. John Shandorf (METCO associate director), personal communication with author, February 1, 2011.
13. “METCO Program: FY11 METCO Districts and Grant Allocations,” Massachusetts Department of Elementary and Secondary Education, accessed October 22, 2010, http://www.doe.mass.edu/metco/funding.html.
14. “METCO Program: Frequently Asked Questions,” Massachusetts Department of Elementary and Secondary Education, accessed February 18, 2011, http://www.doe.mass.edu/metco/faq.html?printscreen=yes§ion=d.
15. Calculations by author. “METCO Program: FY11 Metco Districts and Grant Allocations,” Massachusetts Department of Elementary and Secondary Education, accessed November 19, 2010, http://www.doe.mass.edu/metco/funding.html; Enrollment data for various districts can be found at “School District Profiles,” Massachusetts Department of Elementary and Secondary Education, accessed November 30, 2010, http://profiles.doe.mass.edu.
16. “2009-10 Enrollment By Race/Gender Report, District Level,” Massachusetts Department of Elementary and Secondary Education, accessed November 30, 2010, http://profiles.doe.mass.edu/state_repor t /enrollmentbyracegender.aspx?year=2010&mode=district&Continue.x=9&Continue.y=6.

31
METCO Merits More
17. This statistic includes METCO students.
18. Calculations by authors. Tabulations on file with authors.
19. Gary Orfield et al., “City-Suburban Desegregation: Parent and Student Perspectives in Metropolitan Boston,” The Civil Rights Project at Harvard University, 1997. On File with Authors.
20. The reasons for these differences and designations are likely complex, contingent upon local policies and procedures and far beyond the scope of this brief.
21. This includes about $10.5 million in per-pupil allocations and about $6 million in transportation allocations.
22. Hilary J. Moss, Schooling Citizens: The Struggle for African American Education in Antebellum America (Chicago: The University of Chicago Press, 2009), 8 (“…Americans have historically made known their beliefs about civic inclusion and national identity through educational opportunity. In other words, the choices that individuals and communities made about schooling their children—about whom to include, whom to exclude, an who should get priority—speak to much larger questions about inclusion, exclusion, and equality within American society. By extension, public schools in particular were uniquely important institutions in which antebellum Americans debated, decided, and contested questions of political inclusion and national identity.”)
23. Historians disagree about when and how slavery was abolished in Massachusetts. In the Quock Walker case of 1783, Chief Justice William Cushing of the Supreme Judicial Court announced that slavery was inconsistent with the Massachusetts Constitution. This case involved three separate actions relating to a slave named Quock Walker and his alleged master, Nathanial Jennison. The final Quock Walker case (a criminal case charging assault and battery)
was tried before a jury in 1783. Presiding Chief Justice William Cushing instructed the jury that: “Our Constitution of Government . . . sets out with declaring that all men are born free and equal - and that every subject is entitled to liberty, and to have it safeguarded by the laws, as well as life and property, and in short is totally repugnant to the idea of being born slaves. This being the case, I think the idea of slavery is inconsistent with our conduct and Constitution.” See, e.g. “The Massachusetts Constitution, Judicial Review and Slavery: The Quock Walker Case,” The Massachusetts Judicial Branch, accessed on May 5, 2001, http://www.mass.gov/courts/sjc/constitution-slavery-e.html (“The 1790 census recorded no slaves in Massachusetts, but historians disagree over the role of the Quock Walker case in abolishing slavery in Massachusetts.”); “Slavery in the North, Emancipation in Massachusetts,” Douglas Harper, accessed May 5, 2011, http://www.slavenorth.com/massemancip.htm (“…it was a 1783 judicial decision, interpreting the wording of the 1780 constitution, that brought slavery to an end in Massachusetts.”). For a more in-depth discussion of this case, see John D. Cushing, “The Cushing Court and the Abolition of Slavery in Massachusetts: More Notes on the ‘Quock Walker Case,’” 5 Am. J. Legal Hist. 118 (1961) (discussing jury instructions on 132-133). Other historians argue that slavery was not definitively abolished until Commonwealth v. Aves, 18 Pick. 193, 210 (1836).
24. In 1789, Massachusetts enacted a comprehensive education statute, entitled “An Act to Provide for the Instruction of Youth and the Promotion of Good Education.” Mass. Laws, 1789, ch. 19.
25. For example, segregated schools operated in Salem (where segregated schools existed off and on from 1807-1844) and Nantucket (starting in 1825 and resulting in the passage of the 1845 act proscribing discrimination in public schools). Moss, Schooling Citizens, 151-153.

32
Pioneer Institute for Public Policy Research
26. Moss, Schooling Citizens, 136. See also “Abiel Smith School,” Museum of African American History, accessed February 22, 2011, http://www.afroammuseum.org/site13.htm.
27. Moss, Schooling Citizens, 137 (“In 1812, for reasons that are uncertain, the school committee began to subsidize the Belknap Street School. In 1815, Abiel Smith, a white benefactor, granted the institution a sizeable endowment, after which point it became known as the Smith School in honor of his bequest. Probably enticed by the school’s ability to finance itself, the school committee assumed control of the institution in 1816.”).
28. Moss, Schooling Citizens, 129 (“White black Bostonians departed from the city’s public schools ostensibly on their own accord around the turn of the nineteenth century, about the same time that slavery in Massachusetts drew to a close, by the 1830s, such separation was no longer voluntary.”); Moss, Schooling Citizens, 162 (“Boston’s African American community appeared ever more divided over integration in principle and the Smith School in particular.”).
29. Discussed in Roberts v. Boston, 59 Mass. 198, 205 (1849).
30. Note that this ruling preceded the 1868 passage of the Fourteenth Amendment to the United States Constitution that provides “equal protection” under the law to all people within a state’s jurisdiction. This would later provide the basis for the 1954 Brown v. Board of Education decision, outlawing intentional segregation.
31. “An Act Concerning Public Schools” 1845 ch. 214 (“Any child, unlawfully excluded from public school instruction in this Commonwealth, shall recover damages therefore, in an action on the case, to be brought in the name of said child, by his guardian or next friend, in any court of competent jurisdiction to try the same, against the city or town by which such public school instruction is supported.”) As Moss notes, this bill resulted from the protests of black
Nantucket residents, who launched one of the first desegregation campaigns in Massachusetts, ultimately filing a petition to the Massachusetts House of Representatives for equal school rights. Moss, Schooling Citizens, 151-152 (referred to as House Bill No. 25).
32. In Brown v. Board of Education, the United States Supreme Court noted that “The [separate but equal] doctrine apparently originated in Roberts v. City of Boston… upholding school segregation against attack as being violative of a state constitutional guarantee of equality. Segregation in Boston public schools was eliminated in 1855. Mass. Acts 1855, c. 256. But elsewhere in the North segregation in public education has persisted in some communities until recent years. It is apparent that such segregation has long been a nationwide problem, not merely one of sectional concern.” 347 U.S. 483. (1954). For more discussion of the origins of the separate but equal doctrine, see, e.g. Roderick Baltimore and Robert Williams, “The State Constitutional Roots of the ‘Separate But Equal’ Doctrine: Roberts v. City of Boston,” 17 Rutgers L.J. 537 (1985); Darnell Weeden, “Can Brown v. Board of Education meet the Challenge of Race-Neutral Discrimination in the 21st Century?,” 29 T. Marshall L. Rev. 399 (2003)(“Chief Justice Shaw delivered the separate but equal baby in 1849 in Roberts v. The City of Boston.”).
33. Lawrence DiCara and Charles Kindregan, “Public Education in Greater Boston: Does America’s Commitment to Equality and Integration Stop at the City Line?,” 11 Suffolk U. L. Rev. 1245, 1256 (1977).
34. Ibid.
35. In 1963, a group of black parents and local NAACP leaders attempted unsuccessfully to discuss de facto segregation with members of the Boston School Committee. Formisano, Boston Against Busing, 22, 28-29 (“During an eight-hour session, NAACP representatives asked that de facto segregation be recognized, that white teachers be trained to remove their prejudices

33
METCO Merits More
against black children, that discrimination in hiring teachers be ended, and, in general, that the committee act to ameliorate the inferior facilities, materials, and teaching to which black children were subjected. In retrospect, the black demands seemed moderate, but the committee and school administrators found it impossible to admit that segregation existed or that any of their actions constituted discrimination.”), Ibid. at 29.
36. Ch. 641, Acts 1965 (adding Mass. Gen. Laws ch. 15, § 1I).
37. Ch. 641, Acts 1965 (adding Mass. Gen. Laws ch. 71, § 37D).
38. The original text of the Racial Imbalance Act, Ch. 641 of the 1965 Acts, can be found online at http://archives.lib.state.ma.us/actsResolves/1965/1965acts0641.pdf.
39. See ch. 641, Acts 1965 (Mass. Gen. Laws ch. 71, § 37D).
40. See ch. 641, Acts 1965 (Mass. Gen. Laws ch. 71, § 37C).
41. See Mass. Gen. Laws ch. 71, §37C (the consideration of racial imbalance in desicions related to the establishment of grade levels was added to the Racial Imbalance Act in 1974. See ch. 636, Acts 1974, amending ch. 15 § 1J).
42. See ch. 641, Acts 1965 (Mass. Gen. Laws ch. 15, § 1K).
43. See, e.g. minutes from the November 27, 2001 meeting of the Commonwealth of Massachusetts Board of Education, Massachusetts Department of Elementary and Secondary Education, accessed on May 5, 2011, http://www.doe.mass.edu/boe/minutes/01/1127reg.pdf (discussing the “Commissioner’s proposed FY 03 budget eliminating all funding under Section 1 of Chapter 636 that supports compliance with the state racial imbalance law.”). See also “Report of the District Planning and Review Task Force,” Framingham Public Schools, November 2008, 83, 85, accessed on May 5, 2011, http://
www.framingham.k12.ma.us/district_docs/TaskForceFeb09.pdf (includes timeline of the elimination of Chapter 636 funds, beginning with August 2000, when Governor eliminates all Chapter 636 funding. In January 2001, “a portion of Chapter 636 funds are restored to Framingham after intensive lobbying,” and later in November, “DOE eliminates all Chapter 636 funding.”).
44. See ch. 515, § 4, Acts 1983 (Mass. Gen. Laws ch. 15, § 1I), amending ch. 613, § 3, Acts 1982.
45. See Mass. Gen. Laws ch. 7OB, § 10C. For projects approved on or before June 30, 2006, districts with pre-existing desegregation plans received an additional 10 percent reimbursement points, but projects approved on or before June 30, 2012 only receive 5 reimbursement percentage points. There is no mention of an incentive past June 30, 2012. In addition, these incentives do not allow school districts to receive an award in excess of the maximum grant percentage (currently 80%).
46. Mass. Gen. Laws ch. 71 § 37C.
47. Ch. 506, Acts 1966 (Mass. Gen. Laws ch. 76, § 12A).
48. Ibid.
49. “METCO Program: Frequently Asked Questions,” Massachusetts Department of Elementary and Secondary Education, accessed February 18, 2011, http://www.doe.mass.edu/metco/faq.html?printscreen=yes§ion=d. (emphasis added)
50. John Shandorf (METCO associate director) and Jean McGuire (METCO executive director), personal communications with author, May 1, 2011.
51. Peter Schworm, “Metco grads lag on college choices,” The Boston Globe, March 8, 2009, accessed May 5, 2011, http://www.boston.com/yourtown/wellesley/articles/2009/03/08/metco_grads_lag_on_college_choices.

34
Pioneer Institute for Public Policy Research
52. Gary Orfield et al., “City-Suburban Desegregation: Parent and Student Perspectives in Metropolitan Boston,” The Civil Rights Project at Harvard University, 1997. On file with Authors.
53. Simone Ispa-Landa, “Race, Reputation, and Community Resources: A Gendered Analysis of Racial Integration in Schools and Society,” (PhD diss., Harvard University, 2011).
54. See, e.g., Annette Lareau, Unequal Childhoods: Class, Race, and Family Life. (Berkeley: University of California Press, 2003).
55. Simone Ispa-Landa, “Race, Reputation, and Community Resources.”See also, Tricia O’Reilly, “What Boston Resident Students Have to Say About Their Experiences in the METCO Program” (PhD diss., Boston College, 2008), paper AAI3310248 (finding that students believed they were getting better educations because of METCO and described teachers as helpful. However, students also said they did not believe that most teachers and administrators in the suburbs had the “abilities or the desires to address racial/ethnic stereotypes effectively when they surfaced.”).
56. “Race-Conscious Policies for Assigning Students to Schools: Social Science Research and the Supreme Court Cases,” National Academy of Education, 2007, accessed May 5, 2011, http://www.naeducation.org/Meredith_Report.pdf.
57. The National Coalition on School Diversity and the Charles Hamilton Houston Institute for Race and Justice at Harvard Law School recently summarized this research in three briefs, which can be accessed through the Charles Hamilton Houston Institute for Race and Justice website by following this link: http://www.charleshamiltonhouston.org/Publications/Item.aspx?id=100027.
58/59. Susan Eaton, “School Racial and Economic Composition & Math and Science Achievement,” The National Coalition on School
Diversity & The Charles Hamilton Houston Institute for Race and Justice at Harvard Law School, 2010; Susan Eaton, “How the Racial and Socioeconomic Composition of Schools and Classrooms Contributes to Literacy, Behavioral Climate, Instructional organization and High School Graduation Rates,” The National Coalition on School Diversity & The Charles Hamilton Houston Institute for Race and Justice at Harvard Law School, 2010; Susan Eaton and Gina Chirichigno, “The Impact of Racially Diverse Schools in a Democratic Society,” The National Coalition on School Diversity & The Charles Hamilton Houston Institute for Race and Justice at Harvard Law School, 2010.
60. Ibid.
61. For example, University of Wisconsin Professor Douglas Harris reviewed test score data and found that only 1.1 percent of high-poverty schools scored in the top third of the state in either reading or math over two years. If the schools have both high levels of poverty and high numbers of students of color (more than 50 percent), then the share of high scoring schools falls to .3 percent of schools. Douglas Harris, “High Flying Schools, Student Disadvantage and the Logic of NCLB,” American Journal of Education 113 (2007): 367-394.
62. In 2009, other programs were located in the regions of St. Louis, Indianapolis, Milwaukee, East Palo Alto (CA), Minneapolis, Rochester (NY) and Hartford (CT). Another regional model, in the Omaha, Nebraska region, is in the process of development.
63. Amy Stuart Wells, “Why Boundaries Matter: Five Separate and Unequal Long Island Schools,” The Long Island Index, 2009, accessed on May 5, 2001, http://www.longislandindex.org/fileadmin/Reports_and_Maps/Other_Research/2009_Why_Boundaries_Matter_UNABRIDGED.pdf. See also Jennifer Jellison Holmes, “Buying Homes, Buying Schools: School Choice and the Social Construction of School Quality,” Harvard Educational Review 72 (2002): 177-205.

35
METCO Merits More
64. Nancy McArdle, Theresa Osypuk and Dolores Acevedo-Garcia, “Segregation and Exposure to High-Poverty Schools in Large Metropolitan Areas: 2008-09,” diversitydata.org, 2010, accessed May 5, 2011, http://diversitydata.sph.harvard.edu/Publications/school_segregation_report.pdf; Nancy McArdle, Theresa Osypuk and Dolores Acevedo-Garcia, “Prospects for Equity in Boston Public Schools’ School Assignment Plans,” diversitydata.org, 2010, accessed May 5, 2011, http://diversitydata.sph.harvard.edu/Publications/Prospects_for_Equity_in%20_Boston_Schools.pdf.
65. The researchers used “primary schools” which are defined as schools where the lowest grade is “Pre-K” through 3 and the highest grade of “Pre-K” through 8. The diversitydata.org researchers based their findings on analysis of National Center for Education Statistics, Common Core of Data, Public Elementary/Secondary School Universe Survey.
66. “Poverty” determined through eligibility for free and reduced lunch program. As the diversitydata.org researchers note in their study, students whose family income is at or below 130 percent of the federal poverty level qualify to receive free lunch, and students whose family income is between 130 percent and 185 percent of the poverty level qualify to receive reduced-price lunch.
67. McArdle, Osypuk and Acevedo-Garcia, “Segregation and Exposure.”
68. McArdle, Osypuk and Acevedo-Garcia, “Prospects for Equity,” 9.
69. McArdle, Osypuk and Acevedo-Garcia, “Prospects for Equity.” (citing data from the Civil Rights Project, Derechos Civiles, UCLA. Tabulations of the U.S. Department of Education, National Center for Education Statistics, Common Core of Data, 2006-07)(“With 162 separate districts, metro Boston has about one district for every 3,500 students. In contrast, the similarly-sized Seattle metro has about one district for
every 10,000 students. In the 25 largest metro areas in the U.S., there exists about one district for every 7,200 students.”). Ibid, 1.
70. Clotfelter, C. After Brown: The Rise and Retreat of School Desegregation, (Princeton: Princeton University Press 2004).
71. “The Geography of Opportunity: Building Communities of Opportunity in Massachusetts,” The Kirwan Institute for the Study of Race and Ethnicity at The Ohio State University, 2009, accessed May 5, 2011, at http://www.mlac.org/pdf/Geography%20of%20Opportunity_MA_full%20report.pdf. For their analysis, “opportunity” was defined as “environmental conditions or resources that are conducive to healthier, vibrant communities and are more likely to be conducive to helping residents in a community succeed.” Indicators could either be impediments to opportunity (which are analyzed as negative neighborhood factors) or conduits to opportunity (which are analyzed as positive factors). The educational opportunity indicators were: student expenditures, student poverty rate, students passing math tests, students passing reading tests, number of certified teachers, graduation rate and dropout rate. The economic opportunity indicators were: unemployment rates, population on public assistance, economic climate (job trends), proximity to employment and mean commute time. Last, the neighborhood/housing indicators were: home values, neighborhood vacancy rate, crime index or crime rate, neighborhood poverty rate, home ownership rate, proximity to toxic waste release sites and proximity to superfund sites.
72. In Fiscal Year 2010, the state’s per-pupil funding of charter school students averaged $14,129, which includes both monies paid to charter districts and reimbursements to school districts where charter school students would have enrolled. Calculations by Authors. FY2010 Budget Summary. Budget Detail 7061-9010 – Charter School Reimbursement. & Massachusetts Department of Elementary and

36
Pioneer Institute for Public Policy Research
Secondary Education, Office of School Finance. FY10 Charter School Tuition Payments and Reimbursements For Sending Districts (Q4). For each student enrolled the state provides the charter school with the same amount that that students’ home district spends per pupil. These funds are then deducted from the “sending” district’s local aid. Unlike public schools, charters are not eligible for state School Building Assistance funds, but receive a small per pupil stipend from the state based on what districts spend on their facilities.
73. For a recent study about the effectiveness of Hartford’s magnet schools, see Casey D. Cobb, Robert Bifulco, and Courtney Bell, “Evaluation of Connecticut’s Inter-district Magnet Schools,” The Center for Education Policy Analysis, University of Connecticut, 2009.
74. 551 U.S. 701 (2007).
75. More information about this grant proposal, entitled “From ‘Beating the Odds’ to ‘Changing the Odds’ – Using Voluntary Interdistrict Integration Programs to Improve Educational Outcomes for High-Needs Students,” can be found on the Department of Education’s website at http://data.ed.gov/grants/investing-in-innovation/applicant/15068.

85 Devonshire Street, 8th Floor, Boston, MA 02109 T: 617.723.2277 | F: 617.723.1880 | www.pioneerinstitute.org