metabolomic analysis of akt1-mediated muscle hypertrophy
TRANSCRIPT

Metabolomic Analysis of Akt1-Mediated Muscle Hypertrophy inModels of Diet-Induced Obesity and Age-Related Fat AccumulationKian-Kai Cheng,†,‡ Yuichi Akasaki,§,∥ Emmanuelle Lecommandeur,† Ross T. Lindsay,† Steven Murfitt,†
Kenneth Walsh,§ and Julian L. Griffin*,†,⊥
†Department of Biochemistry and Cambridge Systems Biology Centre, University of Cambridge, Cambridge CB2 1GA, UnitedKingdom‡Department of Bioprocess Engineering and Innovation Centre in Agritechnology, Universiti Teknologi Malaysia, Johor Bharu,Johor 81310, Malaysia§Molecular Cardiology, Whitaker Cardiovascular Institute, Boston University School of Medicine, Boston, Massachusetts 02118,United States∥Department of Cardiovascular Medicine and Hypertension, Graduate School of Medical and Dental Sciences, Kagoshima University,Kagoshima 890-8520, Japan
⊥Elsie Widdowson Laboratory, Medical Research Council (MRC) Human Nutrition Research, Cambridge CB1 9NL,United Kingdom
*S Supporting Information
ABSTRACT: Akt1 is a serine/threonine kinase that promotes cell growth and survival.Previously, Akt1 activation in a double transgenic (DTG) mouse model fed a high-fat/high-sucrose (HF/HS) diet was found to promote type IIb muscle growth and to lead to asignificant reduction in obesity. Here, we have used metabolomics to examine the metabolicperturbations in blood serum and liver and gastrocnemius tissues of the DTG mice.Multivariate statistics highlighted consistent metabolic changes in gastrocnemius musclefollowing Akt1 activation, which included significant reductions of serine and histidine-containing dipeptides (anserine and carnosine), in addition to increased concentrations ofphosphorylated sugars. In addition, Akt1-mediated regression in obesity could be associatedwith increased glycolysis in gastrocnemius muscle as well as increased gluconeogenesis,glycogenolysis, and ketogenesis in the liver. In old DTG animals, Akt1 activation was found toimprove glucose metabolism and confer a beneficial effect in the regression of age-related fataccumulation. This study identifies metabolic changes induced by Akt1-mediated musclegrowth and demonstrates a cross-talk between distant organs that leads to a regression of fatmass. The current findings indicate that agents that promote Akt1 induction in muscle have utility in the regression of obesity.
KEYWORDS: Protein kinase B, metabonomics, obesity, type 2 diabetes
■ INTRODUCTIONAkt, or protein kinase B, is a protein from the serine/threoninekinase family that is involved in signaling during cell growth andproliferation, apoptosis, transcription, angiogenesis, migration,and glucose metabolism.1−4 Increased Akt activity has beenfound in numerous cancer types, but the loss of Akt activation hasbeen associated with the development of type-2 diabetes,suggesting that the Akt pathway is an attractive therapeutictarget for these diseases.2−4 Akt is a downstream component inphosphoinositide 3-kinase (PI3K) signaling, and it is activated bya wide range of stimuli, including insulin and insulin-like growthfactor.1 The downstream kinase targets of Akt include glycogensynthase kinase 3, mammalian target of rapamycin (mTOR),p70S6K, PHAS-1 (4EBP-1), and the Foxo family, demonstratingthe important role Akt plays in regulating metabolism.5
To date, three Akt isoforms have been identified in mammals,namely, Akt1, Akt2, and Akt3 (also known as PKBα, PKBβ,PKBγ, respectively).4 Akt1 is known to be involved in cell
growth, but recent studies have also demonstrated its role inenergy metabolism, suggesting that it is a potential target intreating obesity.6,7 Previously, we have described a doubletransgenic (DTG) mouse model with inducible Akt1 expressionin skeletal muscle.6,8 Muscle-specific Akt1 overexpression wasfound to selectively induce type IIbmuscle hypertrophy, improveinsulin sensitivity, and cause reductions in fat mass andblood glucose concentration. In addition, transcriptomicsindicated increased glycolysis in the gastrocnemius muscle aswell as upregulated gluconeogenesis and ketogenesis in the liverof the DTG animals.In the current study, we have used a combination of pro-
ton nuclear magnetic resonance (1H NMR) spectroscopy, gas
Special Issue: Environmental Impact on Health
Received: July 19, 2014Published: September 18, 2014
Article
pubs.acs.org/jpr
© 2014 American Chemical Society 342 dx.doi.org/10.1021/pr500756u | J. Proteome Res. 2015, 14, 342−352
This is an open access article published under an ACS AuthorChoice License, which permitscopying and redistribution of the article or any adaptations for non-commercial purposes.
Dow
nloa
ded
via
UN
IV T
EK
NO
LO
GI
MA
LA
YSI
A o
n Ju
ly 2
6, 2
018
at 0
4:24
:51
(UT
C).
Se
e ht
tps:
//pub
s.ac
s.or
g/sh
arin
ggui
delin
es f
or o
ptio
ns o
n ho
w to
legi
timat
ely
shar
e pu
blis
hed
artic
les.

chromatography−mass spectrometry (GC−MS), GC with aflame ionization detector (GC−FID), and liquid chromatography−mass spectrometry (LC−MS) to investigate the metabolicperturbations in blood serum and liver and gastrocnemius tissuesof the DTG mice. We then placed these metabolic changes inthe context of Akt1 induction and the subsequent conferredmetabolic advantage in terms of reducing obesity and reducinginsulin resistance in aged animals. Our results identified path-ways that were perturbed by Akt1 activation, leading toregression of diet-induced obesity and improvement of age-related fat accumulation. In addition, a metabolomic study of thegastrocnemius muscle identified a metabolic signature of Akt1overexpression, which was also observed inmodels of obesity andadvanced age.
■ MATERIAL AND METHODS
Animals and Experimental Design
The generation of a skeletal muscle-specific, inducible Akt1 DTGmouse model has been previously described in detail.6 In brief,1256 [3Emut] MCK-rtTA transgenic mice9 were crossed withTRE-myrAkt1 transgenic mice10 to produce the DTG mousemodel. In the current study, 1256 [3Emut] MCK-rtTA singletransgenic mice were used as controls. All protocols wereapproved by the BostonUniversity Institutional Animal Care andUse Committee.Two studies were conducted to examine the effect of a high-
fat/high-sucrose (HF/HS) diet and aging on Akt1 activation inthe DTG mice. In the study on the effect of diet, 12-week oldmale controls and DTG mice were fed either a standard chow(Harlan Teklad global 18% protein rodent diet, no. 2018) orHF/HS (Bio-Serv, no. F1850) diet for 3months (12 weeks; n = 6for each group). Doxycycline was administered through thedrinking water to all animals fromweeks 9−12 of the experiment,which caused a muscle-specific Akt1 induction in the DTG micebut not in the single transgenic controls. Blood serum sampleswere collected before and after doxycycline administration (atweeks 8 and 12), while gastrocnemius muscle and liver tissueswere collected at 3 months.In the second study, which focused on the effect of aging, the
male single transgenic controls and DTG mice (3 and 18 monthsold)were fed the chowdiet togetherwith doxycycline administrationfor 4 weeks (n = 6 for each group) before the samples (serum,gastrocnemius muscle, and liver tissue) were collected. Allsampleswere stored at−80 °Cuntil further analysis bymetabolomics.Metabolic Profiling Using 1H NMR Spectroscopy
Blood serum was analyzed using a two-tube NMR system, wheresodium-3-(trimethylsilyl)-2,2,3,3-tetradeuteriopropionate(TSP) was used as chemical shift standard.11 Eighty microlitersof blood serum was loaded into a capillary tube (1.7 mm o.d.)(New Era, Vineland, NJ, USA), which was then inserted into anouter 5 mmNMR tube containing 600 μL of D2O with 0.9% w/vsodium chloride and 0.1 mM TSP (Cambridge IsotopeLaboratories Inc., Andover, MA, USA) and then subsequentlyanalyzed. For tissues, metabolites were extracted usingmethanol/chloroform/water extraction.12,13 In detail, frozentissues (∼20 mg for gastrocnemius muscle and ∼40 mg for livertissue) were first transferred into microcentrifuge tubes (Starlab,UK). Then, a stainless steel bead was added to each tube,followed by 600 μL of chloroform/methanol (2:1) (both fromSigma-Aldrich). Tissues were then homogenized using aTissueLyser (Qiagen, UK), and the resulting homogenateswere sonicated for 15 min. The stainless steel beads were
removed, and chloroform and water (200 μL of each) wereadded to each tube before the samples were centrifuged at13 300 rpm for 10 min. After that, the aqueous and organicphases were separated from the protein pellets. The aqueousphase was dried using an evacuated centrifuge (Eppendorf,Hamburg, Germany), while the organic phase was evaporated todryness in a fume hood. All dried samples were stored at −80 °Cuntil further analysis. Prior to 1H NMR analysis, dried tissueextracts were dissolved in 600 μL of D2O containing TSP (0.5mM for the extracts of liver tissue or 0.2 mM for the extracts ofgastrocnemius muscle) and sodium azide (∼0.1% w/v).The blood serum and tissue extracts were analyzed by 1H
NMR spectroscopy at 500 MHz at 300 K for tissue extracts andat 310 K for blood serum, using a solvent suppression pulsesequence based on a one-dimensional NOESY pulse sequence.The NMR spectra were processed using ACD SpecManager 1DNMR processor (version 8, ACD, Toronto, Canada). Spectrawere Fourier-transformed, referenced to TSP at 0.0 ppm, andwere phased and baseline-corrected manually. Each spectrumwas integrated using 0.02 ppm integral regions between 0.2 and10.0 ppm for tissue spectra and −0.04 and 10.0 ppm for serumspectra. The water-containing region (4.7−4.8 ppm for tissuespectra and 4.5−5.0 ppm for serum spectra) was excluded fromfurther analysis. Each integral region of blood serum NMRspectra was normalized to the integral value of TSP for eachspectrum. To account for any difference in concentrationbetween tissue samples, each spectral region was normalized toa total integral value of 1. All NMR peaks were assigned on thebasis of theHumanMetabolome database14 (http://www.hmdb.ca),published literature,15 Chenomx NMR suite version 5.1 (Chenomx,Alberta, Canada), or by the use of authentic standards.
Metabolic Profiling Using Gas Chromatography
Prior to GC−MS analysis, L-proline (U-13C5, 98%), L-glutamicacid (U-13C5, 98%;
15N, 98%), and myristic acid (1,2,3-13C3,99%) (Cambridge Isotope Laboratories Inc., Andover, MA,USA) were added to the aqueous soluble metabolites as internalstandards, and the sample was dried using an evacuatedcentrifuge (Eppendorf, Hamburg, Germany). The dried sampleswere then derivatized using a two-step procedure.16 First, thesamples were methoxymated using 30 μL of methoxyaminehydrochloride (20 mg/mL in pyridine; Sigma-Aldrich Ltd.,Dorset, UK) for 17 h. Then, the samples were silylated using30 μL of N-methyl-N-trimethylsilyltrifluoroacetamide (MSTFA;Macherey-Nagel, Duren, Germany) for 1 h at room temperature.The derivatized samples were then diluted with hexane (200 μLfinal volume) and analyzed using a Trace GC Ultra coupled to aDSQ II single-quadrupole mass spectrometer (ThermoScientific,Hemel Hempstead, UK). The column used was 5% polysilarylene,95% polydimethylsiloxane (30 and 0.25 mm i.d.) (Phenomenex,Macclesfield, Cheshire, UK). During data acquisition, the temper-ature was ramped from 70 to 310 °C in a 35 min period. Theresulting mass spectra were matched to the National Institute ofStandards and Technology (NIST) library. Overlapping peaks weredeconvoluted using traces of selected ions.To profile the total fatty acid complement of blood plasma and
the tissue extracts, organic soluble metabolites were derivatizedusing an acid-catalyzed esterification procedure.17 Specifically,dried organic soluble metabolites were dissolved in 750 μLof chloroform/methanol (1:1) and transferred into a glassvial. Then, 250 μL of boron trifluoride (BF3; 10% in methanol;Sigma-Aldrich) was added, and the samples were incubated at80 °C for 90 min. The derivatized samples were then analyzed
Journal of Proteome Research Article
dx.doi.org/10.1021/pr500756u | J. Proteome Res. 2015, 14, 342−352343

using a Focus GC, and the column eluent was introduced into aflame-ionization detector (FID, Thermo Electron Corporation).The column used was a TR-FAME column (30 m× 0.25mm i.d.)with a 70% cyanopropyl polysilphenylene-siloxane stationaryphase (ThermoScientific). During the experiment, the temper-ature was ramped from 55 to 230 °C in a 28 min run. Assignmentof organic phase metabolites was carried out by comparison with aFAME standard mix (Supelco 37 Component FAMEMix; Sigma-Aldrich) and mass spectrometry where necessary.For both aqueous and organic phase metabolites analysis, the
GC chromatograms were processed using Xcalibur (version 2.0;ThermoScientific), in which each individual peak was integratedmanually and then normalized to the internal standard peak(s).
Lipidomics by Liquid Chromatography−Mass Spectrometry
Analysis was performed using a Waters Xevo G2 quadrupoletime-of-flight mass spectrometer (Waters Ltd., Hertfordshire,UK) with an electrospray ionization probe and a Z-spray ionsource. The spectrometer was coupled to a Waters AcquityUPLC system.One-fifth of the organic fractions of gastrocnemius and liver
tissue was dissolved in 100 μL of 1:1 methanol/chloroform. Theresulting lipid solution was further diluted with 900 μL of 2:1:1iso-propanol/acetonitrile/water containing 20 μM phosphoti-dylcholine (PC 34:0) (Avanti Polar Lipids, CA, USA) as aninternal standard and placed inside a 1.5 mL glass screwtop vial(Agilent, Santa Clara, CA, USA) and capped for analysis. Tenmicroliters of each sample was combined into a new vial and usedas a pool sample for quality control and analyte identification. Allanalyses were conducted using a method utilizing simultaneouslow- and high-energy mass scan functions in both negative andpositive ionization modes to provide fragmentation data for lipididentification. Both functions used a centroid full scan from50 m/z to 1200 m/z with a capillary voltage and cone voltage of3.0 kV and 30 V for positive ion mode and 2.5 kV and 25 V fornegative ion mode, respectively. Compounds were separatedusing a CSH C18 column (2.1 mm × 100 mm, 1.7 μm; WatersLtd., Hertfordshire, UK). Mobile phase A consisted of 10 mMammonium formate in 3:2 acetonitile/water, and mobile phase Bconsisted of 10 mM ammonium formate in 9:1 iso-propanol/acetonitrile. The chromatography gradient was as follows: alinear gradient of 40 to 43% B over 2.0 min followed by anincrease to 50% B over 0.1 min and then to 54% until 12.0 min.The composition of B was then increased to 70% over thefollowing 0.1 min and further increased to 99% until 18 min, atwhich time the column was equilibrated for 2 min to give a totalrun time of 20 min. The flow rate was 400 μL/min, and thecolumn temperature was 55 °C. The injection volume was 5 μL.Data were processed using MarkerLynx within the software
suit Masslynx (version 1.4) by Waters Ltd. (Herfordshire, UK).Peak areas were collated and normalized in Excel (Microsoft).All spectral peak areas were normalized against the total areaof all peaks within a sample. Lipid species were identified byfragmentation data obtained from the high-energy functiondescribed above and compared with online databases (e.g., www.lipidmaps.org).
Statistical Data Analysis
Data sets were imported into SIMCA-P+ 11.0 (Umetrics, Umea,Sweden) for processing using principal components analysis(PCA), partial least-squares (PLS) analysis, and PLS-discrim-inant analysis (PLS-DA) (a regression extension of PCA usedfor classification). Prior to multivariate analysis, the NMR andLC−MS data sets were mean-centered and Pareto-scaled, while
the GC−MS and GC−FID data sets were mean-centered andscaled to unit variance. Pareto scaling weights each variable withthe square root of its standard deviation and therefore increasesthe weighting of low-intensity metabolites while at the same timelimiting the influence of noise on the multivariate model. Unitvariance scaling weights each variable with its standard deviation,and the resulting model is not biased toward high-concentrationmetabolites.The Q2 and R2 values from the resulting multivariate model
were used to assess the robustness of a model, where R2 showsthe fraction of variation explained by a component, and Q2
shows the predictability of the model through cross-validation.Typically, a robust model has a Q2 > 40%. In addition, thesemodels were assessed for robustness using the validation toolwithin SIMCA that assesses theQ2 and R2 for each model againstmodels produced, where the Y value for class membership hasbeen permuted to produce randommodels. Here, a robust modelis represented by Q2
actual ≫ Q2random.
Identification of major metabolic perturbations within thepattern recognition models was achieved by analysis of cor-responding loadings plots. In addition, the differential metabo-lites found were confirmed by standard univariate tests (forexample, Student’s t-test).
■ RESULTS
Akt1-Induced Muscle Hypertrophy Reduced BothDiet-Induced and Age-Related Fat Accumulation
To place our subsequent metabolomics studies in a physiologicalcontext, we first investigated the effect of Akt1 overexpression ondiet-induced obesity. Twelve-week old mice were fed either anormal chow or HF/HS diet for 8 weeks before Akt1 geneinduction. TheHF/HS diet caused an increase in body weight forboth the controls and DTG mice (Figure 1A). As previouslyreported, the overall weight gain was significantly less in the DTGanimals following 4 weeks of Akt1 activation (p < 0.05), wherebythe controls showed a further increasing trend in body weight(Figure 1A). In contrast, Akt1 gene induction had no effect onbody weight for mice fed a normal chow diet.Next, we examined the effect of Akt1 overexpression on the
weight of tissues in the same animals after 4 weeks of Akt1activation. Akt1 induction caused a 34.8% increase in gastro-cnemius muscle weight, and the extent of muscle growth did notdepend on the dietary conditions used in the current study(Figure 1B, right). Compared with HF/HS-fed controls, theinguinal and subcutaneous fat masses of the HF/HS-fed DTGmice were 49.0 and 59.7% lower, respectively (Figure 1B, leftand middle, p < 0.01). Similarly, the DTG mice fed the normaldiet also showed a reduction in inguinal fat mass, but to a lesserextent.To investigate the effect of aging on Akt1-mediated muscle
hypertrophy, we next studied chow-fed controls and DTG miceat two different age groups (12 weeks and 18 months). Notably,in old animals, the extent of Akt1-induced muscle hypertrophywas found to be significantly less than that in the young animals(Figure 1C, right; P = 0.0075). In addition, aging led to fataccumulation in the old animals (Figure 1C, left andmiddle), andthe data in the current study showed that this could be improvedby Akt1 activation. As compared with the controls, the inguinaland subcutaneous fat of the old DTG animals were found to be33.3 and 32.3% lower, respectively. The age-related fat accumula-tion was balanced by a decreased weight of muscle and probablyother tissues, as no significant difference in total body weight was
Journal of Proteome Research Article
dx.doi.org/10.1021/pr500756u | J. Proteome Res. 2015, 14, 342−352344

observed for all four studied groups in the aging study(Supporting Information Figure S1).
Metabolic Signature of AKT1-Induced Muscle Hypertrophy
Analysis of 1H NMR data of gastrocnemius muscle (n = 48 forthe total number of animals, including data from both diet andaging studies) using unsupervised PCA shows clustering ofsamples based on induced genotype (Supporting InformationFigure S2). The result indicated that Akt1 induction is the major
source of metabolic variation, suggesting potential metabolicmarkers for Akt1-induced muscle hypertrophy.To further define these metabolic changes, the data were
analyzed using PLS-DA to assess the discrimination betweenthe single transgenic controls and DTG mice. This supervisedanalysis produced a robust two-component model (Figure 2A),which was validated using a permutation test within SIMCA P+(Figure 2B). The most discriminatory compounds identified bythe analysis were anserine and carnosine (assigned by the spiking
Figure 1. Obesity induced by a high-fat/high-sucrose diet could be regressed by Akt1 induction (A). The corresponding changes in tissue weight (B).Akt1 induction also conferred a reduction in age-related fat accumulation (C).
Journal of Proteome Research Article
dx.doi.org/10.1021/pr500756u | J. Proteome Res. 2015, 14, 342−352345
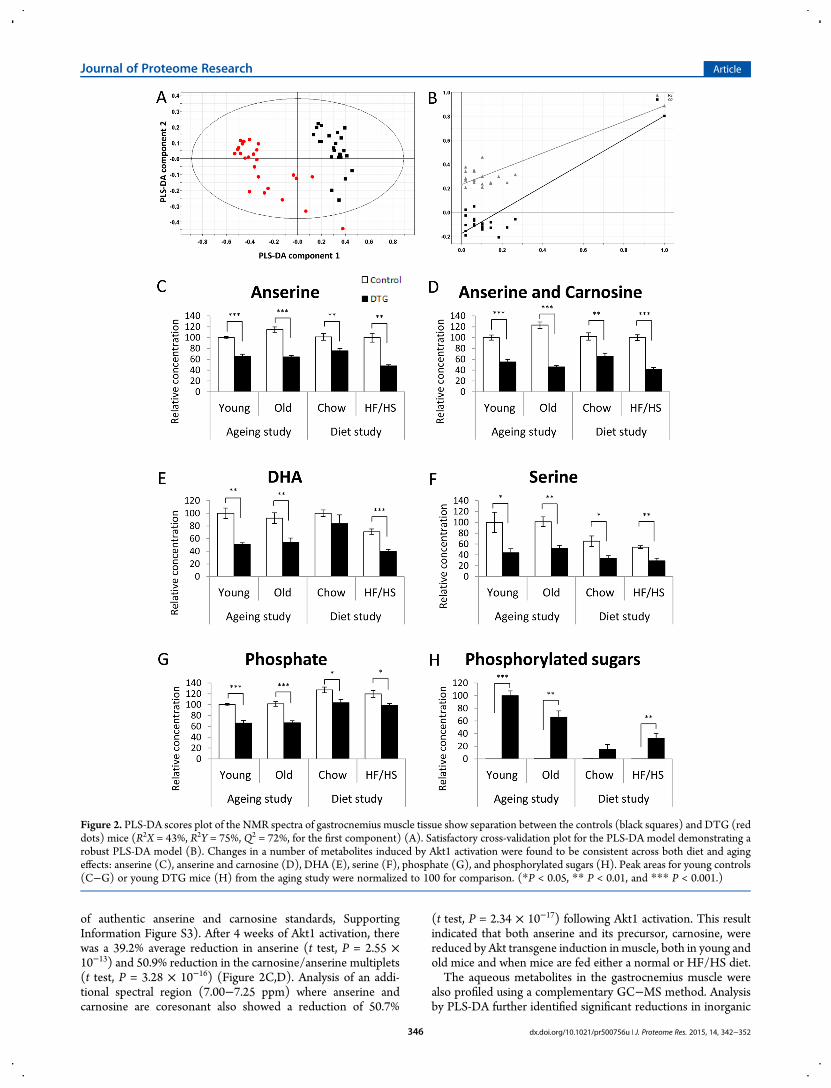
of authentic anserine and carnosine standards, SupportingInformation Figure S3). After 4 weeks of Akt1 activation, therewas a 39.2% average reduction in anserine (t test, P = 2.55 ×10⁻¹³) and 50.9% reduction in the carnosine/anserine multiplets(t test, P = 3.28 × 10⁻¹⁶) (Figure 2C,D). Analysis of an addi-tional spectral region (7.00−7.25 ppm) where anserine andcarnosine are coresonant also showed a reduction of 50.7%
(t test, P = 2.34 × 10⁻¹⁷) following Akt1 activation. This resultindicated that both anserine and its precursor, carnosine, werereduced by Akt transgene induction inmuscle, both in young andold mice and when mice are fed either a normal or HF/HS diet.The aqueous metabolites in the gastrocnemius muscle were
also profiled using a complementary GC−MS method. Analysisby PLS-DA further identified significant reductions in inorganic
Figure 2. PLS-DA scores plot of the NMR spectra of gastrocnemius muscle tissue show separation between the controls (black squares) and DTG (reddots) mice (R2X = 43%, R2Y = 75%, Q2 = 72%, for the first component) (A). Satisfactory cross-validation plot for the PLS-DA model demonstrating arobust PLS-DA model (B). Changes in a number of metabolites induced by Akt1 activation were found to be consistent across both diet and agingeffects: anserine (C), anserine and carnosine (D), DHA (E), serine (F), phosphate (G), and phosphorylated sugars (H). Peak areas for young controls(C−G) or young DTG mice (H) from the aging study were normalized to 100 for comparison. (*P < 0.05, ** P < 0.01, and *** P < 0.001.)
Journal of Proteome Research Article
dx.doi.org/10.1021/pr500756u | J. Proteome Res. 2015, 14, 342−352346

phosphate and serine as well as increased concentrations ofphosphorylated sugars (including glucose-6-phosphate andmannose-6-phosphate) in the gastrocnemius muscle of theDTG mice (Figures 2F−H). In addition, GC−FID analysis alsoshowed a reduction of docosahexaenoic acid (DHA) concen-tration in the muscle tissues of the DTG mice from theaging study and the HF/HS-fed DTG mice from the diet study(Figure 2E). These changes constitute the metabolic signatureassociated with Akt1-induced muscle hypertrophy, which arefound consistently across the effects of diet and aging measuredin this study.
Metabolic Perturbation Associated with Akt1-MediatedWeight Loss
One focus of this study was to elucidate the metabolicperturbations associated with the Akt1-mediated weight loss inthe HF/HS-induced obese DTG mice. PLS-DA of the NMRspectra from gastrocnemius muscle showed a clear separationbetween the controls and the DTG mice fed the HF/HS diet(n = 6) after 4 weeks of Akt1 induction (R2X = 48%, R2Y = 93%,Q2 = 87% for the first component). In addition to the above-mentioned metabolic signatures, the two genotypes fed the HF/HS diet were further discriminated by significantly increasedconcentrations of β-hydroxybutyrate, succinate, glycine, andlactate in the gastrocnemius muscle of the DTG mice. Fur-thermore, multivariate analysis of GC−MS data also indicated aperturbation in the TCA cycle, with increased concentrationsof isocitrate, fumarate, and malate found in DTG mice fed theHF/HS diet (Table 1).
The impact of Akt1 overexpression on the metabolome ofblood serum was then examined. PLS-DA comparing the serummetabolic profiles of the controls and the DTG mice fed a chowdiet failed to produce a multivariate model, indicating thatthere were no marked metabolic differences between these twogroups. However, a robust model was produced comparing both
genotypes fed theHF/HS diet (R2X = 73%,R2Y = 54%,Q2 = 43%for the first PLS-DA component). The serum profile of the HF/HS-fed DTGmice was characterized by increased concentrationsof β-hydroxybutyrate, lactate, and lipid moieties from bothphospholipids and triglycerides (δ 1.24−1.30, 1.52−1.58, 1.98−2.06, 2.76−2.84, 4.22−4.28, and 5.28−5.36) (Table 1). Inaddition, NMR and GC−MS data highlighted marked reduc-tions of serum glucose (Figure 3A), fructose, and galactose con-centrations in the DTG mice. After 4 weeks of Akt1 activation,the HF/HS-fed DTGmice were highlighted by a >100% increasein circulatory oleate C18:1 (cis-9), one of themost abundant fattyacids in serum (Supporting Information Table S1).Multivariate statistics also indicated that the metabolic impact
of Akt1 induction on the liver metabolome is diet-dependent.No PLS-DA model was produced comparing both genotypesfed a chow diet. However, when fed the HF/HS diet, PLS-DAidentified a number of differential metabolites, includingincreased concentrations of β-hydroxybutyrate, betaine, andmethionine, together with significant reductions of lactate,glucose, galactose, glycogen, alanine, and disaccharides in theDTG mice (Figure 3B,C and Table 1).The aging process caused a higher blood glucose concen-
tration in old controls, but this was reduced to a level comparableto that of young controls following Akt1 activation (Figure 4A).This metabolic change is most likely associated with increasedmuscle glycolysis induced by Akt1 induction, as increasedconcentrations of phosphorylated sugars and lactate were alsoobserved in themuscle of old DTG animals (Figures 2H and 4B).Consistent with the findings in the diet study, there are nosignificant changes in blood glucose and muscle lactate con-centrations in young animals fed a chow diet, suggesting thatactivation of Akt1 expression improved glucose homeostasis inold animals by restoring its expression to that of young animals.
LC−MS-Based Lipidomics of Gastrocnemius and LiverTissue
Chromatograms from extracts from the lipid fraction of liver andgastrocnemius tissues were collected in positive and negativeionization mode and processed using multivariate statistics.Comparisons were made for a single tissue type between diet andgenotype. While no statistically valid model could be built for thenegative ion mode data, dominated by chromatographic peaksfrom free fatty acids, robust models could be built for the positiveion mode data representing chromatographic peaks fromphospholipids and triglycerides.For the liver tissue data sets, no model could be built com-
paring the control and DTG group on the normal chow diet.However, robust models were built comparing both the controlanimals on chow diet and HF/HS diet (for the PLS-DA model,R2X = 35%; R2Y = 99%; Q2 = 79%, passed cross-validation byrandom permutation test; data not shown) and the DTG animalson chow diet and HF/HS diet (for the PLS-DA model, R2X =41%; R2Y = 99%; Q2 = 81%, passed cross-validation by randompermutation test; Figure 5A,B). In both cases, this was driven byincreases in a range of triglycerides in the HF/HS group (for theDTG group: TAG(51:2), PC(43:0), TAG(51:2), PA(30:0),TAG(53:2); PA(30:1), TAG(55:10), TAG(50:2), TAG(54:2),and TAG(53:3)) and a relative reduction of phospholipids (forthe DTG group: lyso-PC(17:1)). In addition, a robust model wasformed between the control mice and the DTG mice on aHF/HS diet (for the PLS-DA model, R2X = 38%; R2Y = 99%;Q2 = 66%, passed cross-validation by random permutation test;Figure 5C). Thismodelwas associatedwith a decrease in triglycerides
Table 1. Summary of Metabolic Changes Detected FollowingAnalysis by 1H NMR Spectroscopy and GC−MSa
samples increased in DTG mice decreased in DTG mice
gastrocnemius muscle phosphorylated sugars** anserine***β-hydroxybutyrate* carnosine***lactate** serine**glycine*** inorganic phosphate*succinate**isocitrate***fumarate***malate***
blood serum β-hydroxybutyrate* glucose***lactate* galactose**lipid moieties* fructose**
liver tissue β-hydroxybutyrate* glucose**betaine* galactose*methionine* disaccharides**
glycogen**lactate*alanine**
aComparing gastrocnemius muscle, blood serum, and liver tissue fromthe HF/HD-fed controls and DTG mice. P-values were obtainedfrom Student’s t-test (* P < 0.05, ** P < 0.01, and *** P < 0.001).The metabolites shown in bold font were found to be consistentlychanged across the diet and aging effects.
Journal of Proteome Research Article
dx.doi.org/10.1021/pr500756u | J. Proteome Res. 2015, 14, 342−352347

and diacylglycerides containing longer, polyunsaturated fatty acids(TAG (53:4), TAG(56:3), and TAG(57:7)) and an increase in shortchain fatty acids (TAG(48:8), TAG(50:2), TAG(46:4), TAG(48:0),TAG(47:6), TAG(48:2), and TAG(44:4)) in the DTG group.Examining the gastrocnemius tissue, no model again could
be built examining the control and DTG mice on chow diet.
However, good models could be built for comparisons of thecontrol mice on normal chow and HF/HS diets (for the PLS-DAmodel, R2X = 37%; R2Y = 99%;Q2 = 88%, passed cross-validationby random permutation test) and DTG mice on normal chowand HF/HS diets (for the PLS-DA model, R2X = 36%; R2Y =99%; Q2 = 78%, passed cross-validation by random permutation
Figure 3. Multiple sections of 1H NMR spectra showing (A) a marked reduction of serum glucose concentration (glucose region: δ 3.22−3.91)following Akt1 activation in HF/HS-fed mice, (B) an increased hepatic concentration of β-hydroxybutyrate and reductions of lactate and alanine in theDTGmice, and (C) an increased concentration of betaine and a marked reduction of hepatic glucose concentration (glucose region: δ 3.22−3.92) in theDTG mice. The NMR spectra were obtained from an individual sample of each class after 4 weeks of Akt1 activation: black spectrum, the HF/HS-fedcontrols; red spectrum, the HF/HS-fed DTG mice. Spectra were scaled to the same relative noise level.
Journal of Proteome Research Article
dx.doi.org/10.1021/pr500756u | J. Proteome Res. 2015, 14, 342−352348

test; Figure 5D,E). While a model could be built that dis-criminated control and DTGmice on a HF/HS diet, this did notpass cross-validation.
■ DISCUSSIONThe increased prevalence of metabolic syndrome, obesity, andinsulin resistance has led to an increased risk of cardiovasculardisease in the general population.18 Previously, a number ofstudies had demonstrated that induction of Akt in the skeletalmuscle of mice induced muscle hypertrophy and caused adecrease in adipose tissue.6,8,19 The reduction of fat massfollowing Akt1 activation was associated with enhanced lipolysisin the adipose tissue as well as an increased fatty acid oxidation inthe liver.6 These animals also exhibited improved metabolicparameters, including improved insulin sensitivity and reduc-tions in blood glucose and leptin concentrations.In the current study, metabolomic analysis associated Akt1
activation in mouse muscle tissue with profound metabolicperturbations in the liver, blood serum, and gastrocnemiusmuscle, particularly when the animals were fed a HF/HS diet(Figure 6). Notably, the HF/HS-fed DTG mice demonstratedreduced blood glucose as well as increased circulatory lactateconcentration, suggesting upregulation of glycolysis followingAkt1 induction in the skeletal muscle. Indeed, the examination ofthe metabolic composition of muscle highlighted markedlyincreased concentrations of glycolytic metabolites includingphosphorylated sugars and lactate. This is consistent withprevious findings showing increased glucose uptake and the
upregulation of glycolytic genes in these animals.6 The lactateproduced via anaerobic glycolysis in muscle is transported tothe liver and then metabolized to produce glucose throughgluconeogenesis as part of the Cori cycle. Metabolic profiling ofthe liver indicated reduced lactate, alanine, and glycogen,suggesting that the liver had increased gluconeogenesis andglycogenolysis to replenish glucose stores in muscle. This cross-talk between muscle and liver enables muscle to shift its energyburden to the liver and at the same time reduce the effects ofhigh-fat/high-sucrose feeding.Intriguingly, the increased gluconeogenesis and glycogenolysis
also stimulated fatty acid oxidation, with increased concen-trations of β-hydroxybutyrate in the blood. Protein synthesis isan energy-expensive process. In the DTG mice, there was aconsistent increase in the concentration of β-hydroxybutyrate inthe liver, blood serum, and gastrocnemius muscle, particularlywhen the mice were fed the HF/HS diet. β-Hydroxybutyrate is aketone body that is produced in the liver through ketogenesisfollowing fatty acid oxidation. In extrahepatic tissues, it can beutilized as a fuel, being metabolized through the TCA cycle,especially during prolonged fasting or starvation.It is known that Akt1 activation specifically induces growth of
type IIb muscle fibers, also known as fast/glycolytic muscle.6
This muscle has a lower density of mitochondria and therefore isless dependent on the TCA cycle and β-oxidation. Nevertheless,the current data demonstrated that the continuous supplyof substrates in the form of ketone bodies, glucose, and possiblyfatty acids led to increased concentrations of TCA cycleintermediates, including isocitrate, succinate, fumarate, andmalate, in the gastrocnemius muscle of the HF/HS-fed DTGanimals. This process, which involves cross-talk among muscle,liver, and adipose tissue, could serve as a supplementary energysource in addition to glycolysis for the enhanced proteinsynthesis needed for muscle hypertrophy.Metabolic profiling of gastrocnemius muscle revealed a
number of differential metabolites that consistently discrimi-nated the controls and DTG mice. In the DTG mice, Akt1-induced muscle hypertrophy was associated with decreasedconcentrations of anserine, carnosine, inorganic phosphate,serine, and DHA, as well as increased concentrations ofphosphorylated sugars in the muscle.Among these metabolic changes, anserine and carnosine are of
particular interest as they were previously reported to regulatethe energy-producing pathway in proliferative tumor cells.20,21
Carnosine (β-alanyl-L-histidine) and its methylated derivative,anserine (β-alanyl-1-methyl-L-histidine), are natural occurringhistidine-containing dipeptides, which are present in manyvertebrate tissues, predominantly in skeletal muscle and brain.22
Anserine is found to be absent from human tissues despite a highconcentration of carnosine (20 mM) in skeletal muscle.23
Accumulating evidence shows that both of these dipeptides sharesimilar structure and exhibit similar biological functionsincluding antioxidant, pH buffering, and antiglycosylationactivities, as well as metal ion chelation.22,24 In the absence ofpyruvate, carnosine and anserine are cytotoxic to transformed ortumor cells, but not to normal cells.20 Recently, carnosine wasfound to inhibit ATP production through anaerobic glycolysis incells from malignant glioma.21 In addition, it also retards tumorgrowth in the N1H3T3-HER2/neu mouse model and inhibitshigh-glucose-induced mesangial cell proliferation.25,26
Increased Akt1 activity is evident in numerous cancers andproliferative cells.27−29 In the current study, significant reduc-tions of anserine and carnosine were associated with an upregulation
Figure 4. Increased blood glucose concentration associated withaging was reduced by Akt1 induction (A). This may be associated withincreased glycolysis, as an increased concentration of lactate wasdetected in the hypertrophic muscle of the DTG animals (B).
Journal of Proteome Research Article
dx.doi.org/10.1021/pr500756u | J. Proteome Res. 2015, 14, 342−352349

in anaerobic glycolysis in gastrocnemius muscle of DTG mice.Indeed, when the mice were fed the HF/HS diet, the con-centrations of these histidine-containing dipeptides were foundto be negatively correlated with the lactate concentration in thegastrocnemius muscle (Figure 7). Taken together, the currentfindings suggest a similar regulatory role of these dipeptides onenergy metabolism in Akt1-induced hypertrophic muscle andtumor cells, which both experience active cell growth and dependon ATP obtained from glycolysis.In addition to the metabolic advantage of Akt1 induction in
regulating fat accumulation induced by both diet and aging, thecurrent study also demonstrated the beneficial effect of Akt1 inglucose homeostasis. In mice fed a HF/HS diet, the circulatoryglucose concentration was reduced following Akt1 activation.Similarly, Akt1 activation was also found to reduce the increase inglucose concentration caused by aging in old animals. Theseresults suggest an underappreciated role of Akt1 in regulatingglucose metabolism.
Previously, we have shown that muscle-specific overexpressionof Akt1 in the DTG mice led to an increase in circulatingfibroblast growth factor 21 (FGF-21).30 In fact, a number ofmetabolic perturbations observed in the current study could beassociated with the metabolic role of FGF-21. FGF-21 is knownto be induced by fasting and is associated with upregulatedhepatic fatty acid oxidation and ketogenesis and improvementin hepatic steatosis.31 Correspondingly, in our study, the con-centration of β-hydroxybutyrate was found to be significantlyincreased in liver, blood serum, and gastrocnemius muscle of theDTG mice, especially when the mice were fed the HF/HS diet.This was also apparent in the LC−MS data sets from the livertissue. While HF/HS feeding increased a range of triglyceridesin the liver for both the control and DTG mice compared withanimals on the chow diet, the induction of AKT led to aremodeling of the lipid species present in the liver with areduction in longer chain polyunsaturated fatty acids and arelative increase in shorter fatty acids. Long chain polyunsatu-rated fatty acids are largely dietary derived, while short chain,
Figure 5. PLS-DA scores plot of the LC−MS lipidomic data of liver tissue show separation between DTG mice fed the chow and HF/HS diets (A).Satisfactory cross-validation plot for the PLS-DA model demonstrating a robust PLS-DA model (B). Group separation was also observed betweencontrols and the DTGmice fed with the HF/HS diet (C). PLS-DA scores plot of the LC−MS lipidomic data of gastrocnemius tissue showed separationbetween DTG mice fed the chow and HF/HS diets (D); the model passed cross-validation by random permutation test (E).
Journal of Proteome Research Article
dx.doi.org/10.1021/pr500756u | J. Proteome Res. 2015, 14, 342−352350

predominantly saturated, fatty acids can be synthesized in theliver from carbohydrate via de novo lipogenesis. Thus, in theDTG mice, it would appear that induction of AKT increasesthe oxidation of dietary derived fatty acids systemically and alsostimulates the conversion of carbohydrate into shorter chain fattyacids in the liver. Intriguingly, these changes were less apparent in
skeletal muscle, suggesting that a major part of the beneficialeffect of AKT induction in skeletal muscle was initiated in theliver.Tyynismaa and colleagues demonstrated that mitochondrial
myopathy in skeletal muscle led to activation of Akt1 andinduction of FGF-21.32 In this study, the mice with late-onsetmitochondrial myopathy exhibited smaller adipocytes and lowerhepatic fat content and were resistant to weight gain on the high-fat diet. Collectively, these studies suggest that skeletal musclecould initiate molecular signaling and orchestrate systemicmetabolic changes to reduce obesity.
■ CONCLUSIONSIn summary, a combination of 1H NMR spectroscopy, GC−MS,GC−FID, and LC−MS was used to examine the metabolomicprofiles of a conditional transgenic mouse model that specificallyoverexpresses the Akt1 gene in skeletal muscle. Our data indicatethat Akt1 activation induced metabolic perturbations includingupregulated anaerobic glycolysis in the gastrocnemius muscle aswell as increased gluconeogenesis, glycogenolysis, and keto-genesis in the liver. These processes demonstrated how musclehypertrophy can alter systemic metabolism, influencing distantorgans, to supply nutrients required for myogenic cell growthand at the same time limit diet-induced obesity. Taken together,the current study highlights the metabolic role of glycolyticmuscle fibers, which can be induced by resistance exercise, inregressing diet-induced obesity and age-related fat accumulationand improving glucose metabolism.
■ ASSOCIATED CONTENT*S Supporting Information
Body weights of animals in the aging study at 12 weeks and 18months, PCA scores plot of NMR spectra of gastrocnemiusmuscle tissue, sections of NMR spectra showing anserine andcarnosine standards and a pooled gastrocnemius muscle extractmixed with D2O or anserine standards, and summary of fattyacids changes due to induced genotype detected followinganalysis by GC−FID. This material is available free of charge viathe Internet at http://pubs.acs.org.
Figure 6. Profound metabolic perturbation as a result of Akt1 inductionin the skeletal muscle of the HF/HS-fed DTG mice (red, increase inconcentration; blue, decrease in concentration) as compared with thecontrols fed the same diet. Increased Cori cycle activity and hepatic fattyacid oxidation were evident in the DTG mice. Abbreviations: α-KG,α-ketoglutarate; β-HB, β-hydroxybutyrate; DMG, dimethylglycine;G6P, glucose-6-phosphate; M6P, mannose-6-phosphate.
Figure 7. For the HF/HS-fed animals, the concentrations of anserine and carnosine were negatively correlated with the lactate concentration in thegastrocnemius muscle (Pearson correlation coefficient, r = −0.90). A weaker correlation was observed when all data from both diet and aging studieswere considered (r = −0.63).
Journal of Proteome Research Article
dx.doi.org/10.1021/pr500756u | J. Proteome Res. 2015, 14, 342−352351

■ AUTHOR INFORMATION
Corresponding Author
*Tel.: +44 (0)1223 437503. Fax: +44 (0)1223 437515. E-mail:[email protected].
Notes
The authors declare no competing financial interest.
■ ACKNOWLEDGMENTS
The authors gratefully thank the support from UniversitiTeknologi Malaysia (K.-K.C.), the Royal Society, UK (J.L.G.),the Medical Research Council, UK (Lipid Profiling and Signallingprogramme grant; UD99999906; J.L.G.), the Wellcome Trust(UPLC QToF MS based lipidomics; 093148/Z/10/Z; J.L.G.),and the National Institutes of Health (AG034972, HL081587,HL116591, and HL120160; K.W.).
■ REFERENCES(1) Brazil, D. P.; Hemmings, B. A. Ten years of protein kinase Bsignalling: a hard Akt to follow. Trends Biochem. Sci. 2001, 26, 657−664.(2) Fayard, E.; Tintignac, L. A.; Baudry, A.; Hemmings, B. A. Proteinkinase B/Akt at a glance. J. Cell Sci. 2005, 118, 5675−5678.(3) Manning, B. D.; Cantley, L. C. AKT/PKB signaling: navigatingdownstream. Cell 2007, 129, 1261−1274.(4) Sale, E. M.; Sale, G. J. Protein kinase B: signalling roles andtherapeutic targeting. Cell. Mol. Life Sci. 2008, 65, 113−127.(5) Hoffman, E. P.; Nader, G. A. Balancing muscle hypertrophy andatrophy. Nat. Med. 2004, 10, 584−585.(6) Izumiya, Y.; Hopkins, T.; Morris, C.; Sato, K.; Zeng, L.; Viereck, J.;Hamilton, J. A.; Ouchi, N.; LeBrasseur, N. K.; Walsh, K. Fast/glycolyticmuscle fiber growth reduces fat mass and improves metabolicparameters in obese mice. Cell Metab. 2008, 7, 159−172.(7) Wan, M.; Easton, R. M.; Gleason, C. E.; Monks, B. R.; Ueki, K.;Kahn, C. R.; Birnbaum, M. J. Loss of Akt1 in mice increases energyexpenditure and protects against diet-induced obesity. Mol. Cell. Biol.2012, 32, 96−106.(8) Akasaki, Y.; Ouchi, N.; Izumiya, Y.; Bernardo, B. L.; Lebrasseur, N.K.; Walsh, K. Glycolytic fast-twitch muscle fiber restoration countersadverse age-related changes in body composition and metabolism. AgingCell 2014, 13, 80−91.(9) Grill, M. A.; Bales, M. A.; Fought, A. N.; Rosburg, K. C.; Munger, S.J.; Antin, P. B. Tetracycline-inducible system for regulation of skeletalmuscle-specific gene expression in transgenic mice. Transgenic Res.2003, 12, 33−43.(10) Shiojima, I.; Sato, K.; Izumiya, Y.; Schiekofer, S.; Ito, M.; Liao, R.;Colucci, W. S.; Walsh, K. Disruption of coordinated cardiac hypertrophyand angiogenesis contributes to the transition to heart failure. J. Clin.Invest. 2005, 115, 2108−2118.(11) Salek, R.; Cheng, K.-K.; Griffin, J. The study of mammalianmetabolism through NMR-based metabolomics. Methods Enzymol.2011, 500, 337−351.(12) Le Belle, J. E.; Harris, N. G.; Williams, S. R.; Bhakoo, K. K. Acomparison of cell and tissue extraction techniques using high-resolution 1H-NMR spectroscopy. NMR Biomed. 2002, 15, 37−44.(13) Atherton, H. J.; Gulston, M. K.; Bailey, N. J.; Cheng, K.-K.; Zhang,W.; Clarke, K.; Griffin, J. L. Metabolomics of the interaction betweenPPAR-α and age in the PPAR-α-null mouse.Mol. Syst. Biol. 2009, 5, 259.(14) Wishart, D. S.; Tzur, D.; Knox, C.; Eisner, R.; Guo, A. C.; Young,N.; Cheng, D.; Jewell, K.; Arndt, D.; Sawhney, S.; et al. HMDB: theHuman Metabolome Database. Nucleic Acids Res. 2007, 35, D521−526.(15) Nicholson, J. K.; Foxall, P. J.; Spraul, M.; Farrant, R. D.; Lindon, J.C. 750 MHz 1H and 1H−13C NMR spectroscopy of human bloodplasma. Anal. Chem. 1995, 67, 793−811.(16) Gullberg, J.; Jonsson, P.; Nordstrom, A.; Sjostrom, M.; Moritz, T.Design of experiments: an efficient strategy to identify factorsinfluencing extraction and derivatization of Arabidopsis thaliana samples
in metabolomic studies with gas chromatography/mass spectrometry.Anal. Biochem. 2004, 331, 283−295.(17) Morrison, W. R.; Smith, L. M. Preparation of fatty acid methylesters and dimethylacetals from lipids with boron fluoride−methanol. J.Lipid Res. 1964, 5, 600−608.(18) Reilly, M. P.; Rader, D. J. The metabolic syndrome: more than thesum of its parts? Circulation 2003, 108, 1546−1551.(19) Lai, K.-M. V.; Gonzalez, M.; Poueymirou,W. T.; Kline,W. O.; Na,E.; Zlotchenko, E.; Stitt, T. N.; Economides, A. N.; Yancopoulos, G. D.;Glass, D. J. Conditional activation of akt in adult skeletal muscle inducesrapid hypertrophy. Mol. Cell. Biol. 2004, 24, 9295−9304.(20) Holliday, R.; McFarland, G. A. Inhibition of the growth oftransformed and neoplastic cells by the dipeptide carnosine. Br. J. Cancer1996, 73, 966−971.(21) Renner, C.; Asperger, A.; Seyffarth, A.; Meixensberger, J.;Gebhardt, R.; Gaunitz, F. Carnosine inhibits ATP production in cellsfrom malignant glioma. Neurol. Res. 2010, 32, 101−105.(22) Gariballa, S. E.; Sinclair, A. J. Carnosine: physiological propertiesand therapeutic potential. Age Ageing 2000, 29, 207−210.(23) Holliday, R.; McFarland, G. A. A role for carnosine in cellularmaintenance. Biochemistry (Moscow) 2000, 65, 843−848.(24) Maemura, H.; Goto, K.; Yoshioka, T.; Sato, M.; Takahata, Y.;Morimatsu, F.; Takamatsu, K. Effects of Carnosine and AnserineSupplementation on Relatively High Intensity Endurance Performance.Int. J. Sport Health Sci. 2006, 4, 86−94.(25) Jia, H.; Qi, X.; Fang, S.; Jin, Y.; Han, X.; Wang, Y.; Wang, A.; Zhou,H. Carnosine inhibits high glucose-induced mesangial cell proliferationthrough mediating cell cycle progression. Regul. Pept. 2009, 154, 69−76.(26) Renner, C.; Zemitzsch, N.; Fuchs, B.; Geiger, K. D.; Hermes, M.;Hengstler, J.; Gebhardt, R.; Meixensberger, J.; Gaunitz, F. Carnosineretards tumor growth in vivo in an NIH3T3-HER2/neu mouse model.Mol. Cancer 2010, 9, 2.(27) Carpten, J. D.; Faber, A. L.; Horn, C.; Donoho, G. P.; Briggs, S. L.;Robbins, C. M.; Hostetter, G.; Boguslawski, S.; Moses, T. Y.; Savage, S.;et al. A transforming mutation in the pleckstrin homology domain ofAKT1 in cancer. Nature 2007, 448, 439−444.(28) Ju, X.; Katiyar, S.; Wang, C.; Liu, M.; Jiao, X.; Li, S.; Zhou, J.;Turner, J.; Lisanti, M. P.; Russell, R. G.; et al. Akt1 governs breast cancerprogression in vivo. Proc. Natl. Acad. Sci. U.S.A. 2007, 104, 7438−7443.(29) Liu, H.; Radisky, D. C.; Nelson, C.M.; Zhang, H.; Fata, J. E.; Roth,R. A.; Bissell, M. J. Mechanism of Akt1 inhibition of breast cancer cellinvasion reveals a protumorigenic role for TSC2. Proc. Natl. Acad. Sci.U.S.A. 2006, 103, 4134−4139.(30) Izumiya, Y.; Bina, H. A.; Ouchi, N.; Akasaki, Y.; Kharitonenkov,A.; Walsh, K. FGF21 is an Akt-regulated myokine. FEBS Lett. 2008, 582,3805−3810.(31) Xu, J.; Lloyd, D. J.; Hale, C.; Stanislaus, S.; Chen, M.; Sivits, G.;Vonderfecht, S.; Hecht, R.; Li, Y.-S.; Lindberg, R. A.; et al. Fibroblastgrowth factor 21 reverses hepatic steatosis, increases energyexpenditure, and improves insulin sensitivity in diet-induced obesemice. Diabetes 2009, 58, 250−259.(32) Tyynismaa, H.; Carroll, C. J.; Raimundo, N.; Ahola-Erkkila, S.;Wenz, T.; Ruhanen, H.; Guse, K.; Hemminki, A.; Peltola-Mjøsund, K.E.; Tulkki, V.; et al. Mitochondrial myopathy induces a starvation-likeresponse. Hum. Mol. Genet. 2010, 19, 3948−3958.
Journal of Proteome Research Article
dx.doi.org/10.1021/pr500756u | J. Proteome Res. 2015, 14, 342−352352