mercury chemistry in the global atmosphere: constraints from mercury speciation measurements noelle...
Post on 19-Dec-2015
216 views
TRANSCRIPT

Mercury Chemistry in the Global Mercury Chemistry in the Global Atmosphere: Constraints from Mercury Atmosphere: Constraints from Mercury
Speciation MeasurementsSpeciation Measurements
Noelle Eckley SelinNoelle Eckley Selin
EPS Grad Student Seminar SeriesEPS Grad Student Seminar Series
14 February 2006 14 February 2006

Why study Mercury (Hg)?Why study Mercury (Hg)?
• Mercury is a global environmental pollutant– Current levels in atmosphere are 3x pre-
industrial levels– Accumulates in food webs as methyl mercury;
risk to humans & environment (neurotoxin)• National, regional, and international policy
interestU.S. EPA recommended limit for mercury
in hair: 1 ug/gNoelle’s hair: 1.1 ug/gEPA benchmark dose (10% of births show
neurological defects): 11 ug/gwww.greenpeace.org/usa/mercury

THE MERCURY CYCLE: CURRENT
Wet & DryDeposition 2600
ATMOSPHERE5000
SURFACE SOILS1,000,000 OCEAN
289,000
NetWet & DryDeposition1900
Net Oceanic Evasion
1500
Net burial200
Land emissions1600
Quantities in Mg/yearUncertainty ranges in parenthesesAdapted from Mason & Sheu, 2002
AnthropogenicEmissions 2400
Extraction from deep reservoirs2400
River200
(1800-3600) (700-3500)(1680-3120)
(1680-3120)
(1300-2600)(700-3500)

Hg0
1.7 ng/m3
GaseousPhase
AqueousPhase
Hg0
Henry’s Constant 0.11 M/atm
Particulate Phase
Oxidation Hg2+
10-200 pg/m3
HgP
1-100 pg/m3
Hg2+
k=8.7(+/-2.8) x 10-14 cm3 s-1 (Sommar et al. 2001)k=9.0(+/-1.3) x 10-14 cm3 s-1(Pal & Ariya 2004)
Too high? (Calvert and Lindberg 2005)
k=3(+/-2) x 10-20 cm3 s-1 (Hall 1995)Reported rate constants up to k=1.7 x 10⁻¹⁸ cm3 s-1
Henry’s Constant 1.4x10⁶ M/atm
OH
O3
Oxidation
HO2
??Reduction
SO3
k=1.1-1.7 x 10⁴ M-1 s-1 (Pehkonen & Lin 1998)Shouldn’t occur (Gårdfeldt & Jonsson 2003)
k=0.0106 (+/- 0.0009) s-1
(vanLoon et al. 2000)Occurs only where high sulfur, low chlorine
Oxalate?

ApproachApproach
• Use observations from latitudinal gradient, seasonal cycles, and short-term variability to constrain uncertainties in Hg chemistry and deposition, using GEOS-Chem mercury simulation and sensitivity simulations
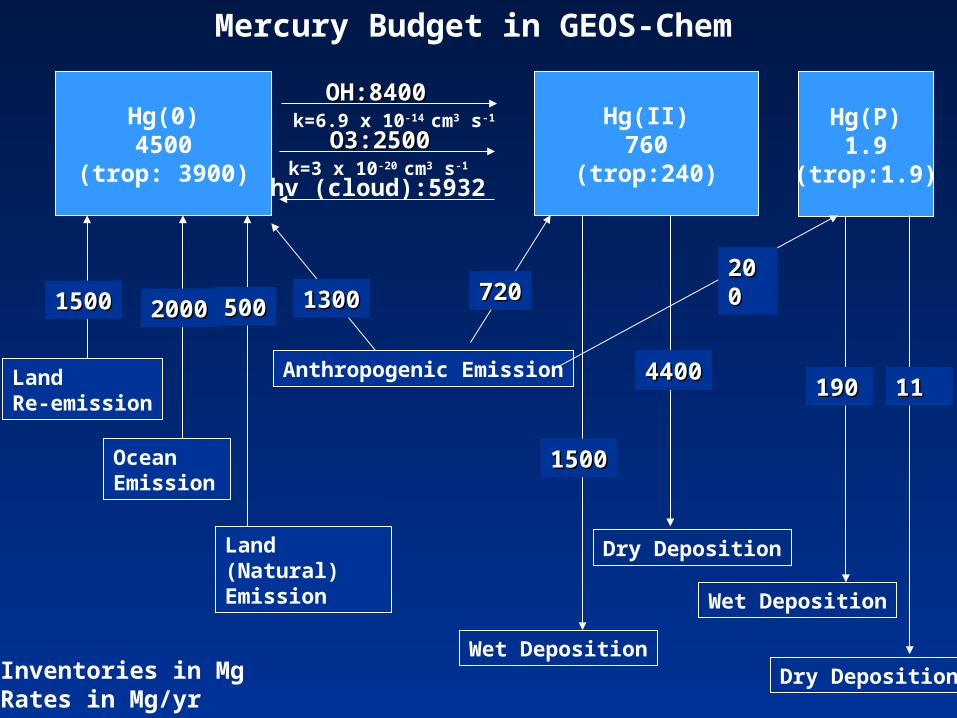
Hg(0)4500
(trop: 3900)
Hg(II)760
(trop:240)
OH:8400OH:8400
Dry DepositionLand (Natural) Emission
Anthropogenic EmissionLand Re-emission
Hg(P)1.9
(trop:1.9)
720720200200
O3:2500O3:2500
15001500 1300130050050020002000
Dry DepositionWet Deposition
Wet Deposition
44004400
15001500
190190 1111
Inventories in MgRates in Mg/yr
k=3 x 10-20 cm3 s-1 hv (cloud):5932
k=6.9 x 10⁻¹⁴ cm3 s-1
Ocean Emission
Mercury Budget in GEOS-Chem

Constraints from annual mean TGMConstraints from annual mean TGM
+
Average concentration at22 land-based sites Measured: 1.60 ng/m3 Modeled: 1.60 ng/m3
High Atlantic cruise data?
Oxidation rate constant (OH) adjusted to correspond to mean concentrations.Shown above: oxidation rate k=6.5 x 10⁻¹⁴ cm3 s-1
k=8.7(+/-2.8) x 10-14 cm3 s-1 (Sommar et al. 2001)

Constraints from Interhemispheric GradientConstraints from Interhemispheric Gradient
Measurement-based estimatesof interhemispheric gradient:
Lamborg et al. (2002): 1.2-1.8Temme et al. (2003): 1.49 (+/- 0.12)
GEOS-Chem interhemispheric gradient: 1.21GEOS-Chem TGM lifetime: 0.92 yr
Consistent with TGM lifetime of 1 year
Interhemispheric gradient Constrains TGM lifetime
*=land-based stations; +=Temme, 2003 (Atlantic); Δ=Fitzgerald, 1995 (Pacific); ◊=Laurier, 2004 (Atlantic); red line=GEOS-Chem global average

Constraints from Seasonal VariationsConstraints from Seasonal Variations
MeasurementsModel
MeasurementsModel (OH, O3, reduction)
OH only O3 only
12 sites

Constraints from Time Series at Okinawa Constraints from Time Series at Okinawa [Jaffe et al. 2005][Jaffe et al. 2005]
Diurnal variation of RGM: daytime production plus rapid sink (uptake onto sea-salt?) measurements, standard model, O3 only, without sea salt
morning increase a constraint on OH oxidation One grid box upwind

RGM model-measurement comparison at OkinawaRGM model-measurement comparison at OkinawaA sea-salt sink for RGM?A sea-salt sink for RGM?
• Previous GEOS-Chem vs. measurements at Okinawa by Jaffe et al. (2005): model overestimates measurements by a factor of 3 (note difference in scale), but captures some day-to-day variation in observations
• Revised Model and measured RGM including an implied sink for RGM (sea salt uptake?) are consistent with order of magnitude of Okinawa observations (same scale)

Okinawa Data: Hg(0) vs CO and Asian EmissionsOkinawa Data: Hg(0) vs CO and Asian Emissionsmodel (red), measured [Jaffe et al 2005] (black)model (red), measured [Jaffe et al 2005] (black)
Hg(0)/CO ratio: check on Asian emissionsSlope 0.0053 in measurements 0.0036 in model
Pacyna et al 2003: 770 Mg/yearJaffe: 1460 Mg/year (based on data)
GEOS-Chem Asia: (GEIA 2000 inventory)
Hg(0): 586 Mg Hg(II): 365 Mg land reemission: 342 Mg total Hg(0)-Asia: 928 Mg
Consistent with Jaffe underestimate of Asian emissions – but land reemission is a substantial portion!

Constraints from Annual Average RGMConstraints from Annual Average RGM
Variable measurements; 2 cruisesaverage of all measurements 17.4 pg/m3, GEOS-CHEM 8.3 pg/m3however, skewed by a few high measurements
Limitations from RGM – HgP partitioning
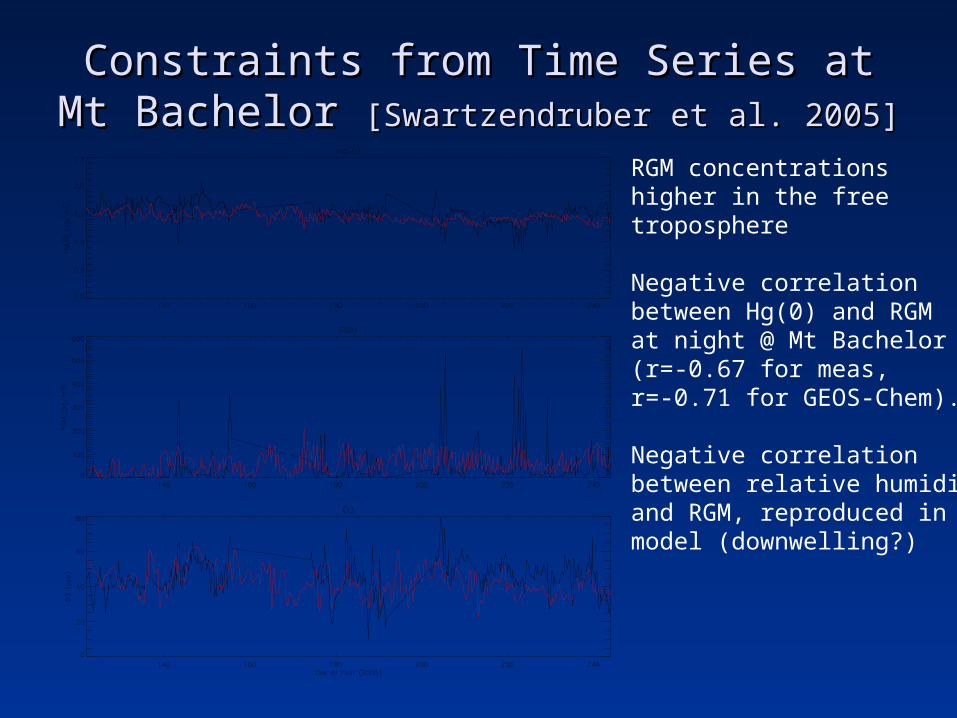
Constraints from Time Series at Mt Bachelor Constraints from Time Series at Mt Bachelor [Swartzendruber et al. 2005][Swartzendruber et al. 2005]
RGM concentrations higher in the free troposphere
Negative correlation between Hg(0) and RGM at night @ Mt Bachelor(r=-0.67 for meas, r=-0.71 for GEOS-Chem).
Negative correlation between relative humidityand RGM, reproduced inmodel (downwelling?)

Constraints from Wet DepositionConstraints from Wet Deposition
Data from U.S. Mercury Deposition Network (2006)
Moderate correlation (r2=0.52 for 2003, 0.66 for 2004)GEOS-Chem underestimates wet deposition over U.S. by c. 25%
2 patterns: latitudinal variation (OH oxidation) and regional enhancement (sources)
Comparison with measurements % deposition from U.S. Sources

Conclusions and Future WorkConclusions and Future Work
• GEOS-Chem model suggests that – OH, O3 reactions, coupled with reduction, provide
best explanation for Hg observations– Rapid RGM uptake onto sea-salt aerosol– Elevated RGM in free troposphere & stratosphere
• Future work: land emissions parameterization• Acknowledgments: Prof. Daniel Jacob (advisor);
Bob Yantosca (Harvard); Rokjin Park (Harvard); Sarah Strode (U.Wa); Lyatt Jaegle (U.Wa)