· mercer g:\wp\retire\2011\opersu\board mtgs\0729 investreturn and demographic assumptions.ppt 2...
TRANSCRIPT

www.mercer.com
Oregon Public Employees’ Retirement System Experience Study for December 31, 2010 and December 31, 2011 Actuarial Valuations - Demographic Assumptions - Investment Return Assumptions
July 29, 2011
Matt Larrabee and Scott Preppernau
1G:\WP\Retire\2011\Opersu\Board mtgs\0729 InvestReturn and demographic assumptions.pptMercer
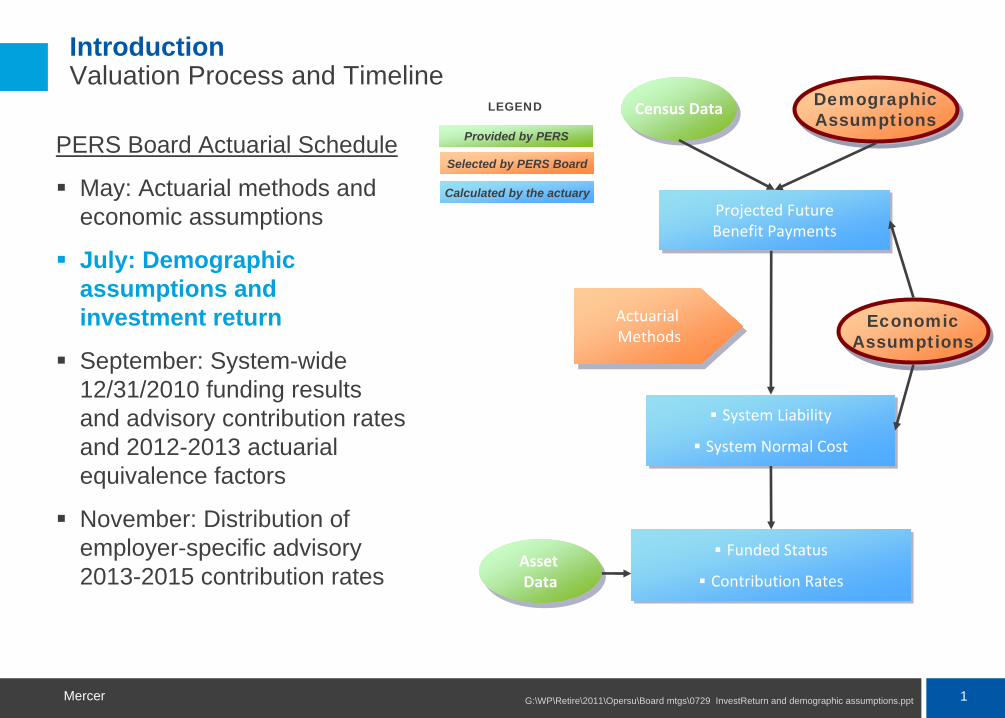
System Liability
System Normal Cost
System Liability
System Normal Cost
Projected Future Benefit PaymentsProjected Future Benefit Payments
Funded Status
Contribution Rates
Funded Status
Contribution Rates
PERS Board Actuarial Schedule
May: Actuarial methods and economic assumptions
July: Demographic assumptions and investment return
September: System-wide 12/31/2010 funding results and advisory contribution rates and 2012-2013 actuarial equivalence factors
November: Distribution of employer-specific advisory 2013-2015 contribution rates
Introduction Valuation Process and Timeline
Census DataCensus Data Demographic Assumptions Demographic Assumptions
Economic Assumptions Economic
Assumptions
Asset
Data
Asset
Data
Actuarial
Methods
Actuarial
Methods
Provided by PERS
Selected by PERS Board
Calculated by the actuary
LEGEND

2G:\WP\Retire\2011\Opersu\Board mtgs\0729 InvestReturn and demographic assumptions.pptMercer
Introduction Valuation Process and Timeline
Actuarial valuations are conducted annually each year-end– Rates are set biennially based on “odd year” actuarial valuations– “Even year” valuations are strictly advisory
The rates determined by the actuarial valuation are adopted by the Board and go into effect 18 months subsequent to the valuation date
Valuation Date Employer Contribution Rates
12/31/2009 July 2011 – June 2013
12/31/2011 July 2013 – June 2015
Assumptions selected today will be used in the 12/31/2011 valuation, which will be completed in the fall of 2012
3G:\WP\Retire\2011\Opersu\Board mtgs\0729 InvestReturn and demographic assumptions.pptMercer
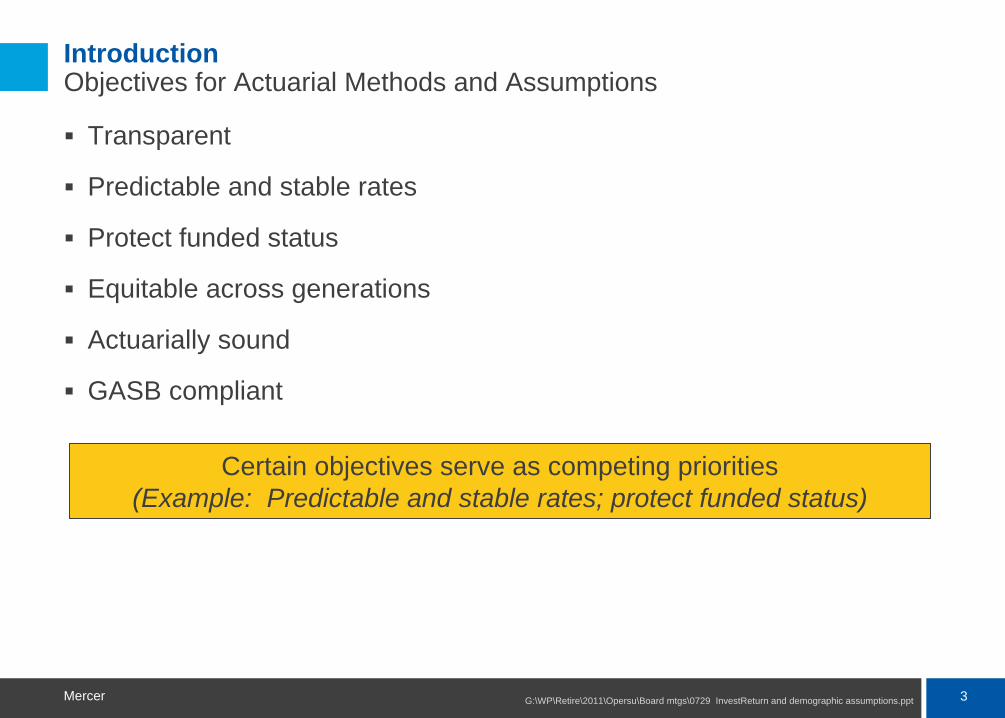
Introduction Objectives for Actuarial Methods and Assumptions
Transparent
Predictable and stable rates
Protect funded status
Equitable across generations
Actuarially sound
GASB compliant
Certain objectives serve as competing priorities(Example: Predictable and stable rates; protect funded status)

4G:\WP\Retire\2011\Opersu\Board mtgs\0729 InvestReturn and demographic assumptions.pptMercer
Introduction Framework for Setting Assumptions and Methods
Promised Benefits
Current Assets
Investment Earnings
Contributions
The valuation can be viewed as a funding exercise based on long- term assumptions about an uncertain future
An assumption is made about future earnings
Methods and assumptions
selected set near and long-term
contribution levels
The long-term earnings assumption does not affect benefit levels (with a key exception) or long-term contribution levels – it only affects contribution timing
Some assumptions
affect projected
benefit levels

5G:\WP\Retire\2011\Opersu\Board mtgs\0729 InvestReturn and demographic assumptions.pptMercer
Introduction Framework for Setting Assumptions and Methods
If viewed as a funding exercise that uses a single assumption set about an uncertain future, the valuation answers two funding questions:
– What is the current estimated funding shortfall for service already rendered if all assumptions are met in the future?
– What contribution rates would be necessary to (a) eliminate the funding shortfall over a fixed time period and (b) fund benefits projected to be earned in the future years by members if all assumptions are met in the future?
Assumptions do not affect the program’s long-term cost, with the exception of future retirements under the Tier 1/Tier 2 Money Match benefit formula
Long-Term Cost = Benefits Paid - Investment Earnings = Total Contributions

6G:\WP\Retire\2011\Opersu\Board mtgs\0729 InvestReturn and demographic assumptions.pptMercer
Introduction Framework for Setting Assumptions and Methods
Assumptions and methods do affect contribution timing
One certainty: actual future experience will vary from assumption– Actual future experience, not assumptions, will determine long-term cost– Deviations from assumptions will lead to positive or negative variations
from financial projections of future contribution rates
Typically, the largest deviations arise from actual annual investment return experience
- Actual experience is not affected by the return assumption selected
If negative variances occur repeatedly or are severe, then:- Funding shortfalls can increase to a high percentage of system
payroll- Contribution rates calculated to eliminate shortfall over a generation
can rise to untenable levels- In extreme instances, benefit security can be compromised
Long-Term Cost = Benefits Paid - Investment Earnings = Total Contributions

Investment Return Assumptions

8G:\WP\Retire\2011\Opersu\Board mtgs\0729 InvestReturn and demographic assumptions.pptMercer
Economic Assumptions Investment Return
In our May 26, 2011 Board presentation, we deferred a proposal on the investment return assumption until the OIC’s investment consultant completed their review of capital market assumptions.
In order to add a broader perspective to the discussion, the chart on the right shows the assumptions used by the 120 large public sector systems in the NASRA survey.
The current assumption of 8.0% is the median and most common assumption in the survey.
The mean (weighted average) rate selected is approximately 7.9%
The survey covers valuation dates that range from June 2007 to January 2010
Distribution of Investment Return Assumptions 2010 NASRA Survey Data
0 20 40 60 80
< 7.25%
7.25%
7.50%
7.75%
8.00%
8.25%
8.50%
>8.50%
Inve
stm
ent R
etur
n A
ssum
ptio
n
Number of Plans

9G:\WP\Retire\2011\Opersu\Board mtgs\0729 InvestReturn and demographic assumptions.pptMercer
Economic Assumptions Investment Return – Regular Account
The table compares the distribution of expected annualized returns over 20 years for the regular account based on Mercer and SIS capital market assumptions.
– Returns are net of administrative and passive investment expenses
– No active management return is included
A range of reasonable assumptions exists. Using a “50th percentile or lower” assumption:
– Improves benefit security– Increases the probability that actual returns
meet or exceed the assumption
The current assumption of 8.0% is in the reasonable range based on current expectations
Assumptions of 7.50%, 7.75% or 7.90% are also in the reasonable range and would increase the likelihood the assumption is met in a given year
Percentile Mercer SIS
25th 5.74% 6.29%
45th 7.48% 7.81%
50th 7.88% 8.16%
55th 8.28% 8.51%
75th 10.03% 10.03%
20 Year Time Horizon
To illustrate the estimated impact of an assumption change, the effects of a 7.75% regular account assumption are shown at the end of the presentation
10G:\WP\Retire\2011\Opersu\Board mtgs\0729 InvestReturn and demographic assumptions.pptMercer
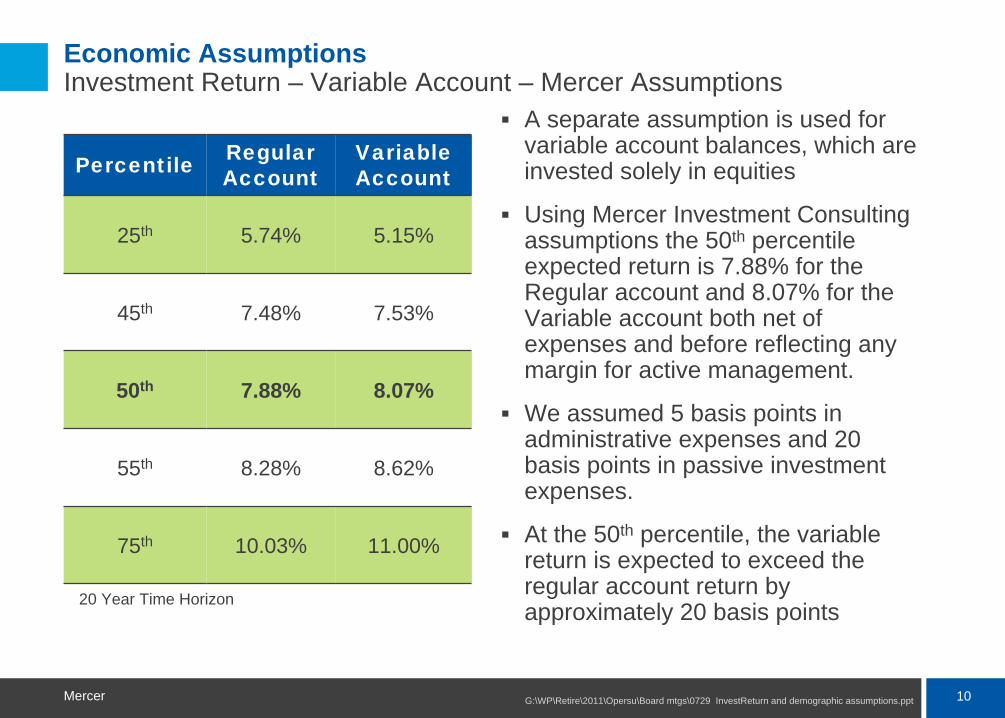
Economic Assumptions Investment Return – Variable Account – Mercer Assumptions
A separate assumption is used for variable account balances, which are invested solely in equities
Using Mercer Investment Consulting assumptions the 50th percentile expected return is 7.88% for the Regular account and 8.07% for the Variable account both net of expenses and before reflecting any margin for active management.
We assumed 5 basis points in administrative expenses and 20 basis points in passive investment expenses.
At the 50th percentile, the variable return is expected to exceed the regular account return by approximately 20 basis points
Percentile Regular Account
Variable Account
25th 5.74% 5.15%
45th 7.48% 7.53%
50th 7.88% 8.07%
55th 8.28% 8.62%
75th 10.03% 11.00%
20 Year Time Horizon

Demographic Assumptions
12G:\WP\Retire\2011\Opersu\Board mtgs\0729 InvestReturn and demographic assumptions.pptMercer
Demographic Assumptions Overview
Compared actual experience from January 1, 2007 through December 31, 2010 to expected experience based on assumptions from the December 31, 2009 actuarial valuation
Actual experience, combined with future expectations, are used to develop proposed assumptions for December 31, 2010 and December 31, 2011 actuarial valuations
The presentation summarizes those results, primarily for assumptions where significant changes are proposed.
More details are available in:– Our forthcoming written report– The appendix of this presentation

13G:\WP\Retire\2011\Opersu\Board mtgs\0729 InvestReturn and demographic assumptions.pptMercer
Demographic Assumptions Confidence Intervals
We use 50% and 90% confidence intervals in our analysis.
The 90% confidence interval represents the range around the observed rate that contains the true rate during the period of study with 90% probability
The size of the confidence interval depends on the number of observations
If an assumption is outside the 90% confidence interval and there is no other information to explain the observed experience, a change in assumption should be considered.
0.0%
5.0%
10.0%
15.0%
20.0%
25.0%
30.0%
50% ConfidenceInterval90% ConfidenceInterval

14G:\WP\Retire\2011\Opersu\Board mtgs\0729 InvestReturn and demographic assumptions.pptMercer
Mortality Assumptions Summary of Proposed Assumptions
Current Assumption Proposed Changes
Healthy Retired RP 2000, GenerationalCombined Active/Healthy Retired, Sex distinct No change
School district male
Other GS male
P&F male
White collar, set back 12 monthsWhite collar, no set back
Blend 33% blue collar, no set back
White collar, set back 18 monthsBlend 25% blue collar, set back 12 monthsNo change
School district female
Other femaleWhite collar, set back 18 monthsBlend 33% blue collar, no set back
White collar, set back 24 monthsWhite collar, no set back
Disabled Retired RP 2000, Static, No CollarCombined Active/Healthy Retired, Sex distinct
No change
Male
FemaleSet forward 60 months, min of 2.25%Set forward 48 months, min of 2.25%
No changeNo change
Non-Retired Mortality % of Healthy Retired Mortality % of Healthy Retired Mortality
School district male
Other GS male
P&F male
75%75%70%
No change85%No change
School district female
Other female50%50%
60%No change
Note that “white collar” and “blue collar” are terms used in the RP 2000 mortality table to adjust levels of mortality. They are used here to identify the adjustments made and are not intended to classify any
employees as either “blue collar” or “white collar.”

15G:\WP\Retire\2011\Opersu\Board mtgs\0729 InvestReturn and demographic assumptions.pptMercer
Mortality Assumptions Healthy Retired Mortality
We analyze mortality experience for non-disabled members in five groupings
When the current assumption lies outside of the 90% confidence interval for the aggregate mortality rate, we have proposed a change for that group
The amount of data available in each group affects the size of the confidence interval
Note that the aggregate mortality rate is a function of both the group mortality rates and the ages of the members in the group.
– The groups have different average ages. This means you can not conclude, for example, that Police & Fire males have lower mortality than other groups based on the data in the graph.
Healthy Retiree Mortality Aggregate Confidence Intervals and Rates
0%
1%
2%
3%
4%
School District Male Other General Service Male Police & Fire Male School District Female Other Female
Mor
talit
y R
ate
50% Confidence Interval 90% Confidence Interval Current Assumption Proposed Assumption

16G:\WP\Retire\2011\Opersu\Board mtgs\0729 InvestReturn and demographic assumptions.pptMercer
Mortality Assumptions Healthy Retired Mortality
Current Assumption
Proposed Assumption
ExposuresActual Deaths
Expected Deaths A/E Ratio
Expected Deaths A/E Ratio
School District Male 59,024 1,649 1,718 96% 1,634 101%
Other General Service Male* 88,837 2,778 2,936 95% 2,776 100%
Police & Fire Male 20,685 357 379 94% 379 94%
School District Female 117,027 2,668 2,815 95% 2,677 100%
Other Female* 113,764 3,356 3,475 97% 3,340 100%
The Actual/Expected ratio for healthy retirees under a generational table should be approximately 100% because the table has future mortality improvement built into it.
The Actual/Expected ratio for all groups is below 100%. For 4 out of 5 groups, the aggregate mortality rate was outside of the 90% confidence interval.
– While the Actual/Expected ratio for Police & Fire Males was 94%, the aggregate rate was within the confidence interval. We propose continued monitoring but no immediate change to the assumption for that group.
We modified the “white collar”/”blue collar” adjustments and age set backs to adjust the current tables to match Oregon PERS experience.
* Includes beneficiaries.

17G:\WP\Retire\2011\Opersu\Board mtgs\0729 InvestReturn and demographic assumptions.pptMercer
Retirement Assumptions Structure
Retirement rates vary by job classification and service levels:– General Service
Service bands at <15 years, 15 to 29 years, and 30+ years
First two bands distinguish between School Districts and all others– Police & Fire
Service bands at <13 years, 13 to 24 years, and 25+ years Tier 1/Tier 2 - School Districts
Members with 15 - 29 Years of Service
0%
10%
20%
30%
40%
55 56 57 58 59 60 61 62 63 64 65 66 67 68 69
Age
Ret
irem
ent R
ates
50% Confidence Interval 90% Confidence IntervalCurrent T1/T2 Assumption Proposed T1/T2 Assumption
Minor modifications were made to most assumptions to more closely match recent experience
An example is shown at right. Charts for additional groups can be found in the appendix.

18G:\WP\Retire\2011\Opersu\Board mtgs\0729 InvestReturn and demographic assumptions.pptMercer
Salary Increase Assumptions Summary of Proposed Assumptions
For the merit scale, we studied experience from 2003 through 2010.
Merit increases are added to inflation and general productivity to arrive at a total salary increase assumption
Current assumptions set for three groups:
School Districts (SD)
Other General Service (Other GS)
Police & Fire (PF)
Proposed changes:
Decrease Merit Scale modestly for SD at 10+ years of service
Decrease Merit Scale for Other GS slightly
Maintain Merit Scale for PF
Proposed rates attempt to not overreact to 2009 and 2010 experience
School Districts
-1.0%
0.0%
1.0%
2.0%
3.0%
4.0%
0 5 10 15 20 25 30
Years of Service
Mer
it In
crea
se
0.990000
1.000000
1.010000
1.020000
1.030000
1.040000
50% Confidence Interval 90% Confidence IntervalCurrent Proposed Assumption
In our most recent valuations, merit scale was assumed to be 0% for both 2009 and 2010, reflecting a projected
near-term effect of the economic downturn.

19G:\WP\Retire\2011\Opersu\Board mtgs\0729 InvestReturn and demographic assumptions.pptMercer
Termination Assumptions Structure of Termination Assumption
Our pre-retirement employment termination assumption is exclusively age-based for members with three or more years of service
– For the first three years of employment, the age-based rate is increased to reflect the higher likelihood of termination in initial years of employment
– This a called a “select and ultimate” rate structure, with the three-year select period followed by ultimate rates
Prior valuations have used the same ultimate rates for Tier 1/Tier 2 and OPSRP
We propose introducing a distinction between Tier 1/Tier 2 and OPSRP ultimate rates– Assumptions for Tier 1/Tier 2 will be based on experience for that closed group
Because it is closed, this group will increasingly exhibit greater average service at any age than the overall system (i.e. when OPSRP is included)
- May lead to diverging termination experience for Tier 1/Tier 2 members compared to that of membership for the system as a whole
– OPSRP assumptions will be based on overall system experience
We also propose eliminating the distinction between General Service employees of SLGRP and Independent employers
– Observed experience is similar, and the change would simplify the valuation and increase statistical credibility of the assumption

20G:\WP\Retire\2011\Opersu\Board mtgs\0729 InvestReturn and demographic assumptions.pptMercer
Termination Assumptions Summary of Proposed Assumptions
In general, the study period data showed:
– Tier 1/Tier 2 termination experience was at or slightly below the current assumption
– Overall system experience (reflecting OPSRP) was above the current assumption
Where we proposed new assumptions, we did not move rates all the way to recent experience
– Aware that the financial crisis and its aftermath influenced experience in manner not expected for long-term
Illustrated at right for School Districts
See appendix for additional graphs.
School Districts - OPSRPBased on Tier 1/Tier 2 and OPSRP experience
0%
5%
10%
15%
25 30 35 40 45 50Age
Term
inat
ion
Rat
e
50% Confidence Interval 90% Confidence Interval
Current Assumption Proposed Assumption
School Districts - Tier 1/Tier 2Based on Tier 1/Tier 2 experience only
0%
5%
10%
15%
25 30 35 40 45 50Age
Term
inat
ion
Rat
e

21G:\WP\Retire\2011\Opersu\Board mtgs\0729 InvestReturn and demographic assumptions.pptMercer
Probability of Account Withdrawal Assumptions Summary of Proposed Assumptions
This assumption represents the probability that a terminating Tier 1/Tier 2 member will withdraw his/her account balance from the plan before retirement
This option is a progressively worse financial choice as time passes since member accounts get no new contributions.
Experience shows significant downward trend
– Latest experience suggests reducing the assumption further
We propose assuming no account withdrawals in the future
– The approach anticipates the future steady-state
– Simplifies valuation– Does not assume
financially questionable member behavior
General Service
0%
10%
20%
30%
40%
50%
25-29 30-34 35-39 40-44 45-49 50-54
Age band
Pro
babi
lity
of A
cct W
ithdr
awal
50% Confidence Interval 90% Confidence Interval Current AssumptionProposed Assumption 06-07 Val Assumption 05 Val Assumption

22G:\WP\Retire\2011\Opersu\Board mtgs\0729 InvestReturn and demographic assumptions.pptMercer
Unused Vacation Pay Cash-Out Summary of Proposed Assumptions
The final average salary for Tier 1 members can include the effect of any unused vacation cash-out at retirement
We assume this produces a fixed percentage increase to the final average salary
– Our assumption separates School Districts vs. all others
– Does not affect benefits calculated under Money Match
Data was not available to review this assumption in past experience studies
Data provided for the current experience study indicates the assumption should be lowered for both groups
Unused Vacation Cash-Out
0.00%
1.00%
2.00%
3.00%
T1 Non SD/Judge T1 SD
Perc
enta
ge In
crea
se in
Fin
al A
vera
ge S
alar
y
50% Confidence Interval 90% Confidence Interval Current Assumption Proposed Assumption

23G:\WP\Retire\2011\Opersu\Board mtgs\0729 InvestReturn and demographic assumptions.pptMercer
Retiree Healthcare Assumptions Summary of Proposed Assumptions
Participation rates among both RHIPA and healthy RHIA participants increased (held steady among RHIA participants with disabilities)
Participation levels may be affected by:– Economic conditions and cost of coverage – Relative attractiveness of RHIA/RHIPA programs compared to alternatives
We propose rates near the middle of the 50% confidence interval– Participation experience can change quickly, and should be monitored
going forward
RHIPA Participation Rates
0%
4%
8%
12%
16%
20%
RHIPA - Total
Rat
e
50% Confidence Interval 90% Confidence Interval Current AssumptionActual Proposed Assumption Actual Prior Study
RHIA Participation Rates
15%
20%
25%
30%
35%
40%
45%
50%
RHIA - Healthy RHIA - Disabled
Rat
e
50% Confidence Interval 90% Confidence Interval Current Assumption
Actual Actual Prior Study Proposed Assumption

24G:\WP\Retire\2011\Opersu\Board mtgs\0729 InvestReturn and demographic assumptions.pptMercer
Other Assumptions Summary of Proposed Assumptions
Current Assumption Proposed Changes
Duty Disability
Police & Fire
General Service
Percentage of the 1985 Disability Class 1Rates
15% (0.005% -- 0.127%)
1.5% (0.0005% -- 0.013%)
No Change
Ordinary Disability 50% of 1985 Disability Class 1 Rates w/ 0.20% cap (0.015% -- 0.200%)
50% of 1985 Disability Class 1 Rates w/ 0.18% cap (0.015% -- 0.180%)
Partial Lump Sum 6% for all years No Change
Total Lump Sum 6% for 2009, declining 0.5% per year until reaching 0% No Change
Purchase of Credited Service Non-Money Match Retirements: 55% Non-Money Match Retirements: 60%
Unused Sick Leave*
School District (M)
School District (F)
State General (M)
State General (F)
Local General (M)
Local General (F)
State P&F
Local P&F
Dormant
7.50% 6.75% 5.75% 4.25% 4.25%3.00% 7.25%8.25%3.50%
8.25% 6.50% 6.25% 3.75% No change No change 5.50% 7.50% 2.50%
* For members eligible to include unused sick leave in final average salary, final average salary is increased by the percentages noted above to model the estimated effects of sick leave

Actuarial Methods Treatment of Negative Rate Guarantee Reserve

26G:\WP\Retire\2011\Opersu\Board mtgs\0729 InvestReturn and demographic assumptions.pptMercer
Actuarial Methods Treatment of Negative Rate Guarantee Reserve
One unresolved actuarial methods issue is how to treat a negative Tier 1 Rate Guarantee Reserve (RGR) in valuation calculations
– Reserves are earmarked for a dedicated purpose and thus not intended to be available to meet general benefit payment obligations
– To reflect this, reserves are typically subtracted from the market value of assets in valuation calculations
Unlike a typical reserve the RGR can be in deficit and thus become negative– In the 12/31/2009 valuation, the negative RGR was subtracted from the market value of
assets
That approach can be justified theoretically, but an outcome of that approach is that a negative RGR is treated as an asset for valuation calculation purposes
Our proposal is to never treat a RGR as a valuation asset, whether positive or negative– This would avoid valuation assets potentially exceeding market value of assets– In addition, this approach recognizes the dedicated nature of each of the separate
reserves
Valuation Assets = Market Value of Assets – Reserves
This issue was discussed at length in May, and the pertinent slides from the May presentation are included in the Appendix

Decisions

28G:\WP\Retire\2011\Opersu\Board mtgs\0729 InvestReturn and demographic assumptions.pptMercer
Estimated Impact of Changes on Employer Rates Effect on Uncollared Base Rate
Tier 1/Tier 2 OPSRP RHIA/RHIPA
Normal Cost Rate UAL Rate Normal
Cost Rate UAL Rate Normal Cost Rate UAL Rate
Mortality 0.1% 0.4% 0.1% 0.0% 0.0% 0.0%
Other Demographic Assumptions
(0.4%) (0.1%) (0.2%) 0.0% 0.0% 0.0%
Treatment of Negative RGR 0.0% 0.2% 0.0% 0.0% 0.0% 0.0%
Total (0.3%) 0.5% (0.1%) 0.0% 0.0% 0.0%
7.75% Regular Return 0.6% 1.0% 0.4% 0.0% 0.0% 0.0%
Total 0.3% 1.5% 0.3% 0.0% 0.0% 0.0%
Estimated impact is shown on a systemwide basis. The impact from rate pool to rate pool (or among individual independent employers) will vary.
The estimated impact for treatment of the negative Rate Guarantee Reserve is based on a 12/31/2010 Rate Guarantee Reserve level of negative $199 million. Impact of alternative approaches can vary significantly in future years based on the magnitude of any potential negative Rate Guarantee Reserve.
Slide 31 of Mercer’s May 2011 presentation illustrates the benefit
impact of an alternative return assumption for a sample member
under Money Match.

29G:\WP\Retire\2011\Opersu\Board mtgs\0729 InvestReturn and demographic assumptions.pptMercer
Decisions Summary of Proposed Assumptions– Methods and Economic Assumptions
Current Assumption
Proposed Assumption
Regular Investment Return 8.00% 7.50% - 8.00%*Variable Investment Return 8.50% 7.75% - 8.25%**Health Cost Trend Rate
2011 Trend Rate 7.00% No Changes
Ultimate Trend Rate 4.50%
Year Reaching Ultimate Trend 2029OPSRP Administrative Expenses $6.6 million No Change
Percentage of Money Match retirements for allocation between employers
General: 50%P&F: 15%
General: 40%P&F: 10%
Treatment of Negative Tier 1 Rate Guarantee Reserve Treat as asset Do not treat as an
asset
* Based on Mercer’s capital market assumptions, we propose an assumption in the 7.5%-8.0% range. The SIS capital market assumptions without an active management component are 0.2%-0.3% above Mercer assumptions.
** Proposed to be 20-25 basis points greater than regular investment return assumption.

30G:\WP\Retire\2011\Opersu\Board mtgs\0729 InvestReturn and demographic assumptions.pptMercer
Decisions Summary of Proposed Assumptions– Demographic Assumptions
Current Assumption Proposed Assumption
Mortality Generational TablesModest decreases to
rates for most groups to reflect recent experience
Turnover Combined T1/T2/OPSRP Separate T1/T2 & OPSRP
Merit Salary Increases0% for 2009 and 2010,
then slightly higher ultimate rates
Slightly lower ultimate rates; No select rates
RHIA Participation RateHealthy: 42.5%Disabled: 20%
Healthy: 48%Disabled: 20%
RHIPA Participation Rate 9% 13%
Proposed assumptions also include all other demographic changes shown in the body of this presentation and its appendix

31G:\WP\Retire\2011\Opersu\Board mtgs\0729 InvestReturn and demographic assumptions.pptMercer
Decisions Requested Board Action
In order to complete the December 31, 2010 actuarial valuation on schedule, we request the following actions from the Board– Selection of regular account investment return assumption– Approval of variable account investment return assumption 25
basis point greater than the regular account return assumption– Selection of method for treatment of Rate Guarantee Reserve– Approval of all proposed assumptions in this presentation
(including appendix) for demographic and economic assumptions not specifically listed above

32G:\WP\Retire\2011\Opersu\Board mtgs\0729 InvestReturn and demographic assumptions.pptMercer
Next Steps
May Board Meeting– Experience Study – Methods and Economic Assumptions
July Board Meeting– Experience Study – Investment Return and Demographic
Assumptions– Board Adoption of Methods and Assumptions for 12/31/2010 and
12/31/2011 Actuarial Valuations
September Board Meeting– 12/31/2010 system-wide actuarial valuation results– Actuarial equivalence factors for 2012-2013
October– 12/31/2010 individual employer reports

Appendix

34G:\WP\Retire\2011\Opersu\Board mtgs\0729 InvestReturn and demographic assumptions.pptMercer
Mercer has prepared this report exclusively for the Oregon PERS Board; Mercer is not responsible for reliance upon this report by any other party. The only purposes of this report are to present results of Mercer’s review of experience under the plan. This report may not be used for any other purpose; Mercer is not responsible for the consequences of any unauthorized use.
Decisions about benefit changes, granting new benefits, investment policy, funding policy, benefit security and/or benefit- related issues should not be made on the basis of this report, but only after careful consideration of alternative economic, financial, demographic and societal factors, including financial scenarios that assume future sustained investment losses.
The Oregon Investment Council (OIC) is solely responsible for selecting the plan’s investment policies, asset allocations and individual investments of the Oregon PERS program. Mercer’s actuaries have not provided any investment advice to Oregon PERS or OIC.
A valuation report is only a snapshot of a Plan’s estimated financial condition at a particular point in time; it does not predict the Plan’s future financial condition or its ability to pay benefits in the future and does not provide any guarantee of future financial soundness of the Plan. Over time, a plan’s total cost will depend on a number of factors, including the amount of benefits the plan pays, the number of people paid benefits, the period of time over which benefits are paid, plan expenses and the amount earned on any assets invested to pay benefits. These amounts and other variables are uncertain and unknowable at the valuation date
Because modeling all aspects of a situation is not possible or practical, we may use summary information, estimates, or simplifications of calculations to facilitate the modeling of future events in an efficient and cost-effective manner. We may also exclude factors or data that are immaterial in our judgment. Use of such simplifying techniques does not, in our judgment, affect the reasonableness of valuation results for the plan.
To prepare the valuation report, actuarial assumptions, as described in the actuarial valuation report as of December 31, 2009, for Oregon PERS are used in a forward looking financial and demographic model to select a single scenario from a wide range of possibilities; the results based on that single scenario are included in the valuation. The future is uncertain and the plan’s actual experience will differ from those assumptions; these differences may be significant or material because these results are very sensitive to the assumptions made and, in some cases, to the interaction between the assumptions.
Appendix Important Notices

35G:\WP\Retire\2011\Opersu\Board mtgs\0729 InvestReturn and demographic assumptions.pptMercer
Different assumptions or scenarios within the range of possibilities may also be reasonable and results based on those assumptions would be different. As a result of the uncertainty inherent in a forward looking projection over a very long period of time, no one projection is uniquely “correct” and many alternative projections of the future could also be regarded as reasonable. Two different actuaries could, quite reasonably, arrive at different results based on the same data and different views of the future. A "sensitivity analysis" shows the degree to which results would be different if you substitute alternative assumptions within the range of possibilities for those utilized in this report. This report displays a limited-scope sensitivity analysis of alternate actuarial assumptions, as detailed in this report. At Oregon PERS request, Mercer is available to perform additional sensitivity analyses.
Actuarial assumptions may also be changed from one valuation to the next because of changes in mandated requirements, plan experience, changes in expectations about the future and other factors. A change in assumptions is not an indication that prior assumptions were unreasonable when made.
The calculation of actuarial liabilities for valuation purposes is based on a current estimate of future benefit payments. The calculation includes a computation of the "present value" of those estimated future benefit payments using an assumed discount rate; the higher the discount rate assumption, the lower the estimated liability will be. For purposes of estimating the liabilities (future and accrued) in this report, Oregon PERS selected an assumption based on the expected long term rate of return on plan investments. Using a lower discount rate assumption, such as a rate based on long-term bond yields, could substantially increase the estimated present value of future and accrued liabilities.
Because valuations are a snapshot in time and are based on estimates and assumptions that are not precise and will differ from actual experience, contribution calculations are inherently imprecise. There is no uniquely “correct” level of contributions for the coming plan year.
Valuations do not affect the ultimate cost of the Plan. Plan funding occurs over time. Contributions not made this year, for whatever reason, including errors, remain the responsibility of the Plan sponsor and can be made in later years. If the contribution levels over a period of years are lower or higher than necessary, it is normal and expected practice for adjustments to be made to future contribution levels to take account of this with a view to funding the plan over time.
Appendix Important Notices

36G:\WP\Retire\2011\Opersu\Board mtgs\0729 InvestReturn and demographic assumptions.pptMercer
Appendix Important Notices
Data, computer coding and mathematical errors are possible in the preparation of a valuation involving complex computer programming and thousands of calculations and data inputs. Errors in a valuation discovered after its preparation may be corrected by amendment to the valuation or in a subsequent year’s valuation.
To prepare this report, Mercer has used and relied on member and financial data submitted by the Oregon Public Employees Retirement System as summarized herein and in the December 31, 2009 actuarial valuation report and on investment return information as published by Oregon PERS and Oregon Investment Council (OIC). Oregon PERS is responsible for ensuring that such participant data provides an accurate description of all persons who are participants under the terms of the plan or otherwise entitled to benefits as of December 31, 2009, that is sufficiently comprehensive and accurate for the purposes of this report. Although Mercer has reviewed the data in accordance with Actuarial Standards of Practice No. 23, Mercer has not verified or audited any of the data or information provided.
Mercer has also used and relied on the plan provisions described in Oregon Revised Statutes Sections 238 and 238A and legislative amendments supplied by Oregon PERS. A summary of the plan provisions valued is presented in our report. Oregon PERS is solely responsible for the accuracy, validity and comprehensiveness of this information. If the data or plan provisions supplied are not accurate and complete the valuation results may differ significantly from the results that would be obtained with accurate and complete information; this may require a later revision of this report. Moreover, plan documents may be susceptible to different interpretations, each of which could be reasonable, and that the different interpretations could lead to different valuation results.
Assumptions used are based on the last experience study, as adopted by the Board on July 16, 2009, and alternative proposed assumptions as described herein. The Board is responsible for selecting the plan’s funding policy, actuarial valuation methods, asset valuation methods and assumptions. This valuation is based on assumptions, plan provisions, methods and other parameters so prescribed and as summarized in this report. Oregon PERS is solely responsible for communicating to Mercer any changes required thereto.

37G:\WP\Retire\2011\Opersu\Board mtgs\0729 InvestReturn and demographic assumptions.pptMercer
Appendix Important Notices
Professional Qualifications
We are available to answer any questions on the material in this report or to provide explanations or further details as appropriate. The undersigned credentialed actuaries meet the Qualification Standards of the American Academy of Actuaries to render the actuarial opinion contained in this report. We are not aware of any direct or material indirect financial interest or relationship, including investments or other services that could create a conflict of interest, that would impair the objectivity of our work. We are available to answer any questions on the material contained in the report, or to provide explanations or further details as may be appropriate.
The information contained in this document is not intended by Mercer to be used, and it cannot be used, for the purpose of avoiding penalties under the Internal Revenue Code that may be imposed on the taxpayer.
Matthew R. Larrabee, FSA, EA, MAAA Enrolled Actuary No. 08-6154
Date Scott D. Preppernau, FSA, EA, MAAA Enrolled Actuary No. 08-7360
Date
Mercer (US), Inc.111 SW Columbia Street, Suite 500Portland, OR 97201-5839503 273 5900
July 29, 2011 July 29, 2011

38G:\WP\Retire\2011\Opersu\Board mtgs\0729 InvestReturn and demographic assumptions.pptMercer
Appendix Disabled Retiree Mortality
Since the current rates fall within the aggregate confidence intervals, we are not proposing any changes to the disabled mortality tables.
Current Assumption
Proposed Assumption
Exposures Actual Deaths
Expected Deaths A/E Ratio
Expected Deaths A/E Ratio
Male 8,373 334 347 96% 347 96%
Female 9,124 290 308 94% 308 94%
Disabled Retired Mortality Aggregate Confidence Intervals and Rates
0%
1%
2%
3%
4%
5%
Male Female
Mor
talit
y R
ate
50% Confidence Interval 90% Confidence Interval Current Assumption Proposed Assumption

39G:\WP\Retire\2011\Opersu\Board mtgs\0729 InvestReturn and demographic assumptions.pptMercer
Appendix Pre-Retirement Mortality
Pre-retirement mortality is set based on a percentage of the healthy retiree mortality rates. The “Current Assumption” is analyzed by applying the current percentage to the new proposed healthy retiree mortality rates.
The analysis is based on experience for active employees under age 70.
The target Actual/Expected ratio is 100%.
Although Police & Fire Male and School District Male and Other Female are above 100%, the current rates fall within the aggregate confidence interval and thus no changes are proposed for those three groups. For the other groups, we are proposing a change to the percentage applied to the new proposed healthy retiree mortality rates.
Current Assumption
Proposed Assumption
ExposuresActual Deaths
Expected Deaths A/E Ratio
Expected Deaths A/E Ratio
School District Male 94,506 133 129 103% 129 103%
Other General Service Male 201,964 392 346 113% 392 100%
Police & Fire Male 49,294 59 53 111% 53 111%
School District Female 270,852 218 187 117% 224 97%
Other Female 300,557 295 267 110% 267 110%

40G:\WP\Retire\2011\Opersu\Board mtgs\0729 InvestReturn and demographic assumptions.pptMercer
Appendix Pre-Retirement Mortality (continued)
Changes are proposed to Other GS Male and School District Female so the aggregate rate falls within the confidence interval.
Note that the aggregate mortality rate is a function of both the group mortality rates and the ages of the members in the group.
Pre-Retirement Mortality Aggregate Confidence Intervals and Rates
0.00%
0.05%
0.10%
0.15%
0.20%
0.25%
School District Male Other General ServiceMale
Police & Fire Male School District Female Other Female
Mor
talit
y R
ate
50% Confidence Interval 90% Confidence Interval Current Assumption Proposed Assumption

41G:\WP\Retire\2011\Opersu\Board mtgs\0729 InvestReturn and demographic assumptions.pptMercer
Appendix Retirement Rates – General Service with less than 15 Years of Service
Retirement decisions by members with less than 15 years of service are likely to be heavily influenced by the availability of resources other than PERS benefits, including:
–Social Security–Prior employment–Spousal benefits–Savings
Tier 1/Tier 2 - Other General Service Members with less than 15 Years of Service
0%
5%
10%
15%
20%
25%
55 56 57 58 59 60 61 62 63 64 65 66 67 68 69
Age
Ret
irem
ent R
ates
50% Confidence Interval 90% Confidence Interval
Current T1/T2 Assumption Proposed T1/T2 Assumption

42G:\WP\Retire\2011\Opersu\Board mtgs\0729 InvestReturn and demographic assumptions.pptMercer
Appendix Retirement Rates – General Service with less than 15 Years of Service
Retirement decisions by members with less than 15 years of service are likely to be heavily influenced by the availability of resources other than PERS benefits, including:
–Social Security–Prior employment–Spousal benefits–Savings
Tier 1/Tier 2 - School DistrictsMembers with less than 15 Years of Service
0%
5%
10%
15%
20%
55 56 57 58 59 60 61 62 63 64 65 66 67 68 69Age
Ret
irem
ent R
ates
50% Confidence Interval 90% Confidence IntervalCurrent T1/T2 Assumption Proposed T1/T2 Assumption

43G:\WP\Retire\2011\Opersu\Board mtgs\0729 InvestReturn and demographic assumptions.pptMercer
Appendix Retirement Rates – General Service with less than 15 Years of Service
Retirement decisions by members with less than 15 years of service are likely to be heavily influenced by the availability of resources other than PERS benefits, including:
–Social Security–Prior employment–Spousal benefits–Savings
OPSRP - General ServiceMembers with less than 15 Years of Service
0%
5%
10%
15%
20%
55 56 57 58 59 60 61 62 63 64 65 66 67 68 69
Age
Ret
irem
ent R
ate
50% Confidence Interval 90% Confidence IntervalProposed T1/T2 Combined Assumption Current OPSRP AssumptionProposed OPSRP Assumption

44G:\WP\Retire\2011\Opersu\Board mtgs\0729 InvestReturn and demographic assumptions.pptMercer
Appendix Retirement Rates – General Service with 15 to 29 Years of Service
Retirement decisions by members with 15 to 29 years of service are likely to be influenced by the structure of PERS benefits as well as the availability of other resources, including:
–Social Security–Prior employment–Spousal benefits–Savings
Tier 1/Tier 2 - Other General ServiceMembers with 15 - 29 Years of Service
0%
5%
10%
15%
20%
25%
30%
35%
55 56 57 58 59 60 61 62 63 64 65 66 67 68 69
Age
Ret
irem
ent R
ates
50% Confidence Interval 90% Confidence IntervalCurrent T1/T2 Assumption Proposed T1/T2 Assumption

45G:\WP\Retire\2011\Opersu\Board mtgs\0729 InvestReturn and demographic assumptions.pptMercer
Appendix Retirement Rates – General Service with 15 to 29 Years of Service
Retirement decisions by members with 15 to 29 years of service are likely to be influenced by the structure of PERS benefits as well as the availability of other resources, including:
–Social Security–Prior employment–Spousal benefits–Savings
Charts for additional groups can be found in the appendix.
Tier 1/Tier 2 - School DistrictsMembers with 15 - 29 Years of Service
0%
10%
20%
30%
40%
55 56 57 58 59 60 61 62 63 64 65 66 67 68 69
Age
Ret
irem
ent R
ates
50% Confidence Interval 90% Confidence IntervalCurrent T1/T2 Assumption Proposed T1/T2 Assumption

46G:\WP\Retire\2011\Opersu\Board mtgs\0729 InvestReturn and demographic assumptions.pptMercer
Appendix Retirement Rates – General Service with 15 to 29 Years of Service
Retirement decisions by members with 15 to 29 years of service are likely to be influenced by the structure of PERS benefits as well as the availability of other resources, including:
–Social Security–Prior employment–Spousal benefits–Savings
OPSRP - General ServiceMembers with 15 - 29 Years of Service
0%
5%
10%
15%
20%
25%
30%
35%
40%
45%
55 56 57 58 59 60 61 62 63 64 65 66 67 68 69
Age
Ret
irem
ent R
ate
50% Confidence Interval 90% Confidence IntervalProposed T1/T2 Combined Assumption Current OPSRP AssumptionProposed OPSRP Assumption

47G:\WP\Retire\2011\Opersu\Board mtgs\0729 InvestReturn and demographic assumptions.pptMercer
Appendix Retirement Rates – General Service with 30 or More Years of Service
Retirement decisions by members with 30 or more years of service are heavily influenced by the immediate unreduced benefits available through PERS (after age 58 for OPSRP benefits)
There has been a continued decline in retirements among this group at the earliest ages, possibly due to the decline in average replacement income from Money Match benefits over the last 7 years
General Service/School DistrictMembers with 30+ Years of Service
0%
10%
20%
30%
40%
50%
50 51 52 53 54 55 56 57 58 59 60 61 62 63 64 65 66 67 68 69
Age
Ret
irem
ent R
ates
50% Confidence Interval 90% Confidence IntervalCurrent T1/T2 Assumption Proposed T1/T2 Assumption

48G:\WP\Retire\2011\Opersu\Board mtgs\0729 InvestReturn and demographic assumptions.pptMercer
Appendix Retirement Rates – General Service with 30 or More Years of Service
Retirement decisions by members with 30 or more years of service are heavily influenced by the immediate unreduced benefits available through PERS (after age 58 for OPSRP benefits)
There has been a continued decline in retirements among this group at the earliest ages, possibly due to the decline in average replacement income from Money Match benefits over the last 7 years
General ServiceMembers with 30+ Years of Service
0%
10%
20%
30%
40%
50%
50 51 52 53 54 55 56 57 58 59 60 61 62 63 64 65 66 67 68 69
Age
Ret
irem
ent R
ates
50% Confidence Interval 90% Confidence Interval Current T1/T2 Assumption
Proposed T1/T2 Assumption Current OPSRP Assumption Proposed OPSRP Assumption

49G:\WP\Retire\2011\Opersu\Board mtgs\0729 InvestReturn and demographic assumptions.pptMercer
Appendix Retirement Rates – Police & Fire with less than 13 Years of Service
Retirement decisions by members with less than 13 years of service are likely to be heavily influenced by the availability of resources other than PERS benefits, including:
–Social Security–Prior employment–Spousal benefits–Savings
Police & Fire MembersMembers with less than 13 Years of Service
0%
5%
10%
15%
20%
50 51 52 53 54 55 56 57 58 59 60 61 62 63 64
Age
Ret
irem
ent R
ates
50% Confidence Interval 90% Confidence Interval Current T1/T2 Assumption
Proposed T1/T2 Assumption Current OPSRP Assumption Proposed OPSRP Assumption

50G:\WP\Retire\2011\Opersu\Board mtgs\0729 InvestReturn and demographic assumptions.pptMercer
Appendix Retirement Rates – Police & Fire with 13 to 24 Years of Service
Retirement rates for members with more than 12 years of service are influenced by the availability of unreduced benefits
Since there is no reliable OPSRP data, OPSRP assumptions are based on the Tier 1 / Tier 2 patterns and judgments about how the different normal retirement age will affect retirement rates
Police & Fire MembersMembers with 13 to 24 Years of Service
0%
5%
10%
15%
20%
25%
30%
35%
50 51 52 53 54 55 56 57 58 59 60 61 62 63 64
Age
Ret
irem
ent R
ates
50% Confidence Interval 90% Confidence Interval Proposed T1/T2 Assumption
Current OPSRP Assumption Proposed OPSRP Assumption Current T1/T2 Assumption
51G:\WP\Retire\2011\Opersu\Board mtgs\0729 InvestReturn and demographic assumptions.pptMercer
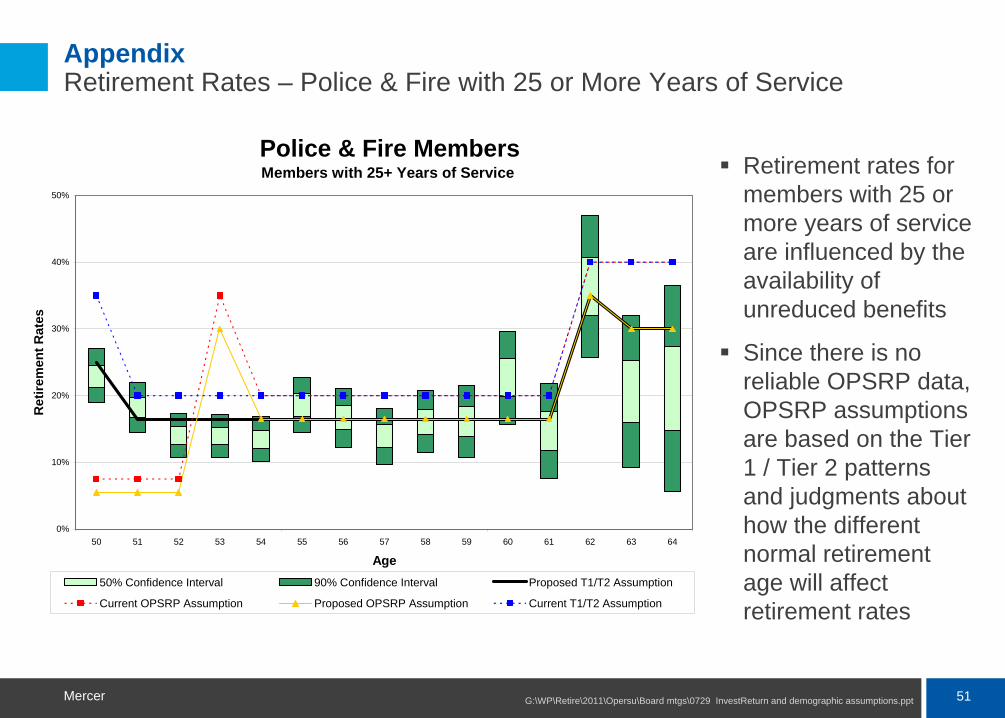
Appendix Retirement Rates – Police & Fire with 25 or More Years of Service
Retirement rates for members with 25 or more years of service are influenced by the availability of unreduced benefits
Since there is no reliable OPSRP data, OPSRP assumptions are based on the Tier 1 / Tier 2 patterns and judgments about how the different normal retirement age will affect retirement rates
Police & Fire MembersMembers with 25+ Years of Service
0%
10%
20%
30%
40%
50%
50 51 52 53 54 55 56 57 58 59 60 61 62 63 64
Age
Ret
irem
ent R
ates
50% Confidence Interval 90% Confidence Interval Proposed T1/T2 Assumption
Current OPSRP Assumption Proposed OPSRP Assumption Current T1/T2 Assumption

52G:\WP\Retire\2011\Opersu\Board mtgs\0729 InvestReturn and demographic assumptions.pptMercer
Appendix Merit Salary Increases
For the merit scale, we studied experience from 2003 through 2010.
Other General Service
-1.0%
0.0%
1.0%
2.0%
3.0%
4.0%
5.0%
0 5 10 15 20 25 30
Years of Service
Mer
it In
crea
se
0.990000
1.000000
1.010000
1.020000
1.030000
1.040000
1.050000
50% Confidence Interval 90% Confidence IntervalCurrent Assumption Proposed Assumption
Merit increases are added to inflation and general productivity to arrive at a total salary increase assumption
Current assumptions set for three groups:
School Districts (SD)
Other General Service (Other GS)
Police & Fire (PF)
Proposed changes:
Decrease Merit Scale modestly for School Districts members with more than 10 years of service.
Decrease Merit Scale for Other GS slightly
Maintain Merit Scale for PF

53G:\WP\Retire\2011\Opersu\Board mtgs\0729 InvestReturn and demographic assumptions.pptMercer
Appendix Merit Salary Increases
For the merit scale, we studied experience from 2003 through 2010.
Merit increases are added to inflation and general productivity to arrive at a total salary increase assumption
Current assumptions set for three groups:
School Districts (SD)
Other General Service (Other GS)
Police & Fire (PF)
Proposed changes:
Decrease Merit Scale modestly for School Districts members with more than 10 years of service.
Decrease Merit Scale for Other GS slightly
Maintain Merit Scale for PF
Police & Fire
0.0%
1.0%
2.0%
3.0%
4.0%
5.0%
6.0%
7.0%
0 5 10 15 20 25 30
Years of Service
Mer
it In
crea
se
1.00
1.01
1.02
1.03
1.04
1.05
1.06
1.07
50% Confidence Interval 90% Confidence IntervalCurrent Assumption Proposed Assumption

54G:\WP\Retire\2011\Opersu\Board mtgs\0729 InvestReturn and demographic assumptions.pptMercer
Appendix Ultimate Termination Rates
Structure changes:– Separate rates for
T1/T2 and OPSRP– Consolidate rates for
SLGRP and Independent Employers
Adjustments to ultimate termination rates:
– Modest upward adjustment for School Districts – OPSRP
– Modest decrease for Other General Service – T1/T2
– Minor changes for Other General Service – OPSRP
– No changes for Police & Fire
Other General Service Male - OPSRPBased on Tier 1/Tier 2 and OPSRP experience
0%
5%
10%
15%
20%
25 30 35 40 45 50Age
Term
inat
ion
Rat
e
50% Confidence Interval 90% Confidence Interval
Current Assumption Proposed Assumption

55G:\WP\Retire\2011\Opersu\Board mtgs\0729 InvestReturn and demographic assumptions.pptMercer
Appendix Ultimate Termination Rates
Structure changes:– Separate rates for
T1/T2 and OPSRP– Consolidate rates for
SLGRP and Independent Employers
Adjustments to ultimate termination rates:
– Modest upward adjustment for School Districts – OPSRP
– Modest decrease for Other General Service – T1/T2
– Minor changes for Other General Service – OPSRP
– No changes for Police & Fire
Other General Service Male - Tier 1/Tier 2Based on Tier 1/Tier 2 experience only
0%
5%
10%
15%
20%
25 30 35 40 45 50Age
Term
inat
ion
Rat
e
50% Confidence Interval 90% Confidence Interval
Current Assumption Proposed Assumption

56G:\WP\Retire\2011\Opersu\Board mtgs\0729 InvestReturn and demographic assumptions.pptMercer
Appendix Ultimate Termination Rates
Structure changes:– Separate rates for
T1/T2 and OPSRP– Consolidate rates for
SLGRP and Independent Employers
Adjustments to ultimate termination rates:
– Modest upward adjustment for School Districts – OPSRP
– Modest decrease for Other General Service – T1/T2
– Minor changes for Other General Service – OPSRP
– No changes for Police & Fire
Other General Service Female - OPSRPBased on Tier 1/Tier 2 and OPSRP experience
0%
5%
10%
15%
20%
25%
25 30 35 40 45 50Age
Term
inat
ion
Rat
e
50% Confidence Interval 90% Confidence Invterval
Current Assumption Proposed Assumption

57G:\WP\Retire\2011\Opersu\Board mtgs\0729 InvestReturn and demographic assumptions.pptMercer
Appendix Ultimate Termination Rates
Structure changes:– Separate rates for
T1/T2 and OPSRP– Consolidate rates for
SLGRP and Independent Employers
Adjustments to ultimate termination rates:
– Modest upward adjustment for School Districts – OPSRP
– Modest decrease for Other General Service – T1/T2
– Minor changes for Other General Service – OPSRP
– No changes for Police & Fire
Other General Service Female - Tier 1/Tier 2Based on Tier 1/Tier 2 experience only
0%
5%
10%
15%
20%
25%
25 30 35 40 45 50Age
Term
inat
ion
Rat
e
50% Confidence Interval 90% Confidence Invterval
Current Assumption Proposed Assumption

58G:\WP\Retire\2011\Opersu\Board mtgs\0729 InvestReturn and demographic assumptions.pptMercer
Appendix Ultimate Termination Rates
Structure changes:– Separate rates for
T1/T2 and OPSRP– Consolidate rates for
SLGRP and Independent Employers
Adjustments to ultimate termination rates:
– Modest upward adjustment for School Districts – OPSRP
– Modest decrease for Other General Service – T1/T2
– Minor changes for Other General Service – OPSRP
– No changes for Police & Fire
Police & Fire - OPSRPBased on Tier 1/Tier 2 and OPSRP experience
0%
2%
4%
6%
8%
10%
25 30 35 40 45Age
Term
inat
ion
Rat
e
50% Confidence Interval 90% Confidence Interval Current Assumption

59G:\WP\Retire\2011\Opersu\Board mtgs\0729 InvestReturn and demographic assumptions.pptMercer
Appendix Ultimate Termination Rates
Structure changes:– Separate rates for
T1/T2 and OPSRP– Consolidate rates for
SLGRP and Independent Employers
Adjustments to ultimate termination rates:
– Modest upward adjustment for School Districts – OPSRP
– Modest decrease for Other General Service – T1/T2
– Minor changes for Other General Service – OPSRP
– No changes for Police & Fire
Police & Fire - Tier 1/Tier 2Based on Tier 1/Tier 2 experience only
0%
2%
4%
6%
8%
10%
25 30 35 40 45Age
Term
inat
ion
Rat
e
50% Confidence Interval 90% Confidence Interval Current Assumption

60G:\WP\Retire\2011\Opersu\Board mtgs\0729 InvestReturn and demographic assumptions.pptMercer
Appendix Duty Disability Incidence
Duty disability rates remained fairly level since the prior study.
We propose no changes to the current duty disability incidence tables
Duty Disability Incidence Aggregate Confidence Intervals and Rates
0.00%
0.01%
0.02%
0.03%
0.04%
0.05%
0.06%
0.07%
Police & Fire General Service
Dis
abili
ty R
ate
50% Confidence Interval 90% Confidence Interval Current Assumption Proposed Assumption

61G:\WP\Retire\2011\Opersu\Board mtgs\0729 InvestReturn and demographic assumptions.pptMercer
Appendix Ordinary Disability Incidence
Ordinary disability rates have declined slightly since the prior study.
We propose adjusting the current table slightly so the assumption falls within the aggregate confidence interval.
Ordinary Disability Incidence Aggregate Confidence Intervals and Rates
0.00%
0.05%
0.10%
0.15%
0.20%
0.25%
All Members
Dis
abili
ty R
ate
50% Confidence Interval 90% Confidence Interval Current Assumption Proposed Assumption

62G:\WP\Retire\2011\Opersu\Board mtgs\0729 InvestReturn and demographic assumptions.pptMercer
Appendix Unused Sick Leave
Based on recent experience, we propose adjusting rates for State General Service, School District, State and Local Police & Fire, and Dormants.
For members that have the ability to include unused sick leave, the final average pay calculated without sick leave is increased by the percentages shown at left to model the effects of sick leave
Unused Sick Leave
0.00%
1.00%
2.00%
3.00%
4.00%
5.00%
6.00%
7.00%
8.00%
9.00%
10.00%
State GeneralService Male
State GeneralServiceFemale
School DistrictMale
School DistrictFemale
Local GeneralService Male
Local GeneralServiceFemale
State Police &Fire
Local Police &Fire
Dormants
Per
cent
age
Incr
ease
in F
inal
Ave
rage
Sal
ary
50% Confidence Interval 90% Confidence Interval Current Assumption Proposed Assumption

63G:\WP\Retire\2011\Opersu\Board mtgs\0729 InvestReturn and demographic assumptions.pptMercer
Appendix Lump Sum Option at Retirement
When a member elects a partial lump sum at retirement, they receive their account balance and a reduced annuity.
When a member elects a total lump sum at retirement, they receive two times their account balance.
In both cases, the member gives up the value of the COLA on the portion of the annuity they receive in a lump sum.
If the member’s benefit is determined under Full Formula, electing a total lump sum may cause the member to give up a substantial portion of the benefit.
Consequently, the assumption phases out the total lump sum assumption over a period of time reflecting the transition from Money Match to Full Formula benefits.
Lump Sum Election Count
Actual %
Current Assumption
Partial LS 843 5.76% 6.00%
Total LS 912 6.23% 6.25%*
Annuity 12,881 88.01% 87.75%*
Total Elections 13,639 100% 100%
Lump Sum Election Proposed Assumption
Partial LS No Change
Total LSNo Change
5% for 2011, declining by 0.5% per year until reaching 0.0%
* “Total” lump sum elections are assumed to decrease 0.5% per year. Amount shown is the average over the experience study period.

64G:\WP\Retire\2011\Opersu\Board mtgs\0729 InvestReturn and demographic assumptions.pptMercer
Appendix Purchase of Credited Service
For Money Match retirements, purchasing service credits is roughly cost neutral to the system, so no assumption is proposed for Money Match benefits.
We propose increasing the assumed percentage of non-Money Match retirees that elect to purchase service to 60%.
Count
Number Electing to Purchase
Service Actual %Current
AssumptionMoney Match Retirements 3,174 1,149 36% 0%
Non-Money Match Retirements 2,403 1,413 59% 55%

65G:\WP\Retire\2011\Opersu\Board mtgs\0729 InvestReturn and demographic assumptions.pptMercer
Appendix Probability of Account Withdrawal
This assumption represents the probability that a dormant member will withdraw his/her account balance from the plan before retirement.
We propose eliminating this assumption going forward, that is assuming no one withdraws their account balance.
Police and Fire
0%
10%
20%
30%
40%
50%
25-29 30-34 35-39 40-44 45-49 50-54
Age band
Prob
abili
ty o
f Acc
t With
draw
al
50% Confidence Interval 90% Confidence IntervalCurrent Assumption Proposed Assumption

66G:\WP\Retire\2011\Opersu\Board mtgs\0729 InvestReturn and demographic assumptions.pptMercer
Actuarial Methods Treatment of Negative Rate Guarantee Reserve
The value of assets used to determine employer contribution rates has historically excluded any assets in the Contingency, Capital Preservation, or Rate Guarantee Reserves
The Rate Guarantee Reserve (RGR) is currently negative (a deficit reserve), as it was for the 12/31/2008 and 12/31/2009 valuations
– As confirmed by the Board in May 2009, the reserve was excluded in these valuations while it has been in deficit
In essence, the negative reserve was treated as an asset
All else equal, treating a negative reserve as an asset increases valuation assets used for contribution rate calculations
If the negative reserve is larger than the sum of the positive reserves, then valuation assets would exceed the fair value of assets using this approach
We think it is prudent for the Board to periodically evaluate this issue and either reconfirm the current approach or specify any desired changes
Valuation Assets = Market Assets - Reserves
From May 2011 PERS Board presentation.

67G:\WP\Retire\2011\Opersu\Board mtgs\0729 InvestReturn and demographic assumptions.pptMercer
Actuarial Methods Treatment of Negative Rate Guarantee Reserve (continued)
Rationale for treating a negative reserve as an asset:– We understand that if a deficit persists for five years, action is required to
restore the reserve– If a separate mechanism is established to restore the reserve, then treating
the negative reserve as an asset would avoid double-charging for the associated deficit
Rationale for not adjusting valuation assets for a negative reserve (i.e., not treating it as an asset):
– It avoids the potential for valuation assets to exceed fair value of assets– The reserve restoration mechanism is not currently well-defined– Not adjusting for a negative reserve would increase calculated contribution
rates. The higher rate so calculated could be a good budgeting proxy for the reserve restoration cost once a restoration mechanism is defined.
As a policy choice, the Board could distinguish between treatment when the RGR is negative in isolation versus when sum of RGR, Contingency, and Capital Preservation is negative
From May 2011 PERS Board presentation.

68G:\WP\Retire\2011\Opersu\Board mtgs\0729 InvestReturn and demographic assumptions.pptMercer
Actuarial Methods Treatment of Negative Rate Guarantee Reserve (continued)
When reserves are positive, their treatment is straightforward– Reserves are excluded from valuation assets for rate-setting calculations as
they are earmarked for a specific purpose different than general benefit payments
When a reserve (such as the Rate Guarantee Reserve) is negative, there are various possible ways to treat the negative reserve
– Alternative #1 (current method): Always treat the negative reserve as an asset
If the negative reserve is large, the net sum of all reserves could be negative, leading to valuation assets exceeding fair market value
– Alternative #2: Never treat the negative reserve as an asset
The entire negative Rate Guarantee Reserve is essentially treated as part of the Unfunded Actuarial Liability (UAL) with this approach
– Alternative #3: Never allow the sum of the excluded reserves to be negative
With this approach, valuation assets will never exceed reported market value. A negative Rate Guarantee Reserve would be treated as an asset only to the extent it does not exceed, for example, the amount of the Contingency Reserve.
From May 2011 PERS Board presentation.

www.mercer.com