mercateo study 2017 — in partnership with leipzig ......the maverick-buying rate was analysed to...
TRANSCRIPT
1
Mercateo Study 2017 — in partnership with Leipzig University of Applied Sciences (HTWK Leipzig)
In partnership with
Prof. Dr. Holger Müller | Elisabetta Bollini, M.Sc.-Psych.
Indirect purchasing in focus: between savings potential and future opportunities
Study: Indirect purchasing in focus
I Foreword
Twenty years ago and amid great euphoria, companies jumped at the chance to enable their specialist departments to record their requirements electronically — almost intuitively — with the aid of electronic catalogues. Later, configurators and controlled enquiry processes for non-catalogued products and services also became available. This laid the foundations for the entire “purchase-to-pay” process to be managed completely electronically. At the time, it seemed only a matter of a few years before this instrument would be deployed on a large scale. The reality is somewhat different — although electronic support for the indirect procurement process has become established in large companies, the adoption rate of these systems remains low in many smaller and medium-sized enterprises. An important reason for this is the difficulty of “proving” the economic efficiency of a digital process within a company. Certainly, the advantages of a stable, documented, controlled process and, above all, one that supplies the requisitioner in the shortest possible time are obvious —
taken together, these are all variables that are difficult to measure in the context of a return on investment. However, this is often precisely what is required in companies; a “business case” must be presented. Such assessments are generally impeded by the lack of a robust data set. As a result, it is necessary to use the company's internal assumptions, which are often disputable — due to the high number of processes, just one minute more or less in one process often has a significant impact on the overall result. We hope that this study will provide decision-makers with a reliable data set upon which to base their evaluations.
Prof. Dr. Holger Müller Professor of Supply Chain Management Faculty of Economics HTWK Leipzig
Sour
ce: H
TW
K L
eipz
ig
At Mercateo, it is clear that efficient processes have a large impact on the success of purchasing activities. This study makes it possible to compare, in unprecedented depth, the process steps in indirect procurement, their respective process costs and the associated potential for optimisation within the company. For us, its results have confirmed the following: small and medium-sized companies in particular can realise great potential through increased use of digital procurement. However, many companies do not consider themselves adequately prepared for the challenges of digitisation.
From many years of industry experience, we know that the will of the decision-makers to digitise procurement processes is not lacking. To date, the right tools have been missing — too complicated, too expensive, too cumbersome. In our experience, small and medium-sized companies need solutions that support the flexible and lightweight manner in which they collaborate with their business partners. And as the study shows, even
large companies with their digital procurement processes have failed to reduce their maverick-buying rate to less than ten per cent. They obviously still require greater flexibility and easier access to indirect procurement processes. With our Mercateo Unite networking platform, we aim to create a digital space to enable flexible cooperation between purchasing and retail. We are seeing more and more buyers, suppliers and manufacturers connecting via this neutral infrastructure and processing their transactions digitally. The aim, precisely in the light of this study, is that the value-adding structures that make Europe strong will become even more powerful through digitisation.
This study should further encourage decision-makers to see digitisation in procurement as an opportunity for their company.
Dr. Bernd Schönwälder Director Market & Sales Mercateo AG
Study: Indirect purchasing in focus4
This study is devoted to an analysis of the purchasing processes that are used by German companies to meet their indirect demand, in order to precisely identify the most important cost drivers and qualitative parameters, down to the individual process steps. A quantitative study was conducted, in which 110 companies were asked to provide key performance indicators relating to indirect purchasing as well as information about the processes used in their company. The analysis shows that, although a uniform purchasing process without digitisation increases the quality of the process, it also leads to higher process costs as a result of its formalisation. Only a digital process significantly reduces costs while simultaneously increasing process quality. The strongest effects are felt by the requisitioner and the purchasing department.
Nevertheless, the potential offered by digitisation is not being exploited by the majority of small and medium-sized companies. In addition to cost reduction, digitisation proves to be a strategic decision to establish companies in a forward-looking manner. Regardless of which process they use, companies tend to use a relatively high number of vendors in the area of indirect purchasing. Digitisation can be the key success factor here to support automatic, collaborative networks and better management of diverse content.
Keywords: Indirect purchasing, process costs, electronic procurement, digitisation, network, B2B
Abstract

5
I Foreword ........................................................................................................................................................................... 2
II Introduction ................................................................................................................................................................... 6
1 The Study ......................................................................................................................................................................... 7
1.1 Objectives and approach ................................................................................................................................... 8
1.1.1 Investigated forms of the purchase-to-pay process ............................................................... 9
1.1.2 Purchase-to-pay process: phases and cost calculation ........................................................ 10
1.1.3 Qualitative effects: example of “maverick buying” ................................................................. 11
1.2 Information about the survey and population .......................................................................................... 12
2 Results ............................................................................................................................................................................. 15
2.1 Key performance indicators of indirect purchasing ................................................................................. 16
2.2 Prevailing purchase-to-pay processes in the companies .................................................................... 18
2.3 Time requirements for the purchase-to-pay process ........................................................................... 19
2.4 Costs of the procurement process .............................................................................................................. 20
2.5 Effects on maverick buying ........................................................................................................................... 22
2.6 Preparation for digitisation in the company ............................................................................................ 23
3 Conclusion ..................................................................................................................................................................... 25
Table of contents
Study: Indirect purchasing in focus6
II Introduction
The scale of the process costs that arise between purchase requisition and payment has been adequately investigated. What is missing, however, is a robust and detailed analysis of how these costs are distributed among the individual process steps on the one hand, and on the other, of the effects of different process scenarios — from non-formalised to digital purchasing — that can be demonstrated at this level. These questions are the focus of this study.
This investigation focuses on the purchasing processes used by German companies to meet their indirect demand. This study defines “indirect demand” as materials and services that are not directly integrated into the core value-creation process. Indirect purchasing usually generates a high number of ordering processes with a relatively low order value. Often these are low-quality, “typical” C items, however they may also include quite exotic items, for which it is difficult for the company to efficiently organise sustainable supplier relationships.
Electronic processing of the indirect demand is closely linked to catalogues — however, it cannot be reduced solely to this. Only some of these requirements can be catalogued — for the rest, individual methods of electronic recording must usually be implemented for the respective requisitioner. These may be, for example, complex configurators or enquiry processes with approved suppliers. No matter how this is done, the prerequisite for a fully digital process is that requisitioners are able to independently register their demand electronically.
When interpreting these results, it should be noted that a web-based survey was carried out. On the one hand, “indirect demand” in manufacturing companies is relatively clear.
However for other companies, such as service providers, utilities or retailers, there is room for interpretation. The term was defined in the survey, but it cannot be ruled out that the participants may have differing interpretations of what is classified as indirect purchasing. On the other hand, the depth of detail provided in such surveys is limited; for example, the term "digital process" and the sub-step "requirements enquiry" are used generically without the actual type (catalogue, configurator, enquiry tool, etc.) being recorded.
The first part of the study focuses on its objectives and the approach taken to the investigation. In addition, the survey is described in further detail and its population delineated. The results are presented in the second chapter. The main findings are then summarised in the third chapter.
This study shows for the first time the exact costs for all phases of the procurement process, thus enabling specific savings potential to be documented and realised through digitisation.
Summary:

7
1 The Study 1

Study: Indirect purchasing in focus8
1.1 Objectives and approach
The overall goal of the study was to investigate the demonstrable effects in terms of cost and process quality in processes that are unified and automated to varying degrees. In addition, the cost drivers in the indirect procurement process were analysed in order to identify corresponding savings potential.
To achieve these aims, it was necessary to obtain a detailed picture of the procurement process within the respective company. In order to reliably determine the process costs, the following aspects were analysed in particular:
→ The type of purchasing process used by the company to meet its indirect demand
→ The process characteristics (employee wage costs, number of orders, proportion of processes with tenders and the number of invoices)
→ A temporal estimation of the phases within the company's distinct form of the purchase-to-pay process
The maverick-buying rate was analysed to reflect the impact on process quality. These results were also applied in a similar manner to other aspects, such as transparency, compliance, throughput times and requisitioner satisfaction.
In addition, further key performance indicators for indirect purchasing were obtained, in order to allow participants to classify their own companies.
Finally, an attempt was made to assess how well prepared the surveyed companies considered themselves to be for the requirements of progressive digitisation.
The study analyses the costs in the procurement process, both as a whole and at the level of the individual steps, by analysing the most important key indicators for the respective process as well as the time required for each step within the process.
Summary:
9
1.1.1 Investigated forms of the purchase-to-pay process
Practical experience shows that almost every company uses an individualised form of the purchase-to-pay process. It was therefore necessary to categorise these processes for the study. Three ideal process scenarios were defined:
1. Non-uniform purchasing process: A clear, company-wide definition of the purchasing process for indirect demand either does not exist or it is not “lived”. In addition, there is consequently no continuous electronic support.
2. Uniform, manual purchasing process: The purchasing process for indirect demand is defined throughout the company and is “lived”. There is, however, a lack of electronic support, with the result that it is largely processed manually (filling out forms, writing e-mails, etc.).
3. Digital purchasing process: The purchasing process for indirect demand is defined throughout the company and is “lived”. It is (largely) supported electronically. In particular, requisitioners can order from electronic catalogues.
The companies were required to choose the particular process type that best corresponds to their own specific procedures. It is important to take into account here that, in terms of their “uniform, manual” and “digital” indirect purchasing processes, it can be presumed that all companies also have extensive “non-uniform” or “non-digital” exceptions.
The organisation of procurement processes and the state of digitisation were analysed with regard to the prevailing purchase-to-pay process within the company.
Summary:
Study: Indirect purchasing in focus10
1.1.2 Purchase-to-pay process: Phases and cost calculation
In order to examine the processes in detail and identify costs, the following standard process was based on five main phases, which in turn were divided into various sub-steps:
1. Purchase requisition and approval → Needs assessment → Stock check → Needs enquiry → Needs-related examination → Needs approval
2. Supplier selection (only if supplier does not yet exist)
→ Supplier search → Request creation → Offer vetting → Offer negotiation → Supplier selection → Master-data maintenance
3. Order → Create purchase order → Send purchase order → Order confirmation → Order monitoring
4. Goods receipt → Goods acceptance → Goods checks → Record goods → Store/distribute goods
5. Invoice and payment → Invoice receipt → Invoice registration → Invoice check → Invoice posting → Payment release → Payment
This structure was imposed on the survey participants regardless of their chosen process, in order to record the corresponding duration of the individual steps. If a particular step was not relevant or was omitted due to automation, its duration was recorded as "0".
To determine the process costs, the individual times were multiplied by the company-specific hourly rates of the respective workers. In each case, it was taken into account that only a certain proportion of the orders are entered into the main phase “2. Supplier selection”, and that the number of invoices (“5. Invoice and payment”) may differ from the number of orders.
The procurement process was divided into its most important individual steps and clustered in five macro-phases.
Summary:
11
1.1.3 Qualitative effects: Example of “maverick1 buying”
The maverick-buying rate was selected as an indication of the qualitative impact, as this rate is an indicator of inefficient purchasing processes (and therefore many other process parameters). Maverick buying is broadly defined as the unplanned, "wild" procurement of company resources by employees or specialist departments, which bypasses the purchasing department. On the one hand, a high maverick-buying rate leads to a lack of transparency and possibly also compliance problems. On the other hand, the triggers for maverick buying are often long process-flow times or the requisitioner's dissatisfaction with the “supply situation”. These qualitative effects are ultimately reflected in cost factors; however companies are usually not able to quantify these precisely.
No clear delineation of maverick buying exists either in the relevant literature nor in practice, as it is highly dependent on the individual organisational structure and process design. Examples of maverick buying include:
→ Placement of individual orders despite existing framework contracts (e.g. also by the purchasing department itself)
→ Specialist departments buying their own resources despite centralised purchasing
→ The billing of costs as incurred by the requisitioner.
In this study, the maverick-buying rate is defined as the “proportion of invoices received without a corresponding order reference”.
The extent of the “maverick buying” phenomenon is an important indicator of inefficient purchasing processes.
Summary:
1 “Maverick” could equally be translated as “lone wolf”. The term “maverick” refers to a person who demonstrates independent thinking and acting. The phenomenon was named after the politician and cattle breeder Samuel A. Maverick (1803 – 1870), who did not brand his calves due to his concerns for animal welfare. As a consequence, it was possible for others to take ownership of his cattle — for example, if they escaped from the pasture — by marking them with their own brand.
Study: Indirect purchasing in focus12
1.2 Information about the survey and population
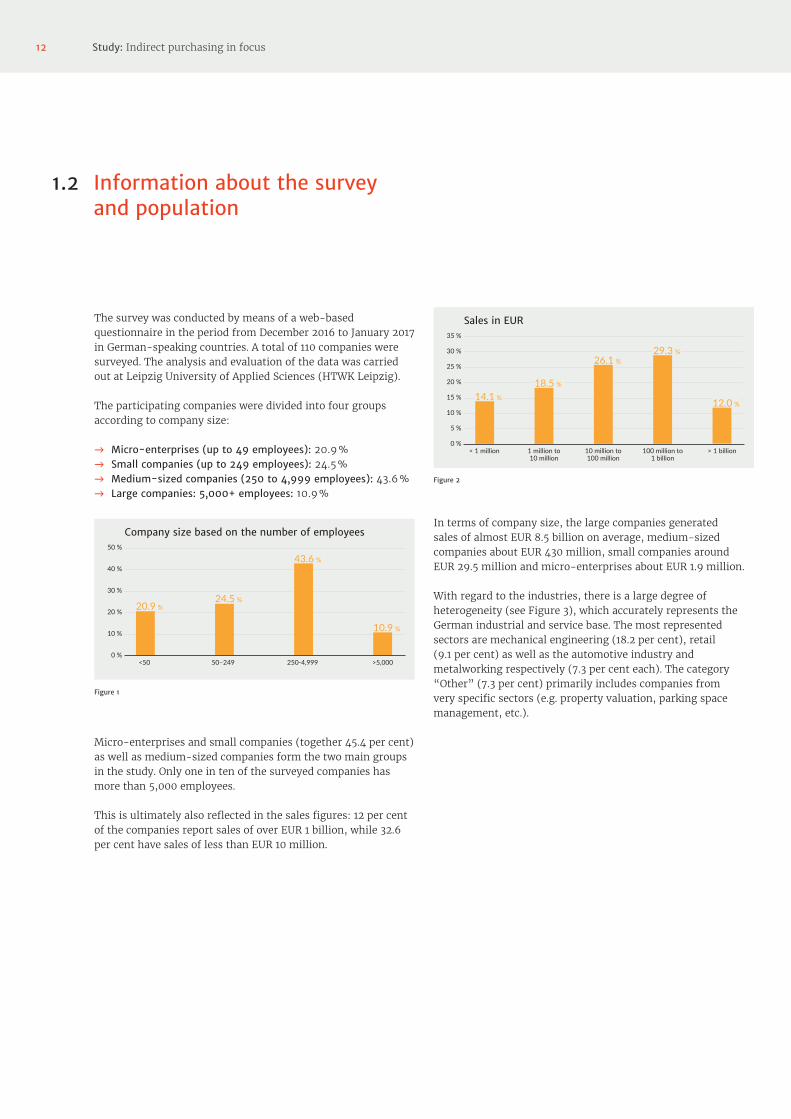
The survey was conducted by means of a web-based questionnaire in the period from December 2016 to January 2017 in German-speaking countries. A total of 110 companies were surveyed. The analysis and evaluation of the data was carried out at Leipzig University of Applied Sciences (HTWK Leipzig).
The participating companies were divided into four groups according to company size:
→ Micro-enterprises (up to 49 employees): 20.9 % → Small companies (up to 249 employees): 24.5 % → Medium-sized companies (250 to 4,999 employees): 43.6 % → Large companies: 5,000+ employees: 10.9 %
Company size based on the number of employees
0 %
20 %
10 %
30 %
40 %
50 %
<50
20.9 % 24.5 %
43.6 %
10.9 %
50–249 250-4,999 >5,000
Figure 1
Micro-enterprises and small companies (together 45.4 per cent) as well as medium-sized companies form the two main groups in the study. Only one in ten of the surveyed companies has more than 5,000 employees.
This is ultimately also reflected in the sales figures: 12 per cent of the companies report sales of over EUR 1 billion, while 32.6 per cent have sales of less than EUR 10 million.
Sales in EUR
0 %
10 %
5 %
15 %
20 %
25 %
35 %
30 %
< 1 million
14.1 %18.5 %
26.1 % 29.3 %
12.0 %
1 million to 10 million
10 million to 100 million
100 million to 1 billion
> 1 billion
Figure 2
In terms of company size, the large companies generated sales of almost EUR 8.5 billion on average, medium-sized companies about EUR 430 million, small companies around EUR 29.5 million and micro-enterprises about EUR 1.9 million.
With regard to the industries, there is a large degree of heterogeneity (see Figure 3), which accurately represents the German industrial and service base. The most represented sectors are mechanical engineering (18.2 per cent), retail (9.1 per cent) as well as the automotive industry and metalworking respectively (7.3 per cent each). The category “Other” (7.3 per cent) primarily includes companies from very specific sectors (e.g. property valuation, parking space management, etc.).

13
Figure 3: Subdivision by industry
→ Not final
Subdivision by industry
0 % 5 % 10 % 15 % 20 %
Pharma, health
Associations, clubs and other organisations
Self-employed, freelancers and other services
Transport, logistics
Public administration, defence
Metalworking
Mechanical and plant engineering
Aviation and aerospace
Food
Agriculture and construction
Information, communications and media
Hotel industry, gastronomy
Household goods, cosmetics
Retail
Large-scale plants, building construction
Health and social services
Finance and insurance
Energy and water supply, including wastewater and waste disposal
Electrical engineering
Computers, high-tech
Chemicals
Clothing industry
Construction, building materials
Automotive industry
Other
2.7 %
0.9 %
3.6 %
2.7 %
3.6 %
0.9 %
0.9 %
2.7 %
2.7 %
0.0 %
1.8 %
1.8 %
1.8 %
1.8 %
1.8 %
7.3 %
7.3 %
1.8 %
5.5 %
4.5 %
0.9 %
9.1 %
6.4 %
18.2 %
7.3 %No entry 1.8 %
Figure 3

Study: Indirect purchasing in focus14
2

15
2 The results2
Study: Indirect purchasing in focus16
2.1 Key performance indicators of indirect purchasing
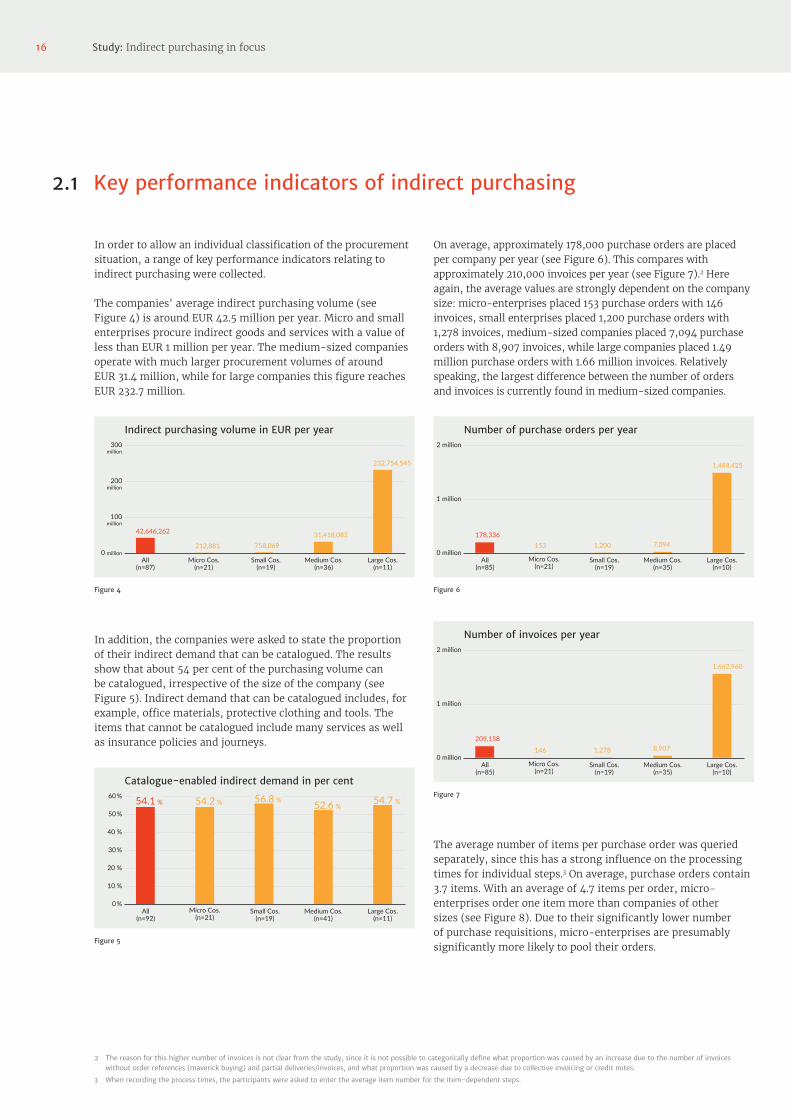
In order to allow an individual classification of the procurement situation, a range of key performance indicators relating to indirect purchasing were collected.
The companies' average indirect purchasing volume (see Figure 4) is around EUR 42.5 million per year. Micro and small enterprises procure indirect goods and services with a value of less than EUR 1 million per year. The medium-sized companies operate with much larger procurement volumes of around EUR 31.4 million, while for large companies this figure reaches EUR 232.7 million.
Indirect purchasing volume in EUR per year
0 million
200 million
100 million
300 million
All (n=87)
31,418,083
Medium Cos. (n=36)
Micro Cos. (n=21)
Large Cos. (n=11)
Figure 4
42,646,262
212,881 758,069
232,754,545
Small Cos. (n=19)
In addition, the companies were asked to state the proportion of their indirect demand that can be catalogued. The results show that about 54 per cent of the purchasing volume can be catalogued, irrespective of the size of the company (see Figure 5). Indirect demand that can be catalogued includes, for example, office materials, protective clothing and tools. The items that cannot be catalogued include many services as well as insurance policies and journeys.
Catalogue-enabled indirect demand in per cent
0 %
20 %
10 %
30 %
40 %
50 %
60 %
All (n=92)
54.1 % 54.2 % 56.8 % 52.6 % 54.7 %
Micro Cos. (n=21)
Small Cos. (n=19)
Medium Cos. (n=41)
Large Cos. (n=11)
Figure 5
On average, approximately 178,000 purchase orders are placed per company per year (see Figure 6). This compares with approximately 210,000 invoices per year (see Figure 7).2 Here again, the average values are strongly dependent on the company size: micro-enterprises placed 153 purchase orders with 146 invoices, small enterprises placed 1,200 purchase orders with 1,278 invoices, medium-sized companies placed 7,094 purchase orders with 8,907 invoices, while large companies placed 1.49 million purchase orders with 1.66 million invoices. Relatively speaking, the largest difference between the number of orders and invoices is currently found in medium-sized companies.
Number of purchase orders per year
0 million
1 million
2 million
All (n=85)
Micro Cos. (n=21)
Small Cos. (n=19)
Medium Cos. (n=35)
Large Cos. (n=10)
Figure 6
1,488,425
7,0941,200153178,336
Number of invoices per year
0 million
1 million
2 million
All (n=85)
Micro Cos. (n=21)
Small Cos. (n=19)
Medium Cos. (n=35)
Large Cos. (n=10)
1,662,960
8,9071,278146
209,158
Figure 7
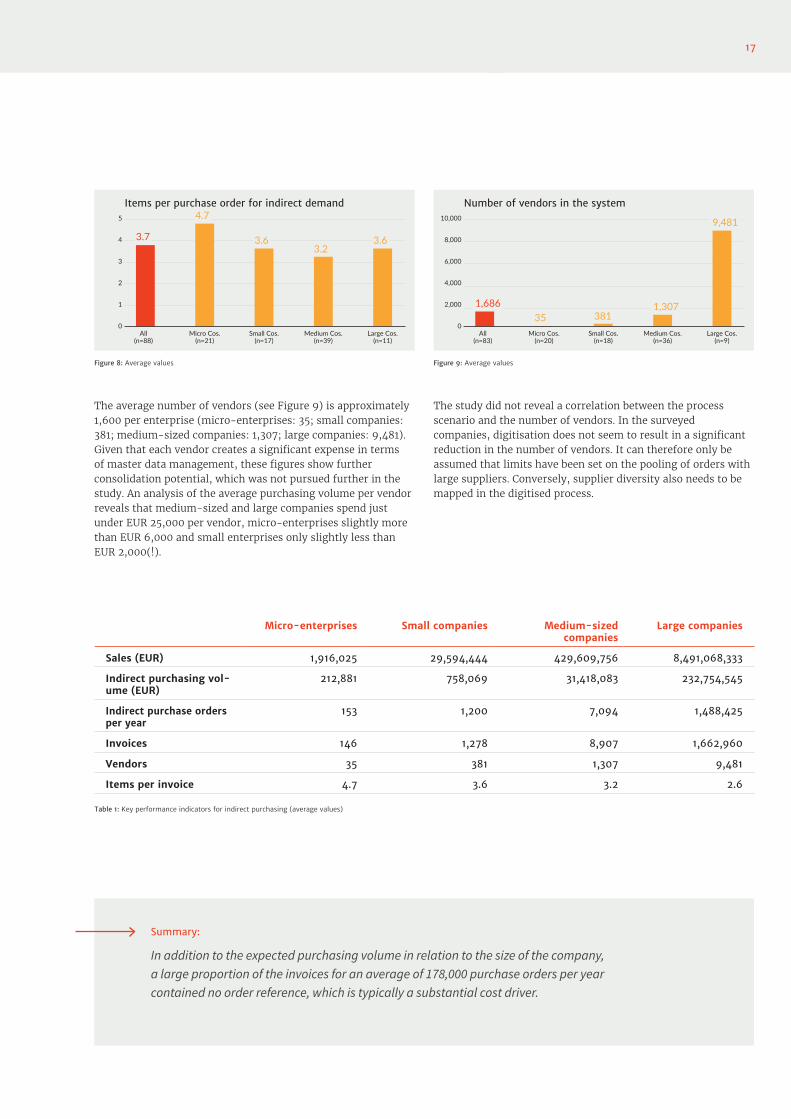
The average number of items per purchase order was queried separately, since this has a strong influence on the processing times for individual steps.3 On average, purchase orders contain 3.7 items. With an average of 4.7 items per order, micro-enterprises order one item more than companies of other sizes (see Figure 8). Due to their significantly lower number of purchase requisitions, micro-enterprises are presumably significantly more likely to pool their orders.
2 The reason for this higher number of invoices is not clear from the study, since it is not possible to categorically define what proportion was caused by an increase due to the number of invoices without order references (maverick buying) and partial deliveries/invoices, and what proportion was caused by a decrease due to collective invoicing or credit notes.
3 When recording the process times, the participants were asked to enter the average item number for the item-dependent steps.
17
Micro-enterprises Small companies Medium-sized companies
Large companies
Sales (EUR) 1,916,025 29,594,444 429,609,756 8,491,068,333
Indirect purchasing vol-ume (EUR)
212,881 758,069 31,418,083 232,754,545
Indirect purchase orders per year
153 1,200 7,094 1,488,425
Invoices 146 1,278 8,907 1,662,960
Vendors 35 381 1,307 9,481
Items per invoice 4.7 3.6 3.2 2.6
Table 1: Key performance indicators for indirect purchasing (average values)
Items per purchase order for indirect demand
0
2
1
3
5
All (n=88)
Micro Cos. (n=21)
Small Cos. (n=17)
Medium Cos. (n=39)
Large Cos. (n=11)
Figure 8: Average values
4 3.7
4.7
3.63.2
3.6
The average number of vendors (see Figure 9) is approximately 1,600 per enterprise (micro-enterprises: 35; small companies: 381; medium-sized companies: 1,307; large companies: 9,481). Given that each vendor creates a significant expense in terms of master data management, these figures show further consolidation potential, which was not pursued further in the study. An analysis of the average purchasing volume per vendor reveals that medium-sized and large companies spend just under EUR 25,000 per vendor, micro-enterprises slightly more than EUR 6,000 and small enterprises only slightly less than EUR 2,000(!).
Number of vendors in the system
0
4,000
2,000
6,000
8,000
10,000
All (n=83)
Micro Cos. (n=20)
Small Cos. (n=18)
Medium Cos. (n=36)
Large Cos. (n=9)
Figure 9: Average values
1,68635 381
1,307
9,481
The study did not reveal a correlation between the process scenario and the number of vendors. In the surveyed companies, digitisation does not seem to result in a significant reduction in the number of vendors. It can therefore only be assumed that limits have been set on the pooling of orders with large suppliers. Conversely, supplier diversity also needs to be mapped in the digitised process.
In addition to the expected purchasing volume in relation to the size of the company, a large proportion of the invoices for an average of 178,000 purchase orders per year contained no order reference, which is typically a substantial cost driver.
Summary:

Study: Indirect purchasing in focus18
2.2 Prevailing purchase-to-pay processes in the companies
The study also asked about the nature of the company's procurement process, in order to understand how organisations primarily order to meet their indirect demand (see Figure 10).
0 %
40 %
20 %
60 %
80 %
Non-uniform purchasing process
52.38 %
28.57 %
Uniform, manual purchasing process
Digital purchasing process
Figure 10
23.53 %
15.38 %
58.82 %
46.15 %
27.27 %28.57 %
38.45 %
72.73 %
17.65 %
Micro Cos. (n=21) Small Cos. (n=17) Medium Cos. (n=39) Large Cos. (n=11)
Purchasing process used by company size
The majority of the surveyed companies reported a uniform, manual purchasing process (42 per cent). 34.1 per cent of respondents said they use a digital process, while just under a quarter (23.9 per cent) did not have a uniform purchasing process. A more detailed analysis of the data again reveals a “digital divide” between small and large companies. Approximately 73 per cent of large companies process orders predominantly electronically. The majority of medium-sized companies have established uniform ordering processes, either electronically (38.5 per cent) or at least manually (46.2 per cent). Conversely, more than 60 per cent of medium-sized companies rely on ordering processes that are not supported electronically. Scarcely one in five micro-enterprises or small companies uses a digital process; more than half of micro-enterprises have no uniform process at all.
The majority of small and medium-sized companies do not have an electronic purchasing process — 15 per cent of small and medium-sized companies, over 20 per cent of small companies and 50 per cent of micro-enterprises have no uniform purchasing process whatsoever.
Summary:
19
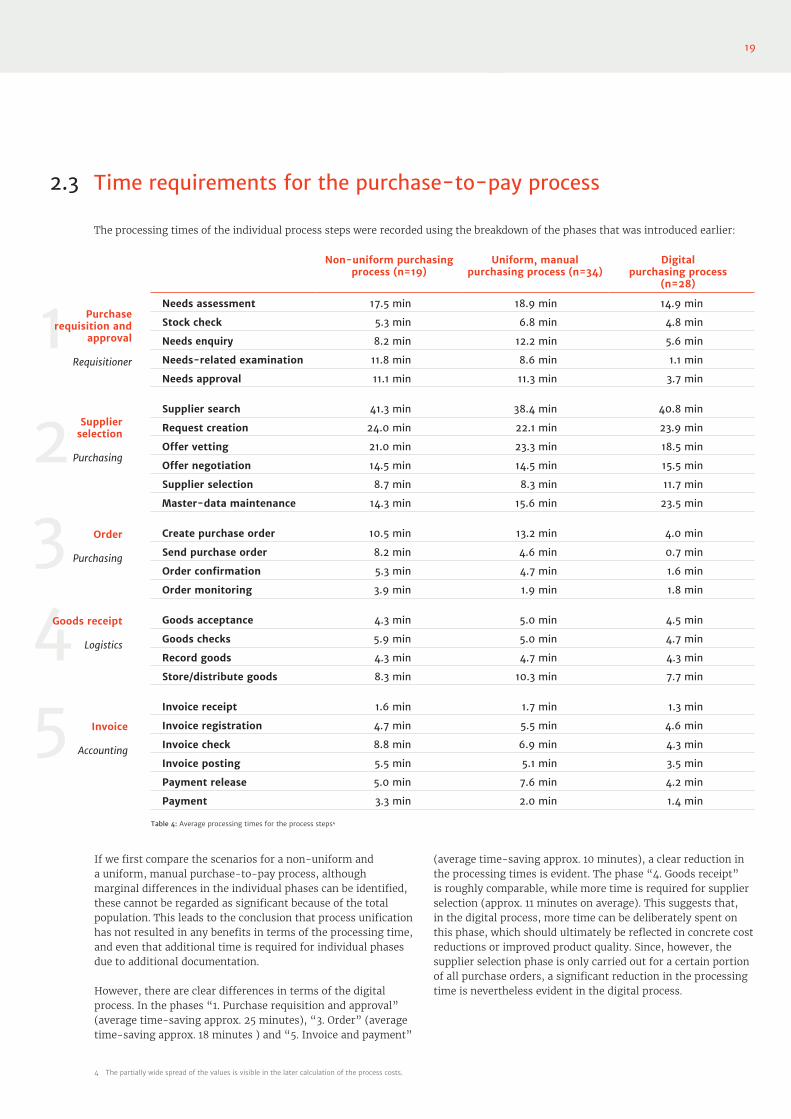
2.3 Time requirements for the purchase-to-pay process
(average time-saving approx. 10 minutes), a clear reduction in the processing times is evident. The phase “4. Goods receipt” is roughly comparable, while more time is required for supplier selection (approx. 11 minutes on average). This suggests that, in the digital process, more time can be deliberately spent on this phase, which should ultimately be reflected in concrete cost reductions or improved product quality. Since, however, the supplier selection phase is only carried out for a certain portion of all purchase orders, a significant reduction in the processing time is nevertheless evident in the digital process.
Non-uniform purchasing process (n=19)
Uniform, manual purchasing process (n=34)
Digital purchasing process
(n=28)
Needs assessment 17.5 min 18.9 min 14.9 min
Stock check 5.3 min 6.8 min 4.8 min
Needs enquiry 8.2 min 12.2 min 5.6 min
Needs-related examination 11.8 min 8.6 min 1.1 min
Needs approval 11.1 min 11.3 min 3.7 min
Supplier search 41.3 min 38.4 min 40.8 min
Request creation 24.0 min 22.1 min 23.9 min
Offer vetting 21.0 min 23.3 min 18.5 min
Offer negotiation 14.5 min 14.5 min 15.5 min
Supplier selection 8.7 min 8.3 min 11.7 min
Master-data maintenance 14.3 min 15.6 min 23.5 min
Create purchase order 10.5 min 13.2 min 4.0 min
Send purchase order 8.2 min 4.6 min 0.7 min
Order confirmation 5.3 min 4.7 min 1.6 min
Order monitoring 3.9 min 1.9 min 1.8 min
Goods acceptance 4.3 min 5.0 min 4.5 min
Goods checks 5.9 min 5.0 min 4.7 min
Record goods 4.3 min 4.7 min 4.3 min
Store/distribute goods 8.3 min 10.3 min 7.7 min
Invoice receipt 1.6 min 1.7 min 1.3 min
Invoice registration 4.7 min 5.5 min 4.6 min
Invoice check 8.8 min 6.9 min 4.3 min
Invoice posting 5.5 min 5.1 min 3.5 min
Payment release 5.0 min 7.6 min 4.2 min
Payment 3.3 min 2.0 min 1.4 min
2 Supplier selection
Purchasing
3 Order
Purchasing
4Goods receipt
Logistics
5 Invoice
Accounting
1 Purchase requisition and
approval
Requisitioner
Table 4: Average processing times for the process steps4
If we first compare the scenarios for a non-uniform and a uniform, manual purchase-to-pay process, although marginal differences in the individual phases can be identified, these cannot be regarded as significant because of the total population. This leads to the conclusion that process unification has not resulted in any benefits in terms of the processing time, and even that additional time is required for individual phases due to additional documentation.
However, there are clear differences in terms of the digital process. In the phases “1. Purchase requisition and approval” (average time-saving approx. 25 minutes), “3. Order” (average time-saving approx. 18 minutes ) and “5. Invoice and payment”
The processing times of the individual process steps were recorded using the breakdown of the phases that was introduced earlier:
4 The partially wide spread of the values is visible in the later calculation of the process costs.
Study: Indirect purchasing in focus20
2.4 Costs of the procurement process
In order to calculate the process costs based on the processing times for the individual process steps, the costs of the respective processors were requested. The average hourly rate of the requisitioners involved in the procurement process during phase “1. Requisition order and approval”, is EUR 40.35. In the second and third phase (supplier selection and the order), the average hourly rate for an employee in the purchasing department is EUR 47.45. The hourly rates of the logistics specialists involved in the procurement process in the fourth phase is EUR 31.33 on average. An accountant, as the fifth and final participant in the procurement process, has an average hourly rate of EUR 41.01 when processing the invoice and final payment.
In addition, it was taken into account that only a certain percentage of the orders required a supplier selection phase (on average 20 per cent for the participants) and more invoices than orders had to be processed (on average around 10 per cent more). However, the process costs were determined individually for each company and the average values were then calculated.6
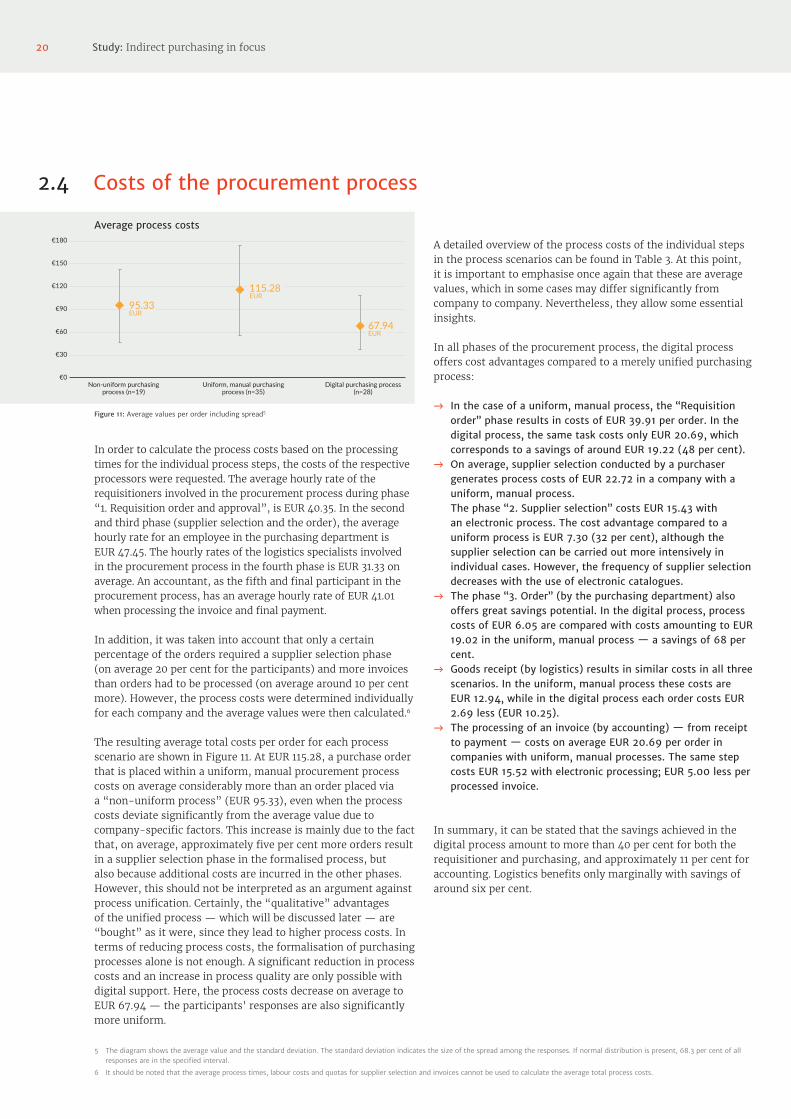
The resulting average total costs per order for each process scenario are shown in Figure 11. At EUR 115.28, a purchase order that is placed within a uniform, manual procurement process costs on average considerably more than an order placed via a “non-uniform process” (EUR 95.33), even when the process costs deviate significantly from the average value due to company-specific factors. This increase is mainly due to the fact that, on average, approximately five per cent more orders result in a supplier selection phase in the formalised process, but also because additional costs are incurred in the other phases. However, this should not be interpreted as an argument against process unification. Certainly, the “qualitative” advantages of the unified process — which will be discussed later — are “bought” as it were, since they lead to higher process costs. In terms of reducing process costs, the formalisation of purchasing processes alone is not enough. A significant reduction in process costs and an increase in process quality are only possible with digital support. Here, the process costs decrease on average to EUR 67.94 — the participants' responses are also significantly more uniform.
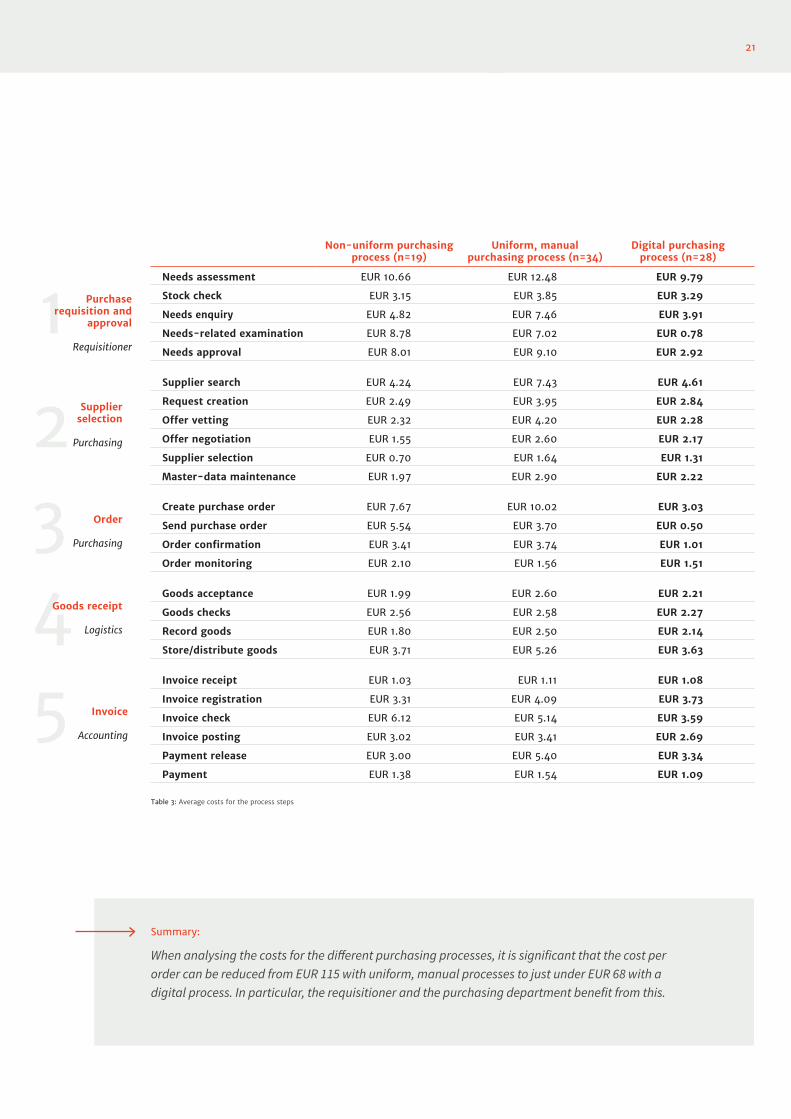
A detailed overview of the process costs of the individual steps in the process scenarios can be found in Table 3. At this point, it is important to emphasise once again that these are average values, which in some cases may differ significantly from company to company. Nevertheless, they allow some essential insights.
In all phases of the procurement process, the digital process offers cost advantages compared to a merely unified purchasing process:
→ In the case of a uniform, manual process, the “Requisition order” phase results in costs of EUR 39.91 per order. In the digital process, the same task costs only EUR 20.69, which corresponds to a savings of around EUR 19.22 (48 per cent).
→ On average, supplier selection conducted by a purchaser generates process costs of EUR 22.72 in a company with a uniform, manual process. The phase “2. Supplier selection” costs EUR 15.43 with an electronic process. The cost advantage compared to a uniform process is EUR 7.30 (32 per cent), although the supplier selection can be carried out more intensively in individual cases. However, the frequency of supplier selection decreases with the use of electronic catalogues.
→ The phase “3. Order” (by the purchasing department) also offers great savings potential. In the digital process, process costs of EUR 6.05 are compared with costs amounting to EUR 19.02 in the uniform, manual process — a savings of 68 per cent.
→ Goods receipt (by logistics) results in similar costs in all three scenarios. In the uniform, manual process these costs are EUR 12.94, while in the digital process each order costs EUR 2.69 less (EUR 10.25).
→ The processing of an invoice (by accounting) — from receipt to payment — costs on average EUR 20.69 per order in companies with uniform, manual processes. The same step costs EUR 15.52 with electronic processing; EUR 5.00 less per processed invoice.
In summary, it can be stated that the savings achieved in the digital process amount to more than 40 per cent for both the requisitioner and purchasing, and approximately 11 per cent for accounting. Logistics benefits only marginally with savings of around six per cent.
5 The diagram shows the average value and the standard deviation. The standard deviation indicates the size of the spread among the responses. If normal distribution is present, 68.3 per cent of all responses are in the specified interval.
6 It should be noted that the average process times, labour costs and quotas for supplier selection and invoices cannot be used to calculate the average total process costs.
Average process costs
€60
€30
€90
€120
€150
€180
€0Non-uniform purchasing
process (n=19)Uniform, manual purchasing
process (n=35)Digital purchasing process
(n=28)
Figure 11: Average values per order including spread5
95.33EUR
115.28EUR
67.94EUR
21
Non-uniform purchasing process (n=19)
Uniform, manual purchasing process (n=34)
Digital purchasing process (n=28)
Needs assessment EUR 10.66 EUR 12.48 EUR 9.79
Stock check EUR 3.15 EUR 3.85 EUR 3.29
Needs enquiry EUR 4.82 EUR 7.46 EUR 3.91
Needs-related examination EUR 8.78 EUR 7.02 EUR 0.78
Needs approval EUR 8.01 EUR 9.10 EUR 2.92
Supplier search EUR 4.24 EUR 7.43 EUR 4.61
Request creation EUR 2.49 EUR 3.95 EUR 2.84
Offer vetting EUR 2.32 EUR 4.20 EUR 2.28
Offer negotiation EUR 1.55 EUR 2.60 EUR 2.17
Supplier selection EUR 0.70 EUR 1.64 EUR 1.31
Master-data maintenance EUR 1.97 EUR 2.90 EUR 2.22
Create purchase order EUR 7.67 EUR 10.02 EUR 3.03
Send purchase order EUR 5.54 EUR 3.70 EUR 0.50
Order confirmation EUR 3.41 EUR 3.74 EUR 1.01
Order monitoring EUR 2.10 EUR 1.56 EUR 1.51
Goods acceptance EUR 1.99 EUR 2.60 EUR 2.21
Goods checks EUR 2.56 EUR 2.58 EUR 2.27
Record goods EUR 1.80 EUR 2.50 EUR 2.14
Store/distribute goods EUR 3.71 EUR 5.26 EUR 3.63
Invoice receipt EUR 1.03 EUR 1.11 EUR 1.08
Invoice registration EUR 3.31 EUR 4.09 EUR 3.73
Invoice check EUR 6.12 EUR 5.14 EUR 3.59
Invoice posting EUR 3.02 EUR 3.41 EUR 2.69
Payment release EUR 3.00 EUR 5.40 EUR 3.34
Payment EUR 1.38 EUR 1.54 EUR 1.09
Table 3: Average costs for the process steps
When analysing the costs for the different purchasing processes, it is significant that the cost per order can be reduced from EUR 115 with uniform, manual processes to just under EUR 68 with a digital process. In particular, the requisitioner and the purchasing department benefit from this.
Summary:
2 Supplier selection
Purchasing
3 Order
Purchasing
4Goods receipt
Logistics
5 Invoice
Accounting
1 Purchase requisition and
approval
Requisitioner

Study: Indirect purchasing in focus22
2.5 Effects on maverick buying
As previously described, the extent of maverick buying was identified as an indicator of changes in process quality. For this purpose, the maverick-buying rate was defined as the “proportion of invoices received without a corresponding order reference”. The maverick-buying rate is 25.6 per cent as an overall average. This value means that there is currently no purchase order for every fourth invoice that is generated as part of the procurement process for indirect materials. It must, however, be taken into account that services such as auditing and tax advice as well as telecommunications, vehicle fleet management and similar are often indirectly purchased items for which there is no order reference.
There are clear differences depending on the procurement process used (see Figure 12).
Maverick-buying rate in the three process types
0 %
20 %
10 %
30 %
40 %
50 %
60 %
All (n=91)
Non-uniform purchasing process (n=21)
Digital purchasing process (n=29)
Figure 12
25.6 % 26.5 %
Uniform, manual pur-chasing process (n=37)
20.3 %30.9 %
If no uniform process is used, the rate (as expected) is the highest at 30.9 per cent — in addition, the spread here is the largest. With a uniform, manual process, it is 26.5 per cent. The lowest rate of 20.3 per cent is found where a digital process is in use. The rate does not fall even further in the “digital process” scenario due in part to the fact that this process can be used in most cases but not for everything. Here again, reference is made to the fact that, on average, approximately 54 per cent of the indirect purchasing volume can be catalogued. A more detailed analysis of how the maverick-buying rate is affected by an exclusively electronic process is not possible on the basis of this study.
A formalisation of the procurement process demonstrably increases the process quality. In the case of the analysis of process costs and process quality, the “no uniform process” and “uniform, manual process” scenarios cannot be uniformly described as the better option. Here, the specific costs and process improvements need to be analysed in a company-specific manner. It is clear, however, that the digital process produces better results than these two scenarios in terms of process costs as well as process quality.
The electronic process surpasses the other two scenarios in terms of process quality.
Summary:

23
2.6 Preparation for digitisation in the company
"Digitisation" is the buzzword when it comes to any discussion about Industry 4.0. In purchasing, this is a matter of automating the operational processes (“evolution”) before entering the “digital transformation” (“revolution”).
Scarcely 30 per cent of the companies surveyed feel (very) well prepared for the increasing degree of digitisation (see Figure 13). In their own self-assessment, over 70 per cent of the participants rate their preparations as merely satisfactory or worse: At 23 per cent, fully a fifth of respondents even view their level of preparation for digitisation as inadequate or unsatisfactory.
Self-assessment: preparation for digitisation
0 %
20 %
5 %
15 %
20 %
25 %
30 %
Very good
2.5 %
26.6 %25.3 %
22.8 %
3.8 %Good Satisfactory Adequate Inadequate Unsatisfactory
Figure 13
19.2 %
(n=79)
In terms of the size of the company, the rule seems to be: the bigger the company, the better prepared it is for digitisation. From the perspective of the available resources and technology, this result is perhaps unsurprising. The data provided by the micro-enterprises differs from this trend. It can be assumed that, from their point of view, the topic is either not relevant or of manageable complexity (see Figure 14).
Self-assessment by company size
Unsatisfactory
Inadequate
Adequate
Satisfactory
Good
Very good
All (n=91)
Small Cos. (n=21)
Large Cos. (n=9)
Figure 14: Self-assessment in preparation for digitisation by company size
Medium Cos. (n=35)
Micro Cos. (n=19)
“Digitisation” is not an end in itself — in the study, it was possible to demonstrate clear potential in indirect purchasing. This makes it all the more questionable that, on average, the companies rated themselves as inadequate or unsatisfactory when dealing with this topic.
Scarcely 30 per cent of the surveyed companies feel well prepared for digitisation.
Summary:

Study: Indirect purchasing in focus24
3

25
3 Conclusion3
Study: Indirect purchasing in focus26
The focus of this investigation was the extent to which the nature of the implemented purchase-to-pay process influences both process costs and quality. For this purpose, the corresponding process times and parameters were accurately recorded down to the process-step level. This makes a detailed comparison possible in order to check, in detail, processes, process parts or process steps, as well as to look for possible inefficiencies and identify potential savings.
A major finding of the investigation is that standardising the process does not reduce process costs in indirect purchasing — and even leads to increased costs in some cases. Each order that is executed out within a uniform, manual procurement process results in an average cost of EUR 115 for the surveyed companies — this cost is higher than that of an order in the “no uniform process” scenario (EUR 95 ) and, above all, significantly more than in a digital process (EUR 67).
This does not mean that the formalisation of the procurement process itself should be questioned. Based on the maverick-buying rate, the study also shows that the quality of the process increases as a result of standardisation. It is only through a uniform process that requirements can be pooled or compliance problems, errors and throughput times reduced (from the requisition order to availability). However, this obviously results in a partial increase in processing times, for example due to increased documentation or required checks in the individual steps.
Despite the high degree of potential savings associated with an electronic purchasing process, whereby an average medium-sized company with 7,100 purchase orders per year can reduce its process costs by 40 per cent from just under EUR 820,000 to EUR 480,000, more than 70 per cent of the surveyed companies rate their own preparations for digitisation as merely satisfactory or even inadequate.
Practical example:
It does mean, however, that only a digital process can positively influence both costs and quality. On the one hand, there are immense savings in process costs, in excess of 40 per cent versus the uniform, manual process. On the other, the maverick-buying rate — as an indicator of process quality — is the lowest in this scenario. Nevertheless, standardisation is often necessary and advisable as an “intermediate stage” in the transformation from the “non-uniform process” scenario to a digital process, in order not to overwhelm the organisation.
It must be emphasised, however, that the process cost savings are initially only notional — with no effect on profits. What is initially gained, however, is additional working time. The study shows that both the requisitioner and the purchasing department can generate by far the greatest savings, and also that logistics and accounting are either no worse off or benefit also. This is an important argument in the first place in order to create acceptance for a digital process, especially among requisitioners, since they will demonstrably benefit from time savings as a result. In purchasing, this means that resources are freed up in order to concentrate on value-adding activities. The resulting contribution to profits cannot be directly attributed to the digital process and is difficult to measure in practice. However, the study shows, for example, that more time is used for supplier selection — an indication of this increased value added.
The “digital divide” between small and large companies is still evident. While clear savings potential in terms of absolute numbers certainly exists in the process for micro-enterprises, this is no longer negligible for small companies. With 1,200 orders per year, a uniform, manual process would incur an average of EUR 138,360 in annual process costs. With a digital process, these costs would fall to EUR 81,504.
Conclusion

27
Authors:
It should not be overlooked, however, that micro and especially small enterprises have a very high number of vendors in relation to the procurement volume. Each vendor causes a considerable administrative and supervisory burden in addition to the process costs arising from the order. On average, small companies only pool just under EUR 2,000 per vendor — it is therefore possible to imagine the dormant potential here for medium-sized and large companies, even in view of their high absolute number of vendors. Obviously, however, the pooling of requirements has its limits: (a relationship between the number of vendors and the process scenario was not demonstrated by the study). Beyond a certain number of suppliers, it is therefore necessary to behave efficiently — even in the digital age.
It is quite alarming that 71 per cent of the surveyed companies do not consider themselves to be well prepared for digitisation — in particular, it is the small and medium-sized companies that have the greatest need to catch up. Ultimately, each company must decide for itself which competitive risks it should be exposed to within its respective industry. However, if intelligent digitisation of the manufacturing or value-added processes progresses step by step — fuelled by thoughts of “Industry 4.0” — the supporting administrative processes must not lag behind, as otherwise isolated “digitisation islands” will form.
For the first time, this study has enabled a broad survey — in which times and costs were measured down to the individual process step — to be carried out in the German-speaking world. As a result, it is possible to describe in detail the potential differences in processes that include different degrees of uniformity and digitisation. A benchmark is thus available that enables decision-makers to analyse the performance of company-specific processes and identify optimisation measures. Last but not least, the study hopes to intensively further analyse the key performance indicators within the indirect purchasing process, as well as the true complexity of the entire procurement process, so that companies are able to implement appropriate purchase-to-pay processes in the age of digitisation.
Prof. Dr. Holger Müller Professor of Supply Chain Management Faculty of Economics HTWK Leipzig E-mail: [email protected]
Elisabetta Bollini, M.Sc.-Psych. Market research Mercateo AG E-mail: [email protected]

Mercateo Do you have any questions?
Corporate CommunicationsT +49 341 35 58 62 [email protected]
en_1
7040
6