men and women in the estonian labour market: an assessment
TRANSCRIPT
Men and Women in the Estonian Labour Market: An Assessment of the Gender Wage Gap
Tairi Rõõm and Epp Kallaste
NO 8/2004 PUBLICATION OF PRAXIS CENTER FOR POLICY STUDIES
as from possible discrimination. Although the explained wage gap arises from differ-ences in productivity, discrimination may also play a role –– for example, access to work-related training affects productivity.
The results of the analysis reveal that, on average, in 1998-2000, wages paid to wom-en in Estonia amounted to 72.7% of the wages paid to men. The average gender wage gap has decreased since the time Es-tonia regained its independence, but none-theless exceeds the wage gap in most other Central and Eastern Europe countries and EU member states. The decrease in the wage differential has arisen primarily from structural changes in the labour market, as a result of which industries employing more women than men, and in which edu-cation is appreciated more, have grown.
A greater than average gender wage gap ex-isted among non-Estonians and employees who did not speak Estonian. In addition, the wage differential was greater among employees aged 30-40 years. One-third of the gender wage gap can be explained by differences in male and female human capi-tal and occupational choices. Two-thirds of the gender wage gap cannot be explained by these factors. Hence, neither the reduction of segregation nor changes in other observ-able differences between men and women would contribute to a substantial reduction of the wage differential. Attention should be paid to the unexplained portion of the wage gap and its underlying causes.
Executive Summary
In a modern society, men and women should have equal opportunities to succeed. Any difference between the wages paid to men and women is considered an essential indicator of the non-existence of equal op-portunities. On average, women earn less than men in all countries, and this by ap-proximately one quarter less in Estonia.
This analysis seeks to ascertain the theo-retical reasons for the gender wage gap, the historical development trend of the wage differential in Estonia, the degree to which differences in human capital and work explain that trend and the compo-nents of the gender wage gap that cannot be explained by the factors mentioned above. The wage gap is analysed using one of the most widespread methods – the Oaxaca-Blinder decomposition. The anal-ysis is based on data from Estonian Labour Force Surveys for the years 1998-2000.
A gender wage gap arising from differences in the human capital and work of women and men is referred to as an explained wage gap, because these factors cause differences in the productivity of women and men. The portion of the wage gap that cannot be explained by observable factors is referred to as the unexplained wage gap. The unex-plained wage gap results from the different personal characteristics and labour market behaviour of men and women, which can-not be identified on the basis of data, as well
Tairi Rõõm is supervisor of research in the Research Department of the Bank of Estonia.Epp Kallaste is an analyst at the PRAXIS Center for Policy Studies.The study was carried out with the financial support of the Open Estonia Foundation.The authors are grateful to Reelika Leetmaa, Andres Võrk, Liis Kraut and experts from the Gender Equality Programme of the Open Estonia Foundation for their helpful comments and remarks.
2
Introduction
Estonian women are paid approximate-ly three-quarters of the wages paid to men. The aim of this study is to analyse the reasons for that. First the theoreti-cal reasons for the gender wage gap are explained. The authors then empirically analyse the degree to which the wage differential in Estonia is caused by dif-ferences in productivity (i.e. the fact that women’s occupations differ from those of men and that women have different levels of education and work experience when compared to men), and the portion of the wage gap that cannot be explained using the observable differences between men and women.
An analysis of the gender wage gap is important for several reasons. First, simi-lar pay for equivalent work is a generally recognised anti-discrimination principle, which Estonia also seeks to abide by. Second, ensuring equal opportunities and reducing the segregation of the labour market serve as a basis for the better re-alisation of women’s potential, which is essential, among other things, from the point of view of the aging population and the diminishing numbers of people of working age. In the long run, all the available opportunities for increasing the share of the working age population should be utilised.
Besides the benefit of women realisingtheir potential in the labour market, in-creasing the participation of women is important for securing adequate living standards. Given the recent trend of in-creasingly more families having just one parent (mostly the mother), it is important to ensure sufficient income for families,and this in turn is based on the opportu-nity to work and earn an adequate wage. Increasing the participation of women would also make it possible to improve their opportunities for self-fulfilment andincrease their independence, thus taking a step closer to gender equality.
Wage is a vital issue when choosing be-tween working and staying home. The European Employment Strategy 2003,
which also serves as a basis for drawing up the Estonian National Action Plan for Employment, has set a substantial reduc-tion of the gender wage gap in all the EU member states by the year 2010 as one of the goals. The reduction of the gender wage gap should be achieved by influenc-ing the various underlying factors that cause the gap. Among other things, occu-pational and sectoral segregation must be reduced, access to education and training must be improved, remuneration systems must be made more transparent and awareness of the existence and causes of the wage differential must be raised (The Council of the European Union 2003).
Previously, Rein Vöörmann discussed the participation rate of women and men in the labour force as well as the wages paid to women and men in comparison to other Central and Eastern European countries (see, e.g. Vöörmann 2000; the Ministry of Social Affairs 1999). By ana-lysing the average wages at the beginning and in the middle of the 1990s, Vöör-mann points out that in Estonia women are paid less than men in all occupations and that wages paid to women fall short of the earnings of men by approximately one-quarter. Several other studies have been carried out in Estonia that were not targeted at an analysis of the wage dif-ferential, but which among other things recognised the existence of the gender wage gap. For example, Philips concluded that in 1989 men earned 30% more than women on average, while other socio-de-mographic and occupational characteris-tics were similar (Philips 2001). Kuddo et al. (2002) point out that while the charac-teristics of human capital and the labour market were similar, women were paid 934 kroons less than men (i.e. wages paid to women represented approximately 75% of the wages paid to men).
The current study advances analyses of the gender wage gap in Estonia by assess-ing factors that could potentially have a different impact on the wage formation of men and women (e.g. education level, length of employment, number of chil-dren, etc.). The gender wage gap is ana-lysed on the basis of the Oaxaca-Blinder
The study aims at explaining the underlying rea-sons for the gender wage gap.
Wage is a vital is-sue when choosing between working and staying home.
3
In the professional literature, the gender wage gap is divided into ex-plained and unex-plained portions.
Wages should correspond to the productivity of employees.
Survey was con-ducted among 810 enterprises.
decomposition method (Oaxaca 1973), using data from Estonian Labour Force Surveys from the years 1998-2000.1
The first chapter of this study describesthe reasons behind the gender wage gap. The second chapter provides an over-view of how the ratio of male-female wages has changed in Estonia over the past decade. The third chapter examines in more detail the method of analysis, as-sesses the impact of various factors on the wage differential, and determines the proportion of the gender wage gap that can be explained by these factors.
1. Formation of wages and reasons for the gender wage gap
1.1. Explained and unexplained gender wage gap
As a rule, wages should be positively re-lated to the productivity of workers. Ir-respective of whether an employee is a woman or a man, blond or brunette, his or her pay should reflect the value-addedgenerated by him or her. Yet it is com-mon knowledge that women are paid less than men.
Several reasons may lie behind the gen-der wage gap. In economic literature, the gender wage gap is divided into explained and unexplained portions. • The explained gender wage gap refers
to the portion of the wage differential that can be explained by the observ-able characteristics of women and men (e.g. different working time, education level, length of employment, occupa-tion, sector, etc.). The explained wage gap is explained from the point of view of the employer –– that is, women are engaged in fields where their produc-tivity is lower, or the human capital of women is such as to entail lower pro-ductivity, which, in turn, causes lower wages.
• The unexplained wage gap indicates the portion of the wage differential that cannot be explained using observ-able factors. The unexplained wage gap may refer to discrimination or to the fact that other variables, which are not observable for the researcher, have an impact on the wage differential.
Hence, the terms “explained wage gap” and “unexplained wage gap” signify the portions of the wage differential that can or cannot be explained by observable factors.
The unexplained wage gap is often inter-preted as discrimination. Yet the unex-plained portion of the wage gap may be caused by factors that cannot be meas-ured, but which still render the produc-tivity of women and men different (e.g. raising children makes women less flex-ible in respect to working time). On the other hand, the explained wage gap may also arise from discrimination, if the jobs and occupations chosen by women result from the norms established by society, not from the deliberate and voluntary choice of women.
The most commonly mentioned observ-able differences in the work and human capital of women and men are the fol-lowing:• Different working time• Horizontal segregation of the labour
market• Vertical segregation of the labour mar-
ket• Differences in education• Different length of employment
Working time is the principal factor af-fecting the explained portion of the wage gap. Women usually work less than men –– that is, there are more part-tim-ers among women than among men, and thus women’s wages are lower. When compared to working full-time, working part-time is more suitable for reconciling one’s professional life with raising chil-dren and, considering the traditional dis-
1 – Since the Statistical Office altered their methodology for collecting data for the Labour Force Sur-veys in the middle of 2000, more recent databases cannot be linked to previous ones.
4
Women are predominantly represented in lower-paid fields of activity.
Women are more likely to become inactive than men.
tribution of gender roles, it is predomi-nantly the women who choose a shorter working time.
However, when comparing men and women working full-time, it appears that, on average, women are still paid less than men. In such a case, the most widespread explanation for the differential is that women are predominantly involved in lower-paid fields of activity (the horizon-tal segregation) and that positions held by women are on the lower levels of the “career ladder” and hence have lower re-muneration rates (vertical segregation). For example, women are seamstresses, while men are miners; women are sec-retaries, while men are senior executives. The question is: how does gender segre-gation arise between industries and occu-pations, and is it triggered by discrimina-tory behaviour on the part of employers and society? Segregation may arise from both people’s deliberate choices and the behaviour resulting from gender roles determined by society. The way women and men choose their qualification neednot always be based on free choice, but rather on the potential of finding a jobin the future. Women do not choose to study to become a car repair mechanic, as the potential of finding a job wouldbe less than, for example, after studying to become a nurse. Vertical segregation may be caused by the limited existence of promotion opportunities for women or limited access to training. As far as em-ployers are concerned, these factors may reflect a deliberate choice after consider-ing the risk that women may choose to stay at home and raise children, as a re-sult of which the expenses incurred by the employer in developing their human capital may be lost.
Productivity may also differ if people work in the same occupations and in the same sector. Empirical surveys based on regression analysis have revealed that a substantial part of the gender wage gap is caused by differences in human capi-tal –– that is, education level and length
of employment. The higher the employ-ee’s human capital, the greater, on aver-age, his or her productivity and hence also wage. Until recently, the education level of men has been higher than that of women in most countries (however, that trend has reversed now, i.e. more women than men are studying in universities in most developed countries).2 Moreover, men have a longer length of employ-ment, as women’s employment is inter-rupted by parental leave. Due to both of the reasons specified above, wages paidto women are smaller than the earnings of men on average.
In addition to the general length of em-ployment, the duration and timing of pe-riods of inactivity also have an impact on wages. Breaks in employment have a more adverse impact on a future rise in wages if a person has no previous work expe-rience (e.g. immediately after graduation from a secondary school or a university). It has also been found that the longer the periods of absence from work, the lower the future increase in wages, irrespective of the length of previous employment (Neumark 1993). Due to gender roles, the probability of becoming inactive and the duration of periods of absence from work are greater for women than for men, in particular at the beginning of their professional life.
There is no consensus as to whether the gender wage gap arising from differences in the human capital and occupational choices (the explained wage gap) is caused by discrimination or not. Those who as-sert that the explained wage gap is not caused by discrimination assume that dif-ferences in education levels, length of em-ployment and occupational choices result from the free choice of women: women prefer “easier” jobs and staying at home with children over the opportunity to earn higher wages. In other words, women de-liberately prefer staying at home, and their welfare is greater when raising children than when working. However, opponents find that differences in the length of em-
2 – The former socialist republics (incl. Estonia) represent an exception as regards the education level – in these countries the education level of women has been higher than that of men for a long period.
There is no con-sensus as to whether differ-ences in the length of employment and occupational choices result from discrimination or not.
5
Competition advances equal treatment of men and women.
ployment and occupational choices are also caused by discrimination: the choices that women make are imposed on them by society, and women work in lower-paid occupations not because of free choice, but because they find it difficult to findjobs in the so-called “male occupations” due to barriers caused by various norms and attitudes.
1.2. Gender wage gap and discrimination
Several empirical surveys have indicated that, at least until recently, the gender wage gap has resulted from discrimination. The basic concepts of discrimination theory were established by Gary Becker (1957). According to Becker, employers who dis-criminate while choosing employees (i.e. prefer men over women) are also willing to pay a higher price for their prefer-ences. Employers prefer to hire men (as a result of the preferences and prejudices of their own, or of other employees or customers), even though gender is not an essential factor in determining produc-tivity. While men’s wages are higher than those of women, hiring men is accompa-nied by higher expenses. Discriminating employers hire fewer women than would be optimal, and therefore earn lower profits than the employers who do notdiscriminate against women. Thus, while the employers of both types seek to max-imise their welfare, non-discriminating employers have a competitive advantage over discriminating employers.
The main conclusion derived from Beck-er’s model is that, as a result of compe-tition between companies, the compa-nies that discriminate against women are eventually driven off the market. As a result, the relative demand for female labour increases, the wage gap between women and men with the same qualifi-cation becomes narrower and may disap-pear altogether. Several empirical studies have taken that conclusion as a basis and analysed whether increasing competition in an industry causes a reduction of the gender wage gap. There is a consensus that this is indeed the case. For exam-ple, Black and Brainerd (2002) analysed
whether globalisation has narrowed the gender wage gap in the United States of America. They compared the impact of an increase in trade on sectors that were open to competition, and on sectors which initially had little competition due to limited trade. The analysis carried out by Black and Brainerd yielded the con-clusion that, as a result of an increase in trade, the gender wage gap narrowed more in the latter sectors. Their conclu-sion tallied with Becker’s theory: increas-ing competition in an industry (resulting from the deepening of trade relations in the given case) brings about a decrease of the gender wage gap. This implies that initially the gender wage gap was at least partly caused by discrimination.
Ashenfelter and Hannan (1986), who analysed the gender wage gap in the US banking sector, reached similar conclu-sions. They found that the greater the market power of the banks in a given region, the smaller the relative share of female employees in these banks. This result, too, is in line with Becker’s theory of discrimination. A study by Black and Strahan (2001), which discussed the same issue, was also based on the empirical analysis of the banking sector: the au-thors studied the effect of deregulation in the banking sector in the 1970s on the gender wage gap. They concluded that the increased competition resulting from deregulation has significantly reduced thegender wage gap. Hellerstein, Neumark and Troske (2002) found that the prof-itability of companies with substantial market power is positively linked to the relative share of women working in such companies. This result is also in line with Becker’s theoretical model that discusses discrimination.
The main conclusion based on the above studies is that a revival of competition in a product market most probably entails an improvement of the relative position of women in the labour market. Hence, enhancement of competition and fa-cilitation of the efficient functioning oflabour and product markets enable gov-ernments to, among other things, ensure equal treatment of men and women.
Discriminating employers earn smaller profits.
6
In Estonia, women settle for smaller wages and search for a new job less actively than men.
The higher the expected pay, the more intense the job search.
1.3. Additional reasons for a gender wage gap: differences in labour market behaviour and psychological factors
In addition to the previously mentioned reasons for differences in productivity, the gender wage gap is also caused by differences in labour market behaviour and the personal characteristics of men and women. Therefore, the unexplained portion of the gender wage gap consists of two components that cannot be dif-ferentiated in an empirical analysis:• differences in wages that are caused by
discrimination• differences in wages that are caused by
the different labour market behaviour and personal characteristics of men and women.
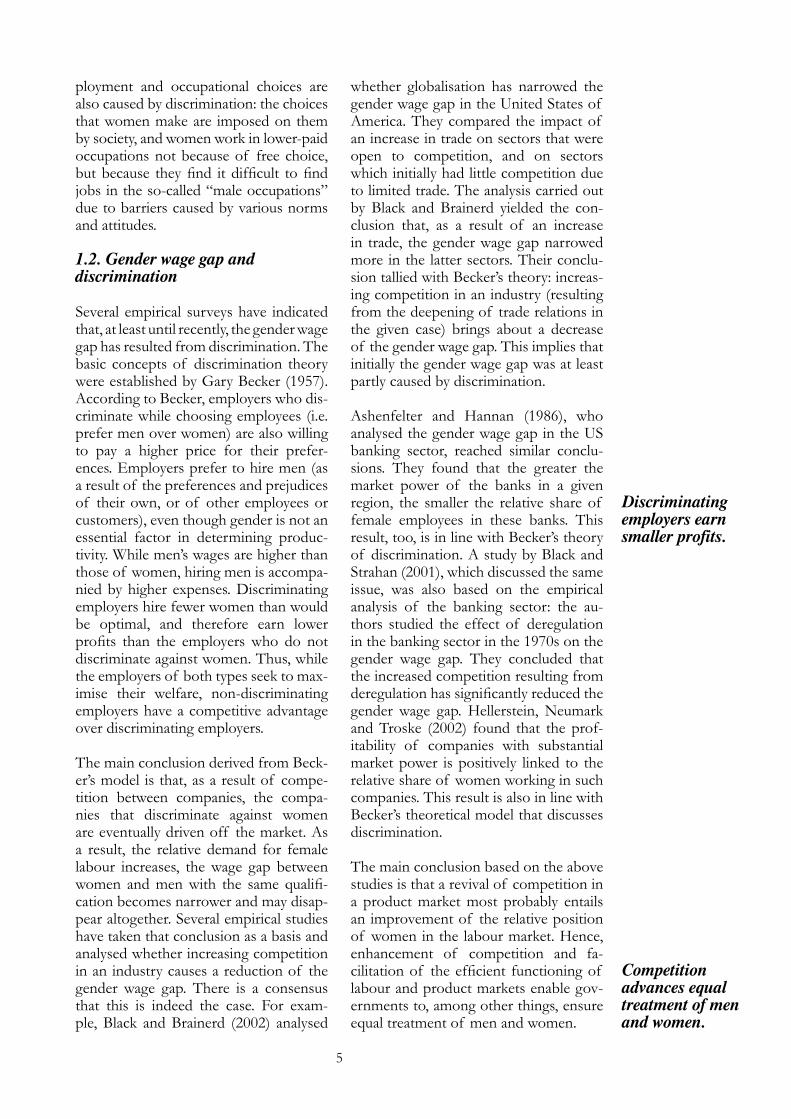
In the following, we will discuss the gen-der wage gap arising from labour market behaviour. Rõõm (2004) has concluded that women settle for lower wages and search for work less actively than men in Estonia. A comparison of reservation wages3 indicates that, on average, men demanded higher wages than women (see figure 1). While more than half of allwomen (56.5%) would agree to work for a wage of 2000 kroons, only approximately one-third (34.1%) of all men would ac-cept a job for the same remuneration. The proportion of women whose reservation wage amounted to 3000 kroons or less was 82.6%, while the proportion of men
with the same remuneration requirement was 61.6%. Using a regression analysis, Hinnosaar (2003) found that ceteris pari-bus (i.e. when all variables included in the regression analysis were the same), the reservation wage for women was 29% smaller than that of men.
Besides the finding that women wouldagree to work for a lower wage than men, job search activity is lower among women than among men in Estonia. The probability that a man actively seeks work in case of unemployment is 17% higher than the same probability for a woman, ceteris paribus (Rõõm 2004).
The intensity of the job search and the reservation wage have an impact on both the probability of finding work and thefuture wage. The more actively an em-ployee seeks work the larger the potential wage in his or her new job. Greater job search intensity increases the probability of finding a job that is the best match forthe person’s knowledge and skills. Thus, in the case of greater search intensity the potential productivity of an employee in their new job will be higher, and so will be the expected wage.
The positive relationship between the reservation wage and the potential fu-ture wage is the result of the fact that the higher the wage expectations of a per-son participating in the labour market, the more actively he or she seeks work,
3 – The reservation wage is the lowest remuneration for which an unemployed person would agree to take up a job.
Figure 1. Cumulative distributions of the reservation wages of women and men in Estonia (1998-2000)
Source: Estonian Labour Force Survey; calculations by authors
Reservation wage
WomenMen
7
ceteris paribus. Furthermore, a high res-ervation wage may have a direct positive impact on the wage. In an imperfect in-formation framework, asking for a high wage in job negotiations functions as a signal that implies high potential produc-tivity. Therefore, if a person asks more, employers are in some cases also willing to pay more.
Men’s reservation wages are higher than those of women because men are paid more than women on average and there-fore their wage expectations are higher. This partly explains the greater activity of men in seeking work when compared to women. However, even if the wage expectations are the same, men are still more active in seeking work in Estonia than women (Rõõm 2004).
In addition to wage expectations, labour market behaviour can differ because a job search for women involves a higher op-portunity cost. The traditional division of labour within families usually means that women have a larger share of household work, while men work more intensely outside the house. Also, if there is a need to take care of family members –– chil-dren, ill or disabled relatives –– then this duty usually falls to the woman. This im-plies that on average it is more costly for women to look for new jobs when un-employed.
Another explanation for why women are likely to search less intensely than men is their lower relative return on employ-ment compared with unemployment in-come. Since women have lower expected wages, they are less motivated to look for a job. The existence of a gender wage gap means that unemployed wives whose husbands work have a higher alternative income than vice versa. This is an addi-tional reason why women are less moti-vated to search for a job in general.
In addition to the above-mentioned fac-tors, there are several psychological rea-sons why women’s search intensity may
be lower. A number of studies in the area of psychology have shown that while both men and women exhibit overcon-fidence in certain situations, men are onthe average more likely to overstate their characteristics relative to others.4 Men’s relative overconfidence may contributeto the gender wage gap as a separate fac-tor independent from search activity. Ev-idence from several studies has implied that people who work in masculine oc-cupations (such as investment bankers, lawyers, managers and negotiators) tend to be overconfident (Barber and Odean(2001)). Since the salaries tend to be high-er in masculine occupations, men may get selected for such jobs due to their over-confidence and that may partly explaintheir higher earnings. But men’s relative overstatement of their abilities can also contribute to the differences in search be-haviour, since search activity depends on how a person values his or her job find-ing prospects and the expected salary.
It is also shown that women perform worse when they have to compete with others, while the performance of males improves in a competitive environment. Gneezy, Niederle and Rustichini (2002) conducted a laboratory experiment where they showed that as the competitiveness of an environment increases, there is a significant improvement in performancefor men, but not for women. (Their con-clusions, however, were based on a small sample and therefore not statistically ro-bust.) The inference from this behavioural difference for the current study is straight-forward. A job search is a competitive proc-ess and if women’s performance worsens in competitive environments, they might get more easily discouraged and to search less in general compared with men.
Finally, evidence from behavioural eco-nomics and finance literature implies thatwomen are in general more risk-averse than men (See for example, Sunden and Surette (1998), Lehmann and Warning (2001)). This may also contribute to dif-ferences in search intensity. If women are
4 – An overview of the relevant literature is provided e.g. in the article written by Barber and Odean (2001).
8
The gender wage gap was larger at the end of the 1980s than at the end of the 1990s in Central and Eastern European countries.
more risk averse, they are more likely to accept a job offering a lower wage (i.e. their reservation wages may be lower on average) and search intensity is positively related to the reservation wage. On the other hand, a more risk-averse person may be more inclined to an intensive search –– that is, s/he might aim to less-en the risk of remaining jobless by trying to get as many job offers as possible. Due to these opposite incentives, the overall effect of risk-averseness on search inten-sity is ambiguous.
2. Development of the gender wage gap in Estonia in comparison to other countries
In most of the Central and Eastern Eu-ropean countries, gender wage gaps were larger during the last years of the Soviet era than at the end of the 1990s. (Rõõm (2004), see also Figure 3). The decrease in the wage gap during the previous dec-ade may seem surprising at first sight, asgeneral income inequality increased during the transition process. Furthermore, equal rights were guaranteed for men and women in the labour market at least in the rhetoric in socialist countries. Wages were deter-mined centrally across the occupations and industries chosen, and thus the so-called subjective factor inherent in the capitalist system was ruled out in the formation of wages, at least theoretically. Nonetheless, the remuneration paid to men and women differed substantially. In Estonia, the aver-age monthly salary of women represented 66% of the monthly salary of men in 1989 (Noorkõiv et al. 1997).
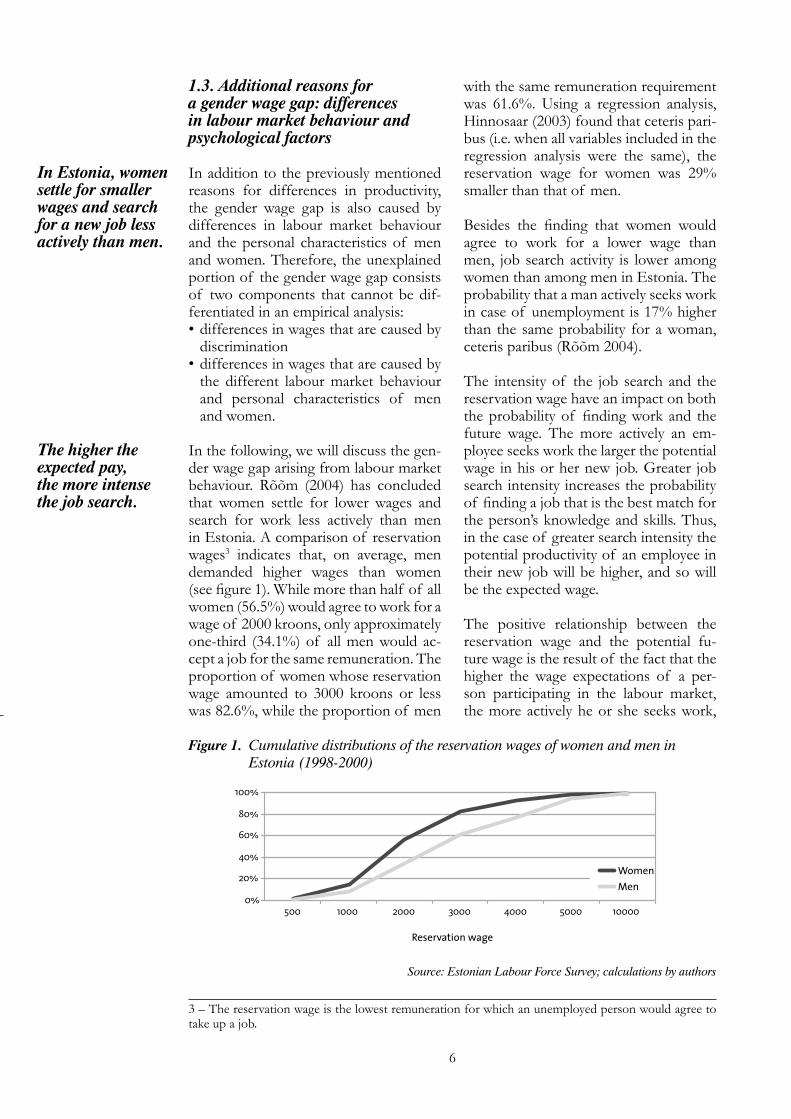
In 2001, the hourly rate paid to women amounted to 75.7% of the hourly rate paid to men, while in 1994 this ratio had been 71%. This implies that the gender wage differential decreased in the previ-ous decade (see also Figure 2).
Compared with other transition econo-mies, Estonia was no exception regard-ing the gender pay difference; the average gender pay ratio in Central and Eastern European economies was 72% at the end of 1980s. In Western Europe, these ra-tios were on average 5 percentage points higher than in the Central and Eastern European countries (see Figure 3).
Segregation has been mentioned as the main reason for the wage gap in the so-cialist system. The Soviet-era centralised allocation of jobs caused extensive gender segregation across occupations and pro-fessions. While women were traditionally engaged in the service sector (education, trade, etc.), heavy industry, transport sec-tor and agriculture predominantly rep-resented the so-called male occupations that were better paid in comparison with the service sector. Primarily as a result of the segregation, but also due to the rea-son that men were more likely to be pro-moted than women irrespective of their occupations, wage gaps were wider in Central and Eastern European countries than in Western Europe during the last decade of the socialist era (see Figure 3).
The gender wage gap depends, among other things, on the overall wage struc-ture of a particular country. The general inequality of wages and the position of women in the distribution of wages are
Figure 2. Gross average hourly pay for women and men (kroons), and the ratio of women’s wages to men’s wages (%)
Proportion of women’s wages to men’s wagesMenWomen
Kroo
ns
Source: Statistical Office of Estonia

9
Demand for la-bour increased in sectors where women dominate.
essential factors. More equal wage dis-tribution implies a smaller gender wage gap. However, a wide-ranging distribu-tion of wages need not entail a wide gen-der wage gap. If, for example, wage dif-ferences are substantial across education levels and women are on average more educated than men, then the gender wage gap is small (Blau and Kahn 1992, 2000). Hence, in international comparisons of wage differences as well as in analysing the development of the gender wage gap in a particular country, attention should be paid to the general wage structure for men and women.
In almost all CEE countries, gender pay gaps declined during the 1990s. This implies that economic reforms brought about a relative improvement in the po-sition of women on the labour market. Economic transition was characterized by a rapid increase in wage differentia-tion and a simultaneous decline in labour force participation rates from the artifi-cially high levels of the Soviet era. Both of these factors contributed to the reduc-tion of the gender pay gap, as:
• An increase in pay inequality coincided with and was to some extent the con-sequence of an increasing demand for better-educated labourers. The rela-tive returns to education and employ-
ment opportunities for more educated workers rose rapidly during transition. In comparison with men, women ben-efited more from this development,since in most former Soviet countries females were and are more educated on average.5
• The relative position of women in the labour market improved, since women worked disproportionately more in sec-tors that gained from the transition. Orazem and Vodopivec (2000) show that in Estonia and Slovenia, labour demand fell most in predominantly male sectors, while predominantly fe-male sectors either declined little or expanded. This was likely the case in many other transition economies as well, since the employment loss was the largest in heavy industry sectors and agriculture where the workforce was male-dominated. On the other hand, female-dominated sectors, such as trade and services, were underdeveloped un-der the socialist system and labour de-mand increased in these sectors during the transition.
An additional factor causing a decline in the gender wage gap during the transition in Estonia and in some (but not all) oth-er CEE countries was structural change in the labour force composition. Simi-
Figure 3. Proportion of women’s wages to men’s wages (%)
Bulg
aria
Russ
ia
Esto
nia
Slov
akia
Hun
gary
Pola
nd
Czec
h Re
publ
ic
Slov
enia UK
Aust
ria
Net
herla
nds
Ger
man
y
Fran
ce
Italy
Belg
ium
Swed
en
Finl
and
The EU average in the second half of the 1990s
The Central and Eastern European average in the second half of the 1990s
End of the 1980s Second half of the 1990s
Sources: Central and Eastern European countries – Newell and Reilly 2000, EU member states at the end of the 1980s – Blau and Kahn 2000, EU member states at the end of the 1990s – European Commission 2002
5 – In Estonia 23% of working age women have a university degree, compared with 15% of working age men.
Demand for highly educated employ-ees increased.

10
larly to other post-socialist economies, economic transition in Estonia brought about a decline in the overall employ-ment rate, but the drop in employment was more pronounced for women than for men. Since individuals with the low-est earning potential (i.e. low-skilled workers) were the most likely to drop out of the labour force during the period of employment contraction, the gender difference in relative reductions in the employment rates changed the composi-tion of the labour force. As a result, the skill pool of women who remained in the labour force improved relative to men. There is evidence in Estonia that during the first years of transition (between 1989and 1995) the employment shares for the least-educated groups fell relatively less (from 37 to 18 percent) for men and rela-tively more (from 35 to 12 percent) for women (Orazem and Vodopivec (2000)). The idea that the change in the compo-sition of the labour force was a source of the reduction in the gender wage gap was first pointed out by Hunt (2002). Sheshowed that in Eastern Germany this de-cline was in part caused by low-earning and low-skilled women selectively drop-ping out of the labour force.
The gender wage gap has narrowed in Western European countries, the United States of America and other developed industrial countries in the last decades. In addition to greater awareness of the gender inequality issue in these coun-tries, two other trends have contributed to the reduction of the wage gap. First, the relative education level of women has improved in comparison with men and, second, the average length of employ-ment of women has increased as a result of a decline of birth rates and an increase of the average childbearing age. In Esto-nia, an improvement of education levels among women may entail a reduction of the wage gap in the near future. Howev-er, the length of employment is unlikely to increase.
The average education level of women during the transition process in Estonia has improved when compared to men, and this should narrow the wage gap.
Even though the relative share of men with higher education has increased as a result of the increase of the relative de-mand for highly educated labour, the per-centage of highly educated women has grown even more quickly. In Estonia, the share of male students aged 19-22 years increased from 23% to 43% in 1993-2003. The percentage of female students of the same age has grown more – from 28% to 59% (Statistical Office of Esto-nia).
It is quite unlikely that an increase of the average length of employment of wom-en will reduce the gender wage gap in Central and Eastern European countries (incl. Estonia) in the near future. While the socialist regime was characterised by a high employment rate for women, the transition process has entailed a decrease rather than an increase of both the wom-en’s participation rate and work experi-ence along with an increase of female unemployment in the majority of transi-tion countries.
To sum up, the decrease in the gender wage gap has hitherto first of all beenfostered by structural changes of the la-bour market in Estonia. That trend will probably continue in the future, though as a result of other factors. The gender wage gap could be reduced on account of an increase in awareness of gender equal-ity issues resulting from more extensive public discussion in that regard, and as a result of changes in the traditional gen-der roles across generations. The adop-tion of the Gender Equality Act (RT I, 21.04.2004) will definitely have a positiveimpact in that context, too, as it specifiesthe various forms of discrimination.
The parental benefit established in Esto-nia in 2003 may also, due to various rea-sons, have an effect on the average work experience and wages of women. The parental benefit enables a person to re-ceive an income equal to his or her salary for up to twelve months after the birth of a child6. First of all, the establish-ment of the parental benefit may affectthe average length of parental leave. Yet it is questionable as to whether breaks in
Raising awareness of and changes in gender roles contribute to the reduction of wage differences.
11
In 1998-2000, women’s wages amounted to 72.7% of men’s wages on average.
employment will increase or decrease for women as a result. On the one hand, as a result of the establishment of the paren-tal benefit, women who otherwise wouldhave returned to work within a couple of months after the birth of a child, may de-cide to stay at home until the end of the period during which the benefit is paid –– that is, for one year. On the other hand, those who before the adoption of that Act would have stayed at home for three years might now decide to return to work after one year has passed since the birth of a child.
In addition to the length of parental leave, it should be considered whether and how the establishment of the paren-tal benefit would impact the birth rate.Various developments are possible. On the one hand, parental benefits should in-crease the birth rate, as it makes it easier for women to stay at home with children. On the other hand, it is possible that the average childbearing age will increase, as women will postpone childbearing in the hope of earning higher wages (and thus also higher benefits) in the future. Anincrease in the average childbearing age will probably reduce the birth rate. For a longer discussion of the possible ef-fects of the parental benefit on women’slabour market behaviour, please refer to Leetmaa and Võrk (2003). The impact of the parental benefit on women’s partici-pation in the labour market and, accord-ingly, on the wages of women is an im-portant issue that should be investigated in more detail.
3. Analysis of the explained and unexplained gender wage gap in Estonia
3.1. Data
To assess the difference between wages paid to women and men, we used the data from Estonian Labour Force Sur-veys for the years 1998-2000. The sam-ple includes both full-time and part-time workers. The wages of part-timers have been recalculated into wages correspond-ing to full-time work. Thus we eliminated the possibility of wage differences arising from the fact that there are more part-timers among women.
As asserted in Chapter 1, there are more part-time workers among women than among men. For example, in 2003, 11.5% of women and 5% of men were em-ployed part-time (Statistical Office). Thispercentage is smaller than that in the old member states of the European Union, where one-third of all working women and 6% of men are part-timers on aver-age (European Commission 2002).
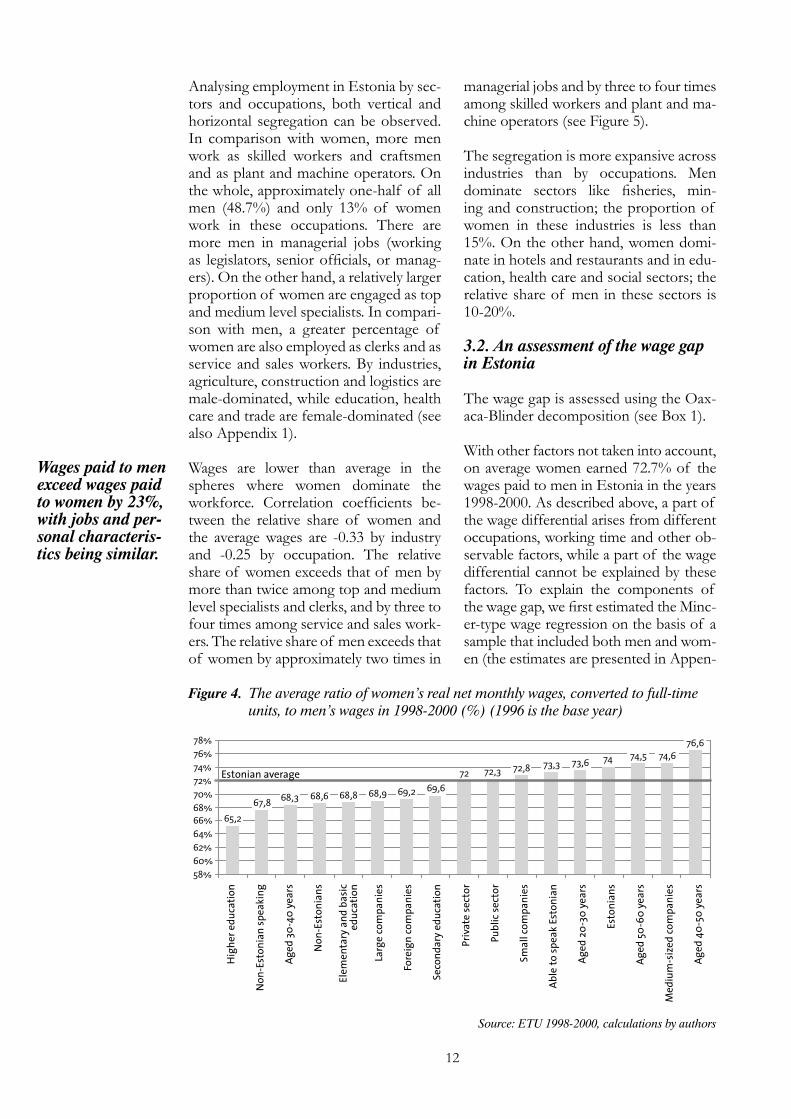
Wages are defined as net salaries paid forthe month that preceded the survey. We use real net wages (the base year is 1996). In the labour market as a whole, women’s wages amounted to 72.7% of the wage lev-el of men on average. The wage differential was smaller in companies owned by foreign persons and in large companies (with more than 200 employees) (see Figure 4). By age group, the wage differential was the great-est among employees aged 30-40 years: the level of women’s wages represented 68.3% of the level of men’s wages in that seg-ment. The gender wage gap among non-Estonians was greater by 5.4 percentage points than the gender wage gap among Estonians. Regarding only non-Estonians, the wage gap was 5.5 percentage points lower among employees who speak Es-tonian. As, on average, non-Estonians are paid less than Estonians, these ratios imply that non-Estonian women are the least fa-voured in the Estonian labour market.
6 – For the maximum and minimum amounts of the parental benefit and bases for calculation thereof,please refer to the Parental Benefit Act (RT I, 22.12.2003).
12
Analysing employment in Estonia by sec-tors and occupations, both vertical and horizontal segregation can be observed. In comparison with women, more men work as skilled workers and craftsmen and as plant and machine operators. On the whole, approximately one-half of all men (48.7%) and only 13% of women work in these occupations. There are more men in managerial jobs (working as legislators, senior officials, or manag-ers). On the other hand, a relatively larger proportion of women are engaged as top and medium level specialists. In compari-son with men, a greater percentage of women are also employed as clerks and as service and sales workers. By industries, agriculture, construction and logistics are male-dominated, while education, health care and trade are female-dominated (see also Appendix 1).
Wages are lower than average in the spheres where women dominate the workforce. Correlation coefficients be-tween the relative share of women and the average wages are -0.33 by industry and -0.25 by occupation. The relative share of women exceeds that of men by more than twice among top and medium level specialists and clerks, and by three to four times among service and sales work-ers. The relative share of men exceeds that of women by approximately two times in
managerial jobs and by three to four times among skilled workers and plant and ma-chine operators (see Figure 5).
The segregation is more expansive across industries than by occupations. Men dominate sectors like fisheries, min-ing and construction; the proportion of women in these industries is less than 15%. On the other hand, women domi-nate in hotels and restaurants and in edu-cation, health care and social sectors; the relative share of men in these sectors is 10-20%.
3.2. An assessment of the wage gap in Estonia
The wage gap is assessed using the Oax-aca-Blinder decomposition (see Box 1).
With other factors not taken into account, on average women earned 72.7% of the wages paid to men in Estonia in the years 1998-2000. As described above, a part of the wage differential arises from different occupations, working time and other ob-servable factors, while a part of the wage differential cannot be explained by these factors. To explain the components of the wage gap, we first estimated the Minc-er-type wage regression on the basis of a sample that included both men and wom-en (the estimates are presented in Appen-
Figure 4. The average ratio of women’s real net monthly wages, converted to full-time units, to men’s wages in 1998-2000 (%) (1996 is the base year)
Estonian average
Source: ETU 1998-2000, calculations by authors
Hig
her e
duca
tion
Non
-Est
onia
n sp
eaki
ng
Aged
30-
40 y
ears
Non
-Est
onia
ns
Elem
enta
ry a
nd b
asic
ed
ucat
ion
Larg
e co
mpa
nies
Fore
ign
com
pani
es
Seco
ndar
y ed
ucat
ion
Priv
ate
sect
or
Publ
ic se
ctor
Smal
l com
pani
es
Able
to sp
eak
Esto
nian
Aged
20-
30 y
ears
Esto
nian
s
Aged
50-
60 y
ears
Med
ium
-siz
ed co
mpa
nies
Aged
40-
50 y
ears
Wages paid to men exceed wages paid to women by 23%, with jobs and per-sonal characteris-tics being similar.
13
Box 1
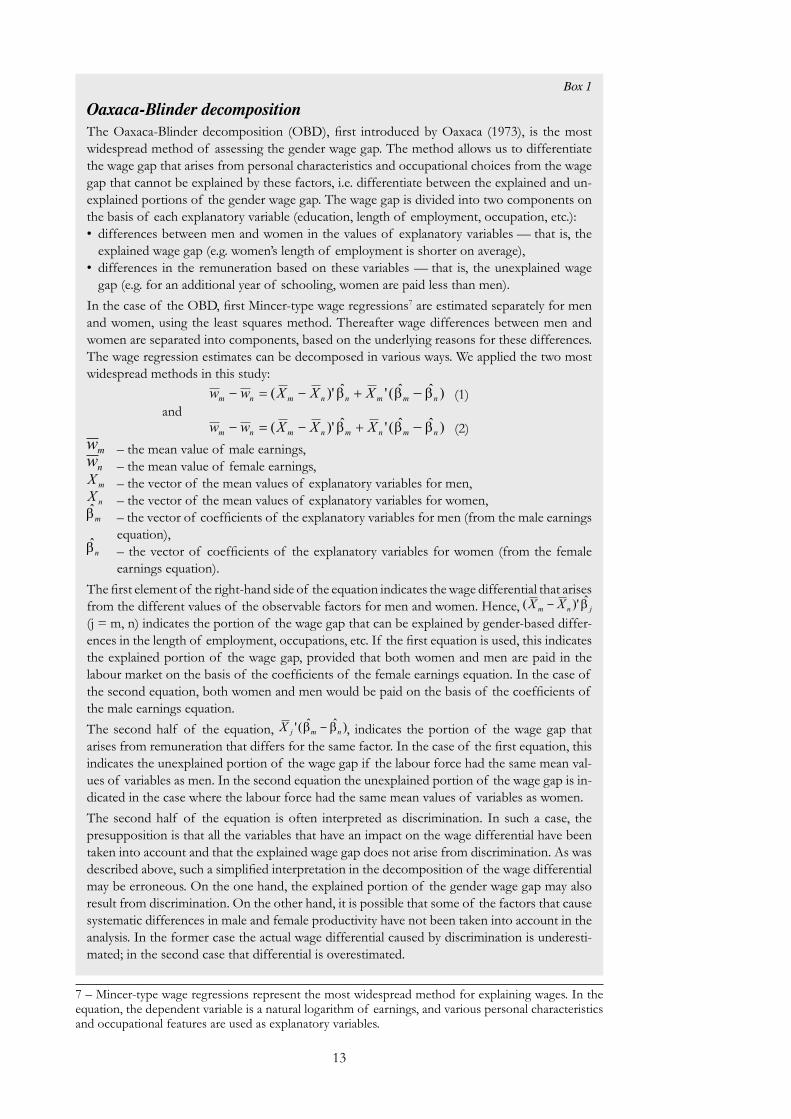
Oaxaca-Blinder decompositionThe Oaxaca-Blinder decomposition (OBD), first introduced by Oaxaca (1973), is the mostwidespread method of assessing the gender wage gap. The method allows us to differentiate the wage gap that arises from personal characteristics and occupational choices from the wage gap that cannot be explained by these factors, i.e. differentiate between the explained and un-explained portions of the gender wage gap. The wage gap is divided into two components on the basis of each explanatory variable (education, length of employment, occupation, etc.):• differences between men and women in the values of explanatory variables –– that is, the
explained wage gap (e.g. women’s length of employment is shorter on average),• differences in the remuneration based on these variables –– that is, the unexplained wage
gap (e.g. for an additional year of schooling, women are paid less than men).In the case of the OBD, first Mincer-type wage regressions7 are estimated separately for men and women, using the least squares method. Thereafter wage differences between men and women are separated into components, based on the underlying reasons for these differences. The wage regression estimates can be decomposed in various ways. We applied the two most widespread methods in this study:
(1)and
(2) – the mean value of male earnings, – the mean value of female earnings, – the vector of the mean values of explanatory variables for men, – the vector of the mean values of explanatory variables for women, – the vector of coefficients of the explanatory variables for men (from the male earnings
equation), – the vector of coefficients of the explanatory variables for women (from the female
earnings equation).The first element of the right-hand side of the equation indicates the wage differential that arisesfrom the different values of the observable factors for men and women. Hence, (j = m, n) indicates the portion of the wage gap that can be explained by gender-based differ-ences in the length of employment, occupations, etc. If the first equation is used, this indicatesthe explained portion of the wage gap, provided that both women and men are paid in the labour market on the basis of the coefficients of the female earnings equation. In the case ofthe second equation, both women and men would be paid on the basis of the coefficients ofthe male earnings equation.The second half of the equation, , indicates the portion of the wage gap that arises from remuneration that differs for the same factor. In the case of the first equation, thisindicates the unexplained portion of the wage gap if the labour force had the same mean val-ues of variables as men. In the second equation the unexplained portion of the wage gap is in-dicated in the case where the labour force had the same mean values of variables as women.The second half of the equation is often interpreted as discrimination. In such a case, the presupposition is that all the variables that have an impact on the wage differential have been taken into account and that the explained wage gap does not arise from discrimination. As was described above, such a simplified interpretation in the decomposition of the wage differentialmay be erroneous. On the one hand, the explained portion of the gender wage gap may also result from discrimination. On the other hand, it is possible that some of the factors that cause systematic differences in male and female productivity have not been taken into account in the analysis. In the former case the actual wage differential caused by discrimination is underesti-mated; in the second case that differential is overestimated.
7 – Mincer-type wage regressions represent the most widespread method for explaining wages. In the equation, the dependent variable is a natural logarithm of earnings, and various personal characteristics and occupational features are used as explanatory variables.
14
dix 2). The following were used as explan-atory variables in the equation: sex; age; squared age; nationality; knowledge of the Estonian language; knowledge of the Es-tonian language multiplied by nationality; marital status; number of children; head of household; education; working time; length of employment; employer’s form of ownership (public or private); size of employer (number of employees); occu-pation; sector; region; and the concentra-tion of women in that occupation and industry. The latter variable was found by calculating the proportion of women in the relevant industry and occupation for each employee. The real wage was used as the dependent variable.
It appears from the wage equation es-timated for both men and women that, considering the differences in personal characteristics and occupational choices, men are paid 23% more than women on average. Hence, of the initial 27.3%, 4.3 percentage points can be explained by differences in female and male human capital and in other observable factors.
The majority of the coefficients that ex-plain the impact of demographic vari-ables and the variables that indicate per-sonal characteristics and the nature of the work are statistically relevant.
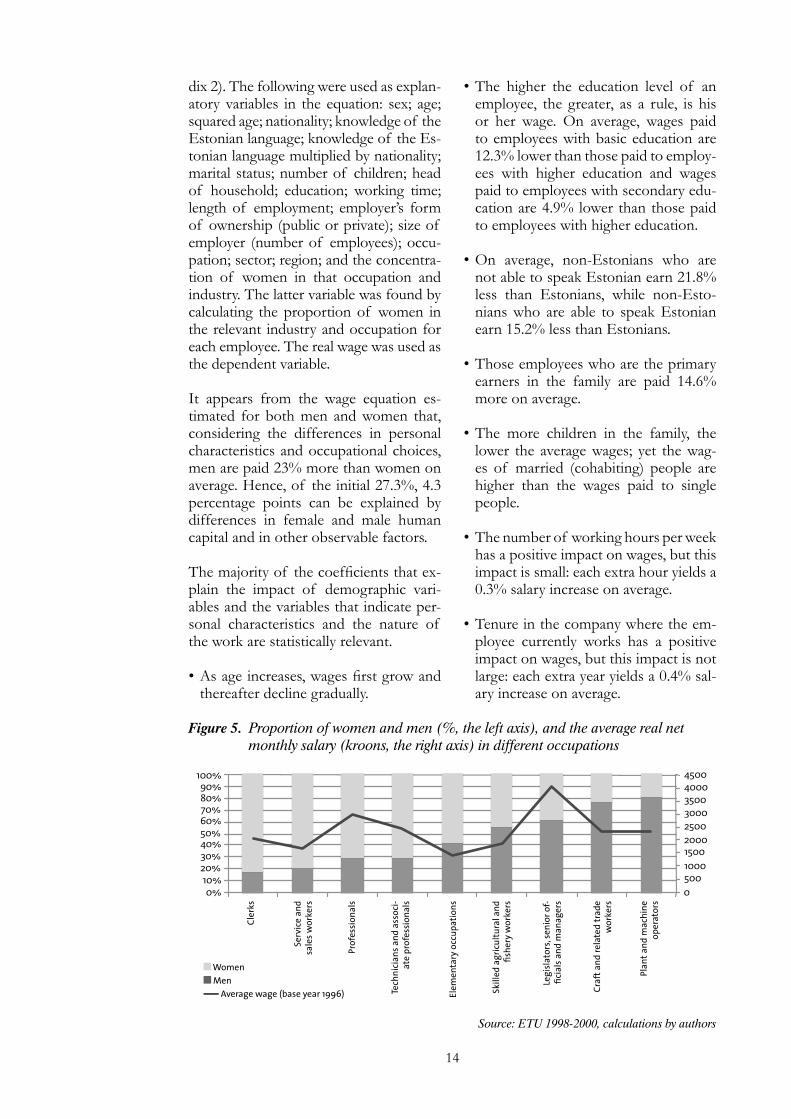
• As age increases, wages first grow andthereafter decline gradually.
• The higher the education level of an employee, the greater, as a rule, is his or her wage. On average, wages paid to employees with basic education are 12.3% lower than those paid to employ-ees with higher education and wages paid to employees with secondary edu-cation are 4.9% lower than those paid to employees with higher education.
• On average, non-Estonians who are not able to speak Estonian earn 21.8% less than Estonians, while non-Esto-nians who are able to speak Estonian earn 15.2% less than Estonians.
• Those employees who are the primary earners in the family are paid 14.6% more on average.
• The more children in the family, the lower the average wages; yet the wag-es of married (cohabiting) people are higher than the wages paid to single people.
• The number of working hours per week has a positive impact on wages, but this impact is small: each extra hour yields a 0.3% salary increase on average.
• Tenure in the company where the em-ployee currently works has a positive impact on wages, but this impact is not large: each extra year yields a 0.4% sal-ary increase on average.
Source: ETU 1998-2000, calculations by authors
Figure 5. Proportion of women and men (%, the left axis), and the average real net monthly salary (kroons, the right axis) in different occupations
Women Men
Average wage (base year 1996)
Cler
ks
Serv
ice
and
sale
s wor
kers
Prof
essi
onal
s
Tech
nici
ans a
nd a
ssoc
i-at
e pr
ofes
sion
als
Elem
enta
ry o
ccup
atio
ns
Skill
ed a
gric
ultu
ral a
nd
fishe
ryw
orke
rs
Legi
slat
ors,
seni
or o
f -fic
ials
and
man
ager
s
Craf
t and
rela
ted
trad
e w
orke
rs
Plan
t and
mac
hine
op
erat
ors

15
• Wages are lower in the private sector by 4.9% when compared to the public sec-tor.
• The greater the number of employees in a company, the higher the average wage in that company. In comparison with large companies (with more than 200 employees), wages are lower in small companies (with up to 20 em-ployees) by 19.1% and in medium-sized companies by 8.2% on average.
• In companies controlled by foreign owners wages exceed the remuneration paid in companies owned by local own-ers by 24.4% on average.
• Finally, wages are lower in the indus-tries and/or occupations where women dominate the labour force when com-pared to the industries and/or occupa-tions where men dominate the labour force.
In addition to the aforementioned ex-planatory factors, the wage equation also contains indicator variables that signify the industry, the occupation, the region where the employee lives, and the year during which the study was carried out.
Wages paid to unskilled labour are lower than wages paid in other occupations. In Tallinn wages are higher than in any other region in Estonia. Only some industries (mining, education, financial intermedia-tion, forestry, and health care) have a sig-nificant impact on wages. All other fac-tors considered, real wages were higher in the year 1999 than in the year 2000.
In addition to the regression that was based on the entire sample, we also es-timated the wage regressions of men and women separately (the estimations can be found in Appendix 2). In general, the estimates of parameters for separate male and female samples are close to the regression estimated on the basis of the entire sample. However, some important differences exist which influence the gen-der wage gap:
• Education has a greater impact on the wages of men: while the wages of women with a basic education are 8.9% lower than the wages for women with higher education on average, in the case of men the difference is as much as 15.4%. Hence, men benefit morefrom additional years of schooling than women.
Figure 6. Proportion of women and men (%, the left axis) in different sectors, and the average real net monthly salary in the particular sector (kroons, the right axis)
Hea
lth a
nd
soci
al w
ork
Hot
els a
nd
rest
aura
nts
Educ
atio
n
Fina
ncia
l int
erm
edia
tion
Who
lesa
le a
nd re
tail
trad
e
Publ
ic a
dmin
istr
atio
n an
d de
fenc
e
Real
est
ate,
rese
arch
and
co
mm
erci
al se
rvic
es
Man
ufac
turin
g
Agric
ultu
re, h
untin
g an
d fo
rest
ry
Tran
spor
tatio
n, st
orag
e an
d co
mm
unic
atio
ns
Ener
gy, g
as a
nd
wat
er su
pply
Min
ing
indu
stry
Fish
erie
s
Cons
truc
tion
Women Men
Average wage (base year 1996) Source: ETU 1998-2000, calculations by authors

16
• Knowledge of the Estonian language has a significant positive impact on thewages for non-Estonian men only; for women knowledge of languages is not a decisive factor.
• The number of children in the family does not have an effect on the earnings of men, but it has an adverse impact on women’s wages: for each child a wom-an’s earnings are lower by 3.6% on av-erage.
• With all the other factors equal, the dif-ference between wages paid to married and single people is greater in case of men than in case of women (9.3% in case of men, 4% in case of women).
• The number of worked hours has a positive impact on the wages paid to men, while it has no impact on wom-en’s wages. Each extra hour of labour yields a 0.23% salary increase for men on average.
• The earnings of men in the private sec-tor exceed the earnings of men in the public sector by 9%; for women, there is no difference.
• Segregation has a different impact on the earnings of men and women. Seg-regation does not influence the wagespaid to men – men’s wages are generally the same, no matter whether they work in an industry/occupation dominated by men or in an industry/occupation
dominated by women. On the other hand, wages earned by women who work in an industry/occupation domi-nated by women are remarkably lower than the wages earned by women work-ing in the so-called male occupations, ceteris paribus.
Depending on the method used, the wage differential arising from the composition and structure of the labour force is 8.1-9% and the wage differential that can-not be explained by observable factors is 20.5-21.4% in Estonia (see Figure 7). The explained portion of the wage gap indicates the part of the wage differen-tial that would exist even if women and men with similar observable personal and occupational characteristics were paid equally. The proportion of the un-explained wage gap exceeds the propor-tion of the explained wage gap by more than twice. Minor differences in the aver-age wages and the wage gaps found on the basis of the joint sample of men and women result from the differences in the sizes of samples. The average wage was calculated on the basis of a larger sample than the sample used in the regressions.
In the estimations concerning Estonia, the explained portion of the wage gap is relatively large when compared to most other European countries (see Figures 8 and 9), which can partly be explained by the fact that we used more control variables in our regressions for Estonia than was the case for other countries.8
Figure 7. Gender wage gap in Estonia (1999-2000): Oaxaca-Blinder decomposition
8 – It should be noted with regard to the data set out in Figures 8 and 9 that the explained portion of the gender wage gap depends on the number of control variables used. The explanatory variables used in regressions are different across surveys concerning both the EU member states and Central and Eastern European countries (both in relation to each other and in comparison with this study). Therefore, the results of OBD are not one-to-one comparable.
Unexplained wage gap Explained wage gap
Decomposition of the wage gap using equation 2
Decomposition of the wage gap using equation 1 Source: calculations by authors
In Estonia, ⅓ of the gender wage gap is explained and ⅔ is unex-plained.
17
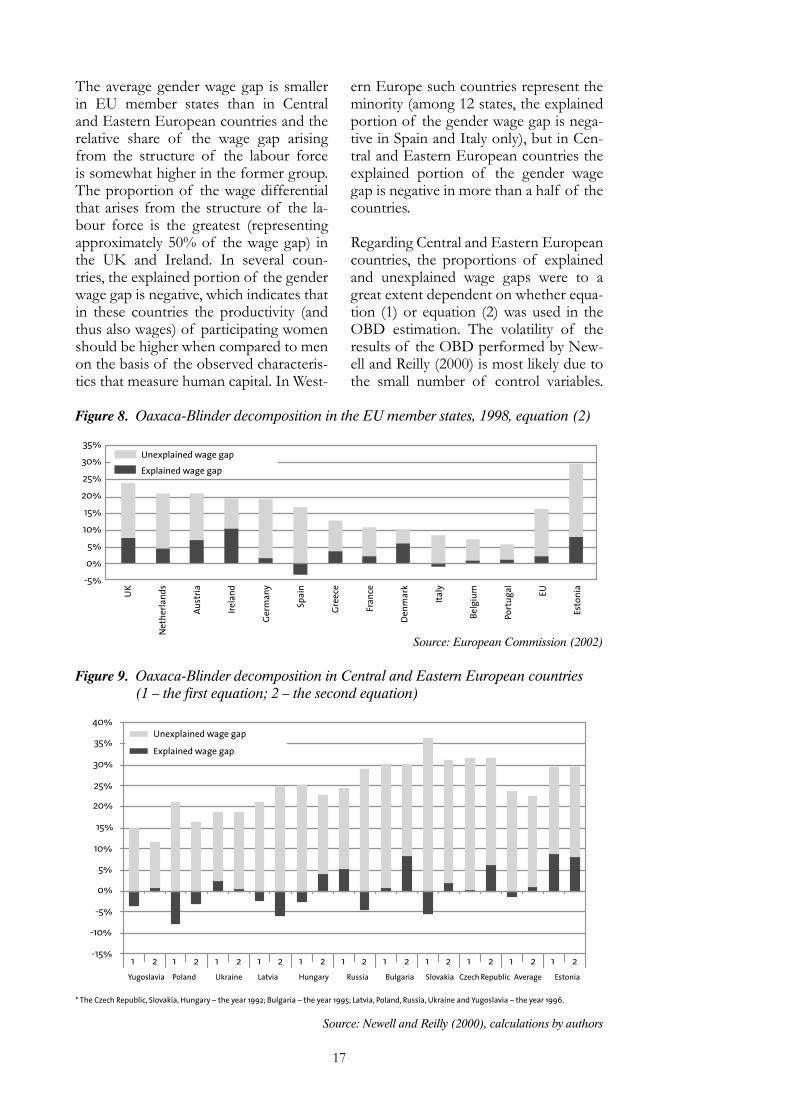
The average gender wage gap is smaller in EU member states than in Central and Eastern European countries and the relative share of the wage gap arising from the structure of the labour force is somewhat higher in the former group. The proportion of the wage differential that arises from the structure of the la-bour force is the greatest (representing approximately 50% of the wage gap) in the UK and Ireland. In several coun-tries, the explained portion of the gender wage gap is negative, which indicates that in these countries the productivity (and thus also wages) of participating women should be higher when compared to men on the basis of the observed characteris-tics that measure human capital. In West-
ern Europe such countries represent the minority (among 12 states, the explained portion of the gender wage gap is nega-tive in Spain and Italy only), but in Cen-tral and Eastern European countries the explained portion of the gender wage gap is negative in more than a half of the countries.
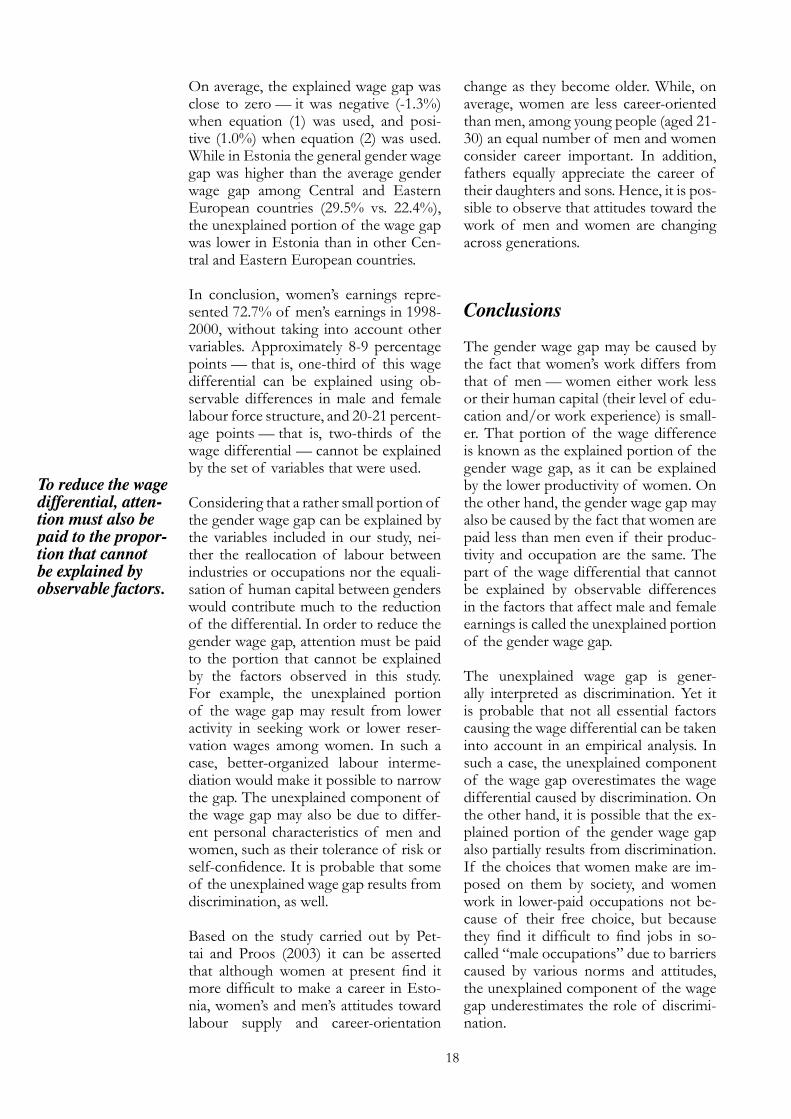
Regarding Central and Eastern European countries, the proportions of explained and unexplained wage gaps were to a great extent dependent on whether equa-tion (1) or equation (2) was used in the OBD estimation. The volatility of the results of the OBD performed by New-ell and Reilly (2000) is most likely due to the small number of control variables.
Figure 8. Oaxaca-Blinder decomposition in the EU member states, 1998, equation (2)
Figure 9. Oaxaca-Blinder decomposition in Central and Eastern European countries (1 – the first equation; 2 – the second equation)
Source: Newell and Reilly (2000), calculations by authors
* The Czech Republic, Slovakia, Hungary – the year 1992; Bulgaria – the year 1995; Latvia, Poland, Russia, Ukraine and Yugoslavia – the year 1996.
Yugoslavia Poland Ukraine Latvia Hungary Russia Bulgaria Slovakia Czech Republic Average Estonia
Unexplained wage gap
Explained wage gap
Unexplained wage gap
Explained wage gap
Source: European Commission (2002)
UK
Net
herla
nds
Aust
ria
Irela
nd
Ger
man
y
Spai
n
Gre
ece
Fran
ce
Den
mar
k
Italy
Belg
ium
Port
ugal EU
Esto
nia
18
To reduce the wage differential, atten-tion must also be paid to the propor-tion that cannot be explained by observable factors.
On average, the explained wage gap was close to zero –– it was negative (-1.3%) when equation (1) was used, and posi-tive (1.0%) when equation (2) was used. While in Estonia the general gender wage gap was higher than the average gender wage gap among Central and Eastern European countries (29.5% vs. 22.4%), the unexplained portion of the wage gap was lower in Estonia than in other Cen-tral and Eastern European countries.
In conclusion, women’s earnings repre-sented 72.7% of men’s earnings in 1998-2000, without taking into account other variables. Approximately 8-9 percentage points –– that is, one-third of this wage differential can be explained using ob-servable differences in male and female labour force structure, and 20-21 percent-age points –– that is, two-thirds of the wage differential –– cannot be explained by the set of variables that were used.
Considering that a rather small portion of the gender wage gap can be explained by the variables included in our study, nei-ther the reallocation of labour between industries or occupations nor the equali-sation of human capital between genders would contribute much to the reduction of the differential. In order to reduce the gender wage gap, attention must be paid to the portion that cannot be explained by the factors observed in this study. For example, the unexplained portion of the wage gap may result from lower activity in seeking work or lower reser-vation wages among women. In such a case, better-organized labour interme-diation would make it possible to narrow the gap. The unexplained component of the wage gap may also be due to differ-ent personal characteristics of men and women, such as their tolerance of risk or self-confidence. It is probable that someof the unexplained wage gap results from discrimination, as well.
Based on the study carried out by Pet-tai and Proos (2003) it can be asserted that although women at present find itmore difficult to make a career in Esto-nia, women’s and men’s attitudes toward labour supply and career-orientation
change as they become older. While, on average, women are less career-oriented than men, among young people (aged 21-30) an equal number of men and women consider career important. In addition, fathers equally appreciate the career of their daughters and sons. Hence, it is pos-sible to observe that attitudes toward the work of men and women are changing across generations.
Conclusions
The gender wage gap may be caused by the fact that women’s work differs from that of men –– women either work less or their human capital (their level of edu-cation and/or work experience) is small-er. That portion of the wage difference is known as the explained portion of the gender wage gap, as it can be explained by the lower productivity of women. On the other hand, the gender wage gap may also be caused by the fact that women are paid less than men even if their produc-tivity and occupation are the same. The part of the wage differential that cannot be explained by observable differences in the factors that affect male and female earnings is called the unexplained portion of the gender wage gap.
The unexplained wage gap is gener-ally interpreted as discrimination. Yet it is probable that not all essential factors causing the wage differential can be taken into account in an empirical analysis. In such a case, the unexplained component of the wage gap overestimates the wage differential caused by discrimination. On the other hand, it is possible that the ex-plained portion of the gender wage gap also partially results from discrimination. If the choices that women make are im-posed on them by society, and women work in lower-paid occupations not be-cause of their free choice, but because they find it difficult to find jobs in so-called “male occupations” due to barriers caused by various norms and attitudes, the unexplained component of the wage gap underestimates the role of discrimi-nation.
19
Of the gender wage gap, 8-9 percentage points can be explained by differences in male and female characteristics (different jobs, sectors, human capital, etc.). The rest of the gender wage gap (20-21 percentage points) cannot be ex-plained by observ-able factors.
In addition to the factors that have a di-rect impact on productivity, the gender wage gap may also result from differenc-es in male and female labour market be-haviour, as well as from a wide range of psychological factors. It has been found that women settle for lower wages and search for a job less actively than men. These differences are partly explainable by men’s higher wage expectations. How-ever, women’s reservation wages and job search intensity are lower even if other conditions remain the same. Among the psychological factors that affect wages, differences in risk tolerance, self-confi-dence, and so on among men and wom-en, could also be mentioned.
In Estonia, the male-female wage ratio has decreased since Estonia regained its independence. Structural changes in the labour market worked in favour of the reduction of the wage differential. On the one hand, the wages of high-skilled employees increased comparatively fast-er, and the average education level of women was higher than that of men. On the other hand, the industries where women dominate (mainly various fieldsof services) developed more rapidly. The gender wage gap is wider in Estonia than the average in Central and Eastern Eu-ropean countries and EU member states, which may partly have been caused by the greater-than-average general wage in-equality in Estonia.
While in the last decade the structural changes in the labour market fostered the narrowing of the gender wage gap, in the future the most influential factors willprobably be similar to these in Western countries. In developed economies the reduction of the wage differential has pri-marily resulted from an increase in aware-ness of gender issues, as well as from an increase in women’s relative education level and work experience. Similarly to other post-socialist countries, in Estonia the average education level of women ex-ceeds that of men. That difference has grown over the past ten years and should thus contribute to the reduction of the wage differential. Yet it is quite unlikely that any increase in women’s work ex-
perience would narrow the gender wage gap in Estonia in the near future. While the socialist regime was characterised by a high employment rate for women, the transition process has entailed a decrease, rather than an increase, of both partici-pation rates and average work experience among women along with an increase of unemployment in the most transition countries. The relative decline of wom-en’s work experience will presumably continue in the near future, as well.
In 1998-2000, women’s wages repre-sented 72.7% of men’s wages on average. The wage differential was larger than the average between men and women with higher education and men and women not able to speak Estonian. Of the wage differential, 8-9 percentage points (ap-proximately one-third) can be explained by differences in male and female char-acteristics (different jobs, sectors, hu-man capital, etc.). The rest of the wage differential (20-21 percentage points, i.e. approximately two-thirds) cannot be ex-plained by observable factors. Based on this study, the explained portion of the gender wage gap is larger in Estonia than in other Central and Eastern European countries, which may imply that our la-bour market is more efficient. However,estimates rendered with regard to Estonia and other Central and Eastern European countries on the basis of OBD cannot be compared one-to-one, as different vari-ables were used in the regressions.
Reducing labour market segregation as well as increasing the relative education level and work experience of women would contribute little to the narrowing of the gender wage gap. The greater part of the gender wage gap is caused by factors that cannot be observed in the regression analysis. To reduce that portion of the wage differential, the reasons behind it should be explored in more detail. In Es-tonia, women’s lower activity in seeking work and settling for lower wages have been pointed out in that context. The unexplained portion of the gender wage gap is partly due to the different person-alities of men and women and different evaluations of personal characteristics on
20
the part of employers. Some of the unex-plained wage gap probably results from discrimination.
While a substantial part of the wage differ-ential is likely to have resulted from people’s attitudes, which are expressed in the labour market behaviour of employees or in em-ployers’ choices of employees, it is difficultto directly influence theunexplainedportionof the wage gap. Efficient labour marketintermediation and a higher awareness of the reasons of the wage gap might help to reduce the portion of the gender wage gap that is related to job search activity. Higher awareness also contributes to changes in attitudes. To some extent, changes in atti-tudes and awareness can be directed with the help of legislation. In Estonia, two im-portant acts of law were adopted recently that might play a role in this regard. Effi-cient implementation of the Gender Equal-ity Act will facilitate the processing of dis-crimination cases and increase awareness in gender equality matters, while probably also influencing attitudes in hiring and remuner-ating men and women in the long run. The Parental Benefit Act may have an impacton the birth rate, women’s work experience, and employers’ expectations concerning the labour market behaviour of women. It will be possible to assess the impact of these acts in a couple of years, when they will have been in force for a longer period.
Enforcing competition would also con-tribute to the reduction of discrimina-tion. Surveys based on Gary Becker’s economic models describing discrimina-tion have shown that the more competi-tive an industry is, the less discrimination there is against women. Since discrimina-tion is costly for companies, only those employers who hire cheaper labour (that is, women) with the same qualifica-tions, are able to survive in competition. Hence, enhancement of competition and facilitation of the efficient functioning oflabour and product markets enable gov-ernments, among other aims, to ensure equal treatment of men and women.
References
Ashenfelter, O., T. Hannan (1986). Sex Discrimination and Product Market Com-petition: The Case of the Banking Indus-try. Quarterly Journal of Economics, Vol. 101. No. 1 (February) pp. 149-173.
Atonji, J. G., R. M. Blank (1999). Race and Gender in the Labour Market. Handbook of Labour Economics, Vol-ume 3C, Chapter 48.
Barber, B. M., T. Odean (2001). Boys Will Be Boys: Gender, Overconfidence,and Common Stock Investment. Quar-terly Journal of Economics, February 2001, pp. 261-292.
Becker, G. S. (1957). The Economics of Discrimination. University of Chicago Press, Chicago.
Black, D. A. (1995). Discrimination in an Equilibrium Search Model. Journal of Labour Economics, 13(2) pp. 309-324.
Black, S. E., E. Brainerd (2002). Im-porting Equality? The Impact of Glo-balization on Gender Discrimination. NBER working paper No. 9110.
Black, S. E., P. E. Strahan (2001). The Division of Spoils: Rent-Sharing and Discrimination in a Regulated Industry. American Economic Review, Vol. 91, No. 4 (September) pp. 814-831.
Blau, F. D., L. M. Kahn (1992). The Gender Earnings Gap: Learning from International Comparisons. American Economic Review Vol. 82, No. 2, pp. 533-538.
Blau, F. D., L. M. Kahn (2000) Gender Differences in Pay. Journal of Econom-ic Perspectives, Vol. 14, No. 4 (Autumn 2000) pp. 75-99.
Council of the European Union (2003). Council Decision of 22 July 2003 on guidelines for the employment policies of the Member States (2003/578/EC).
European Commission (2002) Employ-ment in Europe 2002, Recent trends and prospects, Luxembourg: Office forOfficial Publications of the EuropeanUnion.
Gneezy, U., M. Niederle, A. Rustichini (2002). Performance in Competitive En-vironments: Gender Differences. Quar-terly Journal of Economics, forthcoming.
Hellerstein, J. K., D. Neumark, K. R. Troske (2002). Market Forces and

21
Sex Discrimination. Journal of Human Resources, Vol. 37, No. 2 (Spring), pp. 353-380. Hinnosaar, M. (2003). Reser-vation Wages in Estonia. Bank of Esto-nia Working Papers 2003, No. 1.
Hinnosaar, M., T. Rõõm (2003). The Im-pact of Minimum Wage on The Labour Market in Estonia: An Empirical Analysis. Bank of Estonia Working Papers 2003, No. 8. Hunt, J. (1998) The Transition in East Germany: When is a Ten Percent Fail in the Gender Pay Gap Bad News. CEPR Discussion Paper Series in Transi-tion Economics, No. l, 805.
Jolliffe, D. (2001). The Gender Wage Gap in Bulgaria: A Semiparametric Es-timation of Discrimination. William Davidson Working Paper No. 401.
Jurajda, S. (2000). Gender Wage Gap and Segregation in Late Transition. William Davidson Institute Working Paper No. 306.
Jurajda, S., H. Harmgart (2002). Sex Segregation and Wage Gaps in East and West Germany. Working Paper.
Kroncke, C., K. Smith (1999). The Wage Effects of Ethnicity in Estonia. Econom-ics of Transition, Vol. 7, pp. 179-199.
Kuddo, A., R. Leetmaa, L. Leppik, M. Luuk, A. Võrk (2002). Sotsiaaltoetuste efektiivsus ja mõju tööjõupakkumisele (The Efficiency and Impact on LabourSupply of Social Benefits), PRAXISCenter for Policy Studies, Tallinn.
Leetmaa, R. and A. Võrk (2003). Pere-toetuste mõju pereplaneerimisele ja riigieelarvele (The Impact of Family Benefits on Family Planning and StateBudget), PRAXIS Center for Policy Studies, Policy Study No. 5/2003.
Lehmann, E., S. Warning (2001). Deci-sion Making and Gender Differences: A 15 Million DM Game. Behavioral and Experimental Economic Abstracts, Working Paper Series, Vol. 2 (19).
Moffitt, R. A. (1999). New Developments in Econometric Methods for Labour Mar-ket Analysis. Handbook of Labour Eco-nomics, Vol. 3A, Chapter 24, pp. 1367-1398. Mortensen, D. T. (1986). Job Search and Labour Market Analysis. Handbook of Labour Economics, Vol. 2.
Mortensen, D. T., C. A. Pissarides (1999). New Developments on Models of Search in the Labour Market. Hand-
book of Labor Economics, Part 3B, Chapter 39.
Neumark, D. (1993). Sex Discrimination and Women’s Labor Market Interrup-tions. NBER Working Paper No. 4260.
Newell, A., B. Reilly (2000). The Gen-der Pay Gap in the Transition from Communism: Some Empirical Evi-dence. William Davidson Institute Working Paper No. 305.
Noorkõiv, R., P. F. Orazem, A. Puur, M. Vodopivec (1997). How Esto-nia’s Economic Transition Affected Employment and Wages (1989-1995). World Bank Policy Research Working Paper 1837.
Oaxaca, R. L. (1973). Male-Female Wage Differentials in Urban Labor Markets. International Economic Review, Vol. 14, pp. 693–709.
Orazem, P. E, M. Vodopivec (2000). Male-Female Differences in Labor Mar-ket Outcomes during the Early Transition to Market: The Case of Estonia and Slov-enia. The World Bank Working Paper.
Pettai, L, Proos, I. (2003) Naiste ja meeste positsioon ühiskonnas. Bar-jäärid ja eelarvamused (The Position of Men and Women in Society. Bar-riers and Prejudices) The Estonian Institute for Open Society, Gender Equality Monitoring Results http://www.sm.ee/gopro30/Web/ pages/sotskalvaldkond0060 [3.09.2004]
Philips, K. (2001). The Changes in Valu-ation of Human Capital During the Transition Process in Estonia, Disser-tationes Rerum Oeconomicarum Uni-versitas Tartuensis No. 6, Tartu 2001.
Pissarides, C. A. (2000). Equilibrium Unemployment Theory. The MIT Press, Second Edition. Rõõm, T. (2004). Search Intensity and Wage Differences. Bank of Estonia Working Papers 2004 No. l.
The Gender Equality Act, RTI 21.04.2004, 27,181.
Ministry of Social Affairs (1999). Jagatud õigused ja vastutus. Sooline võrdõiguslikkus Eestis (toim. M. Järve) (Shared Rights and Responsibility. Gen-der Equality in Estonia (ed. M. Järve)).
Sunden, A., and B. J. Surette (1998). Gender Differences in the Allocation of Assets in Retirement Saving Plans. Amer-ican Economic Review, Vol. 63 (3).
22
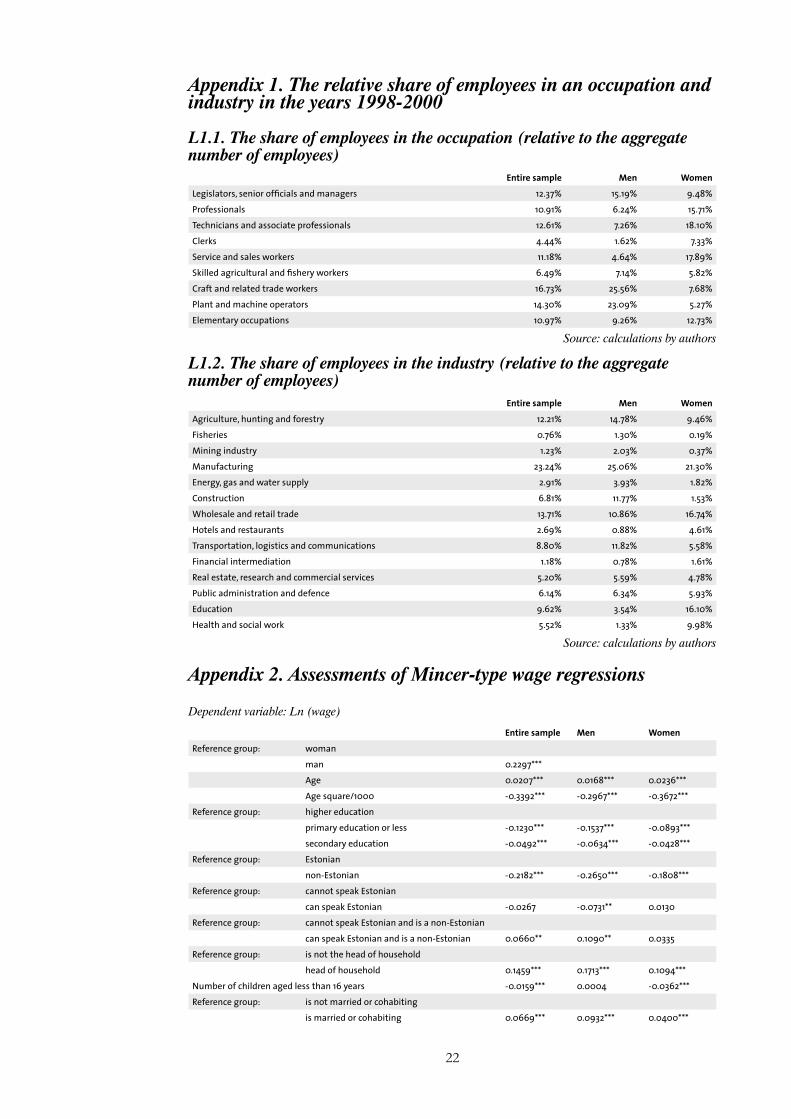
Appendix 1. The relative share of employees in an occupation and industry in the years 1998-2000
L1.1. The share of employees in the occupation (relative to the aggregate number of employees)
Entire sample Men Women
Legislators, senior officials and managers 12.37% 15.19% 9.48%
Professionals 10.91% 6.24% 15.71%
Technicians and associate professionals 12.61% 7.26% 18.10%
Clerks 4.44% 1.62% 7.33%
Service and sales workers 11.18% 4.64% 17.89%
Skilled agricultural and fishery workers 6.49% 7.14% 5.82%
Craft and related trade workers 16.73% 25.56% 7.68%
Plant and machine operators 14.30% 23.09% 5.27%
Elementary occupations 10.97% 9.26% 12.73%
Source: calculations by authors
L1.2. The share of employees in the industry (relative to the aggregate number of employees)
Entire sample Men Women
Agriculture, hunting and forestry 12.21% 14.78% 9.46%
Fisheries 0.76% 1.30% 0.19%
Mining industry 1.23% 2.03% 0.37%
Manufacturing 23.24% 25.06% 21.30%
Energy, gas and water supply 2.91% 3.93% 1.82%
Construction 6.81% 11.77% 1.53%
Wholesale and retail trade 13.71% 10.86% 16.74%
Hotels and restaurants 2.69% 0.88% 4.61%
Transportation, logistics and communications 8.80% 11.82% 5.58%
Financial intermediation 1.18% 0.78% 1.61%
Real estate, research and commercial services 5.20% 5.59% 4.78%
Public administration and defence 6.14% 6.34% 5.93%
Education 9.62% 3.54% 16.10%
Health and social work 5.52% 1.33% 9.98%
Source: calculations by authors
Appendix 2. Assessments of Mincer-type wage regressions
Dependent variable: Ln (wage)
Entire sample Men Women
Reference group: woman
man 0.2297***
Age 0.0207*** 0.0168*** 0.0236***
Age square/1000 -0.3392*** -0.2967*** -0.3672***
Reference group: higher education
primary education or less -0.1230*** -0.1537*** -0.0893***
secondary education -0.0492*** -0.0634*** -0.0428***
Reference group: Estonian
non-Estonian -0.2182*** -0.2650*** -0.1808***
Reference group: cannot speak Estonian
can speak Estonian -0.0267 -0.0731** 0.0130
Reference group: cannot speak Estonian and is a non-Estonian
can speak Estonian and is a non-Estonian 0.0660** 0.1090** 0.0335
Reference group: is not the head of household
head of household 0.1459*** 0.1713*** 0.1094***
Number of children aged less than 16 years -0.0159*** 0.0004 -0.0362***
Reference group: is not married or cohabiting
is married or cohabiting 0.0669*** 0.0932*** 0.0400***
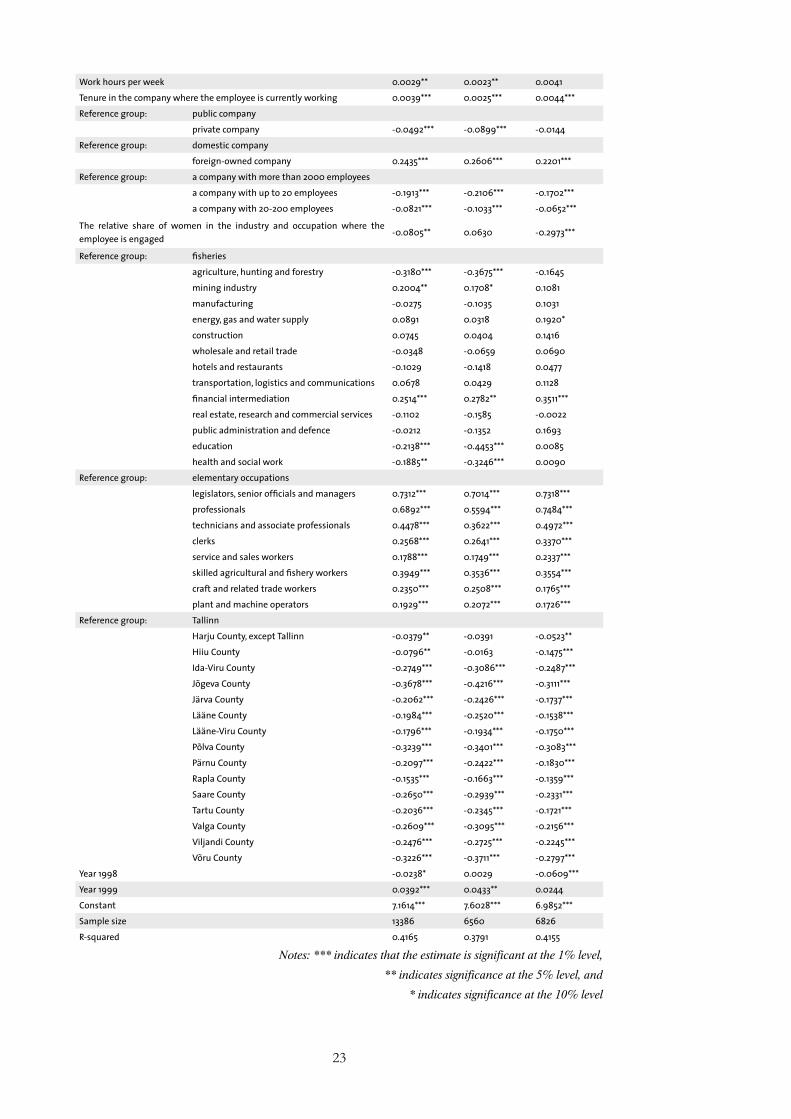
23
Work hours per week 0.0029** 0.0023** 0.0041
Tenure in the company where the employee is currently working 0.0039*** 0.0025*** 0.0044***
Reference group: public company
private company -0.0492*** -0.0899*** -0.0144
Reference group: domestic company
foreign-owned company 0.2435*** 0.2606*** 0.2201***
Reference group: a company with more than 2000 employees
a company with up to 20 employees -0.1913*** -0.2106*** -0.1702***
a company with 20-200 employees -0.0821*** -0.1033*** -0.0652***
The relative share of women in the industry and occupation where the employee is engaged
-0.0805** 0.0630 -0.2973***
Reference group: fisheries
agriculture, hunting and forestry -0.3180*** -0.3675*** -0.1645
mining industry 0.2004** 0.1708* 0.1081
manufacturing -0.0275 -0.1035 0.1031
energy, gas and water supply 0.0891 0.0318 0.1920*
construction 0.0745 0.0404 0.1416
wholesale and retail trade -0.0348 -0.0659 0.0690
hotels and restaurants -0.1029 -0.1418 0.0477
transportation, logistics and communications 0.0678 0.0429 0.1128
financial intermediation 0.2514*** 0.2782** 0.3511***
real estate, research and commercial services -0.1102 -0.1585 -0.0022
public administration and defence -0.0212 -0.1352 0.1693
education -0.2138*** -0.4453*** 0.0085
health and social work -0.1885** -0.3246*** 0.0090
Reference group: elementary occupations
legislators, senior officials and managers 0.7312*** 0.7014*** 0.7318***
professionals 0.6892*** 0.5594*** 0.7484***
technicians and associate professionals 0.4478*** 0.3622*** 0.4972***
clerks 0.2568*** 0.2641*** 0.3370***
service and sales workers 0.1788*** 0.1749*** 0.2337***
skilled agricultural and fishery workers 0.3949*** 0.3536*** 0.3554***
craft and related trade workers 0.2350*** 0.2508*** 0.1765***
plant and machine operators 0.1929*** 0.2072*** 0.1726***
Reference group: Tallinn
Harju County, except Tallinn -0.0379** -0.0391 -0.0523**
Hiiu County -0.0796** -0.0163 -0.1475***
Ida-Viru County -0.2749*** -0.3086*** -0.2487***
Jõgeva County -0.3678*** -0.4216*** -0.3111***
Järva County -0.2062*** -0.2426*** -0.1737***
Lääne County -0.1984*** -0.2520*** -0.1538***
Lääne-Viru County -0.1796*** -0.1934*** -0.1750***
Põlva County -0.3239*** -0.3401*** -0.3083***
Pärnu County -0.2097*** -0.2422*** -0.1830***
Rapla County -0.1535*** -0.1663*** -0.1359***
Saare County -0.2650*** -0.2939*** -0.2331***
Tartu County -0.2036*** -0.2345*** -0.1721***
Valga County -0.2609*** -0.3095*** -0.2156***
Viljandi County -0.2476*** -0.2725*** -0.2245***
Võru County -0.3226*** -0.3711*** -0.2797***
Year 1998 -0.0238* 0.0029 -0.0609***
Year 1999 0.0392*** 0.0433** 0.0244
Constant 7.1614*** 7.6028*** 6.9852***
Sample size 13386 6560 6826
R-squared 0.4165 0.3791 0.4155
Notes: *** indicates that the estimate is significant at the 1% level,
** indicates significance at the 5% level, and
* indicates significance at the 10% level
Published in English:
9/2005 Business Support Measures in the State Budget Strategy for 2007-2013
Authors: Anne Jürgenson, Tarmo Kalvet, Rainer Kattel
The objective of the study is to develop proposals for priorities and measures for the support of busi-ness, and their hierarchy, in the single programming document for 2007-2013. The recommendations are based on a survey conducted among 810 companies. The results of the survey indicate lack of co-operation, limited development activities that are not related to subcontracting activities as well as lack of skilled workers as main inhibitors of development. The authors make recommendations for supporting businesses in a way that enables them to move into activities and fields that allow rapid increases in pro-ductivity and inter-company cooperation as a result of which positive feedback mechanisms are created. In conclusion, Estonia must essentially create an industrial policy that has been lacking to date.
4/2002 Digital Divide in Estonia and How to Bridge It. Executive Summary
Authors: Mari Kalkun (Emor), Tarmo Kalvet (PRAXIS)
The study focuses on social aspects of information and communication technology use in Estonia. The issue of digital divide has not enjoyed much attention, although several empirical surveys indicate that the problem does exist in the country. There exist certain groups of the population who do not use the Internet at all. At the same time, it is obvious that information technology can help raise productivity. Hence, it will be paramount to tackle the problem of digital divide more than has been until now. The authors make policy recommendations for popularising information and communication technology in order to encourage computer and Internet use among Estonian population.
Policy Analysis is a series of PRAXIS Center for Policy Studies publications that aim to study Estonian social and economic policies, indicate alternative solutions and support public debate. The views expressed in these publications are those of the au-thors. The copyrights of the publications belong to PRAXIS Center for Policy Stud-ies. Please provide correct references when quoting information contained in these publications.
PRAXIS Center for Policy Studies is an independent, non-profit think-thank thataims to improve and contribute to the poli-cy-making process by conducting independ-ent research, providing strategic counsel to policy makers and fostering public debate.
PRAXIS Center for Policy Studies address: Estonia pst. 3/5, 10143 Tallinn, EstoniaTel (372) 6 409 000, fax (372) 6 409 001, www.praxis.ee.Ordering of publications: [email protected]
ISSN 1406-7471
ISBN 9985-9535-7-6
POLICY ANALYSIS BY PRAXIS