labour market transitions of young women and men in egypt pdf
TRANSCRIPT
Ghada Barsoum, Mohamed Ramadan and Mona Mostafa
June 2014
Labour market transitions of young women and men in Egypt
This report presents the highlights of the 2012 School-to-work Transition Survey (SWTS) run together with the Central Agency for Public Mobilization and Statistics (CAPMAS) within the framework of the ILO Work4Youth Project. This Project is a five-year partnership between the ILO and The MasterCard Foundation that aims to promote decent work opportunities for young men and women through knowledge and action. The W4Y Publication Series is designed to disseminate data and analyses from the SWTS administered by the ILO in 28 countries covering five regions of the world. The SWTS is a unique survey instrument that generates relevant labour market information on young people aged 15 to 29 years. The survey captures longitudinal information on transitions within the labour market, thus providing evidence of the increasingly tentative and indirect paths to decent and productive employment that today’s young men and women face.
The W4Y Publications Series covers national reports, with main survey findings and details on current national policy interventions in the area of youth employment, and regional synthesis reports that highlight regional patterns in youth labour market transitions and distinctions in national policy frameworks.
No. 16
For more information, visit our website: www.ilo.org/w4yYouth Employment Programme4 route des MorillonsCH-1211 Genève 22Switzerland [email protected]
Publication Series
Youth Employment ProgrammeEmployment Policy Department
LAB
OU
R MA
RKET TRA
NSITIO
NS O
F YOU
NG W
OM
EN A
ND M
EN IN
EGYPTILO
ISSN 2309-6780

Work4Youth Publication Series No. 16
Labour market transitions of young women and men in Egypt
Ghada Barsoum, Mohamed Ramadan and Mona Mostafa
International Labour Office ● Geneva
June 2014
Copyright © International Labour Organization 2014
First published 2014
Publications of the International Labour Office enjoy copyright under Protocol 2 of the Universal Copyright Convention. Nevertheless, short
excerpts from them may be reproduced without authorization, on condition that the source is indicated. For rights of reproduction or translation, application should be made to the Publications Bureau (Rights and Permissions), International Labour Office, CH-1211 Geneva
22, Switzerland, or by email: [email protected]. The International Labour Office welcomes such applications
Libraries, institutions and other users registered with reproduction rights organizations may make copies in accordance with the licences issued to them for this purpose. Visit www.ifrro.org to find the reproduction rights organization in your country.
ILO Cataloguing in Publication Data
Barsoum, Ghada; Ramadan, Mohamed; Mostafa, Mona
Labour market transitions of young women and men in Egypt / Ghada Barsoum, Mohamed Ramadan and Mona Mostafa; International
Labour Office, Youth Employment Programme, Employment Policy Department - Geneva: ILO, 2014
Work4Youth publication series, No. 16; ISSN 2309-6780; 2309-6799 (web pdf )
International Labour Office; Employment Policy Dept
youth employment / youth unemployment / youth / transition from school to work / data collecting / methodology / Egypt
13.01.3
Cover design by Creative Cow
The designations employed in ILO publications, which are in conformity with United Nations practice, and the presentation of material
therein do not imply the expression of any opinion whatsoever on the part of the International Labour Office concerning the legal status of
any country, area or territory or of its authorities, or concerning the delimitation of its frontiers.
The responsibility for opinions expressed in signed articles, studies and other contributions rests solely with their authors, and publication
does not constitute an endorsement by the International Labour Office of the opinions expressed in them.
Reference to names of firms and commercial products and processes does not imply their endorsement by the International Labour Office, and any failure to mention a particular firm, commercial product or process is not a sign of disapproval.
ILO publications can be obtained through major booksellers or ILO local offices in many countries, or directly from ILO Publications, International Labour Office, CH-1211 Geneva 22, Switzerland. Catalogues or lists of new publications are available free of charge from the
above address, or by email: [email protected]
Visit our website: www.ilo.org/publns
Printed by the International Labour Office, Geneva, Switzerland
iii
Preface
Youth is a crucial time of life when young people start realizing their aspirations,
assuming their economic independence and finding their place in society. The global jobs
crisis has exacerbated the vulnerability of young people in terms of: i) higher
unemployment, ii) lower quality jobs for those who find work, iii) greater labour market
inequalities among different groups of young people, iv) longer and more insecure school-
to-work transitions, and v) increased detachment from the labour market.
In June 2012, the International Labour Conference of the ILO resolved to take urgent
action to tackle the unprecedented youth employment crisis through a multi-pronged
approach geared towards pro-employment growth and decent job creation. The resolution
“The youth employment crisis: A call for action” contains a set of conclusions that
constitute a blueprint for shaping national strategies for youth employment.1 It calls for
increased coherence of policies and action on youth employment across the multilateral
system. In parallel, the UN Secretary-General highlighted youth as one of the five
generational imperatives to be addressed through the mobilization of all the human,
financial and political resources available to the United Nations (UN). As part of this
agenda, the UN has developed a System-wide Action Plan on Youth, with youth
employment as one of the main priorities, to strengthen youth programmes across the UN
system.
The ILO supports governments and social partners in designing and implementing
integrated employment policy responses. As part of this work, the ILO seeks to enhance
the capacity of national and local level institutions to undertake evidence-based analysis
that feeds social dialogue and the policy-making process. To assist member States in
building a knowledge base on youth employment, the ILO has designed the “school-to-
work transition survey” (SWTS). The current report, which presents the results of the
survey in Egypt, is a product of a partnership between the ILO and The MasterCard
Foundation. The “Work4Youth” Project entails collaboration with statistical partners and
policy-makers of 28 low- and middle-income countries to undertake the SWTS and assist
governments and the social partners in the use of the data for effective policy design and
implementation.
It is not an easy time to be a young person in the labour market today. The hope is
that with leadership from the UN system, with the commitment of governments, trade
unions and employers’ organization and through the active participation of donors such as
The MasterCard Foundation, the international community can provide the effective
assistance needed to help young women and men make a good start in the world of work.
If we can get this right, it will positively affect young people’s professional and personal
success in all future stages of life.
Azita Berar Awad
Director
Employment Policy Department
Yousef Qaryouti
Director
ILO Country Office for Egypt, Eritrea and
Sudan
1 The full text of the 2012 resolution “The youth employment crisis: A call for action” can be found
on the ILO website at: http://www.ilo.org/ilc/ILCSessions/101stSession/texts-
adopted/WCMS_185950/lang--en/index.htm.

v
Contents
Page
Preface ............................................................................................................................................... iii
Contents ............................................................................................................................................. v
Acknowledgements ........................................................................................................................... ix
1. Introduction and main findings ............................................................................................... 1
1.1 Overview ....................................................................................................................... 1
1.2 Main findings ................................................................................................................ 1
1.3 Structure of the report ................................................................................................... 4
2. Overview of the Egyptian labour market and survey methodology ........................................ 4
2.1 The socio-economic context ......................................................................................... 4
2.2 The labour market in Egypt .......................................................................................... 5
2.3 The school-to-work transition survey: Objectives and methodology ........................... 7
2.3.1 Questionnaire development ................................................................................ 8
2.3.2 Sample design and selection ............................................................................... 8
3. Characteristics of youth in Egypt ............................................................................................ 9
3.1 The demographic characteristics of youth .................................................................... 9
3.2 Educational attainment ................................................................................................. 10
3.3 Current activity status of youth ..................................................................................... 15
3.4 Aspirations and life goals ............................................................................................. 18
3.5 Characteristics of employed youth ............................................................................... 18
3.5.1 Wage and salaried employment .......................................................................... 20
3.5.2 Self-employment ................................................................................................ 22
3.5.3 Hours of work and involuntary part-time work .................................................. 23
3.5.4 Other job-quality indicators ................................................................................ 23
3.5.5 Security and satisfaction ..................................................................................... 28
3.6 Characteristics of unemployed youth............................................................................ 29
3.7 Characteristics of youth outside the labour market (inactive youth) ............................ 34
3.8 Characteristics of young students ................................................................................. 35
4. The stages of transition ........................................................................................................... 36
4.1 Concepts and definitions ............................................................................................... 36
4.2 Stages of transition........................................................................................................ 37
4.2.1 Youth who had not started the transition ............................................................ 39
4.2.2 Youth in transition .............................................................................................. 40
4.3 Characteristics of a completed transition ...................................................................... 40
4.4 Transition paths and length ........................................................................................... 42
5. Relevant institutional and policy frameworks, and policy implications ................................. 45
vi
References ........................................................................................................................................ 48
Annex I. Definitions of labour market statistics ................................................................................ 49
Annex II. Additional statistical tables ............................................................................................... 51
Annex III. Sampling framework of SWTS-Egypt, 2012 ................................................................... 59
Tables
2.1 Macroeconomic indicators for the Egyptian economy, 2010–13 ................................. 5
2.2 Key labour market indicators for the working-age population (15 and older) by
economic status, area of residence and sex, 2012 ......................................................... 6
2.3 Working-age population (15 and older) status in employment by sex, 2012 (%) ........ 6
2.4 Employed population (15 and older) by main sector of economic activity, area of
residence and sex, 2012 (%) ......................................................................................... 7
2.5 Employed population (15 and older) by type of employment establishment and
sex (%) .......................................................................................................................... 7
3.1 Youth population by selected characteristics ................................................................ 9
3.2 Youth migrants by previous residence, reason for moving, sex and area of
residence ....................................................................................................................... 10
3.3 Youth with less than secondary-level education by reason for leaving ........................ 13
3.4 Youth’s mothers and fathers by educational attainment ............................................... 13
3.5 Educational attainment of respondent in comparison to their parents (%) ................... 14
3.6 Youth by main current activity status and sex .............................................................. 15
3.7 Key labour market indicators for youth by sex, 2012 (%) ............................................ 15
3.8 NEET youth by area of residence and sex .................................................................... 16
3.9 Youth by educational attainment level and current activity status (completed
education and youth still in school, %) ......................................................................... 17
3.10 Out-of-school youth and youth with no schooling by current activity status and
sex ................................................................................................................................. 17
3.11 Youth by primary life goal, current activity status and sex .......................................... 18
3.12 Employed youth by employment status and sex ........................................................... 19
3.13 Employed youth by aggregate sector and sex ............................................................... 19
3.14 Employed youth by sector at the 1-digit level and sex (%) .......................................... 19
3.15 Employed youth by occupation and sex ....................................................................... 20
3.16 Young wage and salaried workers by access to benefits/entitlements and sex ............. 21
3.17 Young wage and salaried workers by type of contract, area of residence and sex ....... 21
3.18 Self-employed youth by reason for self-employment and area of residence ................ 22
3.19 ISCO major groups and education levels...................................................................... 25
3.20 Overeducated and undereducated young workers by major occupational category
(ISCO-08, %) ................................................................................................................ 25
3.21 Wage and salaried youth by occupation, sex and monthly wage (in Egyptian
pounds) ......................................................................................................................... 27
3.22 Employed youth in informal employment by sub-category, area of residence and
sex (%) .......................................................................................................................... 28

vii
3.23 Unemployed youth by job search duration and sex ...................................................... 30
3.24 Unemployed youth by main obstacle to finding work, sex and area of residence
(%) ................................................................................................................................ 31
3.25 Employed and unemployed youth by job search method ............................................. 32
3.26 Unemployed youth by occupation sought, sex and area of residence (%).................... 32
3.27 Unemployed youth by type of employer sought, sex and area of residence (%) .......... 33
3.28 Youth unemployment (strict and relaxed definition) and discouragement ................... 34
3.29 Inactive youth by reasons for inactivity and sex ........................................................... 35
4.1 Youth population by transition stage and sex ............................................................... 37
4.2 Youth population by stage of transition, age group, sex, area of residence and
household income level ................................................................................................ 39
4.3 Youth in transition and transited by sub-category, sex, area of residence and
levels of household income and completed educational attainment (%) ...................... 41
4.4 Transited youth by sub-category and occupation (%) .................................................. 42
4.5 Youth who completed the transition by flows to s and/or satisfactory employment .... 43
4.6 Indicators on the path of transition for youth who completed their labour market
transition by sex ............................................................................................................ 44
A.1 Self-employed youth (own-account workers and employers) by problem in
running the business, area of residence and sex ........................................................... 51
A.2 Self-employed youth (own-account workers and employers) by source of funding
to start their current activity, area of residence and sex ................................................ 52
A.3 Self-employed youth (own-account workers and employers) by use of financial
instruments to cover the expenses required to maintain their current activity, area
of residence and sex ...................................................................................................... 52
A.4 Employed youth by satisfaction with current job, area of residence and sex ............... 53
A.5 Employed youth by willingness to migrate for employment purposes and sex ............ 53
A.6 Unemployed youth who had refused a job by reason for refusal and sex..................... 54
A.7 Current students by desired future employer and sex (%) ............................................ 54
A.8 Youth who had not yet started their transition by sub-category and sex ...................... 54
A.9 Youth population by use of financial instruments, area of residence and sex .............. 54
A.10 Youth by source of financial services, area of residence and sex ................................. 55
A.11 Employed youth by union membership and sex ........................................................... 56
A.12 Employed youth by company size, area of residence and sex ...................................... 56
A.13 Employed youth by type of job-oriented training received and sex ............................. 57
A.14 In-school youth by highest expected level of educational attainment, area of
residence and sex .......................................................................................................... 57
A.15 Share of young students combining work and study by area of residence and sex ...... 58
Figures
3.1 Youth by educational status and sex ............................................................................. 11
3.2 Youth by level of completed educational attainment (%)............................................. 11
3.3 Youth by level of completed educational attainment, sex and area of residence ......... 12

viii
3.4 Cross-tabulation of youth’s and parents’ educational attainment ................................. 14
3.5 Youth employment by actual hours worked per week and sex..................................... 23
3.6 Indicators measuring the quality of youth employment................................................ 24
3.7 Employed youth who would like to change their job by reason ................................... 29
3.8 Youth unemployment rates by level of completed educational attainment and sex ..... 30
3.9 Unemployed youth by occupation sought and employed youth by occupation ............ 33
3.10 Current young students by preferred future occupation................................................ 35
4.1 Youth population by sub-category of transition stage .................................................. 38
4.2 Youth in transition by levels of household income and completed educational
attainment ..................................................................................................................... 40
4.3 Youth who completed the transition by length of transition and sex ............................ 44
Boxes
1. Definition of youth...............................................................................................................................8
2. Work4Youth: An ILO project in partnership with The MasterCard Foundation ................................8
3. Approaches to boost aggregate demand and promote youth employment ........................................46

ix
Acknowledgements
The 2012 school-to-work transition survey in Egypt was implemented by the Central
Agency for Public Mobilization and Statistics (CAPMAS) with funding from the ILO
“Work4Youth” partnership with The MasterCard Foundation. The ILO is extremely
grateful to the CAPMAS team led by Mrs Rawia Batrawy.
The authors take this opportunity to thank members of the ILO Work4Youth team –
Sara Elder, for substantive input to the document and Yonca Gurbuzer, for technical
support and valuable input during all stages of the survey. Sincere thanks also to Christine
Hofmann, Skills and Employability Specialist, ILO Decent Work Team for North Africa,
and to Gianni Rosas, Coordinator, ILO Youth Employment Programme, for his continuing
support of the Work4Youth Project.
Finally, the ILO would like to acknowledge the support of The MasterCard
Foundation in allowing the research to move forward, under the scope of the Work4Youth
partnership.

1
1. Introduction and main findings
1.1 Overview
Young people entering the labour market in Egypt face a number of severe constraints.
The Egyptian economy is currently suffering from the ramifications of two major events:
continuous political instability following the January 2011 revolution and the slowdown in
global growth subsequent to the 2008 economic crisis. These two events have had a serious
negative impact on job creation in the country. At the same time, the large number of youth,
who comprise about one-fifth of the population and add approximately 600,000 new entrants
to the labour market each year, puts further stress on the Egyptian employment situation and
its already limited opportunities.
The Egyptian Government has long had youth employment on its agenda. The Youth
Employment National Action Plan (2010–15) outlines Egypt’s strategy towards more and
better jobs for youth. The Action Plan identified three priority areas including technical
education and vocational training, enterprise development and labour market policies and
programmes.
To characterize the specific youth employment challenges and to support policy-
makers in designing adequate instruments to support the transition of young people into
employment, the ILO has developed its school-to-work transition survey (SWTS), a
household survey of young people aged 15–29. The SWTS, implemented in Egypt in 2012,
serves as a principal tool to monitor the impact of policies and programmes outlined in
national instruments. This report is intended for the policy-makers and social partners who
are concerned with the implementation, monitoring and evaluation of youth-related policies
and programmes in the country.
The indicators generated from the survey and analysed in this report aim to present a
much more detailed picture of youth in the labour market than that usually derived through
standard surveys, including the labour force survey. Youth unemployment is a major
national concern in the country, particularly after the 2011 revolution. The analysis provided
in this report highlights two major and specific issues pertaining to the labour market in
Egypt. The first relates to young women’s very low labour force participation and high
unemployment rates. The second relates to the poor quality of jobs held by young men and
women, even among those who have completed their labour market transition.
1.2 Main findings
Despite increasing educational attainment, young people in Egypt are underutilized:
unemployment affects one-sixth of the economically active youth population (15.7 per
cent), and almost one-third (29.0 per cent) of youth in Egypt are neither in education nor
in employment or training (NEET youth).
Young people in Egypt today are more educated than their parents. Despite an increase
in educational attainment among both male and female youth, approximately one-sixth of
youth in the labour market are unemployed (15.7 per cent). The youth unemployment rate is
higher than the 2012 global average of 12.4 per cent (ILO, 2013) but lower than the regional
average for the Middle East (28.3 per cent in 2012) and lower than in other
countries/territories of the region in which the SWTS was also implemented (Tunisia at 31.8

2
per cent and the Occupied Palestinian Territory at 37.0 per cent).2 “Relaxing” the definition
of unemployment, by including those who are not working yet available to work but not
actively searching for work, increases the youth unemployment rate to 22.8 per cent.
Moreover, almost one-third of youth in Egypt (29.0 per cent) fall in the NEET category;
they are not in employment, education or training.
The burden of unemployment in Egypt falls particularly on young women and the
more highly educated.
The unemployment rate of young females is more than five times that of young males
(38.1 per cent versus 6.8 per cent). The unemployment-to-population ratio is 11.9 per cent
among female youth compared to 5.2 per cent among male youth.
Almost one-half of unemployed young people have completed university-level
education or above (44.5 per cent of the unemployed). The second largest group of
unemployed are technical vocational education and training (TVET)3 graduates (38.4 of the
unemployed). Very telling is that almost one-third (30.0 per cent) of unemployed youth
refused a job because the candidates felt the prospective job did not match their level of
qualification. These statistics confirm a severe shortage of jobs in the occupations requiring
higher skills.
The youth unemployment rate increases with each additional level of educational
attainment; tertiary-level graduates have the highest rate at 34.0 per cent, compared to only
2.4 per cent among youth with less than primary-level education. However, important
differences are apparent by sex. For young women, the highest unemployment rate is among
those with general secondary-level education (at an incredible 76.0 per cent); the rates then
decrease as the education level increases (56.0 per cent for female youth above the
intermediate level and 46.9 per cent for female university graduates). The unemployment
rates of young Egyptian men, in contrast, are quite low (even by international standards)
regardless of the level of education attained (reaching a maximum 23.0 per cent among
young male university graduates).
Gender disparity is key to understanding the situation of youth in the Egyptian
labour market.
Despite significant strides in reducing the gender gap in education in Egypt, young
women are much more likely to fall in the NEET category than young men (49.5 per cent
and 9.3 per cent, respectively).
More young working women than men are unpaid family workers. Almost one-third of
female working youth (28.9 per cent) are unpaid family workers compared to 14.2 per cent
of male working youth.
Female youth are much less likely to complete their transition to a stable and/or
satisfactory job than males. While 51.7 per cent of young men have transited to stable and/or
satisfactory employment, only 16.3 per cent of young women have completed their
transition. More than one-half of young women (53.4 per cent) have not yet started their
transition, a situation also reflected in the low shares of female participation in the labour
force.
2 The ILO estimates global and regional values for youth aged 15–24, so estimates are not strictly
comparable. Following the 2012–13 SWTS in the region, the youth unemployment rate in Jordan was
below the Egyptian rate at 12.4 per cent. National reports for all SWTS countries will be available on
www.ilo.org/w4y as from the second quarter of 2014.
3 TVET as used in this report includes all technical and vocational education and training at secondary
level, generally comprising 3-year programmes.
3
Egypt has very few young entrepreneurs and they are not using institutional
financial support mechanisms.
Those who are self-employed constitute 26.1 per cent of employed youth, including
unpaid family workers (17.2 per cent), own-account workers (6.3 per cent) and employers
(2.6 per cent). Almost three-quarters of employed youth (73.9 per cent) are wage workers. A
majority of own-account workers are male youth (7.4 per cent compared to 2.1 per cent
among female youth).
The family and friends of entrepreneurs were the main source of financing (for 48.5 per
cent of self-employed youth), followed by personal savings (31.0 per cent). The data on
youth self-employment highlight the lack of institutional lending opportunities, with only
2.6 per cent of youth receiving financing from a financial institution.
Low-quality jobs and informal employment are serious challenges facing working
youth in Egypt.
The low quality of employment of many young Egyptian workers is evident from the
SWTS results. A majority of young employees (75.7 per cent) have no contract and thus
remain vulnerable; 81.1 per cent of young workers are in “irregular work”; more than one-
third (39.5 per cent) work more than 50 hours per week; 91.1 per cent of young workers in
Egypt are in informal employment.
Another aspect of job quality has to do with how well the job matches the
qualifications of the young worker. In Egypt, almost one-half of working youth (47.7 per
cent) are in occupations that do not match their education: 8.8 per cent are overeducated and
38.9 per cent are undereducated. The consequence of overeducation is that young workers
performing a job below their level of educational qualification are likely to earn less than
they otherwise could and are not making the most of their productive potential. The
undereducation of workers can have a negative impact on worker productivity and thus on
the output of the enterprise but also, more personally, on the sense of security of the young
worker.
Most young workers surveyed expressed a degree of job satisfaction, although as
many as one-half (50.1 per cent) of working youth indicated they would like to change
their current job, principally due to poor working conditions.
Only 22.7 per cent of youth described themselves as very satisfied with their work, and
a large share (50.8 per cent) described themselves as somewhat satisfied. Close to one-fifth
of employed youth expressed dissatisfaction (13.7 per cent were somewhat unsatisfied and
6.0 per cent were very unsatisfied); 6.8 per cent had no opinion. These data should be
considered with caution, however, since prevalent cultural and religious beliefs can
discourage expressions of dissatisfaction. In fact, despite having asserted job satisfaction, as
many as one-half (50.1 per cent) of working youth indicated they would like to change their
current job (53.2 per cent of young male workers and 38.3 per cent of young female
workers) because of the temporary nature of the job or to receive higher pay, experience
better working conditions or match their level of qualification.
Only one-third (34.4 per cent) of Egyptian youth successfully transited to the labour
market, meaning they attained a stable and/or satisfactory job.
A little more than one-third of surveyed youth (34.4 per cent) have already transited (in
a stable job; in a satisfactory but temporary job; or in satisfactory self-employment). Another
29.4 per cent remain “in transition” (unemployed according to the relaxed definition;
employed in a temporary and non-satisfactory job; in non-satisfactory self-employment; or
inactive and not in school, with the aim to look for work later). The remaining youth (36.2
per cent) have not yet started their transition. They are still in school and inactive (inactive

4
student); or inactive and not in school (inactive non-student), with no intention of looking
for work. The latter sub-category is dominated by young women.
Young men are almost twice as likely as young women to complete the transition, with
the majority of transited young men attaining a satisfactory temporary job. Young women,
in contrast, have twice the likelihood of young men of remaining in transition. Regarding the
impact of household income level, youth from wealthier households are more likely to
eventually attain stable employment while youth from poorer households are much more
likely to remain in non-satisfactory temporary or self-employment.
The data confirm that investing in higher education brings a distinct advantage in terms
of gaining stable employment. Nearly one-third (30.5 per cent) of youth with tertiary-level
education completed the transition to stable employment compared to less than 10 per cent
of youth with primary-level schooling or below, or TVET. Still, it is important to bear in
mind that 37.4 per cent of youth with tertiary-level education remain unemployed compared
to 12.1 per cent of youth with primary-level education. The youth with lower levels of
education have a higher chance of completing their labour market transition, but not to
stable employment. Rather, they are most likely to remain in satisfactory temporary
employment.
1.3 Structure of the report
Following this introduction, this report is organized as follows: section 2 focuses on the
socio-economic and labour market conditions of Egypt and introduces the objectives and
methodology of the SWTS. Section 3 presents the results of the SWTS with details on the
characteristics of the youth and their labour market outcomes. Section 4 introduces the
stages of labour market transition and investigates the characteristics that lead to more
advantageous labour market outcomes, and also presents indicators that define the path of
labour market transition. Finally, section 5 concludes with the policy implications of the
results outlined in this report.
2. Overview of the Egyptian labour market and survey methodology
2.1 The socio-economic context
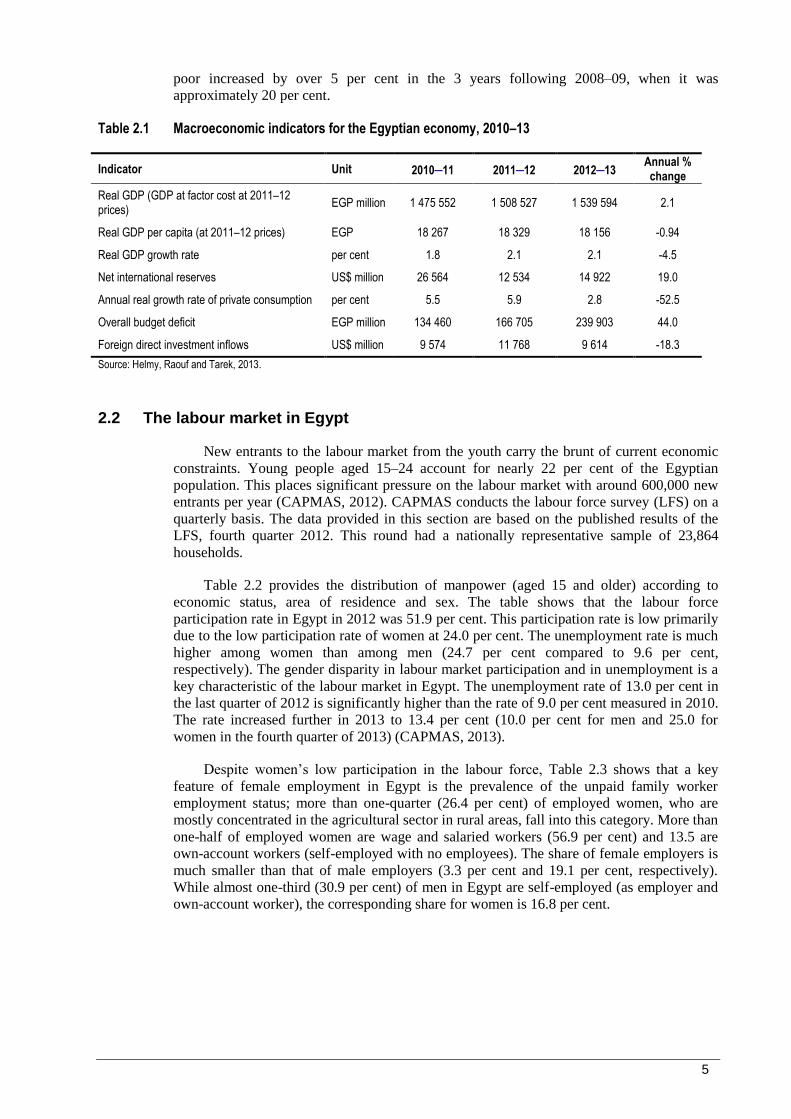
The Egyptian economy is currently suffering from the ramifications of two major
events: continuous political instability following the 25 January 2011 revolution and the
slowdown in global growth subsequent to the 2008 economic crisis. In the 2012–13 fiscal
year, Egypt’s gross domestic product (GDP) grew by only 2.1 per cent (table 2.1).
Moreover, the country’s budget deficit reached 13.8 per cent of GDP in 2013. A key concern
in 2013 was Egypt’s foreign currency reserves, which hit a record low of US$14.4 billion in
July 2013, falling below the critical level set by the Central Bank of Egypt and constituting a
sharp fall from US$36 billion in January 2011. A drop in tourism revenues due to political
unrest along with a serious reduction in foreign direct investment contributed to this crisis.
The value of the Egyptian pound (EGP) fell to its lowest rate since 2004 in July 2013, losing
12 per cent of its value.
These national losses were felt mainly by the poor. According to Egypt’s national
statistical office, the Central Agency for Public Mobilization and Statistics (CAPMAS), over
one-quarter (25.2 per cent) of Egyptian households lived under the absolute poverty line in
2010–11, and 4.8 per cent of households lived under the food poverty line. The proportion of
5
poor increased by over 5 per cent in the 3 years following 2008–09, when it was
approximately 20 per cent.
Table 2.1 Macroeconomic indicators for the Egyptian economy, 2010–13
Indicator Unit 2010–11 2011–12 2012–13 Annual % change
Real GDP (GDP at factor cost at 2011–12 prices)
EGP million 1 475 552 1 508 527 1 539 594 2.1
Real GDP per capita (at 2011–12 prices) EGP 18 267 18 329 18 156 -0.94
Real GDP growth rate per cent 1.8 2.1 2.1 -4.5
Net international reserves US$ million 26 564 12 534 14 922 19.0
Annual real growth rate of private consumption per cent 5.5 5.9 2.8 -52.5
Overall budget deficit EGP million 134 460 166 705 239 903 44.0
Foreign direct investment inflows US$ million 9 574 11 768 9 614 -18.3
Source: Helmy, Raouf and Tarek, 2013.
2.2 The labour market in Egypt
New entrants to the labour market from the youth carry the brunt of current economic
constraints. Young people aged 15–24 account for nearly 22 per cent of the Egyptian
population. This places significant pressure on the labour market with around 600,000 new
entrants per year (CAPMAS, 2012). CAPMAS conducts the labour force survey (LFS) on a
quarterly basis. The data provided in this section are based on the published results of the
LFS, fourth quarter 2012. This round had a nationally representative sample of 23,864
households.
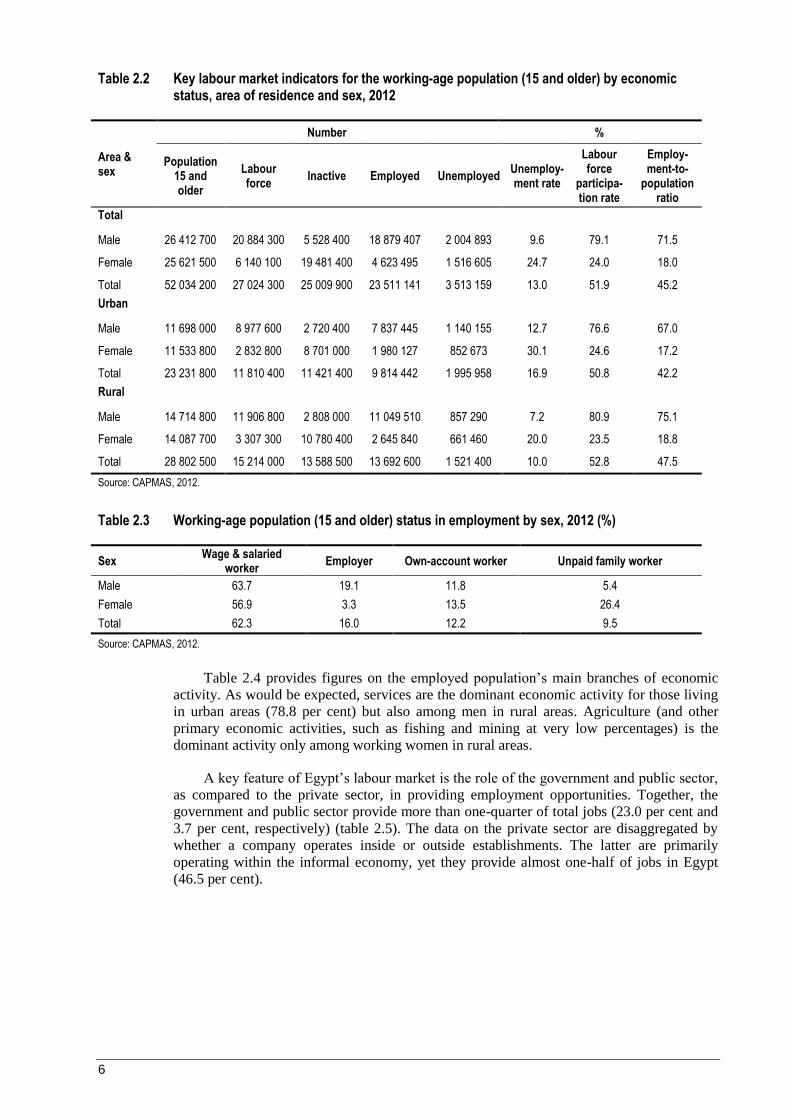
Table 2.2 provides the distribution of manpower (aged 15 and older) according to
economic status, area of residence and sex. The table shows that the labour force
participation rate in Egypt in 2012 was 51.9 per cent. This participation rate is low primarily
due to the low participation rate of women at 24.0 per cent. The unemployment rate is much
higher among women than among men (24.7 per cent compared to 9.6 per cent,
respectively). The gender disparity in labour market participation and in unemployment is a
key characteristic of the labour market in Egypt. The unemployment rate of 13.0 per cent in
the last quarter of 2012 is significantly higher than the rate of 9.0 per cent measured in 2010.
The rate increased further in 2013 to 13.4 per cent (10.0 per cent for men and 25.0 for
women in the fourth quarter of 2013) (CAPMAS, 2013).
Despite women’s low participation in the labour force, Table 2.3 shows that a key
feature of female employment in Egypt is the prevalence of the unpaid family worker
employment status; more than one-quarter (26.4 per cent) of employed women, who are
mostly concentrated in the agricultural sector in rural areas, fall into this category. More than
one-half of employed women are wage and salaried workers (56.9 per cent) and 13.5 are
own-account workers (self-employed with no employees). The share of female employers is
much smaller than that of male employers (3.3 per cent and 19.1 per cent, respectively).
While almost one-third (30.9 per cent) of men in Egypt are self-employed (as employer and
own-account worker), the corresponding share for women is 16.8 per cent.
6
Table 2.2 Key labour market indicators for the working-age population (15 and older) by economic status, area of residence and sex, 2012
Area & sex
Number %
Population 15 and older
Labour force
Inactive Employed Unemployed Unemploy-ment rate
Labour force
participa-tion rate
Employ-ment-to-
population ratio
Total
Male 26 412 700 20 884 300 5 528 400 18 879 407 2 004 893 9.6 79.1 71.5
Female 25 621 500 6 140 100 19 481 400 4 623 495 1 516 605 24.7 24.0 18.0
Total 52 034 200 27 024 300 25 009 900 23 511 141 3 513 159 13.0 51.9 45.2
Urban
Male 11 698 000 8 977 600 2 720 400 7 837 445 1 140 155 12.7 76.6 67.0
Female 11 533 800 2 832 800 8 701 000 1 980 127 852 673 30.1 24.6 17.2
Total 23 231 800 11 810 400 11 421 400 9 814 442 1 995 958 16.9 50.8 42.2
Rural
Male 14 714 800 11 906 800 2 808 000 11 049 510 857 290 7.2 80.9 75.1
Female 14 087 700 3 307 300 10 780 400 2 645 840 661 460 20.0 23.5 18.8
Total 28 802 500 15 214 000 13 588 500 13 692 600 1 521 400 10.0 52.8 47.5
Source: CAPMAS, 2012.
Table 2.3 Working-age population (15 and older) status in employment by sex, 2012 (%)
Sex Wage & salaried
worker Employer Own-account worker Unpaid family worker
Male 63.7 19.1 11.8 5.4
Female 56.9 3.3 13.5 26.4
Total 62.3 16.0 12.2 9.5
Source: CAPMAS, 2012.
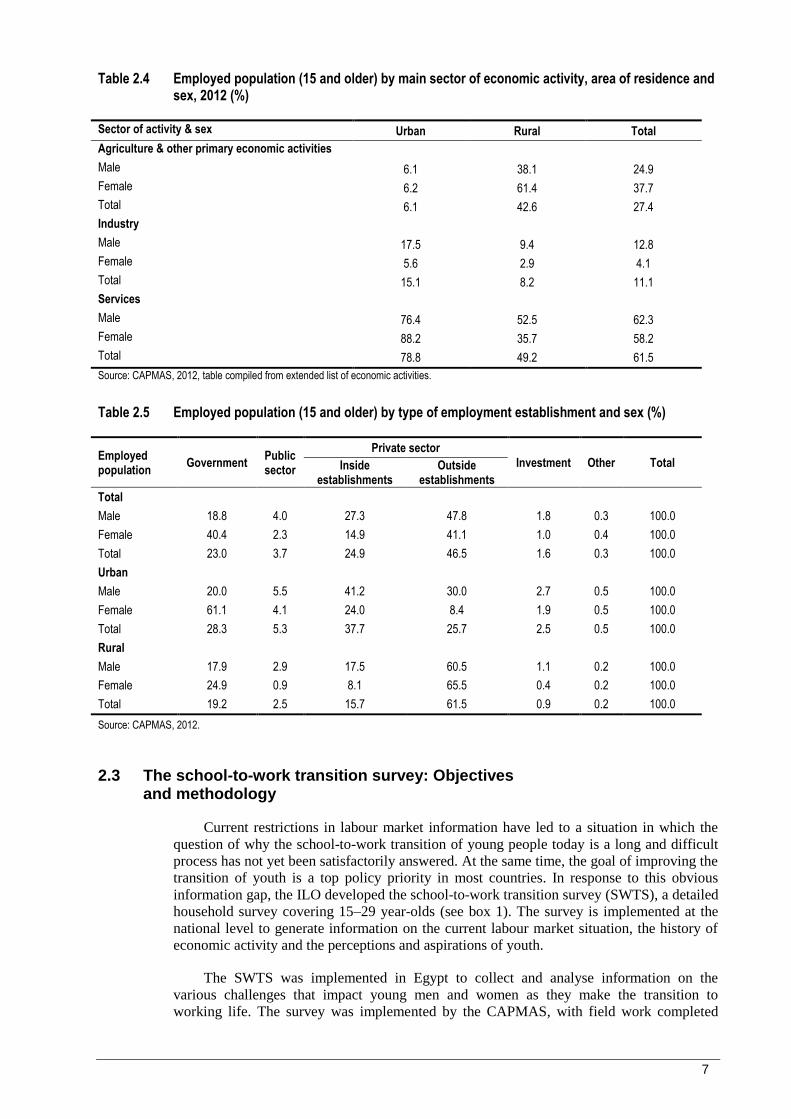
Table 2.4 provides figures on the employed population’s main branches of economic
activity. As would be expected, services are the dominant economic activity for those living
in urban areas (78.8 per cent) but also among men in rural areas. Agriculture (and other
primary economic activities, such as fishing and mining at very low percentages) is the
dominant activity only among working women in rural areas.
A key feature of Egypt’s labour market is the role of the government and public sector,
as compared to the private sector, in providing employment opportunities. Together, the
government and public sector provide more than one-quarter of total jobs (23.0 per cent and
3.7 per cent, respectively) (table 2.5). The data on the private sector are disaggregated by
whether a company operates inside or outside establishments. The latter are primarily
operating within the informal economy, yet they provide almost one-half of jobs in Egypt
(46.5 per cent).
7
Table 2.4 Employed population (15 and older) by main sector of economic activity, area of residence and sex, 2012 (%)
Sector of activity & sex Urban Rural Total
Agriculture & other primary economic activities
Male 6.1 38.1 24.9
Female 6.2 61.4 37.7
Total 6.1 42.6 27.4
Industry
Male 17.5 9.4 12.8
Female 5.6 2.9 4.1
Total 15.1 8.2 11.1
Services
Male 76.4 52.5 62.3
Female 88.2 35.7 58.2
Total 78.8 49.2 61.5
Source: CAPMAS, 2012, table compiled from extended list of economic activities.
Table 2.5 Employed population (15 and older) by type of employment establishment and sex (%)
Employed population
Government Public sector
Private sector
Investment Other Total Inside establishments
Outside establishments
Total
Male 18.8 4.0 27.3 47.8 1.8 0.3 100.0
Female 40.4 2.3 14.9 41.1 1.0 0.4 100.0
Total 23.0 3.7 24.9 46.5 1.6 0.3 100.0
Urban
Male 20.0 5.5 41.2 30.0 2.7 0.5 100.0
Female 61.1 4.1 24.0 8.4 1.9 0.5 100.0
Total 28.3 5.3 37.7 25.7 2.5 0.5 100.0
Rural
Male 17.9 2.9 17.5 60.5 1.1 0.2 100.0
Female 24.9 0.9 8.1 65.5 0.4 0.2 100.0
Total 19.2 2.5 15.7 61.5 0.9 0.2 100.0
Source: CAPMAS, 2012.
2.3 The school-to-work transition survey: Objectives and methodology
Current restrictions in labour market information have led to a situation in which the
question of why the school-to-work transition of young people today is a long and difficult
process has not yet been satisfactorily answered. At the same time, the goal of improving the
transition of youth is a top policy priority in most countries. In response to this obvious
information gap, the ILO developed the school-to-work transition survey (SWTS), a detailed
household survey covering 15–29 year-olds (see box 1). The survey is implemented at the
national level to generate information on the current labour market situation, the history of
economic activity and the perceptions and aspirations of youth.
The SWTS was implemented in Egypt to collect and analyse information on the
various challenges that impact young men and women as they make the transition to
working life. The survey was implemented by the CAPMAS, with field work completed
8
from November to December 2012. Funding for the survey came from the Work4Youth
partnership between the ILO Youth Employment Programme and The MasterCard
Foundation (see box 2). The partnership supports the implementation of the SWTS in 28
target countries.4 A second round of the SWTS will take place in each of the 28 countries in
2014–15, including in Egypt.
Box 1. Definition of youth
While in most contexts, a youth is defined as a person aged between 15 and 24, for the purpose of the SWTS and related reports, the upper age limit is extended to 29 years of age. This recognizes the fact that some young people remain in education beyond the age of 24, and allows the opportunity to capture more information on the post-graduation employment experiences of young people.
2.3.1 Questionnaire development
The standard ILO SWTS questionnaire was adapted to the national context based on a
consultative process between the ILO and CAPMAS. The questionnaire was drafted in
English and Arabic and administered in Arabic.
2.3.2 Sample design and selection
The SWTS sample is a self-weighted multi-stage cluster sample. The SWTS sample
was extracted from the LFS sample for the two rounds of the first and second quarters of
2012. The LFS has a panel design, but the SWTS sample was extracted from the LFS
original household roster, that is, without including split households. The LFS sample for
these two quarters comprised 16,081 households. The LFS sample is nationally
representative, excluding frontier governorates, which are known to constitute less than 2
per cent of Egypt’s population. The LFS sample included 1,237 enumeration areas.
Box 2. Work4Youth: An ILO project in partnership with The MasterCard Foundation
The Work4Youth (W4Y) Project is a partnership between the ILO Youth Employment Programme and The MasterCard Foundation. The project has a budget of US$14.6 million and will run for 5 years to mid-2016. Its aim is to “promot[e] decent work opportunities for young men and women through knowledge and action”. The immediate objective of the partnership is to produce more and better labour market information specific to youth in developing countries, focusing in particular on transition paths to the labour market. The assumption is that governments and social partners in the project’s 28 target countries will be better prepared to design effective policy and programme initiatives once armed with detailed information on:
• what young people expect in terms of transition paths and quality of work; • what employers expect in terms of young applicants; • what issues prevent the two sides – supply and demand – from matching; and • what policies and programmes can have a real impact. Work4Youth target areas and countries: Asia and the Pacific: Bangladesh, Cambodia, Nepal, Samoa, Viet Nam Eastern Europe and Central Asia: Armenia, Kyrgyzstan, the Republic of Moldova, the Russian Federation, The former Yugoslav Republic of Macedonia, Ukraine Latin America and the Caribbean: Brazil, Colombia, El Salvador, Jamaica, Peru Middle East and North Africa: Egypt, Jordan, Occupied Palestinian Territory, Tunisia Sub-Saharan Africa: Benin, Liberia, Madagascar, Malawi, the United Republic of Tanzania, Togo, Uganda, Zambia
4 First round SWTS data sets from 2012–13 are now available at the W4Y website:
http://www.ilo.org/employment/areas/WCMS_234860/lang--en/index.htm.

9
The main criterion for selection of the households from the LFS sample for inclusion in
the SWTS sample was to reach household members aged 15–29. The LFS sample included
9,708 households meeting this criterion. From this sampling framework, 3,500 households
were selected for the SWTS. The SWTS sub-sample was selected from enumeration units
with the highest concentration of households that met the age criterion. Households with
more members meeting the age criterion were also more likely to be selected. Sample
selection was systematized to take into account inclusion of all governorates. The sampling
framework is further described in Annex III. The final sample came to 5,198 youth aged 15–
29.
3. Characteristics of youth in Egypt
3.1 The demographic characteristics of youth
This section provides information on selected characteristics of youth aged 15–29,
including age group, area of residence, and marital and family status.
Table 3.1 shows that young respondents were relatively evenly distributed across age
categories, with slightly more young people in the 20–24 age category (38.5 per cent),
followed by those in the 15–19 age category (34.6 per cent) and those in the 25–29 age
category (27.0 per cent). The sample included more rural than urban youth (58.5 per cent
versus 41.5 per cent). Most youth in the sample were single (77.9 per cent). More female
youth were married (28.6 per cent versus 15.9 per cent for male youth).
Table 3.1 Youth population by selected characteristics
Characteristic Total Male Female
Number % Number % Number %
Age group
15–19 8 270 876 34.6 3 805 771 31.1 4 465 106 38.2
20–24 9 213 125 38.5 4 458 044 36.4 4 755 082 40.7
25–29 6 452 414 27.0 3 976 184 32.5 2 476 230 21.2
Area of residence
Urban 9 923 620 41.5 4 989 222 40.8 4 934 398 42.2
Rural 14 012 796 58.5 7 250 776 59.2 6 762 019 57.8
Marital status
Married (including divorced & widowed)
5 296 135 22.1 1 948 852 15.9 3 347 283 28.6
Single 18 640 280 77.9 10 291 147 84.1 8 349 134 71.4
With children 4 344 211 18.2 1 584 032 12.9 2 760 180 23.6
Average age at marriage
20.8 23.0 19.5
Source: SWTS-Egypt, 2012.
The SWTS asked respondents about their current place of residence and whether it
differs from their original place of residence. Table 3.2 shows that only 3.7 per cent of youth
moved from their original residence. The majority of these youth (65.7 per cent) moved
from rural areas, while the rest moved from urban areas. The majority of those who moved
(45.8 per cent) did so to accompany family members, although the share that moved because
they got married is not far behind at 38.2 per cent. In fact, among young women, marriage is
the predominant reason for changing their area of residence (60.7 per cent of migrated young
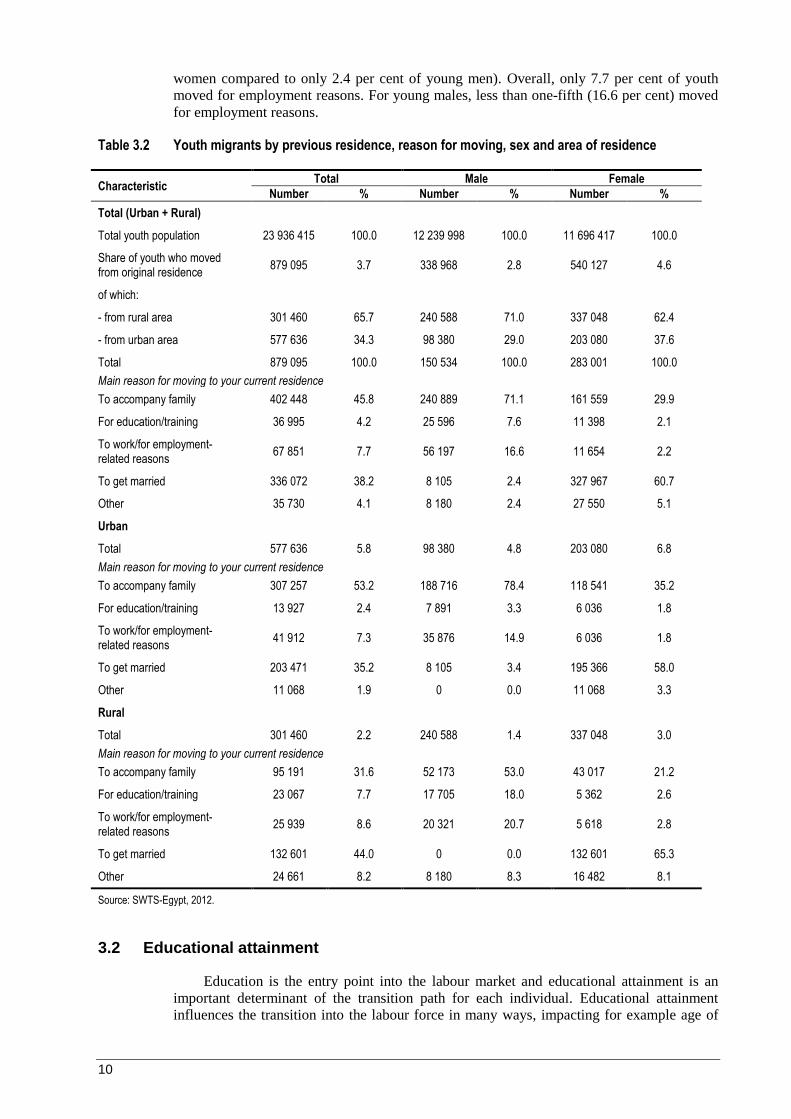
10
women compared to only 2.4 per cent of young men). Overall, only 7.7 per cent of youth
moved for employment reasons. For young males, less than one-fifth (16.6 per cent) moved
for employment reasons.
Table 3.2 Youth migrants by previous residence, reason for moving, sex and area of residence
Characteristic Total Male Female
Number % Number % Number %
Total (Urban + Rural)
Total youth population 23 936 415 100.0 12 239 998 100.0 11 696 417 100.0
Share of youth who moved from original residence
879 095 3.7 338 968 2.8 540 127 4.6
of which:
- from rural area 301 460 65.7 240 588 71.0 337 048 62.4
- from urban area 577 636 34.3 98 380 29.0 203 080 37.6
Total 879 095 100.0 150 534 100.0 283 001 100.0
Main reason for moving to your current residence
To accompany family 402 448 45.8 240 889 71.1 161 559 29.9
For education/training 36 995 4.2 25 596 7.6 11 398 2.1
To work/for employment-related reasons
67 851 7.7 56 197 16.6 11 654 2.2
To get married 336 072 38.2 8 105 2.4 327 967 60.7
Other 35 730 4.1 8 180 2.4 27 550 5.1
Urban
Total 577 636 5.8 98 380 4.8 203 080 6.8
Main reason for moving to your current residence
To accompany family 307 257 53.2 188 716 78.4 118 541 35.2
For education/training 13 927 2.4 7 891 3.3 6 036 1.8
To work/for employment-related reasons
41 912 7.3 35 876 14.9 6 036 1.8
To get married 203 471 35.2 8 105 3.4 195 366 58.0
Other 11 068 1.9 0 0.0 11 068 3.3
Rural
Total 301 460 2.2 240 588 1.4 337 048 3.0
Main reason for moving to your current residence
To accompany family 95 191 31.6 52 173 53.0 43 017 21.2
For education/training 23 067 7.7 17 705 18.0 5 362 2.6
To work/for employment-related reasons
25 939 8.6 20 321 20.7 5 618 2.8
To get married 132 601 44.0 0 0.0 132 601 65.3
Other 24 661 8.2 8 180 8.3 16 482 8.1
Source: SWTS-Egypt, 2012.
3.2 Educational attainment
Education is the entry point into the labour market and educational attainment is an
important determinant of the transition path for each individual. Educational attainment
influences the transition into the labour force in many ways, impacting for example age of
11
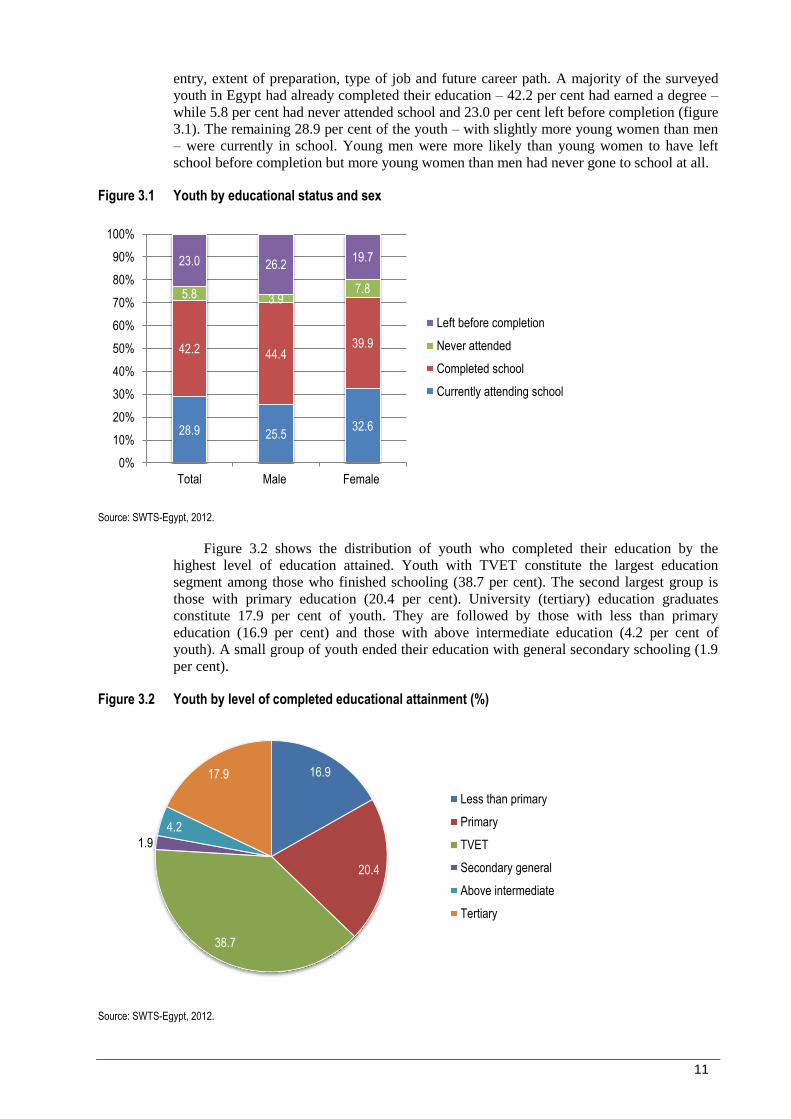
entry, extent of preparation, type of job and future career path. A majority of the surveyed
youth in Egypt had already completed their education – 42.2 per cent had earned a degree –
while 5.8 per cent had never attended school and 23.0 per cent left before completion (figure
3.1). The remaining 28.9 per cent of the youth – with slightly more young women than men
– were currently in school. Young men were more likely than young women to have left
school before completion but more young women than men had never gone to school at all.
Figure 3.1 Youth by educational status and sex
Source: SWTS-Egypt, 2012.
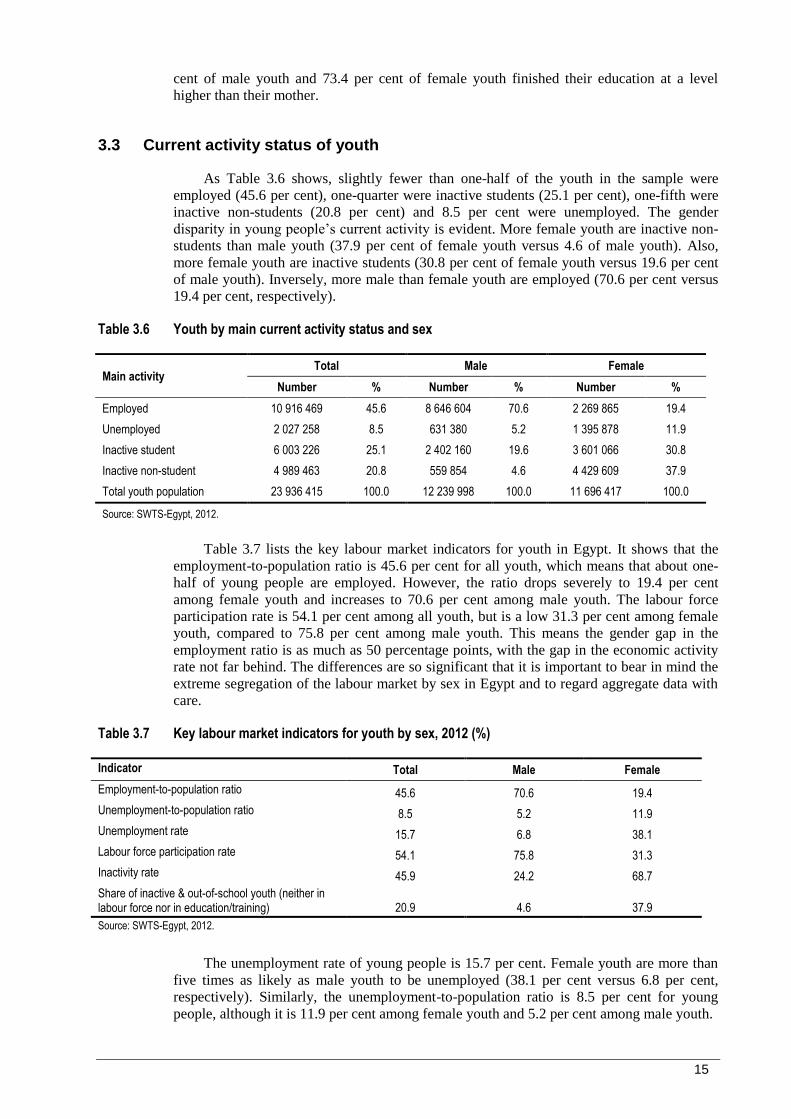
Figure 3.2 shows the distribution of youth who completed their education by the
highest level of education attained. Youth with TVET constitute the largest education
segment among those who finished schooling (38.7 per cent). The second largest group is
those with primary education (20.4 per cent). University (tertiary) education graduates
constitute 17.9 per cent of youth. They are followed by those with less than primary
education (16.9 per cent) and those with above intermediate education (4.2 per cent of
youth). A small group of youth ended their education with general secondary schooling (1.9
per cent).
Figure 3.2 Youth by level of completed educational attainment (%)
Source: SWTS-Egypt, 2012.
28.9 25.5 32.6
42.2 44.4 39.9
5.8 3.9 7.8
23.0 26.2 19.7
0%
10%
20%
30%
40%
50%
60%
70%
80%
90%
100%
Total Male Female
Left before completion
Never attended
Completed school
Currently attending school
16.9
20.4
38.7
1.9
4.2
17.9
Less than primary
Primary
TVET
Secondary general
Above intermediate
Tertiary

12
Figure 3.3 shows the distribution of completed educational attainment for youth by sex
and area of residence. Young females had a higher tendency than males to fall among the
extremes: higher shares of young women finished school at the lowest level (less than
primary at 17.6 per cent) and the highest level (tertiary-level education at 19.8 per cent).
Young men, in contrast, were more likely than young women to complete TVET (although
this category comprises the highest shares of both young men and women) and general
secondary and primary levels. The data show the advantages to educational access and
attainment that exist in urban areas compared to rural areas. Almost one-half (42.2 per cent)
of youth in rural areas finished their education at the primary level or below compared to
29.4 per cent of youth in urban areas. At the other extreme, youth in urban areas were more
than twice as likely to have completed tertiary-level education as youth in rural areas (27.5
and 11.8 per cent, respectively).
Figure 3.3 Youth by level of completed educational attainment, sex and area of residence
Source: SWTS-Egypt, 2012.
Those who never attended school or left school before attaining secondary level were
asked about the reasons for this situation. Table 3.3 shows that 42.3 per cent of youth left
education because they failed an exam or were not suited to studying and another 24.4 per
cent left because they felt the level was good enough for their needs. Family poverty was the
reason for 14.2 per cent of youth with less than secondary-level education and another 4.7
per cent left because of high costs. Following cultural norms, more female youth (6.3 per
cent) had to leave school to help in housework, compared to only 0.2 per cent of male youth,
and more female than male youth left school because their parents considered the level good
enough for them (5.7 per cent of young women versus 2.0 per cent of young men).
16.3 17.6
12.1
19.9 20.7 20.0
17.3
22.3
40.6
36.6 35.6
40.7
2.0 1.7 1.3 2.3 4.1 4.3
6.1
3.0
16.3
19.8
27.5
11.8
0
5
10
15
20
25
30
35
40
45
Male Female Urban Rural
%
Less than primary
Primary
TVET
Secondary general
Above Intermediate
Tertiary

13
Table 3.3 Youth with less than secondary-level education by reason for leaving
Reason Total Male Female
Number % Number % Number %
I was not successful in studying 2 332 249 42.3 1 590 061 49.6 742 188 32.2
Due to the high cost 256 749 4.7 166 520 5.2 90 229 3.9
Because of family poverty 781 003 14.2 442 517 13.8 338 486 14.7
I completed the level that I consider good enough for me
1 343 057 24.4 738 977 23.1 604 080 26.2
I completed the level my parents consider good enough for me
194 511 3.5 63 838 2.0 130 673 5.7
To work 134 535 2.4 123 184 3.8 11 351 0.5
To help with house work 152 478 2.8 6 529 0.2 145 949 6.3
No school nearby 15 635 0.3 3 264 0.1 12 371 0.5
Got pregnant 5 989 0.1 0 0.0 5 989 0.3
To get married 137 135 2.5 0 0.0 137 135 5.9
Disability 43 359 0.8 25 855 0.8 17 504 0.8
Do not know 17 061 0.3 11 481 0.4 5 580 0.2
Other 96 404 1.7 32 686 1.0 63 718 2.8
Total 5 510 167 100.0 3 204 913 100.0 2 305 255 100.0
Note: The data includes those with no education asked to identify why they never attended school.
Source: SWTS-Egypt, 2012.
Remarkable progress in access to education for youth has been made over the past few
decades. Young people in Egypt by and large are more likely to have attended school than
their parents and to have more years of schooling. This has been the case for both male and
female youth. As shown in table 3.4, 69.6 per cent of youth indicated that their mothers had
never attended school and 57.1 per cent stated their fathers had never attended school.
Gender disparity in education is clear when comparing the education of mothers and fathers.
Young people’s fathers show higher levels of completed education at all levels compared to
their mothers. For example, 11.3 per cent of fathers had completed tertiary-level education
as compared to 5.2 per cent of mothers.
Table 3.4 Youth’s mothers and fathers by educational attainment
Highest education level completed Youth's mothers Youth's fathers
Number % Number %
Do not have any formal education 16 666 911 69.6 13 658 958 57.1
Primary 2 017 300 8.4 2 957 634 12.4
Secondary 4 006 118 16.7 4 553 816 19.0
Tertiary 1 242 075 5.2 2 705 360 11.3
Other 4 012 0.0 60 649 0.3
Total youth population 23 936 415 100.0 23 936 415 100.0
Source: SWTS-Egypt, 2012.
Table 3.5 show that the recent cohort of surveyed youth in Egypt was much more
educated than their parents. Over one-third (38.9 per cent) of the mothers of youth with
tertiary-level education had no education and about one-quarter (25.3 per cent) of the fathers
of these youth had no education.

14
Table 3.5 Educational attainment of respondent in comparison to their parents (%)
Youth’s education
Educational attainment
Does not have any
formal education
Primary TVET Secondary Above
intermediate Tertiary
Father's education
Does not have any formal education
92.1 81.2 64.8 73.3 48.3 25.3
Primary 4.7 11.1 15.3 13.5 20.4 13.5
TVET 2.1 5.0 13.9 7.6 19.7 20.9
Secondary general 0.1 0.0 0.9 1.2 0.0 1.7
Above intermediate 0.0 0.4 2.0 4.4 5.7 5.9
Tertiary 0.0 1.7 3.1 0.0 5.9 32.6
Do not know/other 0.0 0.7 0.0 0.0 0.0 0.1
Mother's education
Does not have any formal education
98.3 91.4 81.0 88.4 63.6 38.9
Primary 1.3 6.2 9.0 6.9 14.0 10.5
TVET 0.3 2.2 8.9 1.3 20.5 25.5
Secondary general 0.0 0.0 0.3 1.3 0.5 2.7
Above intermediate 0.0 0.1 1.0 2.2 1.5 5.8
Tertiary 0.0 0.0 0.0 0.0 0.0 16.7
Do not know/other 0.0 0.0 0.0 0.0 0.0 0.0
Source: SWTS-Egypt, 2012.
Figure 3.4 Cross-tabulation of youth’s and parents’ educational attainment
Source: SWTS-Egypt, 2012.
Figure 3.4 further illustrates the data on the relationship between the parental education
of youth and their educational attainment. Young people are now much more highly
educated than their parents. About 65.6 per cent of male youth and 65.0 per cent of female
youth finished their education at a higher level than their father. Similarly, about 75.2 per
29.4
65.3
5.3
24.4
74.4
1.3
29.2
65.6
5.3
23.5
75.2
1.3
29.6
65.0
5.4
25.4
73.4
1.2
0
10
20
30
40
50
60
70
80
Same level asfather
Father haslower level
Father hashigher level
Same level asmother
Mother haslower level
Mother hashigher level
%
Total
Male
Female
15
cent of male youth and 73.4 per cent of female youth finished their education at a level
higher than their mother.
3.3 Current activity status of youth
As Table 3.6 shows, slightly fewer than one-half of the youth in the sample were
employed (45.6 per cent), one-quarter were inactive students (25.1 per cent), one-fifth were
inactive non-students (20.8 per cent) and 8.5 per cent were unemployed. The gender
disparity in young people’s current activity is evident. More female youth are inactive non-
students than male youth (37.9 per cent of female youth versus 4.6 of male youth). Also,
more female youth are inactive students (30.8 per cent of female youth versus 19.6 per cent
of male youth). Inversely, more male than female youth are employed (70.6 per cent versus
19.4 per cent, respectively).
Table 3.6 Youth by main current activity status and sex
Main activity Total Male Female
Number % Number % Number %
Employed 10 916 469 45.6 8 646 604 70.6 2 269 865 19.4
Unemployed 2 027 258 8.5 631 380 5.2 1 395 878 11.9
Inactive student 6 003 226 25.1 2 402 160 19.6 3 601 066 30.8
Inactive non-student 4 989 463 20.8 559 854 4.6 4 429 609 37.9
Total youth population 23 936 415 100.0 12 239 998 100.0 11 696 417 100.0
Source: SWTS-Egypt, 2012.
Table 3.7 lists the key labour market indicators for youth in Egypt. It shows that the
employment-to-population ratio is 45.6 per cent for all youth, which means that about one-
half of young people are employed. However, the ratio drops severely to 19.4 per cent
among female youth and increases to 70.6 per cent among male youth. The labour force
participation rate is 54.1 per cent among all youth, but is a low 31.3 per cent among female
youth, compared to 75.8 per cent among male youth. This means the gender gap in the
employment ratio is as much as 50 percentage points, with the gap in the economic activity
rate not far behind. The differences are so significant that it is important to bear in mind the
extreme segregation of the labour market by sex in Egypt and to regard aggregate data with
care.
Table 3.7 Key labour market indicators for youth by sex, 2012 (%)
Indicator Total Male Female
Employment-to-population ratio 45.6 70.6 19.4
Unemployment-to-population ratio 8.5 5.2 11.9
Unemployment rate 15.7 6.8 38.1
Labour force participation rate 54.1 75.8 31.3
Inactivity rate 45.9 24.2 68.7
Share of inactive & out-of-school youth (neither in labour force nor in education/training) 20.9 4.6 37.9
Source: SWTS-Egypt, 2012.
The unemployment rate of young people is 15.7 per cent. Female youth are more than
five times as likely as male youth to be unemployed (38.1 per cent versus 6.8 per cent,
respectively). Similarly, the unemployment-to-population ratio is 8.5 per cent for young
people, although it is 11.9 per cent among female youth and 5.2 per cent among male youth.

16
Table 3.8 presents data on young people neither in education nor in employment or
training (also called the NEET population). More than one-quarter of surveyed youth in
Egypt (29.0 per cent) fell in the NEET category; of these, 36.1 per cent were unemployed
non-students and 63.9 per cent were inactive non-students. The gender disparity is clear in
the data on the NEET youth. Female youth are much more likely to be in the NEET category
than male youth (49.5 per cent of female youth compared to 9.3 per cent of male youth).
While nearly three-quarters of female NEETs are inactive non-students (71.1 per cent),
nearly three-quarters of young male NEETs are unemployed non-students (72.7 per cent).
The differences in the number and distribution of NEET categories by area of residence are
not stark, but there is a slightly higher tendency towards inactivity among non-students in
rural areas and towards unemployment in urban areas.
Table 3.8 NEET youth by area of residence and sex
Characteristic
Total youth population
Total NEET1 youth (% of total youth population)
NEET status
Unemployed non-students Inactive non-students
Number Number % Number %
Total youth population 23 936 415 29.0 1 945 576 36.1 4 989 463 63.9
Male 12 239 998 9.3 582 406 72.7 559 854 27.3
Female 11 696 417 49.5 1 363 169 28.9 4 429 609 71.1
Urban 9 923 620 28.3 928 942 41.2 1 880 231 58.8
Rural 14 012 796 28.3 1 016 634 32.7 3 109 232 67.3
1Neither in education nor in employment or training.
Source: SWTS-Egypt, 2012.
Table 3.9 shows the distribution of youth by educational attainment level and activity
status. The greatest share of employed youth who finished schooling (39.5 per cent) had
completed TVET. The second largest group comprised youth who had completed primary
education (20.5 per cent), followed by those who had less than primary education (17.7 per
cent). Youth who had completed university education constituted the largest education group
among the unemployed (44.5 per cent). The second largest group among the unemployed
comprised those who had finished TVET (38.4 per cent). Among inactive youth, those who
had completed TVET made up the largest group (37.3 per cent), followed by youth who had
completed primary-level education (26.1 per cent).
The data on the employed male and female youth surveyed show that the educated
young women were more likely to be employed than the uneducated young women. In
addition, about two-thirds of employed women had secondary-level and above education
(32.6 per cent had TVET, 0.5 per cent had secondary general education, 3.9 per cent had
above intermediate education and 29.7 per cent had a university education). The pattern was
not the same among employed young men; those with secondary-level and above education
constituted just over one-half of the employed (41.3 per cent had TVET, 1.9 per cent had
secondary general education, 3.8 per cent had above intermediate education and 13.3 per
cent had a university education).

17
Table 3.9 Youth by educational attainment level and current activity status (completed education and youth still in school, %)
Educational attainment level
Total Male Female
Employed Unemployed Inactive Employed Unemployed Inactive Employed Unemployed Inactive
Highest education level completed
Less than primary
17.7 2.3 21.0 17.5 3.5 11.8 18.2 1.8 22.2
Primary 20.5 5.0 26.1 21.9 5.6 18.8 15.1 4.8 27.0
TVET 39.5 38.4 37.3 41.3 27.6 43.8 32.6 43.1 36.5
Secondary general
1.8 2.3 1.9 2.1 2.2 0.0 0.5 2.4 2.1
Above intermediate
3.8 7.4 3.8 3.8 6.5 6.7 3.9 7.7 3.4
Tertiary 16.7 44.5 10.0 13.3 54.6 18.8 29.7 40.3 8.9
Total 100.0 100.0 100.0 100.0 100.0 100.0 100.0 100.0 100.0
For those currently attending school
Primary 7.8 0.0 8.2 8.0 0.0 7.0 6.9 0.0 9.0
TVET 51.9 33.6 29.1 53.5 43.8 30.1 45.7 18.5 28.5
Secondary general
9.4 4.9 22.6 7.1 8.3 22.2 18.2 0.0 22.8
Above intermediate
4.9 4.9 3.2 4.6 8.2 2.8 5.9 0.0 3.4
Tertiary 26.1 56.5 36.9 26.8 39.8 37.9 23.3 81.5 36.3
Total 100.0 100.0 100.0 100.0 100.0 100.0 100.0 100.0 100.0
Source: SWTS-Egypt, 2012.
Table 3.10 disaggregates the data on the education status of youth by current activity
and sex. A strong majority (87.5 per cent) of male youth who were currently out-of-school
were employed while the majority of out-of-school female youth were inactive (56.2 per
cent). Only 26.6 per cent of non-student female youth were working, with another 17.3 per
cent trying to find work (unemployed).
Table 3.10 Out-of-school youth and youth with no schooling by current activity status and sex
Sex Total Employed Unemployed Inactive
Number % Number % Number % Number %
Total out-of-school youth
17 010 805 100.0 10 075 766 59.2 1 945 576 11.4 4 989 463 29.3
Male 9 122 092 100.0 7 979 832 87.5 582 406 6.4 559 854 6.1
Female 7 888 712 100.0 2 095 934 26.6 1 363 169 17.3 4 429 609 56.2
Total youth who never attended school
1 390 353 100.0 693 458 49.9 12 712 0.9 684 183 49.2
Male 478 412 100.0 443 410 92.7 0 0.0 35 002 7.3
Female 911 941 100.0 250 048 27.4 12 712 1.4 649 181 71.2
Source: SWTS-Egypt, 2012.
Among youth who never attended school, there was an even higher tendency for young
males to be employed (92.7 per cent) and a slightly higher share of employed female youth
at 27.4 per cent. An assumption here is that those with no schooling were likely to come
from poor households and therefore had a more urgent need to work for an income. This
idea is somewhat confirmed by the extremely low unemployment rate among youth with no
schooling.

18
3.4 Aspirations and life goals
The survey tool included questions to youth about their primary life goals. Table 3.11
shows that having a job was the primary life goal of the greatest percentage of employed and
unemployed youth at 36.0 per cent and 84.2 per cent, respectively. Having a job as a life
goal ranked third for inactive youth at 24.0 per cent, after the goals of being successful in
work (36.7 per cent) and having a good family life (35.9 per cent). Having a good family
life, on the other hand, was the most sought after goal among female respondents, both
employed and inactive (reported by 49.5 per cent and 47.3 per cent, respectively). The
importance of finding work among both unemployed male and female youth is clear; 83.1
per cent of unemployed female youth and 86.6 per cent of unemployed male youth put
having a job as their primary life goal.
Table 3.11 Youth by primary life goal, current activity status and sex
Primary life goal Employed Unemployed Inactive
Number % Number % Number %
Total
Having a job 3 932 948 36.0 1 707 369 84.2 2 641 753 24.0
Being successful in work 2 168 424 19.9 90 028 4.4 4 039 132 36.7
Making a contribution to society 234 610 2.2 10 963 0.5 130 171 1.2
Having lots of money 1 331 016 12.2 14 567 0.7 134 832 1.2
Having a good family life 3 114 250 28.5 190 691 9.4 3 943 480 35.9
Other 135 220 1.2 13 640 0.7 103 321 0.9
Total 10 916 469 100.0 2 027 258 100.0 1 0992 689 100.0
Male
Having a job 3 413 491 39.5 546 921 86.6 1 070 868 36.2
Being successful in work 1 692 704 19.6 45 099 7.1 1 578 950 53.3
Making a contribution to society 174 669 2.0 0.0 0.0 35 754 1.2
Having lots of money 1 263 538 14.6 0.0 0.0 71 523 2.4
Having a good family life 1 990 961 23.0 31 336 5.0 148 111 5.0
Other 111 242 1.3 8 025 1.3 56 808 1.9
Total 8 646 604 100.0 631 380 100.0 2 962 014 100.0
Female
Having a job 519 458 22.9 1 160 449 83.1 1 570 885 19.6
Being successful in work 475 720 21.0 44 929 3.2 2 460 181 30.6
Making a contribution to society 59 942 2.6 10 963 0.8 94 418 1.2
Having lots of money 67 478 3.0 14 567 1.0 63 309 0.8
Having a good family life 1 123 289 49.5 159 354 11.4 3 795 369 47.3
Other 23 978 1.1 5 616 0.4 46 513 0.6
Total 2 269 865 100.0 1 395 878 100.0 8 030 675 100.0
Source: SWTS-Egypt, 2012.
3.5 Characteristics of employed youth
Table 3.12 shows that the majority of employed youth surveyed (73.9 per cent) were
wage and salaried workers. The second largest segment was unpaid family workers (17.2 per
cent), followed by those who were own-account workers (6.3 per cent) and employers (2.6
per cent). The incidence of self-employment was highest among male youth: 10.3 per cent in
total, including 2.9 per cent as employers and 7.4 per cent as own-account workers. Another
14.2 per cent were in unpaid family work. In contrast, only 3.3 per cent of working female
youth were self-employed (1.2 per cent as employers and 2.1 per cent as own-account

19
workers). Almost one-third of female youth (28.9 per cent) were unpaid family workers,
amounting to twice as many as male youth.
Table 3.12 Employed youth by employment status and sex
Employment status Total Male Female
Number % Number % Number %
Wage & salaried
worker (employee) 8 070 019 73.9 6 532 880 75.6 1 537 139 67.7
Employer 281 683 2.6 253 954 2.9 27 730 1.2
Own-account worker 684 675 6.3 635 910 7.4 48 766 2.1
Unpaid family worker 1 880 090 17.2 1 223 860 14.2 656 230 28.9
Total 10 916 468 100.0 8 646 604 100.0 2 269 865 100.0
Source: SWTS-Egypt, 2012.
In terms of main branch of economic activity, Table 3.13 indicates that the greatest
percentage of employed youth (44.7 per cent) were employed in the service sector, while the
agricultural sector comprised the smallest share of employed youth at 23.0 per cent. The rate
of prevalence of agricultural activities was higher among female than male youth (31.1 per
cent compared to 20.9 per cent, respectively), concurring with the data in the previous table
on employment status and the prevalence of the work status of unpaid family worker among
female youth, which is usually connected to home-based agricultural and animal husbandry
activities. Table 3.14 shows the sectoral distribution of employed youth in more detail. Here
it is clearer that young men had a larger presence in industrial activities like construction
(18.7 per cent) and manufacturing (17.3 per cent), and in service activities like transport (9.4
per cent), while young women were more concentrated in activities associated with the
public sector – for example, education (14.6 per cent), and health and social work (10.7 per
cent) – as well as in agriculture. Only in wholesale and retail trade were young males and
females similarly distributed.
Table 3.13 Employed youth by aggregate sector and sex
Sector Total Male Female
Number % Number % Number %
Agriculture 2 511 135 23.0 1 805 346 20.9 705 789 31.1
Industry 3 521 602 32.3 3 204 977 37.1 316 625 14.0
Services 4 883 731 44.7 3 636 280 42.1 1 247 451 55.0
Total 10 916 469 100.0 8 646 604 100.0 2 269 865 100.0
Source: SWTS-Egypt, 2012.
Table 3.14 Employed youth by sector at the 1-digit level and sex (%)
Sector Total Male Female
Agriculture & forestry 22.4 20.2 31.1
Manufacturing 16.3 17.3 12.9
Construction 14.9 18.7 0.5
Wholesale & retail trade 17.4 17.1 18.4
Transport 7.6 9.4 1.1
Accommodation 4.2 5.1 0.7
Professional scientific activities 1.2 0.9 2.4
Public administration 2.1 1.7 3.7
Education 4.6 2.0 14.6
Health & social work 3.3 1.3 10.7
Other services 1.9 2.3 0.4
Note: Only sectors that made up more than 2 per cent of the total area are shown. Source: SWTS-Egypt, 2012.
20
Table 3.15 illustrates the occupations of employed youth, again showing strong gender
differences. Employed young women were mainly distributed between three main
occupations: agriculture (31.1 per cent), professionals (21.7 per cent), and service and sales
work (16.0 per cent). This pattern differed among working young men, who held fewer
professional jobs (6.1 per cent), more craft and related trades occupations (29.7 per cent) and
fewer jobs in agriculture (20.5 per cent). The table shows young women split between either
high-skill jobs (professionals) or very low-skill jobs (in agriculture and sales).
Overall, about one-quarter of working youth’s occupations were in craft and related
trades activities (23.8 per cent), about one-fifth were skilled agricultural and fishery workers
(22.7 per cent) and the third most prevalent occupation was in service and sales (15.8 per
cent). Managerial and clerical jobs were those least held by working youth, followed by the
occupation of technician and elementary occupations.
Table 3.15 Employed youth by occupation and sex
Occupation Total Male Female
Number % Number % Number %
Managers 221 664 2.0 199 470 2.3 22 193 1.0
Professionals 1 014 912 9.3 523 390 6.1 491 521 21.7
Technicians & associate professionals
629 566 5.8 393 910 4.6 235 657 10.4
Clerical support workers 256 377 2.4 107 621 1.2 148 757 6.6
Service & sales workers 1 729 450 15.8 1 365 597 15.8 363 854 16.0
Skilled agricultural & fishery workers 2 478 234 22.7 1 772 446 20.5 705 789 31.1
Craft & related trades workers 2 593 470 23.8 2 563 366 29.7 30 104 1.3
Plant & machine operators& assemblers
1 359 286 12.5 1 143 245 13.2 216 041 9.5
Elementary occupations 633 510 5.8 577 560 6.7 55 949 2.5
Total 10 916 469 100.0 8 646 604 100.0 2 269 865 100.0
Source: SWTS-Egypt, 2012.
3.5.1 Wage and salaried employment
As noted earlier, wage and salaried employment was the employment status of most
working youth in Egypt (73.9 per cent). Table 3.16 shows the number of young wage and
salaried workers surveyed who received benefits from their jobs by type of benefit and sex.
Access to benefits beyond salary proved quite low in Egypt. The most common benefit was
annual paid leave, but even it was received by only one-fifth (22.6 per cent) of wage and
salaried workers. The next most prevalent benefits were a meal allowance and paid sick
leave, with 19.9 per cent of young wage and salaried workers receiving each. That more
young women worked in the public sector than young men is reflected in the higher access
to benefits that young female workers received. As many as 42.8 per cent of young female
wage and salaried workers received paid annual leave, 39.2 per cent received paid sick
leave, 35. 4 per cent were covered by medical insurance, and from 20 to 30 per cent had
access also to pensions, severance pay, overtime pay and bonuses. Still, only 16.9 per cent of
female workers benefited from maternity leave. These results hint that while young women
were much less likely to work than young men, the few who did attain employment – largely
in the public sector as an only option for many women – could be considered in “better” jobs
than their male counterparts due to the security provided by non-wage entitlements.
21
Table 3.16 Young wage and salaried workers by access to benefits/entitlements and sex
Benefit/entitlement Total Male Female
Number % Number % Number %
Transport or transport allowance 1 201 386 14.9 944 765 14.5 256 621 16.7
Meals or meal allowance 1 602 187 19.9 1 330 059 20.4 272 128 17.7
Annual paid leave (holiday time) 1 822 986 22.6 1 164 398 17.8 658 588 42.8
Paid sick leave 1 605 421 19.9 1 002 879 15.4 602 542 39.2
Pension/old age insurance 1 093 130 13.5 679 807 10.4 413 323 26.9
Severance/end of service payment 945 827 11.7 589 696 9.0 356 131 23.2
Overtime pay 1 383 265 17.1 975 712 14.9 407 553 26.5
Medical insurance coverage 1 484 593 18.4 940 707 14.4 543 886 35.4
Bonus/reward for good performance 1 174 906 14.6 772 287 11.8 402 619 26.2
Social security contribution 687 401 8.5 401 227 6.1 286 174 18.6
Educational or training courses 592 649 7.3 353 187 5.4 239 462 15.6
Occupational safety/protective
equipment or clothing 655 361 8.1 458 573 7.0 196 788 12.8
Childcare facilities 329 595 4.1 104 168 1.6 225 428 14.7
Maternity/paternity leave 396 992 4.9 136 648 2.1 260 345 16.9
Total 8 070 020 6 532 880 1 537 139
Source: SWTS-Egypt, 2012.
Table 3.17 Young wage and salaried workers by type of contract, area of residence and sex
Type of contract Total Male Female
Number % Number % Number %
Total (Urban + Rural)
No contract 6 106 544 75.7 5 284 013 80.9 822 531 53.5
Unlimited duration 1 054 518 13.1 642 250 9.8 412 268 26.8
Limited duration 908 958 11.3 606 617 9.3 302 340 19.7
Less than 12 months 186 150 2.3 101 955 1.6 84 194 5.5
12 months to less than 36 months
669 225 8.3 465 239 7.1 203 986 13.3
36 months or more 53 583 0.7 39 423 0.6 14 160 0.9
Total 8 070 020 100.0 6 532 880 100.0 1 537 139 100.0
Urban
No contract 2 378 831 69.9 1 957 553 75.1 421 277 52.8
Unlimited duration 505 554 14.8 294 322 11.3 211 232 26.5
Limited duration 520 557 15.3 355 941 13.6 164 616 20.7
Less than 12 months 101 545 3.0 40 706 1.6 60 839 7.6
12 months to less than 36 months
385 501 11.3 291 990 11.2 93 511 11.7
36 months or more 33 511 1.0 23 245 0.9 10 267 1.3
Total 3 404 942 100.0 2 607 816 100.0 797 125 100.0
Rural
No contract 3 727 714 79.9 3 326 460 84.7 401 254 54.2
Unlimited duration 548 964 11.8 347 929 8.9 201 035 27.2
Limited duration 388 401 8.3 250 676 6.4 137 724 18.6
Less than 12 months 84 605 1.8 61 249 1.6 23 355 3.2
12 months to less than 36 months
283 724 6.1 173 248 4.4 110 476 14.9
36 months or more 20 072 0.4 16 179 0.4 3 893 0.5
Total 4 665 079 100.0 3 925 065 100.0 740 013 100.0
Source: SWTS-Egypt, 2012.
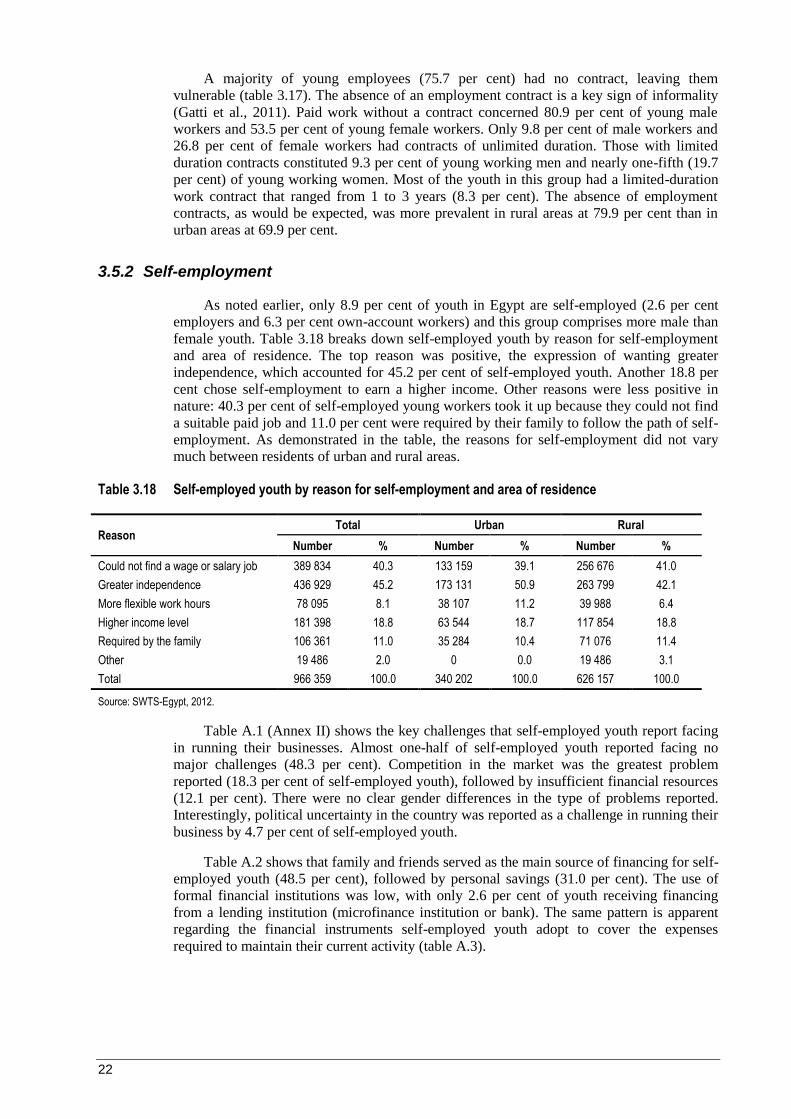
22
A majority of young employees (75.7 per cent) had no contract, leaving them
vulnerable (table 3.17). The absence of an employment contract is a key sign of informality
(Gatti et al., 2011). Paid work without a contract concerned 80.9 per cent of young male
workers and 53.5 per cent of young female workers. Only 9.8 per cent of male workers and
26.8 per cent of female workers had contracts of unlimited duration. Those with limited
duration contracts constituted 9.3 per cent of young working men and nearly one-fifth (19.7
per cent) of young working women. Most of the youth in this group had a limited-duration
work contract that ranged from 1 to 3 years (8.3 per cent). The absence of employment
contracts, as would be expected, was more prevalent in rural areas at 79.9 per cent than in
urban areas at 69.9 per cent.
3.5.2 Self-employment
As noted earlier, only 8.9 per cent of youth in Egypt are self-employed (2.6 per cent
employers and 6.3 per cent own-account workers) and this group comprises more male than
female youth. Table 3.18 breaks down self-employed youth by reason for self-employment
and area of residence. The top reason was positive, the expression of wanting greater
independence, which accounted for 45.2 per cent of self-employed youth. Another 18.8 per
cent chose self-employment to earn a higher income. Other reasons were less positive in
nature: 40.3 per cent of self-employed young workers took it up because they could not find
a suitable paid job and 11.0 per cent were required by their family to follow the path of self-
employment. As demonstrated in the table, the reasons for self-employment did not vary
much between residents of urban and rural areas.
Table 3.18 Self-employed youth by reason for self-employment and area of residence
Reason Total Urban Rural
Number % Number % Number %
Could not find a wage or salary job 389 834 40.3 133 159 39.1 256 676 41.0
Greater independence 436 929 45.2 173 131 50.9 263 799 42.1
More flexible work hours 78 095 8.1 38 107 11.2 39 988 6.4
Higher income level 181 398 18.8 63 544 18.7 117 854 18.8
Required by the family 106 361 11.0 35 284 10.4 71 076 11.4
Other 19 486 2.0 0 0.0 19 486 3.1
Total 966 359 100.0 340 202 100.0 626 157 100.0
Source: SWTS-Egypt, 2012.
Table A.1 (Annex II) shows the key challenges that self-employed youth report facing
in running their businesses. Almost one-half of self-employed youth reported facing no
major challenges (48.3 per cent). Competition in the market was the greatest problem
reported (18.3 per cent of self-employed youth), followed by insufficient financial resources
(12.1 per cent). There were no clear gender differences in the type of problems reported.
Interestingly, political uncertainty in the country was reported as a challenge in running their
business by 4.7 per cent of self-employed youth.
Table A.2 shows that family and friends served as the main source of financing for self-
employed youth (48.5 per cent), followed by personal savings (31.0 per cent). The use of
formal financial institutions was low, with only 2.6 per cent of youth receiving financing
from a lending institution (microfinance institution or bank). The same pattern is apparent
regarding the financial instruments self-employed youth adopt to cover the expenses
required to maintain their current activity (table A.3).

23
3.5.3 Hours of work and involuntary part-time work
Figure 3.5 shows the employment of youth by actual hours worked per week. It
illustrates clear gender variations in terms of hours of work, with young men more likely to
report working a greater number of hours than young women. A majority of the employed
youth surveyed worked on a full time basis, with 34.1 per cent working 40–49 hours and
39.5 per cent working more than 50 hours. Only 13.4 per cent of young workers (25.5 per
cent of female youth and 10.2 per cent of male youth) were working on a part-time basis
(less than 30 hours per week). A greater percentage of young men fell in the category of
long working hours (more than 50 hours per week); young males were twice as likely to
work long hours than young females (at 44.2 per cent and 21.6 per cent, respectively).
Only 4.2 per cent of youth working less than 30 hours stated they would like to work
more hours; they therefore qualify as “involuntary part-time workers”. The share of young
female involuntary part-time workers (4.8 per cent) was only slightly higher than that of
young males in that category (4.0 per cent).
Figure 3.5 Youth employment by actual hours worked per week and sex
Source: SWTS-Egypt, 2012.
3.5.4 Other job-quality indicators
Figure 3.6 attempts to characterize the youth labour market in the country along a job-
quality continuum, following the framework laid out by the ILO (2013). Regarding the
quality of employment, the left-hand side of the figure lists five indicators within the realm
of low-quality employment:
The share of paid employees with below-average weekly wages or income5 (poorly
paid);
The share of workers that claim dissatisfaction with their current job (unsatisfactory
employment);
5 In Egypt, young wage and salaried workers were asked to identify their average monthly wage in the
previous month among a pre-defined range. Individuals who earned less than 499 EGP were
considered as workers with below-average monthly wages.
5.9
4.3 11
.9
33.7
44.2
9.2
16.3
17.3
35.5
21.6
6.6
6.8
13.0
34.1
39.5
0
5
10
15
20
25
30
35
40
45
50
Less than 20hours
20-29 hours 30-39 hours 40-49 hours More than 50hours
%
Hour band
Male
Female
Total

24
The share of over- or undereducated workers6 (qualifications mismatch);
The share of workers in informal employment7 (informal employment); and
The share of workers with contract duration of less than 12 months, own-account
workers and contributing (unpaid) family workers8 (irregular employment).
The blue bars in figure 3.6 illustrate the shares of better-quality employment based on
above-average wages, reported level of job satisfaction, qualifications, formality (security)
and stability. The chart shows some very interesting insights. While eight in ten surveyed
young workers were in irregular employment and nine in ten were in informal employment,
the qualifications mismatch nevertheless impacted fewer than one-half of the workers, low
pay impacted only one young worker in four and young workers had a strong tendency to
express general satisfaction with their job.
Among employed youth, informal employment strongly correlates with poor job
quality, with 91.1 per cent of working youth classified in informal employment and, from
the analysis of data on work irregularity, with 81.1 per cent of jobs being classified as
irregular.
Figure 3.6 Indicators measuring the quality of youth employment
Note: The indicators are shares in total youth employment except for (a) the shares of workers earning below-average, average and above-average wages, which are percentages of young employees and own-account workers only, (b) shares of overeducated and undereducated workers, which are percentages of employed youth with completed education (i.e. excluding currently working students) and (c) satisfied or non-satisfied workers, excluding those who expressed a neutral opinion.
Source: SWTS-Egypt, 2012.
6 The methodology applied was that of the normative ISCO-based approach mentioned in this section.
7 Informal employment is measured according to the guidelines recommended by the 17th
International Conference of Labour Statisticians (ICLS, 2003). It includes the following sub-
categories of workers: (a) paid employees in “informal jobs”, i.e. jobs without a social security
entitlement, paid annual leave or paid sick leave; (b) paid employees in an unregistered enterprise
with size classification below five employees; (c) own-account workers in an unregistered enterprise
with size classification below five employees; (d) employers in an unregistered enterprise with size
classification below five employees; and (e) contributing family workers.
8 Persons not classifiable by employment status are also included in the irregular employment
category.
18.9
8.9
52.3
78.8
75.6
81.1
91.1
47.7
21.2
24.4
0% 10% 20% 30% 40% 50% 60% 70% 80% 90% 100%
Share of workers in regular or irregular employment
Share of workers in formal or informal employment
Share of working with matching or non-matchingqualifications
Share in workers in satisfactory or unsatisfactoryemployment
Share of paid workers with above-average or below-average earnings
Quality work Low quality work

25
Qualifications mismatch
The data on qualifications matching is based on the application of the normative
measure of occupational skills categories from the International Standard Classification of
Occupations (ISCO). ISCO-08 includes the categorization of major occupational groups
(first-digit ISCO levels) by level of education in accordance with the International Standard
Classification of Education (ISCED)9 reproduced in table 3.19.
Table 3.19 ISCO major groups and education levels
ISCO major group Broad occupation group Education level
Managers
High-skilled non-manual Tertiary (ISCED 5–6) Professionals
Technicians & associate professionals
Clerical support workers Low-skilled non-manual
Service & sales workers
Skilled agricultural & fishery workers Secondary (ISCED 3–4)
Craft & related trades workers Skilled manual
Plant & machine operators & assemblers
Elementary occupations Unskilled Primary (ISCED 1–2)
Source: ILO, 2013, table 3.
Workers in a particular group who have the assigned level of education are considered
well-matched. Those who have a higher level of education are considered overeducated and
those with a lower level of education are considered undereducated. For instance, a
university graduate working as a clerk (a low-skilled, non-manual occupation) is
overeducated, while a secondary school graduate working as an engineer (a high-skilled,
non-manual occupation) is undereducated.
Just under one-half of surveyed working youth in Egypt (with completed education)
were in occupations that did not match their level of education. Table 3.20 provides the
breakdown: 8.8 per cent were classified as overeducated and 38.9 per cent were classified as
undereducated. The remaining 52.3 per cent of young workers were engaged in a job that
matched their level of achieved education well.
Table 3.20 Overeducated and undereducated young workers by major occupational category (ISCO-08, %)
Major occupational category (ISCO-08) Overeducated Undereducated Matching qualification
Managers 0.0 68.6 31.4
Professionals 0.0 7.4 92.6
Technicians & associate professionals 0.0 77.8 22.2
Clerical support workers 43.2 1.8 55
Service & sales workers 14.1 23.6 62.4
Skilled agricultural & fishery workers 3.2 50.3 46.5
Craft & related trades workers 3.6 49.0 47.5
Plant & machine operators & assemblers 4.6 40.4 55.0
Elementary occupations 59.9 13.1 27.0
Total 8.8 38.9 52.3
Source: SWTS-Egypt, 2012.
9 For more information on the ISCO-based approach along with other methods of measuring skills
mismatches, see Quintini (2011).

26
The phenomenon of overeducation tends to take place when an insufficient number of
jobs match a certain level of education. The mismatch in supply and demand forces some of
the degree holders to take up available work that they are subsequently overqualified to
perform. The overeducated are mainly found in clerical positions (43.2 per cent of young
clerks are overeducated) or in elementary occupations (59.9 per cent). It is likely that many
of the overeducated are taking up these jobs as an alternative to unemployment when they
are unable to find a job that better matches their level of education. The consequence is that
overeducated youth are likely to earn less than they otherwise could have and are not
making the most of their productive potential. Another consequence is the crowding out of
youth at the bottom of the educational pyramid. The less-educated youth find themselves at
the back of the queue even for those jobs for which they are best qualified.
Undereducated working youth are more prevalent in Egypt than those who are
overeducated, especially in the occupations of managers (68.6 per cent), technicians (77.8
per cent),10
skilled agricultural and fishery workers (50.3 per cent) and craft workers (49.0
per cent). The undereducation of workers can have a negative impact on worker productivity
and thus on the output of the enterprise but also, more personally, on the sense of security of
the young worker. The question remains whether on-the-job training is a sufficient substitute
for formal education.
Wages
Low wages are a key concern in youth employment. Limited work experience places
young workers at a disadvantage in terms of wage negotiations. Figure 3.6 shows that one-
quarter of young wage and salaried workers reported a monthly wage that was below the
average. Table 3.21 presents the monthly wages of young wage and salaried workers by
occupation. It shows that about one-half of young employees were within the pay range of
EGP 500–999 per month.11
Professionals made up the highest percentage of young workers
in the highest wage bracket of EGP 3,000 and above (2.6 per cent). Conversely, agricultural
workers, clerks and youth in elementary occupations were those most likely to have reported
the lowest wage range (less than EGP 300 per month).
Gender disparity in pay was obvious in the data for young wage and salaried workers.
The largest proportion of both male and female employees reported their monthly wage in
the middle range of EGP 500–999 (49.4 per cent for males and 43.6 per cent for females),
but there was a higher representation of young female than male workers among the lower
wage ranges: 17.7 per cent earned less than EGP 300 and 25.7 per cent made between EGP
300 and 499, compared to 7.3 per cent and 16.3 per cent of young males in the two ranges,
respectively. Similarly, in the higher pay brackets, while 12.1 per cent of female employees
claimed to have earned at least EGP 1,000 a month, the corresponding share of young male
workers at that level was 26.2 per cent.
10
Undereducation in this category is likely to be overstated in the context of Egypt where most
technical positions require education/training at the TVET level, not the tertiary level as dictated in
the general classification of table 3.19.
11 The UN operational exchange rate on 1 November 2012 (at the start of the survey field work) was
US$1 = 6.1 Egyptian pounds (EGP). The EGP 500–999 range, the monthly wage range claimed by a
majority of young workers, was the equivalent of US$ 82–164 per month.

27
Table 3.21 Wage and salaried youth by occupation, sex and monthly wage (in Egyptian pounds)
Occupation & sex Total Less than
300 (%)
300–499 (%)
500–999 (%)
1 000– 2 999 (%)
3 000 & above (%)
Do not know (%)
Total
Managers 41 088 0.0 0.0 52.5 47.5 0.0 0.0
Professionals 965 216 10.7 11.4 39.2 35.7 2.6 0.6
Technicians & associate professionals
574 586 10.6 12.7 48.8 27.9 0.0 0.0
Clerks 256 377 12.4 17.4 42.3 27.9 0.0 0.0
Service workers, shop & market sales workers
1 316 006 9.2 19.2 51.5 19.8 0.0 0.3
Skilled agricultural & fishery workers
898 562 15.2 31.0 45.7 7.2 0.5 0.4
Craft & related trades workers 2 390 892 6.7 18.7 48.3 25.3 0.7 0.4
Plant & machine operators & assemblers
1 127 765 7.1 13.2 56.2 23.2 0.4 0.0
Elementary occupations 499 526 10.8 21.5 46.3 21.4 0.0 0.0
Total 8 070 019 9.3 18.0 48.3 23.5 0.6 0.3
Male
Managers 35 099 0.0 0.0 44.4 55.6 0.0 0.0
Professionals 501 553 7.1 7.1 35.6 46.3 3.9 0.0
Technicians & associate professionals
338 930 3.2 9.3 45.1 42.4 0.0 0.0
Clerks 107 621 0.0 3.8 56.2 40 0.0 0.0
Service workers, shop & market sales workers
1 040 221 4.7 15.4 56.5 23.4 0.0 0.0
Skilled agricultural & fishery workers
780 449 14.6 29.5 46.6 8.3 0.5 0.5
Craft & related trades workers 2 368 574 6.8 18.3 48.3 25.6 0.7 0.4
Plant & machine operators & assemblers
911 724 6.3 9.7 55.4 28.1 0.4 0
Elementary occupations 448 710 10.8 18.4 48.3 22.5 0.0 0.0
Total 6 532 880 7.3 16.3 49.4 26.2 0.7 0.2
Female
Managers 5 989 0.0 0.0 100.0 0.0 0.0 0.0
Professionals 463 664 14.5 16.1 43.0 24.2 1.1 1.2
Technicians & associate professionals
235 657 21.2 17.5 54.2 7.1 0.0 0.0
Clerks 148 757 21.3 27.3 32.3 19.1 0.0 0.0
Service workers, shop & market sales workers
275 785 26.2 33.6 32.6 6.1 0.0 1.4
Skilled agricultural & fishery workers
118 113 19.2 41 39.8 0.0 0.0 0.0
Craft & related trades workers 22 318 0.0 53.7 46.3 0.0 0.0 0.0
Plant & machine operators & assemblers
216 041 10.6 27.9 59.2 2.4 0.0 0.0
Elementary occupations 50 816 11.0 48.3 28.8 11.9 0.0 0.0
Total 1 537 139 17.7 25.7 43.6 12.1 0.3 0.6
Source: SWTS-Egypt, 2012.
Informal employment
At 91.1 per cent, almost all young surveyed workers in Egypt were classified in
informal employment, according to figure 3.6. The share of informal employment was only
slightly higher in rural than urban areas at 92.0 and 89.7 per cent, respectively (table 3.22).
Informal employment is made up of two subdivisions: workers in the informal
(unregistered) sector and paid employees holding informal jobs in the formal sector. The
latter earn a salary but do not receive the other benefits, such as social security contributions

28
or paid annual or sick leave that would normally be associated with a job in the formal
sector. Given the dominance of paid employment among youth in the country, it is not
surprising to find that a majority were informally employed youth because of their
engagement in an informal job in the formal sector (63.5 per cent). The remaining 36.5 per
cent were employed in the informal sector (table 3.22).
The gender differences in informal employment shares are not stark, with the share
among male workers slightly higher at 92.1 per cent compared to 87.7 per cent among
female workers. The prevalence of informal sector employment (compared to informal
employment in the formal sector) is slightly higher among young males than young females
and youth in rural areas.
Table 3.22 Employed youth in informal employment by sub-category, area of residence and sex (%)
Sub-category Total Urban Rural
Total Male Female Total Male Female Total Male Female
Informal employment rate 91.1 92.1 87.7 89.7 90.6 86.5 92.0 92.9 88.4
Categories of informal employment
Employed in informal sector 36.5 38.3 29.5 31.3 35.9 13.7 39.5 39.6 39.2
Employed in informal job in formal sector
63.5 61.7 70.5 68.7 64.1 86.3 60.5 60.4 60.8
Total 100.0 100.0 100.0 100.0 100.0 100.0 100.0 100.0 100.0
Source: SWTS-Egypt, 2012.
3.5.5 Security and satisfaction
Close to one-fifth (19.7 per cent) of employed youth expressed dissatisfaction with
their work (13.7 per cent were somewhat unsatisfied and 6.0 per cent were very unsatisfied)
(table A.4). Only 22.7 per cent of youth described themselves as very satisfied and a
majority (50.8 per cent) described themselves as somewhat satisfied. These data should be
considered with caution since prevalent cultural and religious beliefs discourage expressing
dissatisfaction; perhaps a more accurate measure of job satisfaction is that reflected in the
young workers’ desire to change their current job. As many as one-half (50.1 per cent) of
working youth indicated they would like to change their current job (53.2 per cent of young
male workers and 38.3 per cent of young female workers).
Reasons for wanting to change the current job are shown in figure 3.7. The temporary
nature of work was listed as a reason by 28.9 per cent of employed youth who wanted to
change jobs. Other reasons related to the skill level of the job, i.e. it did not match the young
workers’ levels of qualification (22.8 per cent, with a higher response rate among young
women than men). At 21.4 per cent, the desire for higher pay was the third most common
reason for wanting to change jobs (and the second most common reason given by young
females).
Another area of concern was hinted to in the fact that as many as 50.1 per cent of
young working males expressed a willingness to migrate for employment purposes
(presumably to find a better job). Table A.5 shows the breakdown: 21.5 per cent of male
youth indicated they would move to a capital city, 11.5 per cent noted they would move to a
town/city (probably greater Cairo), as many as 15.8 per cent stated they would move to
another country and 1.3 per cent were willing to move to a rural area. The attraction –
whether push or pull – towards migration seems to have existed in young males only. Only
6.6 per cent of young female workers said they would move to the capital city for
employment purposes and just 2.8 per cent indicated they would consider moving abroad.
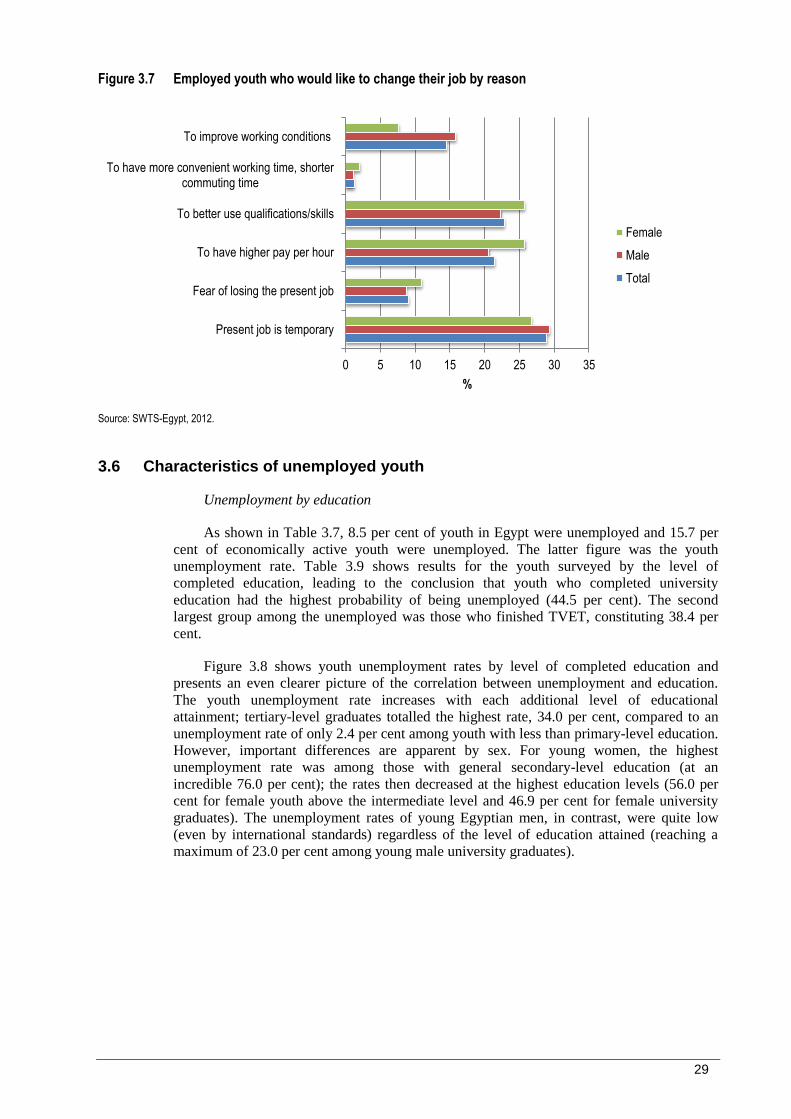
29
Figure 3.7 Employed youth who would like to change their job by reason
Source: SWTS-Egypt, 2012.
3.6 Characteristics of unemployed youth
Unemployment by education
As shown in Table 3.7, 8.5 per cent of youth in Egypt were unemployed and 15.7 per
cent of economically active youth were unemployed. The latter figure was the youth
unemployment rate. Table 3.9 shows results for the youth surveyed by the level of
completed education, leading to the conclusion that youth who completed university
education had the highest probability of being unemployed (44.5 per cent). The second
largest group among the unemployed was those who finished TVET, constituting 38.4 per
cent.
Figure 3.8 shows youth unemployment rates by level of completed education and
presents an even clearer picture of the correlation between unemployment and education.
The youth unemployment rate increases with each additional level of educational
attainment; tertiary-level graduates totalled the highest rate, 34.0 per cent, compared to an
unemployment rate of only 2.4 per cent among youth with less than primary-level education.
However, important differences are apparent by sex. For young women, the highest
unemployment rate was among those with general secondary-level education (at an
incredible 76.0 per cent); the rates then decreased at the highest education levels (56.0 per
cent for female youth above the intermediate level and 46.9 per cent for female university
graduates). The unemployment rates of young Egyptian men, in contrast, were quite low
(even by international standards) regardless of the level of education attained (reaching a
maximum of 23.0 per cent among young male university graduates).
0 5 10 15 20 25 30 35
Present job is temporary
Fear of losing the present job
To have higher pay per hour
To better use qualifications/skills
To have more convenient working time, shortercommuting time
To improve working conditions
%
Female
Male
Total

30
Figure 3.8 Youth unemployment rates by level of completed educational attainment and sex
Source: SWTS-Egypt, 2012.
Unemployment duration
Table 3.23 shows that 50.2 per cent of unemployed youth spent 2 or more years
searching for a job. The extent of long-term unemployment among youth in Egypt is thus
extremely high. A higher percentage of female youth spent over 2 years job searching (57.7
per cent) than male youth (33.7 per cent). Another 22.1 per cent of unemployed females and
21.4 per cent of unemployed males reported looking for work between 1 and 2 years. It has
been repeatedly documented that long-term unemployment among youth has negative
consequences, not only on skills and causing financial losses, but it also contributes to
lowered self-esteem.
Table3.23 Unemployed youth by job search duration and sex
Duration Total Male Female
Number % Number % Number %
Less than 1 week 22 761 1.1 3 264 0.5 19 497 1.4
1 week to less than 1 month 75 715 3.7 42 180 6.7 33 535 2.4
1 month to less than 3 months 61 641 3.0 35 608 5.6 26 034 1.9
3 months to less than 6 months 191 150 9.4 89 414 14.2 101 736 7.3
6 months to less than 1 year 215 144 10.6 113 408 18.0 101 736 7.3
1 year to less than 2 years 442 845 21.8 134 823 21.4 308 022 22.1
2 years or more 1 018 001 50.2 212 683 33.7 805 318 57.7
Total 2 027 258 100.0 631 380 100.0 1 395 878 100.0
Source: SWTS-Egypt, 2012.
The survey asked jobless youth to identify the main obstacles to finding work. Limited
availability of jobs was the obstacle reported by 64.0 per cent of unemployed youth (table
3.24). While a higher percentage of female than male unemployed youth (67.9 per cent
versus 55.3 per cent) reported job unavailability as the main obstacle, only 1.2 per cent of
unemployed female youth (and no male unemployed youth) stated that their sex (being male
2.4 4.5
15.8 20.1
27.2
34.0
1.4 1.8 4.6
6.9 11.2
23.0
5.9
17.1
46.3
76.0
56.0
46.9
0
10
20
30
40
50
60
70
80
Less thanprimary
Primary TVET Secondarygeneral
Aboveintermediate
Tertiary
%
Total Male Female

31
or female) was an obstacle to finding work. Young women were also more likely than young
men to cite discriminatory practices as an obstacle to finding work, while young men were
more likely to cite the low wages or poor working conditions of available jobs as principal
obstacles.
Table 3.24 Unemployed youth by main obstacle to finding work, sex and area of residence (%)
Obstacle Total Male Female Urban Rural
Requirements for job were higher than education/training received
2.9 3.2 2.7 2.2 3.5
Not enough work experience 8.4 12.5 6.6 12.2 4.8
Not enough jobs available 64.0 55.3 67.9 52.5 75.0
Considered too young 0.8 0.6 0.8 0.4 1.1
Being male/female 0.8 0.0 1.2 1.2 0.5
Discriminatory prejudices 3.1 1.9 3.6 3.3 2.9
Low wages in available jobs 4.3 6.9 3.2 6.2 2.6
Poor working conditions in available jobs 7.7 9.6 6.9 11.3 4.3
Did not know how and where to seek work 3.7 4.3 3.4 3.9 3.5
Other 4.3 5.7 3.7 6.7 2.0
Total 100.0 100.0 100.0 100.0 100.0
Source: SWTS-Egypt, 2012.
The job search
Young people were asked about their job search method; the information presented in
Table 3.25 allows comparability between the job search methods used by employed youth
(how they found their job) and unemployed youth looking for work. Consulting informal
networks of friends and relatives was the job search method that led to jobs for a majority of
the employed youth (63.9 per cent). Among unemployed youth, the most frequent response
was registration at an employment office (32.5 per cent) followed by 30.4 per cent who
asked family and friends. Responding to job advertisements was a method followed by 17.1
per cent of unemployed youth, but the fact that only 1.7 per cent of the employed youth
reported it as the method used for finding their job demonstrates that it did not often prove
successful. The danger of using informal networks to attain jobs is that it creates an
outsider–insider effect. Those without “good” contacts are clearly those who remain
unemployed.
Table 3.26 looks at the occupations sought by unemployed youth. Most unemployed
youth sought jobs as professionals (46.5 per cent), followed by technicians and associate
professionals (29.6 per cent), while only 0.5 per cent looked for jobs as skilled agricultural
and fishery workers. No significant differences between male and female jobseekers were
observed in terms of occupation sought; more young males than young females sought work
in the areas of sales and crafts work, while more young women sought an elementary
occupation, although the differences were not large.

32
Table 3.25 Employed and unemployed youth by job search method
Method Employed Unemployed
Number % Number %
Registered at an employment centre 270 796 2.5 644 941 32.5
Placed/answered job advertisements 188 189 1.7 339 090 17.1
Inquired directly at factories, farms, markets shops or other workplaces
642 413 5.9 185 777 9.4
Took a test or interviewed 399 149 3.7 88 451 4.5
Asked friends, relatives, acquaintances 6 974 140 63.9 603 425 30.4
Searched the Internet 41 617 0.4 95 330 4.8
Mobile phone search 10 178 0.1 4 255 0.2
Waited on the street to be recruited for casual work
45 683 0.4 0 0.0
Sought financial assistance to look for work or start a business
220 636 2.0 4 265 0.2
Looked for land, building, equipment, machinery to start own business or farm
45 950 0.4 4 012 0.2
Applied for permit or licence to start a business 42 440 0.4 0 0.0
Other 2 035 277 18.6 15 824 0.8
Total 10 916 469 100.0 1 985 371 100.0
Source: SWTS-Egypt, 2012.
Table 3.26 Unemployed youth by occupation sought, sex and area of residence (%)
Occupation Total Male Female Urban Rural
Legislators, senior officials & managers 1.0 1.3 0.9 1.5 0.6
Professionals 46.5 46.9 46.2 56.1 37.3
Technicians & associate professionals 29.6 31.1 29.0 22.0 36.9
Clerks 8.8 1.3 12.2 8.4 9.2
Service workers, shop & market sales workers
4.0 7.5 2.4 6.5 1.6
Skilled agricultural & fishery workers 0.5 0.7 0.4 0.0 1.0
Craft & related trades workers 3.1 5.9 1.8 2.5 3.6
Plant & machine operators & assemblers 3.7 3.9 3.6 1.6 5.6
Elementary occupations 2.9 1.3 3.7 1.5 4.3
Total 100.0 100.0 100.0 100.0 100.0
Source: SWTS-Egypt, 2012.
Table 3.27 shows the high demand for government and public sector employment; 80.5
per cent of unemployed youth looked to work for the government or public sector.
Government and public sector employment was more in demand by female youth, with 86.8
per cent of unemployed young women seeking employment in that sector, in comparison to
66.7 per cent of unemployed young men. It was also more in demand by unemployed youth
in rural areas (87.9 per cent) than in urban areas (72.8 per cent). The public sector cannot
realistically absorb the large number of young jobseekers, which explains the very high rates
of unemployment in the country, especially among young women. Still, the public sector
offers the only hope of employment for many young women. It remains the preferred choice
of many young people due to three factors: status, security and benefits. Fewer than one-fifth
(17.4 per cent) of unemployed youth wanted to work for private companies, with almost
three times as many males than females (30.3 per cent and 11.6 per cent, respectively)
seeking those jobs. Only 0.8 per cent of unemployed youth sought to be entrepreneurs.

33
Table3.27 Unemployed youth by type of employer sought, sex and area of residence (%)
Employer sought Total Male Female Urban Rural
Work for myself (own business/farm) 0.8 1.7 0.4 1.1 0.6
Work for the government/public sector 80.5 66.7 86.8 72.8 87.9
Work for a private company 17.4 30.3 11.6 23.6 11.5
Work for an international or organization
1.1 0.6 1.2 2.2 0.0
Work for family business/farm 0.2 0.6 0.0 0.4 0.0
Total 100.0 100.0 100.0 100.0 100.0
Source: SWTS-Egypt, 2012.
If the occupational distribution of the surveyed working youth can be taken as an
indication of the demand for young labour, then comparing the distribution of occupations
sought by unemployed youth can serve to identify supply and demand mismatches. As
illustrated in figure 3.9 and table 3.26, unemployed youth looked for work mainly in the
higher skilled occupations: as professionals (46.5 per cent), technicians (29.6 per cent) and
clerks (8.8 per cent), with the remaining occupations obtaining less than 5 per cent of
responses. In comparison, the top five occupations held by employed youth were craft and
related trades work (23.8 per cent), skilled agricultural and fishery work (22.7 per cent),
work in sales and services (15.8 per cent), jobs as plant and machine operators and
assemblers (12.5 per cent) and as “professionals” (9.3 per cent). If the distribution
comparison is used as a mismatch indicator, the mismatch between where the jobs were and
where unemployed youth were seeking them becomes clear. The largest gap is evident in the
category of “professionals”, an occupation that employed less than one-tenth (9.3 per cent)
of employed youth, yet one sought by almost one-half of unemployed youth (46.5 per cent).
On the other hand, craft work was sought by only 3.1 per cent of unemployed youth
although that occupation employed 23.8 per cent of the youth with jobs.
Figure 3.9 Unemployed youth by occupation sought and employed youth by occupation
Source: SWTS-Egypt, 2012.
2.0
9.3
5.8
2.4
15.8
22.7
23.8
12.5
5.8
1.0
46.5
29.6
8.8
4.0
0.5
3.1
3.7
2.9
0 5 10 15 20 25 30 35 40 45 50
Managers
Professionals
Technicians and associate professionals
Clerks
Service workers, shop and market sales workers
Skilled agricultural and fishery workers
Craft and related trade workers
Plant and machine operators and assemblers
Elementary occupations
%
Unemployed Employed
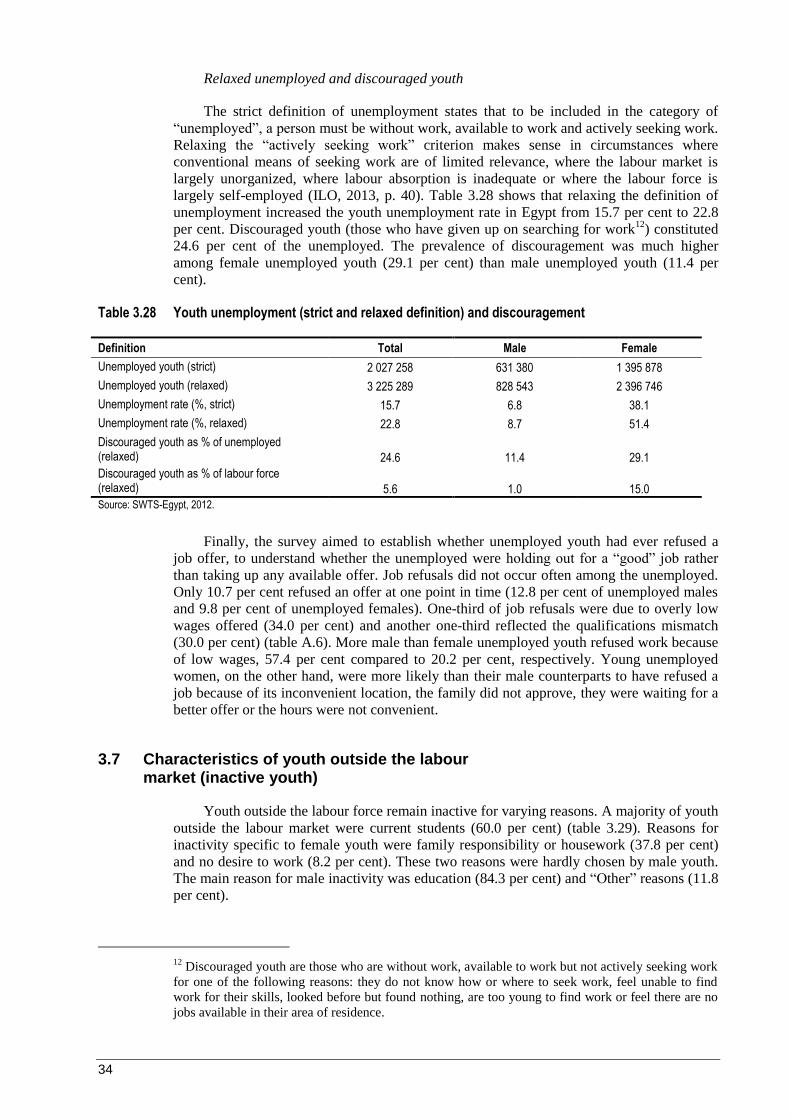
34
Relaxed unemployed and discouraged youth
The strict definition of unemployment states that to be included in the category of
“unemployed”, a person must be without work, available to work and actively seeking work.
Relaxing the “actively seeking work” criterion makes sense in circumstances where
conventional means of seeking work are of limited relevance, where the labour market is
largely unorganized, where labour absorption is inadequate or where the labour force is
largely self-employed (ILO, 2013, p. 40). Table 3.28 shows that relaxing the definition of
unemployment increased the youth unemployment rate in Egypt from 15.7 per cent to 22.8
per cent. Discouraged youth (those who have given up on searching for work12
) constituted
24.6 per cent of the unemployed. The prevalence of discouragement was much higher
among female unemployed youth (29.1 per cent) than male unemployed youth (11.4 per
cent).
Table 3.28 Youth unemployment (strict and relaxed definition) and discouragement
Definition Total Male Female
Unemployed youth (strict) 2 027 258 631 380 1 395 878
Unemployed youth (relaxed) 3 225 289 828 543 2 396 746
Unemployment rate (%, strict) 15.7 6.8 38.1
Unemployment rate (%, relaxed) 22.8 8.7 51.4
Discouraged youth as % of unemployed (relaxed) 24.6 11.4 29.1
Discouraged youth as % of labour force (relaxed) 5.6 1.0 15.0
Source: SWTS-Egypt, 2012.
Finally, the survey aimed to establish whether unemployed youth had ever refused a
job offer, to understand whether the unemployed were holding out for a “good” job rather
than taking up any available offer. Job refusals did not occur often among the unemployed.
Only 10.7 per cent refused an offer at one point in time (12.8 per cent of unemployed males
and 9.8 per cent of unemployed females). One-third of job refusals were due to overly low
wages offered (34.0 per cent) and another one-third reflected the qualifications mismatch
(30.0 per cent) (table A.6). More male than female unemployed youth refused work because
of low wages, 57.4 per cent compared to 20.2 per cent, respectively. Young unemployed
women, on the other hand, were more likely than their male counterparts to have refused a
job because of its inconvenient location, the family did not approve, they were waiting for a
better offer or the hours were not convenient.
3.7 Characteristics of youth outside the labour market (inactive youth)
Youth outside the labour force remain inactive for varying reasons. A majority of youth
outside the labour market were current students (60.0 per cent) (table 3.29). Reasons for
inactivity specific to female youth were family responsibility or housework (37.8 per cent)
and no desire to work (8.2 per cent). These two reasons were hardly chosen by male youth.
The main reason for male inactivity was education (84.3 per cent) and “Other” reasons (11.8
per cent).
12
Discouraged youth are those who are without work, available to work but not actively seeking work
for one of the following reasons: they do not know how or where to seek work, feel unable to find
work for their skills, looked before but found nothing, are too young to find work or feel there are no
jobs available in their area of residence.
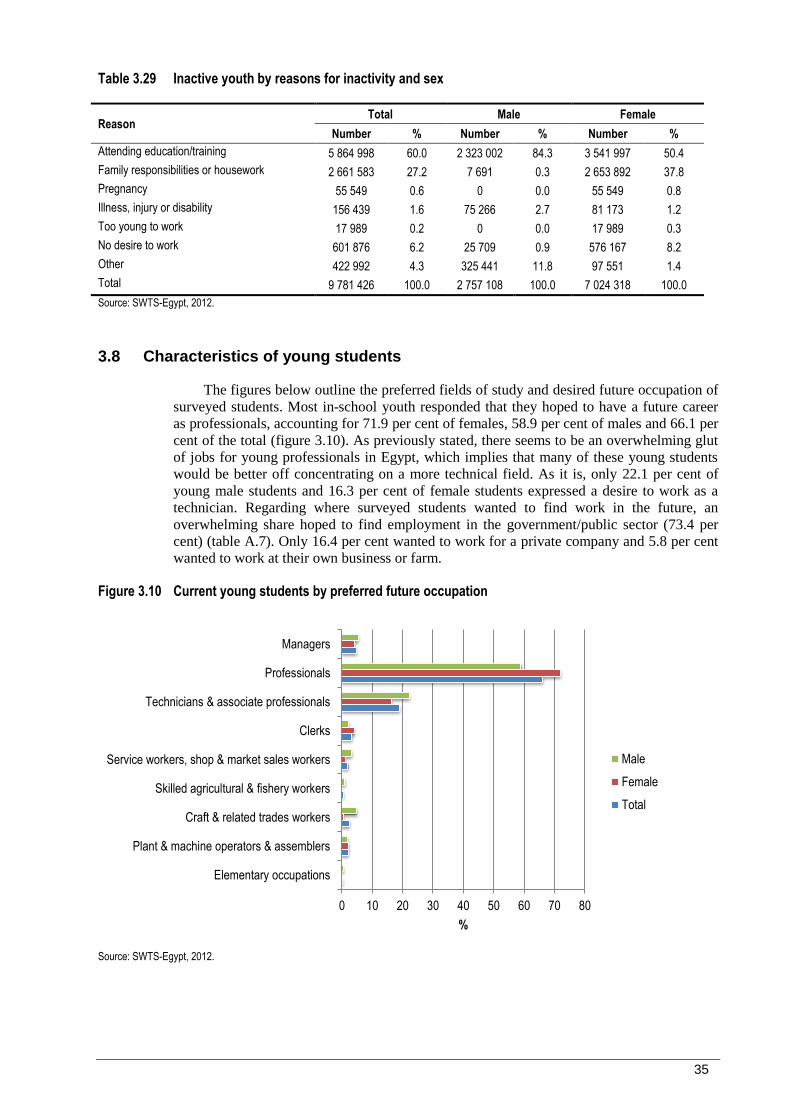
35
Table 3.29 Inactive youth by reasons for inactivity and sex
Reason Total Male Female
Number % Number % Number %
Attending education/training 5 864 998 60.0 2 323 002 84.3 3 541 997 50.4
Family responsibilities or housework 2 661 583 27.2 7 691 0.3 2 653 892 37.8
Pregnancy 55 549 0.6 0 0.0 55 549 0.8
Illness, injury or disability 156 439 1.6 75 266 2.7 81 173 1.2
Too young to work 17 989 0.2 0 0.0 17 989 0.3
No desire to work 601 876 6.2 25 709 0.9 576 167 8.2
Other 422 992 4.3 325 441 11.8 97 551 1.4
Total 9 781 426 100.0 2 757 108 100.0 7 024 318 100.0
Source: SWTS-Egypt, 2012.
3.8 Characteristics of young students
The figures below outline the preferred fields of study and desired future occupation of
surveyed students. Most in-school youth responded that they hoped to have a future career
as professionals, accounting for 71.9 per cent of females, 58.9 per cent of males and 66.1 per
cent of the total (figure 3.10). As previously stated, there seems to be an overwhelming glut
of jobs for young professionals in Egypt, which implies that many of these young students
would be better off concentrating on a more technical field. As it is, only 22.1 per cent of
young male students and 16.3 per cent of female students expressed a desire to work as a
technician. Regarding where surveyed students wanted to find work in the future, an
overwhelming share hoped to find employment in the government/public sector (73.4 per
cent) (table A.7). Only 16.4 per cent wanted to work for a private company and 5.8 per cent
wanted to work at their own business or farm.
Figure 3.10 Current young students by preferred future occupation
Source: SWTS-Egypt, 2012.
0 10 20 30 40 50 60 70 80
Elementary occupations
Plant & machine operators & assemblers
Craft & related trades workers
Skilled agricultural & fishery workers
Service workers, shop & market sales workers
Clerks
Technicians & associate professionals
Professionals
Managers
%
Male
Female
Total
36
4. The stages of transition
4.1 Concepts and definitions13
The labour market transition of young people concerns not only the length of time from
their exit from education (either upon graduation or early exit without completion) to their
first entry into any job, but also relates to qualitative factors, such as whether the job is
stable (measured by contract type). The SWTS was designed to apply a stricter definition of
“stable employment” than is typically used. By starting from the premise that a person has
not “transited” until settled in a job that meets very basic criteria of stability, as defined by
the duration of the employment contract, the SWTS analytical framework introduces a new
element of quality to the standard definition of labour market transition. However, as seen in
section 5, only a small share of youth in developing economies attain stable employment
and, if the “end goal” does not fit reality, then perhaps the statistics are not framed widely
enough. Thus job satisfaction was added as a component and built into the concept of labour
market transition.
More specifically, labour market transition is defined as the passage of a young person
(aged 15–29) from the end of schooling (or entry to first economic activity) to the first stable
or satisfactory job. Stable employment is defined in terms of the employment contract
(written or oral) and the contract duration (greater than 12 months). Introducing the issue of
a contract automatically excludes the employment status of self-employed, where the
employment relationship is not defined by a contract. The opposite of stable employment is
temporary employment, or wage and salaried employment of limited duration. Satisfactory
employment is a subjective concept, based on the self-assessment of the jobholder. It implies
that respondents consider their jobs to be a good “fit” with their desired employment path at
that moment in time. The contrary is termed non-satisfactory employment, implying a sense
of dissatisfaction with the job.
Based on this definition of labour market transition, the stages of transition are
classified as follows:
Transited – A young person who has “transited” is one who is currently employed in:
- a stable job, whether satisfactory or non-satisfactory; or
- a satisfactory but temporary job; or
- satisfactory self-employment.
In transition – A young person still “in transition” is one who is currently:
- unemployed (relaxed definition); or
- employed in a temporary and non-satisfactory job; or
- in non-satisfactory self-employment; or
- inactive and not in education or training, with an aim to look for work later.
Transition not yet started – A young person whose “transition has not yet started” is one
who is currently:
- still in school and inactive (inactive student); or
- inactive and not in education or training (inactive non-student), with no intention of
looking for work.
13
This section is adapted from ILO, 2013, Chapter 5.
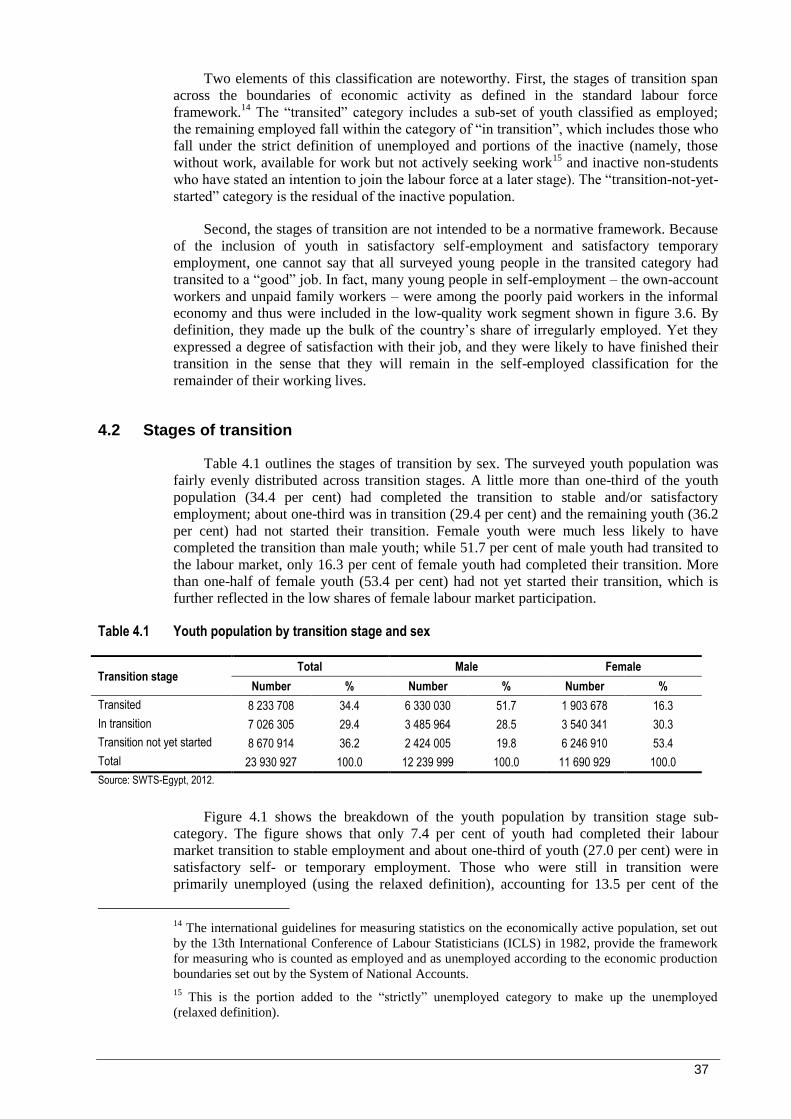
37
Two elements of this classification are noteworthy. First, the stages of transition span
across the boundaries of economic activity as defined in the standard labour force
framework.14
The “transited” category includes a sub-set of youth classified as employed;
the remaining employed fall within the category of “in transition”, which includes those who
fall under the strict definition of unemployed and portions of the inactive (namely, those
without work, available for work but not actively seeking work15
and inactive non-students
who have stated an intention to join the labour force at a later stage). The “transition-not-yet-
started” category is the residual of the inactive population.
Second, the stages of transition are not intended to be a normative framework. Because
of the inclusion of youth in satisfactory self-employment and satisfactory temporary
employment, one cannot say that all surveyed young people in the transited category had
transited to a “good” job. In fact, many young people in self-employment – the own-account
workers and unpaid family workers – were among the poorly paid workers in the informal
economy and thus were included in the low-quality work segment shown in figure 3.6. By
definition, they made up the bulk of the country’s share of irregularly employed. Yet they
expressed a degree of satisfaction with their job, and they were likely to have finished their
transition in the sense that they will remain in the self-employed classification for the
remainder of their working lives.
4.2 Stages of transition
Table 4.1 outlines the stages of transition by sex. The surveyed youth population was
fairly evenly distributed across transition stages. A little more than one-third of the youth
population (34.4 per cent) had completed the transition to stable and/or satisfactory
employment; about one-third was in transition (29.4 per cent) and the remaining youth (36.2
per cent) had not started their transition. Female youth were much less likely to have
completed the transition than male youth; while 51.7 per cent of male youth had transited to
the labour market, only 16.3 per cent of female youth had completed their transition. More
than one-half of female youth (53.4 per cent) had not yet started their transition, which is
further reflected in the low shares of female labour market participation.
Table 4.1 Youth population by transition stage and sex
Transition stage Total Male Female
Number % Number % Number %
Transited 8 233 708 34.4 6 330 030 51.7 1 903 678 16.3
In transition 7 026 305 29.4 3 485 964 28.5 3 540 341 30.3
Transition not yet started 8 670 914 36.2 2 424 005 19.8 6 246 910 53.4
Total 23 930 927 100.0 12 239 999 100.0 11 690 929 100.0
Source: SWTS-Egypt, 2012.
Figure 4.1 shows the breakdown of the youth population by transition stage sub-
category. The figure shows that only 7.4 per cent of youth had completed their labour
market transition to stable employment and about one-third of youth (27.0 per cent) were in
satisfactory self- or temporary employment. Those who were still in transition were
primarily unemployed (using the relaxed definition), accounting for 13.5 per cent of the
14
The international guidelines for measuring statistics on the economically active population, set out
by the 13th International Conference of Labour Statisticians (ICLS) in 1982, provide the framework
for measuring who is counted as employed and as unemployed according to the economic production
boundaries set out by the System of National Accounts.
15 This is the portion added to the “strictly” unemployed category to make up the unemployed
(relaxed definition).
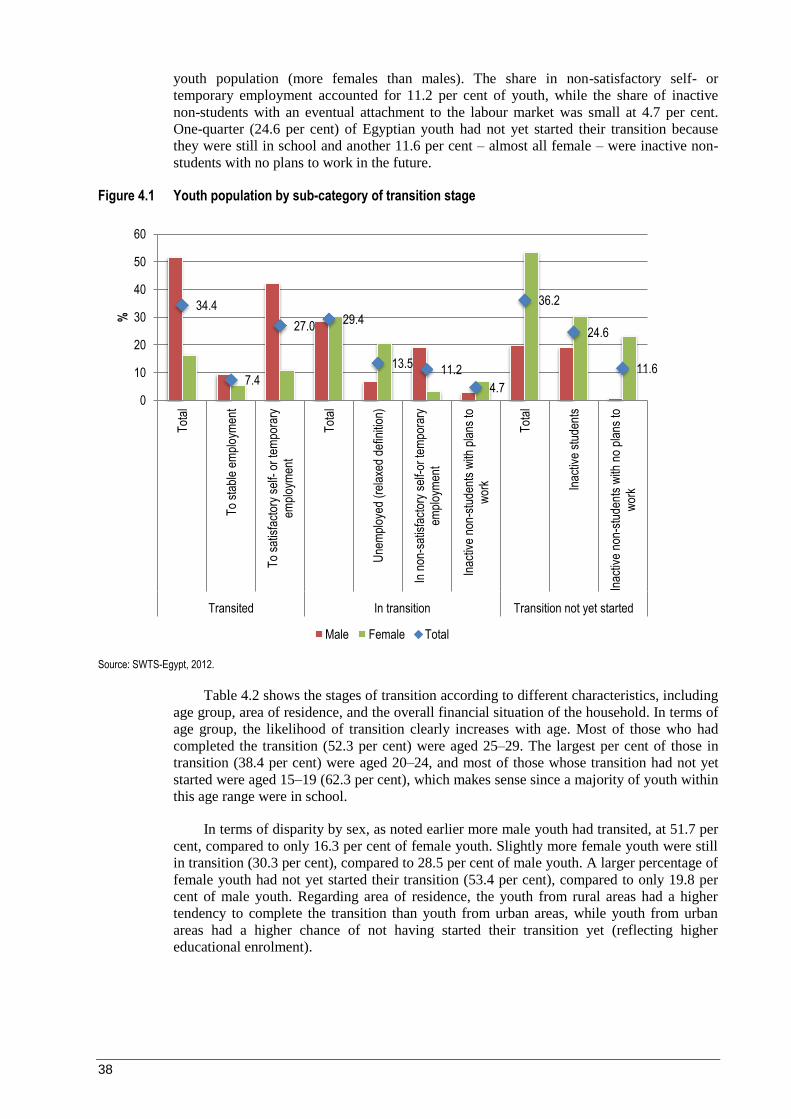
38
youth population (more females than males). The share in non-satisfactory self- or
temporary employment accounted for 11.2 per cent of youth, while the share of inactive
non-students with an eventual attachment to the labour market was small at 4.7 per cent.
One-quarter (24.6 per cent) of Egyptian youth had not yet started their transition because
they were still in school and another 11.6 per cent – almost all female – were inactive non-
students with no plans to work in the future.
Figure 4.1 Youth population by sub-category of transition stage
Source: SWTS-Egypt, 2012.
Table 4.2 shows the stages of transition according to different characteristics, including
age group, area of residence, and the overall financial situation of the household. In terms of
age group, the likelihood of transition clearly increases with age. Most of those who had
completed the transition (52.3 per cent) were aged 25–29. The largest per cent of those in
transition (38.4 per cent) were aged 20–24, and most of those whose transition had not yet
started were aged 15–19 (62.3 per cent), which makes sense since a majority of youth within
this age range were in school.
In terms of disparity by sex, as noted earlier more male youth had transited, at 51.7 per
cent, compared to only 16.3 per cent of female youth. Slightly more female youth were still
in transition (30.3 per cent), compared to 28.5 per cent of male youth. A larger percentage of
female youth had not yet started their transition (53.4 per cent), compared to only 19.8 per
cent of male youth. Regarding area of residence, the youth from rural areas had a higher
tendency to complete the transition than youth from urban areas, while youth from urban
areas had a higher chance of not having started their transition yet (reflecting higher
educational enrolment).
34.4
7.4
27.0 29.4
13.5 11.2
4.7
36.2
24.6
11.6
0
10
20
30
40
50
60
Tot
al
To
stab
le e
mpl
oym
ent
To
satis
fact
ory
self-
or
tem
pora
ryem
ploy
men
t
Tot
al
Une
mpl
oyed
(re
laxe
d de
finiti
on)
In n
on-s
atis
fact
ory
self-
or te
mpo
rary
empl
oym
ent
Inac
tive
non-
stud
ents
with
pla
ns to
wor
k
Tot
al
Inac
tive
stud
ents
Inac
tive
non-
stud
ents
with
no
plan
s to
wor
k
Transited In transition Transition not yet started
%
Male Female Total

39
Table 4.2 Youth population by stage of transition, age group, sex, area of residence and household income level
Characteristic Transited In transition
Transition not yet started
Total
Number % Number % Number % Number %
Age group
15–19 1 811 320 21.9 1 309 188 15.8 5 150 369 62.3 8 270 876 100.0
20–24 3 050 430 33.1 3 532 584 38.4 2 624 622 28.5 9 207 637 100.0
25–29 3 371 958 52.3 2 184 533 33.9 895 924 13.9 6 452 414 100.0
Sex
Male 6 330 030 51.7 3 485 964 28.5 2 424 005 19.8 12 239 998 100.0
Female 1 903 678 16.3 3 540 341 30.3 6 246 910 53.4 11 690 928 100.0
Area of residence
Urban 3 049 322 30.7 2 862 445 28.8 4 011 853 40.4 9 923 620 100.0
Rural 5 184 386 37.0 4 163 860 29.7 4 659 061 33.3 14 007 307 100.0
Household income level
Well off 214 833 33.8 146 464 23.0 274 490 43.2 635 787 100.0
Fairly well off 1 457 646 34.7 952 334 22.7 1 786 318 42.6 4 196 298 100.0
Average 4 902 013 34.7 4 134 425 29.3 5 098 562 36.1 14 135 000 100.0
Poor 1 571 894 34.1 1 592 881 34.6 1 440 798 31.3 4 605 572 100.0
Very poor 87 321 24.4 200 201 55.9 70 747 19.8 358 269 100.0
Total 8 233 708 34.4 7 026 305 29.4 8 670 914 36.2 23 930 927 100.0
Note: Household income levels are self-reported, i.e. based on the perception of the young respondent. Source: SWTS-Egypt, 2012.
The breakdown of the data by household income level seems to reflect little correlation
between income level and the young person’s likelihood of completing their transition to
stable and/or satisfactory employment. A young person from a well-off household had the
same chance (around 34 per cent) of completing the transition as a young person from a poor
household. Only the youth from a very poor household had a slightly lower chance of
transiting, at 24.4 per cent. Within this lowest income group, the young person was most
likely to remain in transition (55.9 per cent). The correlation between income level and
transition stage was strongest in the category of transition not yet started, where it is clear
that youth from the wealthier households were those most likely to stay or school and not yet
start the transition (approximately four in ten youth compared to two in ten youth from very
poor households).
4.2.1 Youth who had not started the transition
Of the youth in the SWTS who had not yet started their transition, 68.0 per cent were
young students without a job and 32.0 per cent were inactive youth with no work aspirations
(table A.8). The gender disparity is quite clear in this table. Many more female than male
youth did not start their transition to the labour market because of extended inactivity rather
than school attendance (43.2 per cent and 3.2 per cent, respectively). This difference is very
telling and corresponds closely with the data on limited female labour force participation in
Egypt.

40
4.2.2 Youth in transition
A young person in transition is a youth who is unemployed (relaxed definition),
engaged in self-employment or in a paid temporary job that they have expressed
dissatisfaction with, or is an inactive non-student with an attachment to the labour market,
indicated by their expressed desire to work in the future. The reason most youth in transition
were in that stage was because of their relaxed unemployed status, followed by those who
were in unsatisfactory self- or temporary employment (figure 4.1). Figure 4.2 presents youth
in transition broken down by level of completed education (excluding current students) and
household income level. The majority of young people who were in transition came from
average income households (59.3 per cent) and had achieved TVET (45.4 per cent) or
tertiary-level education (24.6 per cent). More youth in transition came from poor households
(poor and very poor combined) than from wealthy households.
Figure 4.2 Youth in transition by levels of household income and completed educational attainment
Note: Household income levels are self-reported, i.e. based on the perception of the young respondent.
Source: SWTS-Egypt, 2012.
4.3 Characteristics of a completed transition
Table 4.3 breaks down the stages of transition again by sex, area of residence,
household income level and completed education level, but excludes the youth who have not
yet started the transition. The aim is to look only at the economically active categories of
transition to ascertain if certain characteristics offer advantages during the transition path.
The first conclusion has already been made clear: young men were almost twice as
likely as young women to have completed the transition, with the greatest percentage of
transited young men having attained a satisfactory temporary job (37.0 per cent of
economically active males). Young women, in contrast, were twice as likely as young men
to remain in transition, mainly because they were unemployed (44.0 per cent of
economically active females). The second conclusion is that youth in urban areas were more
likely than their rural counterparts to attain stable employment but also to remain
unemployed. Youth in rural areas were more likely to attain satisfactory self-employment
(17.7 per cent).
8.3
14.4
45.4
2.2
5.1
24.6
2.4
22.7
59.3
13.6
2.1
0 10 20 30 40 50 60 70
Less than primary
Primary
TVET
Secondary general
Above intermediate
Tertiary
Very poor
Poor
Average
Fairly well off
Well off
Com
plet
ed e
duca
tion
leve
lH
ouse
hold
inco
me
leve
l
%

41
Table 4.3 Youth in transition and transited by sub-category, sex, area of residence and levels of household income and completed educational attainment (%)
Characteristic
Transited In transition
Total Stable employment
Satisfactory self-
employment
Satisfactory temporary
employment
Unemployed (relaxed
definition)
Non-satisfactory
self-employment
or temporary
employment
Inactive non-
student with
plan to work in future
Total 11.6 14.1 28.2 21.1 17.6 7.3 100.0
Sex
Male 11.7 15.8 37.0 8.4 23.6 3.5 100.0
Female 11.6 11.1 12.3 44.0 6.7 14.3 100.0
Area of residence
Urban 15.6 8.5 27.4 24.7 17.5 6.2 100.0
Rural 9.1 17.7 28.7 18.9 17.6 8.0 100.0
Household income level
Well off 35.9 10.0 13.5 30.9 5.7 4.0 100.0
Fairly well off 21.2 15.7 23.7 25.0 11.7 2.8 100.0
Average 11.0 14.3 28.9 20.8 16.9 8.1 100.0
Poor 4.4 12.8 32.5 17.8 23.7 8.8 100.0
Very poor 1.8 13.4 15.2 24.4 35.2 10.1 100.0
Completed education level
Less than primary 0.9 29.1 42.4 5.1 16.9 5.6 100.0
Primary 3.5 16.7 43.0 12.1 16.4 8.3 100.0
TVET 9.9 12.1 26.1 21.9 20.7 9.4 100.0
Secondary general 9.0 12.5 25.0 22.9 18.9 11.8 100.0
Above intermediate 24.4 5.3 17.0 30.2 13.9 9.2 100.0
Tertiary 30.5 3.6 10.7 37.4 12.5 5.4 100.0
Note: Household income levels are self-reported, i.e. based on the perception of the young respondent.
Source: SWTS-Egypt, 2012.
Regarding the impact of the household income level, table 4.3 clearly shows that youth
from wealthier households were more likely to attain stable employment. Youth from
wealthier households were also more likely to remain unemployed than youth from poorer
backgrounds since they could rely on the household income to sustain them during the job
search. Youth from poorer households were much more likely to remain in non-satisfactory
self- or temporary employment than those from wealthier households.
A final conclusion relates to education. The table shows that investing in higher
education brings a distinct advantage in terms of gaining stable employment. Nearly one-
third (30.5 per cent) of youth with tertiary-level education completed the transition to stable
employment compared to less than 10 per cent of youth with primary-level schooling or
below, or TVET. Still, it is important to bear in mind that 37.4 per cent of youth with
tertiary-level education remained unemployed compared to 12.1 per cent of youth with
primary-level education. The youth with lower levels of education had a higher chance of
completing their labour market transition, but not to stable employment. Rather, they were
most likely to remain in satisfactory temporary employment.
Table 4.4 shows the distribution of transited youth by occupation and sub-category of
transition. Most transited youth were spread among four occupations – crafts work (22.5 per
cent), skilled agricultural and fishery work (21.9 per cent), service and sales work (13.7 per
cent), and plant and machine operating work (13.2 per cent). Only just over one-tenth (11.4
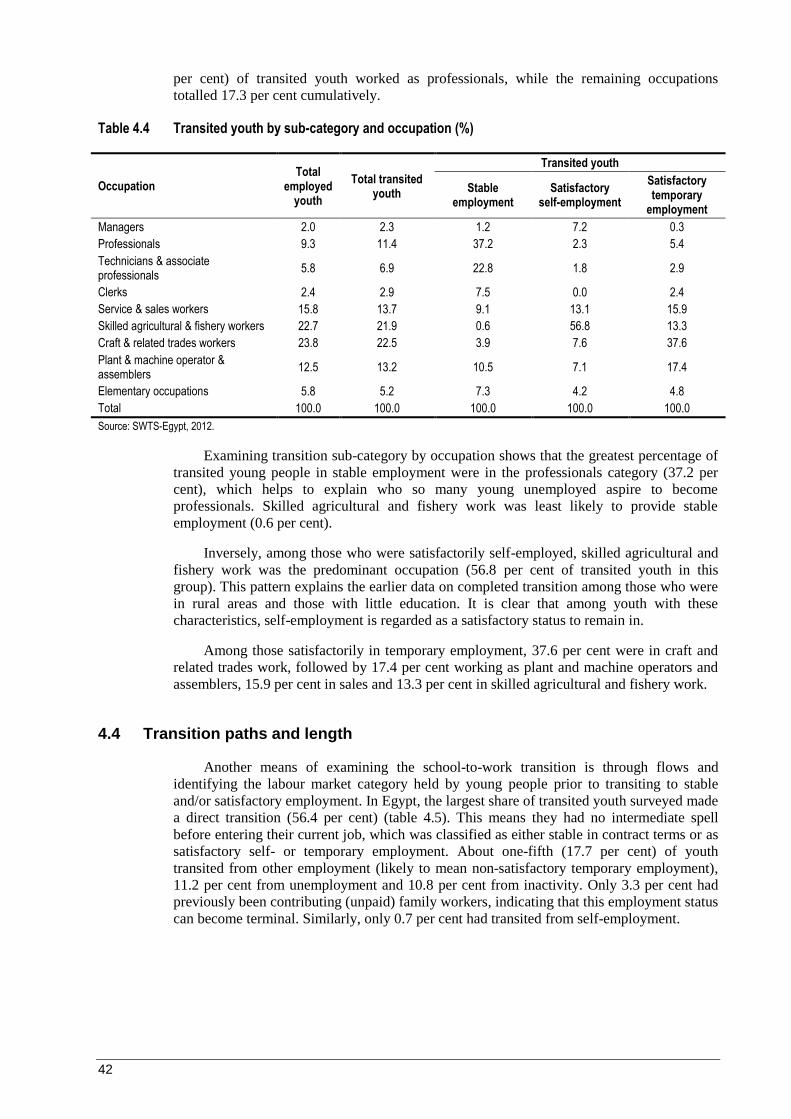
42
per cent) of transited youth worked as professionals, while the remaining occupations
totalled 17.3 per cent cumulatively.
Table 4.4 Transited youth by sub-category and occupation (%)
Occupation Total
employed youth
Total transited youth
Transited youth
Stable employment
Satisfactory self-employment
Satisfactory temporary
employment
Managers 2.0 2.3 1.2 7.2 0.3
Professionals 9.3 11.4 37.2 2.3 5.4
Technicians & associate professionals
5.8 6.9 22.8 1.8 2.9
Clerks 2.4 2.9 7.5 0.0 2.4
Service & sales workers 15.8 13.7 9.1 13.1 15.9
Skilled agricultural & fishery workers 22.7 21.9 0.6 56.8 13.3
Craft & related trades workers 23.8 22.5 3.9 7.6 37.6
Plant & machine operator & assemblers
12.5 13.2 10.5 7.1 17.4
Elementary occupations 5.8 5.2 7.3 4.2 4.8
Total 100.0 100.0 100.0 100.0 100.0
Source: SWTS-Egypt, 2012.
Examining transition sub-category by occupation shows that the greatest percentage of
transited young people in stable employment were in the professionals category (37.2 per
cent), which helps to explain who so many young unemployed aspire to become
professionals. Skilled agricultural and fishery work was least likely to provide stable
employment (0.6 per cent).
Inversely, among those who were satisfactorily self-employed, skilled agricultural and
fishery work was the predominant occupation (56.8 per cent of transited youth in this
group). This pattern explains the earlier data on completed transition among those who were
in rural areas and those with little education. It is clear that among youth with these
characteristics, self-employment is regarded as a satisfactory status to remain in.
Among those satisfactorily in temporary employment, 37.6 per cent were in craft and
related trades work, followed by 17.4 per cent working as plant and machine operators and
assemblers, 15.9 per cent in sales and 13.3 per cent in skilled agricultural and fishery work.
4.4 Transition paths and length
Another means of examining the school-to-work transition is through flows and
identifying the labour market category held by young people prior to transiting to stable
and/or satisfactory employment. In Egypt, the largest share of transited youth surveyed made
a direct transition (56.4 per cent) (table 4.5). This means they had no intermediate spell
before entering their current job, which was classified as either stable in contract terms or as
satisfactory self- or temporary employment. About one-fifth (17.7 per cent) of youth
transited from other employment (likely to mean non-satisfactory temporary employment),
11.2 per cent from unemployment and 10.8 per cent from inactivity. Only 3.3 per cent had
previously been contributing (unpaid) family workers, indicating that this employment status
can become terminal. Similarly, only 0.7 per cent had transited from self-employment.
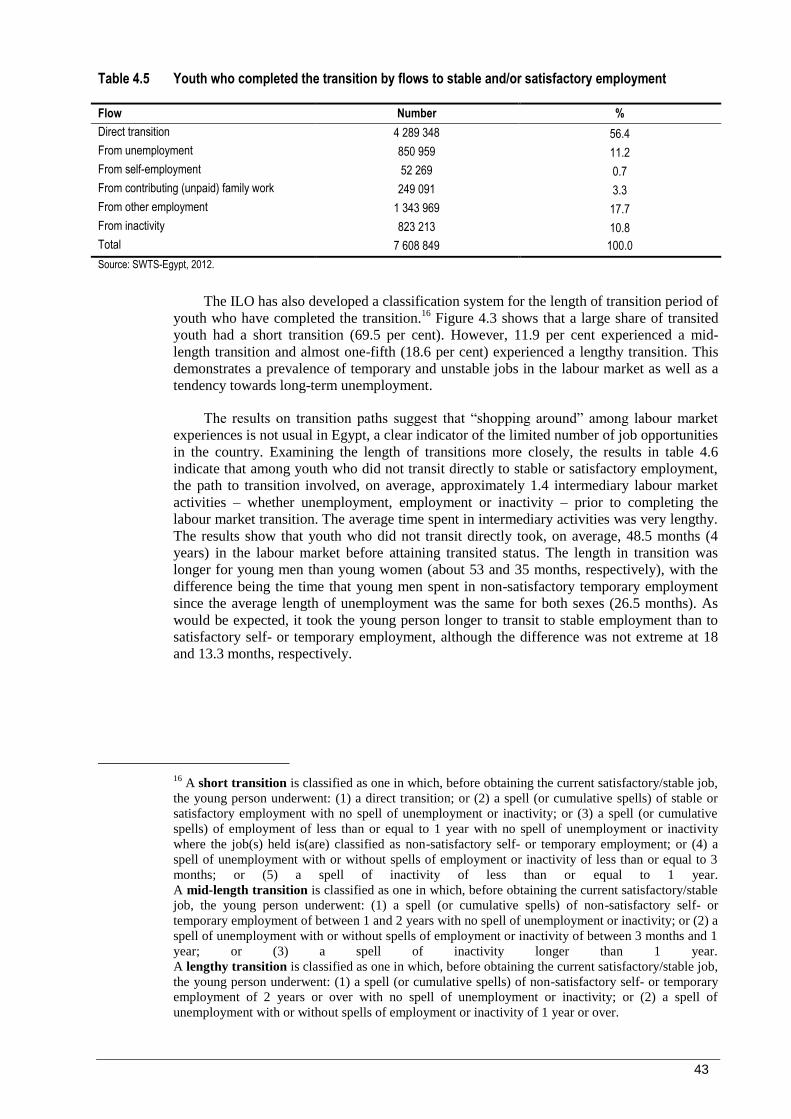
43
Table 4.5 Youth who completed the transition by flows to stable and/or satisfactory employment
Flow Number %
Direct transition 4 289 348 56.4
From unemployment 850 959 11.2
From self-employment 52 269 0.7
From contributing (unpaid) family work 249 091 3.3
From other employment 1 343 969 17.7
From inactivity 823 213 10.8
Total 7 608 849 100.0
Source: SWTS-Egypt, 2012.
The ILO has also developed a classification system for the length of transition period of
youth who have completed the transition.16
Figure 4.3 shows that a large share of transited
youth had a short transition (69.5 per cent). However, 11.9 per cent experienced a mid-
length transition and almost one-fifth (18.6 per cent) experienced a lengthy transition. This
demonstrates a prevalence of temporary and unstable jobs in the labour market as well as a
tendency towards long-term unemployment.
The results on transition paths suggest that “shopping around” among labour market
experiences is not usual in Egypt, a clear indicator of the limited number of job opportunities
in the country. Examining the length of transitions more closely, the results in table 4.6
indicate that among youth who did not transit directly to stable or satisfactory employment,
the path to transition involved, on average, approximately 1.4 intermediary labour market
activities – whether unemployment, employment or inactivity – prior to completing the
labour market transition. The average time spent in intermediary activities was very lengthy.
The results show that youth who did not transit directly took, on average, 48.5 months (4
years) in the labour market before attaining transited status. The length in transition was
longer for young men than young women (about 53 and 35 months, respectively), with the
difference being the time that young men spent in non-satisfactory temporary employment
since the average length of unemployment was the same for both sexes (26.5 months). As
would be expected, it took the young person longer to transit to stable employment than to
satisfactory self- or temporary employment, although the difference was not extreme at 18
and 13.3 months, respectively.
16
A short transition is classified as one in which, before obtaining the current satisfactory/stable job,
the young person underwent: (1) a direct transition; or (2) a spell (or cumulative spells) of stable or
satisfactory employment with no spell of unemployment or inactivity; or (3) a spell (or cumulative
spells) of employment of less than or equal to 1 year with no spell of unemployment or inactivity
where the job(s) held is(are) classified as non-satisfactory self- or temporary employment; or (4) a
spell of unemployment with or without spells of employment or inactivity of less than or equal to 3
months; or (5) a spell of inactivity of less than or equal to 1 year.
A mid-length transition is classified as one in which, before obtaining the current satisfactory/stable
job, the young person underwent: (1) a spell (or cumulative spells) of non-satisfactory self- or
temporary employment of between 1 and 2 years with no spell of unemployment or inactivity; or (2) a
spell of unemployment with or without spells of employment or inactivity of between 3 months and 1
year; or (3) a spell of inactivity longer than 1 year.
A lengthy transition is classified as one in which, before obtaining the current satisfactory/stable job,
the young person underwent: (1) a spell (or cumulative spells) of non-satisfactory self- or temporary
employment of 2 years or over with no spell of unemployment or inactivity; or (2) a spell of
unemployment with or without spells of employment or inactivity of 1 year or over.
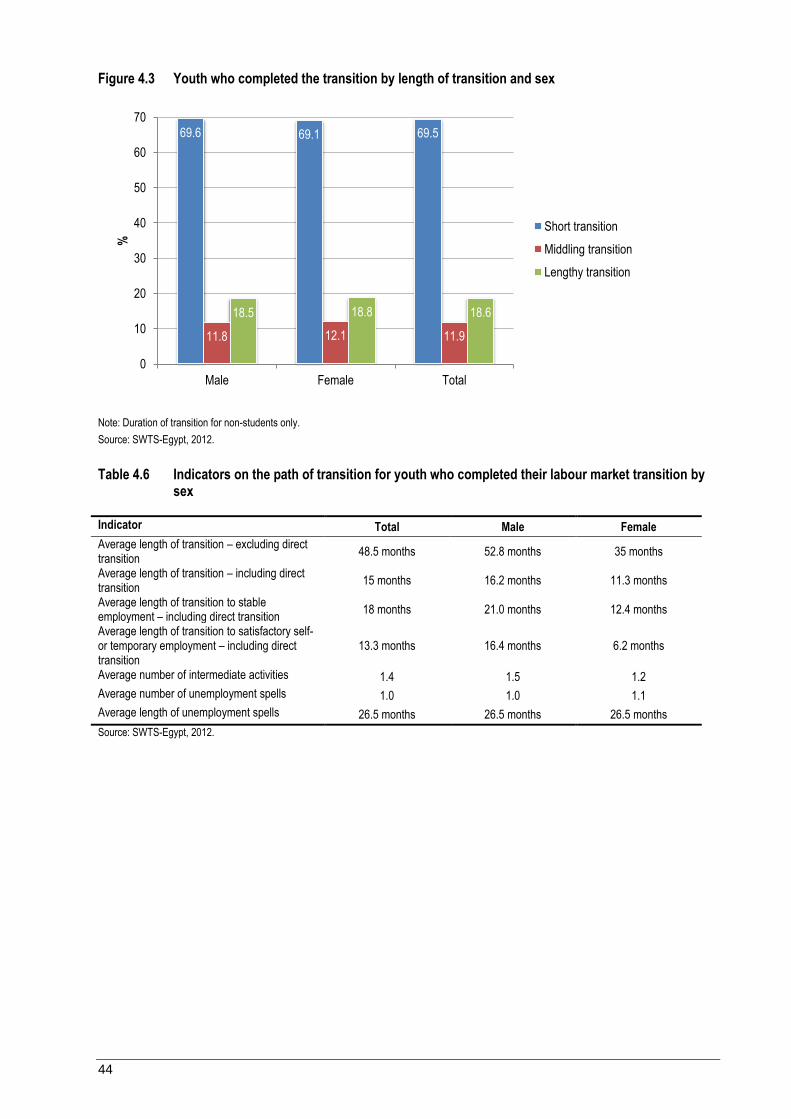
44
Figure 4.3 Youth who completed the transition by length of transition and sex
Note: Duration of transition for non-students only.
Source: SWTS-Egypt, 2012.
Table 4.6 Indicators on the path of transition for youth who completed their labour market transition by sex
Indicator Total Male Female
Average length of transition – excluding direct transition
48.5 months 52.8 months 35 months
Average length of transition – including direct transition
15 months 16.2 months 11.3 months
Average length of transition to stable employment – including direct transition
18 months 21.0 months 12.4 months
Average length of transition to satisfactory self- or temporary employment – including direct transition
13.3 months 16.4 months 6.2 months
Average number of intermediate activities 1.4 1.5 1.2
Average number of unemployment spells 1.0 1.0 1.1
Average length of unemployment spells 26.5 months 26.5 months 26.5 months
Source: SWTS-Egypt, 2012.
69.6 69.1 69.5
11.8 12.1 11.9
18.5 18.8 18.6
0
10
20
30
40
50
60
70
Male Female Total
% Short transition
Middling transition
Lengthy transition

45
5. Relevant institutional and policy frameworks, and policy implications
Egypt’s economy is not creating enough jobs to meet the employment needs of the
large cohorts of youth entering the labour market; high rates of unemployment and inactivity
are the result. Crowding for the few jobs created depresses the wages of youth and leads to
compromised working conditions. The survey showed that women are at a particular
disadvantage; a limited scope of jobs are open to them, principally in the public sector,
which results in extremely long queuing and pushes many out of the labour market for good.
Identifying the nature and extent of the youth employment challenges at the country
level is a prerequisite to formulating evidence-based and integrated policies and
programmatic interventions. With detailed information on the blockages that are preventing
sufficient job creation from absorbing the cohorts of young labour market entrants,
governments will be better prepared to design effective policy responses. Facilitating an
improved school-to-work transition is a precondition to helping young people overcome
difficulties in finding and maintaining decent jobs.
The analysis of the SWTS in Egypt highlights issues of low-quality employment, high
levels of informal employment, depressed wages and very long transitions paths, reflected in
the large shares of long-term unemployment. The evidence from the survey clearly points
out that Egypt needs serious and concerted policies to address its youth employment issues.
Since youth employment is highly dependent on the country’s general employment situation,
it is critical to prioritize youth employment in national policy-making and make it central to
economic and social policies.
The Egyptian Government has long had youth employment on its agenda. The Youth
Employment National Action Plan (NAP) of 2010–15 outlines Egypt’s strategy towards
more and better jobs for youth. The Action Plan identifies three priority areas: technical
education and vocational training, enterprise development, and labour market policies and
programmes. The priority of technical education seeks to develop the training system of
students and to improve the basic and soft skills of graduates of both secondary- and
tertiary-level education in the areas of language and technologies. The enterprise
development priority area seeks to promote entrepreneurship by providing technical and
marketing support to start-ups and young entrepreneurs. The priority area of labour market
policies and programmes seeks to develop public employment offices and to strengthen
labour market information units at the Ministry of Manpower and Immigration.
The 2012 SWTS and future data set for 2014 can make a significant contribution to
providing policy-makers with information to initiate, monitor and evaluate the numerous
policies and programmes outlined in the NAP and other current policy documents. In
particular, the following recommended areas of action should be followed closely:
1. Design macroeconomic policies to promote job growth. Job creation is central to any
meaningful discussion of youth employment issues. It is the role of government to create
an enabling environment that allows the private sector to develop its full potential and
play a role in generating employment and decent jobs (ILO, 2011). This entails forging
partnerships with the private sector and civil society organizations to improve youth
employment outcomes. There is little consensus in the literature as to how to create an
enabling environment for job creation. The range of approaches spans from a classic
focus on skill specialization and divisions of labour, to emphasis on investment in
physical capital and infrastructure, to, more recently, interest in innovation,
macroeconomic stability and good governance (Schwab, 2011).

46
2. Strengthen the focus of job creation in the high-skilled service sector. The increasing
access to education among this generation of youth has resulted in job aspirations for
work as “professionals”. The jobs available within this category are not sufficient to meet
the supply of graduates in this field. Job creation policies should focus on creating jobs
within the high-skilled service sector to increase the demand for workers in this type of
occupation. This requires coordinated policy efforts to support aggregate demand
through pro-employment macroeconomic policies and to foster growth engines through
an appropriate balance of export-driven growth and expansion of domestic markets (ILO,
2013, Chapter 6). Box 3 offers general approaches in this area.
Box 3. Approaches to boost aggregate demand and promote youth employment
Policies that promote employment-centred and sustainable growth are vital if young people are to be given a fair chance at a decent job. Youth labour market outcomes are closely related to overall employment trends but are more sensitive to the business cycle. A boost in aggregate demand is key to addressing the youth employment crisis as this will create more job opportunities for young people. ILO research shows that macroeconomic policies can influence youth employment by:
1. encouraging economic diversification and productive transformation;
2. reducing macroeconomic volatility by engaging in timely and targeted counter-cyclical policies;
3. loosening constraints on private sector growth, with a particular emphasis on access to finance for micro, small and medium-sized enterprises;
4. focusing on targeted demand-side interventions with particular impact on youth employment (e.g. labour intensive infrastructure works, public employment programmes, wage and training subsidies); and
5. ensuring adequate and predictable funding for targeted youth employment interventions.
Source: ILO, 2013, box 8.
3. Promote career counselling and public employment services to help guide youth
towards technical careers where demand is stronger. As a further means of guiding
young students and graduates away from an overcrowded professional sector, career
counselling services within schools and in employment service centres can improve
efforts to raise the attractiveness of technical careers. Sectors that are likely to create jobs
include assembly/electronics-processing, ICT, software, agro-processing, and woodwork
and furniture-making. It would be crucial for the employment and skills development
strategy to align with this sectoral strategy.
4. Focus on educational quality and relevance. The high prevalence of unemployment
among the educated, particularly among university students, raises concerns about the
labour market relevance of the education received and employment outcomes.
Educational institutions should seek to provide graduates with the soft and technical
skills needed to prepare youth to enter the labour market. Specific policy
recommendations are: i) involve employers in the identification of skills standards and
training needs, ii) link training and work following good examples in the region, iii)
establish innovative systems for on-the-job training and youth apprenticeships, and iv)
raise awareness of the importance of quality education, TVET and lifelong learning.
5. Invest in second-chance programmes to capture the disadvantaged youth most
likely to leave school early. The increasing prevalence of access to education further
disadvantages individuals left behind without education, either those not entering school
or early drop-outs. Expanding investment in education is required, especially in rural
areas, as is expanding access to education and training to the most disadvantaged and
excluded youth. Second-chance programmes should seek to provide core skills to
unskilled youth with low levels of formal education,
6. Improve the social protection of young people by enforcing the labour laws,
including those outlining the criteria of an employment contract. The survey results
show that young people continue to suffer from decent work deficits and low-quality
47
jobs. Most working youth are hired with oral contracts only and few have access to
entitlements. Labour laws and collective agreements, including through sanctioning
mechanisms, can protect young workers and facilitate their transitions into stable and
decent employment. In parallel, a system of incentives to encourage the registration of
enterprises is needed, while also providing incentives for employers to invest in
productivity improvements and the working conditions of young people.
7. Make labour market information and job search mechanisms available to youth. A
majority of employed youth found work through informal networks of family and
friends. Disadvantaged youth are marginalized from the lack of such networks. Efficient
labour market information-sharing is much needed, particularly for youth in the poorer
rural and urban areas. Labour market information, job search assistance, TVET
counselling and career guidance should be promoted in Egypt as active labour market
policies, implemented by the Government or civil society organizations.
8. Support entrepreneurship among youth through both technical and financial
support. Very few youth in Egypt are entrepreneurs. Those who ventured to become
entrepreneurs had to use their own savings or borrow from family. This shows the
limitations of lending programmes for youth. Self-employed youth listed the lack of
marketing expertise as one of the key challenges they face. Technical assistance by
connecting start-ups to supply chains and building up business incubators can encourage
more youth to become entrepreneurs.
9. Promote bipartite and tripartite cooperation on youth employment to yield better
employment outcomes. Establishing an enabling environment for the successful
implementation of employment and labour market interventions for young people
requires bipartite and tripartite cooperation. This is confirmed by the results of
evaluations of youth employment programmes. Egypt’s Government, employers’
organizations and trade unions have a role to play by fulfilling their own specific
mandates and through concerted and joint efforts to promote decent work for youth in the
country. It is also essential to listen to young people and engage them in this process.
Working with young people as partners throughout the policy-making and
implementation process is central to understanding young people’s vulnerability and
authentic solutions.
10. Take a gendered approach to the employment issues of youth to ensure a successful
policy framework. The crowding of young females in public sector employment is not
sustainable. The limited career options available to women result in extremely high
unemployment and inactivity rates, and wasted economic potential for the country.
Efforts need to be strengthened to tackle the cultural barriers that limit the economic
contribution of one-half of the youth population.
48
References
Central Agency for Public Mobilization and Statistics (CAPMAS). 2013. “Bulletin of
Labour Force (October–December) 2013”. Available at:
http://capmas.gov.eg/Pepo/labour.pdf [Feb. 2014].
─. 2012. “Egypt labour force survey”, Dec.
Gatti, R.; Angel-Urdinola, D.; Silva, J.; Bodor, A. 2011. “Striving for Better Jobs: The
Challenge of Informality in the Middle East and North Africa Region”. MENA Knowledge
and Learning Quick Notes Series, Number 49, Dec. (Washington, DC, World Bank).
Helmy, O.; Raouf, N. A.; Tarek, M. 2013. “Egypt’s Economic Profile and Statistics”, The
Egyptian Center for Economic Studies (ECES), Sep.
International Labour Organization (ILO). 2013. Global employment trends for youth 2013:
A generation at risk (Geneva).
─. 2011. Greening the global economy: The skills challenge, Skills for Employment Policy
brief (Geneva).
Quintini, G. 2011. “Over-Qualified or Under-Skilled: A Review of Existing Literature”,
OECD Social, Employment and Migration Working Papers, No. 121 (Paris, OECD
Publishing).
Schwab, K. (ed.). 2011. The Global Competitiveness Report 2010–2011 (Geneva, World
Economic Forum).
49
Annex I. Definitions of labour market statistics
1. The following units are defined according to the standards of the International Conference
of Labour Statisticians:
a. The employed include all persons of 15 years of age or more who during a week of
reference:
- worked for wage or profit (in cash or in kind) for at least one hour;
- were temporarily absent from work (because of illness, leave, studies, a break
of the activity of the firm, for example), but had a formal attachment to their
job;
- performed some work without pay for family gain.
b. The unemployed (strictly defined) include all persons of 15 years of age or more who
meet the following three conditions during the week of reference:
- They did not work (according to the abovementioned definition);
- They were actively searching for a job or took concrete action to start their own
business;
- They were available to start work within the two weeks following the reference
week.
c. Persons neither included in the employed nor in the unemployed category are
classified as not in the labour force (also known as inactive).
2. The International Classification of Status in Employment (ICSE) categorizes the employed
population on the basis of their explicit or implicit contract of employment, as follows:
a. Employees (also wage and salaried workers) are those who hold the type of jobs
defined as “paid employment jobs”, where the incumbents hold explicit (written or
oral) or implicit employment contracts that give them a basic remuneration that is not
directly dependent upon the revenue of the unit for which they work.
b. Employers are those who, working on their own account or with one or a few
partners, hold the type of jobs defined as “self-employment jobs” (i.e. jobs where the
remuneration is directly dependent upon the profits derived from the goods and
services produced) and, in this capacity, have engaged, on a continuous basis, one or
more persons to work for them as employee(s).
c. Own-account workers are those who, working on their own account or with one or
more partners, hold the type of jobs defined as “self-employment jobs” and have not
engaged, on a continuous basis, any employees to work for them.
d. Contributing (unpaid) family workers are those who hold “self-employment jobs”
as own-account workers in a market-oriented establishment operated by a related
person living in the same household.
3. The employed are also classified by their main occupation, in accordance with the
International Standard Classification of Occupations (ISCO-08).
4. A household is every family or other community of persons living together and jointly
spending their income to satisfy the basic necessities of life. The concept of household
includes members present in the place where the household resides, as well as individuals
who are temporarily absent and living elsewhere, including abroad, for business, education
or other, as long as their residence in the foreign country does not exceed 1 year. A person
living alone can also qualify as a household (“single household”) if s/he does not already

50
belong to another unit. The single household can reside in a separate or shared apartment,
considered as an independent unit as long as the household’s income is not shared with
other residents. Collective households, such as prisons and institutions, and their members
are not observed in the LFS.
5. The reporting period, to which the questions for the economic activity are related, is the
week before the week of interview (52 reporting weeks throughout the year).
6. The following units are also defined within the SWTS analysis but are outside the scope of
those defined within the international framework of labour market statistics mentioned in
item 1 above:
a. Relaxed unemployment – a person without work and available to work (relaxing the
jobseeking criteria of item 1b above).
b. Labour underutilization rate – the sum of shares of youth in irregular employment,
unemployed (relaxed definition) and youth neither in the labour force nor in
education/training (inactive non-students) as a percentage of the youth population.
c. Regular employment – the sum of employees with a contract (oral or written) of 12
months or more in duration and employers; the indicators are therefore a mix of
information on status in employment and contract situations.
d. Satisfactory employment – based on self-assessment of the jobholder; implies a job
that the respondent considers to “fit” to their desired employment path at that moment
in time.
e. Stable employment – employees with a contract (oral or written) of 12 months or
more in duration.
f. Temporary employment – employees with a contract (oral or written) of less than 12
months in duration.

51
Annex II. Additional statistical tables
The source for all tables is the SWTS for Egypt, 2012.
Table A.1 Self-employed youth (own-account workers and employers) by problem in running the business, area of residence and sex
Most important problem Total Male Female
Number % Number % Number %
Total (Urban + Rural)
No problem 466 523 48.3 418 861 47.1 47 662 62.3
Insufficient financial resources 117 077 12.1 110 721 12.4 6 356 8.3
Competition in the market 176 625 18.3 159 485 17.9 17 140 22.4
Shortages in raw materials 49 907 5.2 49 907 5.6 0 0.0
Labour shortage 7 829 0.8 7 829 0.9 0 0.0
Insufficient quality of staff 0 0.0 0 0.0 0 0.0
Insufficient (personal) business expertise 9 603 1.0 4 265 0.5 5 337 7.0
Legal regulations 38 745 4.0 38 745 4.4 0 0.0
Product development 7 712 0.8 7 712 0.9 0 0.0
Access to technology 0 0.0 0 0.0 0 0.0
Political uncertainties 45 244 4.7 45 244 5.1 0 0.0
Other 47 095 4.9 47 095 5.3 0 0.0
Total 966 359 100.0 889 863 100.0 76 496 100.0
Urban
No problem 140 131 41.2 117 610 37.7 22 520 78.9
Insufficient financial resources 36 819 10.8 36 819 11.8 0 0.0
Competition in the market 61 233 18.0 55 197 17.7 6 036 21.1
Shortages in raw materials 26 419 7.8 26 419 8.5 0 0.0
Labour shortage 3 915 1.2 3 915 1.3 0 0.0
Insufficient quality of staff 0 0.0 0 0.0 0 0.0
Insufficient (personal) business expertise 0 0.0 0 0.0 0 0.0
Legal regulations 24 539 7.2 24 539 7.9 0 0.0
Product development 0 0.0 0 0.0 0 0.0
Access to technology 0 0.0 0 0.0 0 0.0
Political uncertainties 23 942 7.0 23 942 7.7 0 0.0
Other 23 204 6.8 23 204 7.5 0 0.0
Total 340 202 100.0 311 645 100.0 28 556 100.0
Rural
No problem 140 131 41.2 117 610 37.7 22 520 78.9
Insufficient financial resources 36 819 10.8 36 819 11.8 0 0.0
Competition in the market 61 233 18.0 55 197 17.7 6 036 21.1
Shortages in raw materials 26 419 7.8 26 419 8.5 0 0.0
Labour shortage 3 915 1.2 3 915 1.3 0 0.0
Insufficient quality of staff 0 0.0 0 0.0 0 0.0
Insufficient (personal) business expertise 0 0.0 0 0.0 0 0.0
Legal regulations 24 539 7.2 24 539 7.9 0 0.0
Product development 0 0.0 0 0.0 0 0.0
Access to technology 0 0.0 0 0.0 0 0.0
Political uncertainties 23 942 7.0 23 942 7.7 0 0.0
Other 23 204 6.8 23 204 7.5 0 0.0
Total 340 202 100.0 311 645 100.0 28 556 100.0

52
Table A.2 Self-employed youth (own-account workers and employers) by source of funding to start their current activity, area of residence and sex
Main source of funding Total Male Female
Number % Number % Number %
Total (Urban + Rural)
No money needed 157 471 16.3 134 747 15.1 22 724 29.7
Own savings 299 266 31.0 275 444 31.0 23 822 31.1
Money from family or friends 468 646 48.5 438 697 49.3 29 949 39.2
Loan from microfinance institutions 17 030 1.8 17 030 1.9 0 0.0
Loan from banks 7 677 0.8 7 677 0.9 0 0.0
Other 16 268 1.7 16 268 1.8 0 0.0
Total 966 359 100.0 889 863 100.0 76 496 100.0
Urban
No money needed 60 092 17.7 42 705 13.7 17 387 60.9
Own savings 113 700 33.4 113 700 36.5 0 0.0
Money from family or friends 149 766 44.0 138 596 44.5 11 169 39.1
Loan from microfinance institutions 8 510 2.5 8 510 2.7 0 0.0
Loan from banks 4 220 1.2 4 220 1.4 0 0.0
Other 3 915 1.2 3 915 1.3 0 0.0
Total 340 202 100.0 311 645 100.0 28 556 100.0
Rural
No money needed 97 379 15.6 92 042 15.9 5 337 11.1
Own savings 185 567 29.6 161 744 28.0 23 822 49.7
Money from family or friends 318 881 50.9 300 101 51.9 18 779 39.2
Loan from microfinance institutions 8 520 1.4 8 520 1.5 0 0.0
Loan from banks 3 457 0.6 3 457 0.6 0 0.0
Other 12 353 2.0 12 353 2.1 0 0.0
Total 626 157 100.0 578 218 100.0 47 939 100.0
Table A.3 Self-employed youth (own-account workers and employers) by use of financial instruments to cover the expenses required to maintain their current activity, area of residence and sex
Financial instrument Total Male Female
Number % Number % Number %
Total (Urban + Rural)
No money needed 192 736 19.9 175 348 19.7 17 387 22.7
Saving collectors 379 821 39.3 355 998 40.0 23 822 31.1
Money from family or friends 283 767 29.4 253 818 28.5 29 949 39.2
Loan from a bank 4 265 0.4 4 265 0.5 0 0.0
Profits of the project 101 855 10.5 96 518 10.9 5 337 7.0
Other 3 915 0.4 3 915 0.4 0 0.0
Total 966 359 100.0 889 863 100.0 76 496 100.0
Urban
No money needed 70 931 20.9 53 544 17.2 17 387 60.9
Saving collectors 139 703 41.1 139 703 44.8 0 0.0
Money from family or friends 88 632 26.1 77 463 24.9 11 169 39.1
Loan from a bank 0 0.0 0 0.0 0 0.0
Profits of the project 37 021 10.9 37 021 11.9 0 0.0
Other 3 915 1.2 3 915 1.3 0 0.0

53
Financial instrument Total Male Female
Number % Number % Number %
Total 340 202 100.0 311 645 100.0 28 556 100.0
Rural
No money needed 121 804 19.5 121 804 21.1 0 0.0
Saving collectors 240 118 38.4 216 295 37.4 23 822 49.7
Money from family or friends 195 135 31.2 176 356 30.5 18 779 39.2
Loan from a bank 4 265 0.7 4 265 0.7 0 0.0
Profits of the project 64 835 10.4 59 497 10.3 5 337 11.1
Other 0 0.0 0 0.0 0 0.0
Total 626 157 100.0 578 218 100.0 47 939 100.0
Table A.4 Employed youth by satisfaction with current job, area of residence and sex
Satisfaction Total Male Female
Number % Number % Number %
Total (Urban + Rural)
Very satisfied 2 472 044 22.7 1 755 721 20.3 716 323 31.6
Somewhat satisfied 5 541 142 50.8 4 426 198 51.2 1 114 944 49.1
Neither dissatisfied nor satisfied 747 044 6.8 618 308 7.2 128 736 5.7
Somewhat unsatisfied 1 498 492 13.7 1 293 538 15.0 204 954 9.0
Very unsatisfied 657 747 6.0 552 839 6.4 104 907 4.6
Total 10 916 469 100.0 8 646 604 100.0 2 269 865 100.0
Urban
Very satisfied 1 025 350 25.1 750 792 23.4 274 559 31.4
Somewhat satisfied 1 906 824 46.7 1 471 224 45.8 435 600 49.9
Neither dissatisfied nor satisfied 253 105 6.2 201 769 6.3 51 336 5.9
Somewhat unsatisfied 569 574 13.9 514 803 16.0 54 771 6.3
Very unsatisfied 331 511 8.1 274 394 8.5 57 117 6.5
Total 4 086 365 100.0 3 212 981 100.0 873 384 100.0
Rural
Very satisfied 1 446 694 21.2 1 004 930 18.5 441 764 31.6
Somewhat satisfied 3 634 318 53.2 2 954 973 54.4 679 344 48.7
Neither dissatisfied nor satisfied 493 939 7.2 416 539 7.7 77 400 5.5
Somewhat unsatisfied 928 918 13.6 778 735 14.3 150 183 10.8
Very unsatisfied 326 236 4.8 278 446 5.1 47 790 3.4
Total 6 830 103 100.0 5 433 623 100.0 1 396 481 100.0
Table A.5 Employed youth by willingness to migrate for employment purposes and sex
Active step Total Male Female
Number % Number % Number %
None 6 574 391.2 55.1 4 520 837.1 47.4 2 053 554.1 86.0
Would move to capital city 2 203 308.3 18.5 2 046 515.6 21.5 156 792.7 6.6
Would move to a town/city 1 174 643.5 9.8 1 100 117.1 11.5 74 526.4 3.1
Would move to a rural area 141 873.7 1.2 128 033.7 1.3 13 840.0 0.6
Would move to another country 1 577 822.0 13.2 1 510 429.6 15.8 67 392.3 2.8
Do not know 253 868.7 2.1 231 539.7 2.4 22 329.0 0.9
Total 11 925 907.0 100.0 9 537 472.8 100.0 2 388 434.5 100.0
54
Table A.6 Unemployed youth who had refused a job by reason for refusal and sex
Reason Total Male Female
Number % Number % Number %
Wages offered were too low 73 941 34.0 46 272 57.4 27 669 20.2
Work was not interesting 3 478 1.6 3 478 4.3 0 0.0
Location was not convenient 35 004 16.1 0 0.0 35 004 25.6
Work would not match the level of qualification
65 282 30.0 23 444 29.1 41 838 30.6
Work would require too many hours
5 489 2.5 0 0.0 5 489 4.0
Family did not approve of the job offered
14 124 6.5 3 162 3.9 10 963 8.0
Waiting for a better job 10 496 4.8 0 0.0 10 496 7.7
Other 9 617 4.4 4 255 5.3 5 362 3.9
Total 217 431 100.0 80 611 100.0 136 821 100.0
Table A.7 Current students by desired future employer and sex (%)
Type of enterprise Total Male Female
Do not wish to work 3.2 0.1 5.7
Work for family business/farm 0.3 0.1 0.6
Work for an international or non-profit organization 0.9 0.9 0.9
Work for a private company 16.4 23.6 10.5
Work for government/public sector 73.4 66.8 78.7
Work for myself (own business/farm) 5.8 8.5 3.6
Table A.8 Youth who had not yet started their transition by sub-category and sex
Sub-category Total Male Female
Number (%) Number (%) Number (%)
Inactive students 5 893 590 68.0 2 346 460 96.8 3 547 130 56.8
Inactive non-student youth with no future work aspirations
2 777 325 32.0 77 545 3.2 2 699 780 43.2
Total youth transition not started 8 670 914 100.0 2 424 005 100.0 6 246 910 100.0
Table A.9 Youth population by use of financial instruments, area of residence and sex
Financial instrument Total Male Female
Number % Number % Number %
Total (Urban + Rural)
None 22 641 823 93.6 11 331 399 91 11 310 423 96.4
Business loans 70 135 0.3 64 798 0.5 5 337 0.0
Emergency loans 252 927 1.0 203 930 1.6 48 997 0.4
Consumption loans 157 985 0.7 144 440 1.2 13 545 0.1
Savings 715 999 3 488 278 3.9 227 721 1.9
Remittances/money transfer services
142 830 0.6 110 899 0.9 31 932 0.3
Other 199 440 0.8 110 006 0.9 89 434 0.8
Urban
None 9 264 517 92.2 4 544 243 89.2 4 720 274 95.3
Business loans 29 683 0.3 24 346 0.5 5 337 0.1
Emergency loans 55 839 0.6 51 946 1.0 3 893 0.1

55
Consumption loans 60 365 0.6 54 606 1.1 5 759 0.1
Savings 425 081 4.2 278 560 5.5 146 521 3.0
Remittances/money transfer services
122 445 1.2 95 876 1.9 26 570 0.5
Other 91 175.60 0.9 45 838.30 0.9 45 337.30 0.9
Rural
None 13 377 305 94.7 6 787 156 92.2 6 590 150 97.3
Business loans 40 452 0.3 40 452 0.5 0 0.0
Emergency loans 197 088 1.4 151 984 2.1 45 104 0.7
Consumption loans 97 620 0.7 89 834 1.2 7 786 0.1
Savings 290 918 2.1 209 718 2.9 81 199 1.2
Remittances/money transfer services
20 385 0.1 15 023 0.2 5 362 0.1
Other 108 265 0.8 64 168 0.9 44 097 0.7
Table A.10 Youth by source of financial services, area of residence and sex
Source Total Male Female
Number % Number % Number %
Total (Urban + Rural)
Banks 485 286 33.3 311 472 29.3 173 814 43.9
Post office 295 662 20.3 219 132 20.6 76 531 19.4
Friends & relatives 387 002 26.6 288 619 27.2 98 384 24.9
Microfinance institutions 115 879 8.0 97 419 9.2 18 460 4.7
Money transfer operators 13 045 0.9 0 0.0 13 045 3.3
Other 160 235 11.0 144 965 13.7 15 270 3.9
Total 1 457 109 100.0 1 061 606 100.0 395 502 100.0
Urban
Banks 346 177 47.3 221 857 42.9 124 320 58.1
Post office 135 709 18.6 112 267 21.7 23 442 10.9
Friends & relatives 130 634 17.9 85 297 16.5 45 337 21.2
Microfinance institutions 44 107 6.0 34 876 6.7 9 230 4.3
Money transfer operators 6 036 0.8 0 0.0 6 036 2.8
Other 68 822 9.4 63 063 12.2 5 759 2.7
Total 731 485 100.0 517 361 100.0 214 124 100.0
Rural
Banks 139 109 19.2 89 615 16.5 49 494 27.3
Post office 159 953 22.0 106 865 19.6 53 088 29.3
Friends & relatives 256 368 35.3 203 322 37.4 53 046 29.2
Microfinance institutions 71 773 9.9 62 543 11.5 9 230 5.1
Money transfer operators 7 009 1.0 0 0.0 7 009 3.9
Other 91 413 12.6 81 902 15.0 9 511 5.2
Total 725 624 100.0 544 246 100.0 181 378 100.0

56
Table A.11 Employed youth by union membership and sex
Membership Total Male Female
Number % Number % Number %
Member 1 004 952 9.2 657 560 7.6 347 392 15.3
Non-member 9 911 517 90.8 7 989 044 92.4 1 922 473 84.7
Total 10 916 469 100.0 8 646 604 100.0 2 269 865 100.0
Table A.12 Employed youth by company size, area of residence and sex
Number of workers Total Male Female
Number % Number % Number %
Total (Urban + Rural)
Less than 5 5 623 821 51.5 4 601 629 53.2 1 022 192 45.0
Between 5 & 9 1 747 509 16.0 1 425 204 16.5 322 304 14.2
Between 10 & 19 940 639 8.6 770 942 8.9 169 697 7.5
Between 20 & 49 607 573 5.6 419 371 4.9 188 201 8.3
Between 50 & 499 896 694 8.2 543 570 6.3 353 124 15.6
Above 500 673 592 6.2 527 516 6.1 146 076 6.4
Do not know 426 641 3.9 358 371 4.1 68 271 3.0
Total 10 916 469 100.0 8 646 604 100.0 2 269 865 100.0
Urban
Less than 5 1 979 235 48.4 1 719 313 53.5 259 922 29.8
Between 5 & 9 569 617 13.9 448 829 14.0 120 788 13.8
Between 10 & 19 321 904 7.9 226 649 7.1 95 255 10.9
Between 20 & 49 208 739 5.1 136 375 4.2 72 364 8.3
Between 50 & 499 458 218 11.2 245 673 7.6 212 546 24.3
Above 500 411 429 10.1 332 647 10.4 78 782 9.0
Do not know 137 223 3.4 103 496 3.2 33 727 3.9
Total 4 086 365 100.0 3 212 981 100.0 873 384 100.0
Rural
Less than 5 3 644 586 53.4 2 882 316 53.0 762 270 54.6
Between 5 & 9 1 177 892 17.2 976 375 18.0 201 516 14.4
Between 10 & 19 618 734 9.1 544 293 10.0 74 441 5.3
Between 20 & 49 398 834 5.8 282 996 5.2 115 838 8.3
Between 50 & 499 438 476 6.4 297 897 5.5 140 578 10.1
Above 500 262 163 3.8 194 869 3.6 67 294 4.8
Do not know 289 419 4.2 254 875 4.7 34 544 2.5
Total 6 830 104 100.0 5 433 623 100.0 1 396 481 100.0
57
Table A.13 Employed youth by type of job-oriented training received and sex
Main field of training Total Male Female
Number % Number % Number %
Vocational 349 288 60.5 194 275 59.0 155 013 62.6
Business development/entrepreneurship 30 823 5.3 24 834 7.5 5 989 2.4
Foreign language 21 027 3.6 0 0.0 21 027 8.5
Information technology (IT) 76 948 13.3 37 440 11.4 39 508 16.0
Accounting/bookkeeping 30 948 5.4 27 055 8.2 3 893 1.6
Health & safety 32 573 5.6 16 740 5.1 15 833 6.4
Compliance with procedures or regulations 12 222 2.1 12 222 3.7 0 0.0
Other 23 313 4.0 16 958 5.2 6 356 2.6
Total 577 142 100.0 329 523 100.0 247 619 100.0
Table A.14 In-school youth by highest expected level of educational attainment, area of residence and sex
Highest level expected Total Male Female
Number % Number % Number %
Total (Urban + Rural)
Elementary 6 955 0.1 6 955 0.2 0 0.0
Vocational/industry 36 698 0.5 31 565 1.0 5 133 0.1
TVET 1 568 619 22.8 846 501 27.3 722 118 19.0
Secondary/Azhari 27 298 0.4 14 674 0.5 12 625 0.3
Vocational (post-secondary) 428 461 6.2 190 597 6.2 237 864 6.3
University 4 081 211 59.2 1 730 745 55.9 2 350 466 61.9
Postgraduate 739 046 10.7 270 717 8.7 468 329 12.3
Other 6 959 0.1 6 959 0.2 0 0.0
Total 6 895 248 100.0 3 098 713 100.0 3 796 535 100.0
Urban
Elementary 0 0.0 0 0.0 0 0.0
Vocational/industry 8 931 0.3 3 797 0.3 5 133 0.3
TVET 434 070 13.3 264 166 18.4 169 904 9.2
Secondary/Azhari 3 870 0.1 3 870 0.3 0 0.0
Vocational (post-secondary) 150 416 4.6 79 371 5.5 71 044 3.9
University 2 214 519 67.6 914 505 63.8 1 300 014 70.6
Postgraduate 456 021 13.9 161 358 11.3 294 663 16.0
Other 6 959 0.2 6 959 0.5 0 0.0
Total 3 274 785 100.0 1 434 027 100.0 1 840 759 100.0
Rural
Elementary 6 955 0.2 6 955 0.4 0 0.0
Vocational/industry 27 768 0.8 27 768 1.7 0 0.0
TVET 1 134 549 31.3 582 335 35.0 552 214 28.2
Secondary/Azhari 23 429 0.7 10 804 0.7 12 625 0.7
Vocational (post-secondary) 278 046 7.7 111 226 6.7 166 820 8.5
University 1 866 692 51.6 816 240 49.0 1 050 452 53.7
Postgraduate 283 025 7.8 109 359 6.6 173 666 8.9
Other 0 0.0 0 0.0 0 0.0
Total 3 620 463 100.0 1 664 686 100.0 1 955 777 100.0

58
Table A.15 Share of young students combining work and study by area of residence and sex
Work and study Total Male Female
Number % Number % Number %
Total (Urban + Rural)
Working during the school season 2 780 820 56.8 2 320 821 55.3 460 000 66.2
Working outside the school season 1 292 384 26.4 1 139 446 27.1 152 938 22.0
Working during & outside the school season 822 214 16.8 740 213 17.6 82 000 11.8
Total 4 895 418 100.0 4 200 480 100.0 694 938 100.0
Urban
Working during the school season 970 568 53.4 799 775 50.6 170 792 71.5
Working outside the school season 512 315 28.2 471 944 29.9 40 371 16.9
Working during & outside the school season 336 443 18.5 308 585 19.5 27 858 11.7
Total 1 819 326 100.0 1 580 305 100.0 239 021 100.0
Rural
Working during the school season 1 810 253 58.9 1 521 045 58.1 289 208 63.4
Working outside the school season 780 069 25.4 667 502 25.5 112 567 24.7
Working during & outside the school season 485 771 15.8 431 628 16.5 54 143 11.9
Total 3 076 093 100.0 2 620 176 100.0 455 917 100.0
59
Annex III. Sampling framework of SWTS-Egypt, 2012
The SWTS sample is a self-weighted multi-stage cluster sample. The sample was
extracted from the sample of the Egypt labour force survey (LFS), which was fielded in the
first and second quarters of 2012. The main criterion for selection of the households for
inclusion in the SWTS sample was to reach members aged 15–29. The LFS sample
included 9,708 households meeting this criterion. The following table shows the
breakdown of households by governorate and urban/rural location.
Number of households in the LFS sample with individuals aged 15–29 by governorates and urban/rural location
Governorate Urban Rural Total
Cairo 979 0 979
Alexandria 524 0 524
Port Said 82 0 82
Suez 87 0 87
Damietta 57 101 158
Dakahlia 189 518 707
El Sharkia 154 582 736
Kaliobeya 255 312 567
Kafr Al-Shaikh 84 297 381
El Garbia 155 394 549
Monofeya 83 366 449
El Biheira 122 543 665
Ismailia 54 67 121
Giza 419 391 810
Beni Suef 72 254 326
Fayoum 67 294 361
Minya 115 482 597
Assiut 103 358 461
Sohag 104 416 520
Qena 57 269 326
Aswan 74 90 164
Luxor 45 93 138
Total 3 881 5 827 9 708
The final SWTS sample included 3,500 households. The SWTS sub-sample was
selected from enumeration units with the highest concentration of households that met the
age criterion. Households with more members meeting the age criterion were also more
likely to be selected. Sample selection was systematized to take into account larger
dispersion across governorates. The following table shows the breakdown of the final
SWTS sample framework by governorate and urban/rural location.
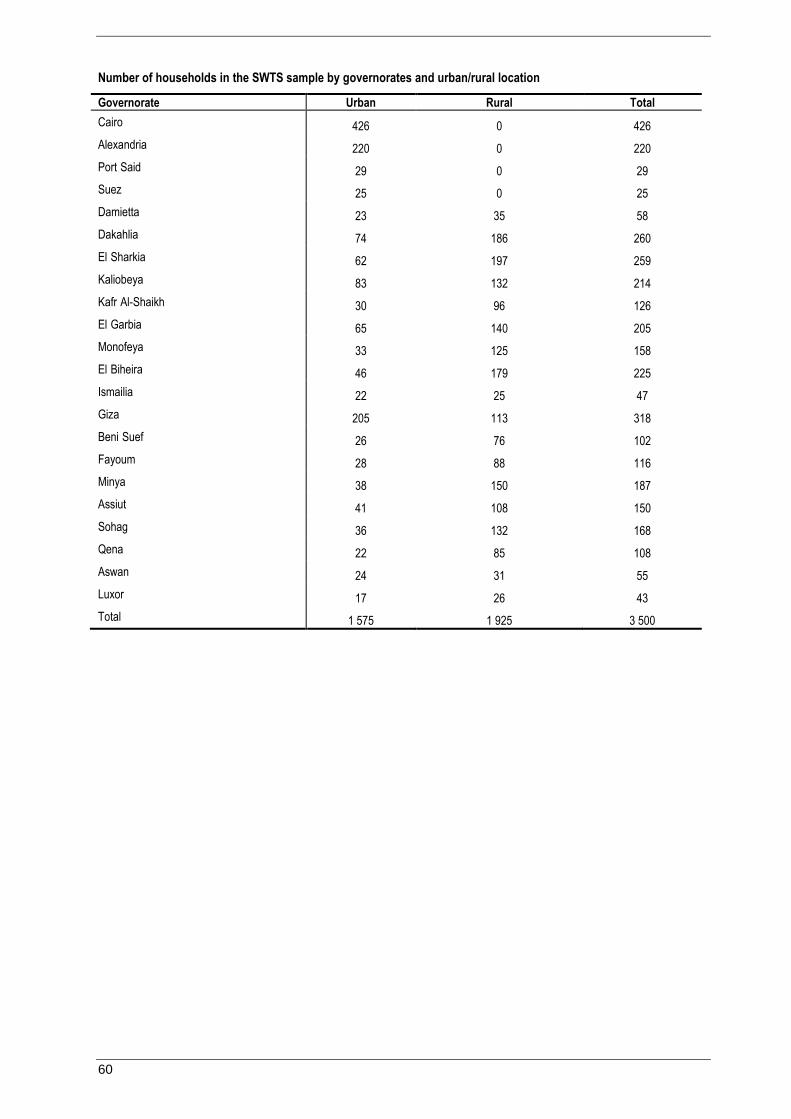
60
Number of households in the SWTS sample by governorates and urban/rural location
Governorate Urban Rural Total
Cairo 426 0 426
Alexandria 220 0 220
Port Said 29 0 29
Suez 25 0 25
Damietta 23 35 58
Dakahlia 74 186 260
El Sharkia 62 197 259
Kaliobeya 83 132 214
Kafr Al-Shaikh 30 96 126
El Garbia 65 140 205
Monofeya 33 125 158
El Biheira 46 179 225
Ismailia 22 25 47
Giza 205 113 318
Beni Suef 26 76 102
Fayoum 28 88 116
Minya 38 150 187
Assiut 41 108 150
Sohag 36 132 168
Qena 22 85 108
Aswan 24 31 55
Luxor 17 26 43
Total 1 575 1 925 3 500

Ghada Barsoum, Mohamed Ramadan and Mona Mostafa
June 2014
Labour market transitions of young women and men in Egypt
This report presents the highlights of the 2012 School-to-work Transition Survey (SWTS) run together with the Central Agency for Public Mobilization and Statistics (CAPMAS) within the framework of the ILO Work4Youth Project. This Project is a five-year partnership between the ILO and The MasterCard Foundation that aims to promote decent work opportunities for young men and women through knowledge and action. The W4Y Publication Series is designed to disseminate data and analyses from the SWTS administered by the ILO in 28 countries covering five regions of the world. The SWTS is a unique survey instrument that generates relevant labour market information on young people aged 15 to 29 years. The survey captures longitudinal information on transitions within the labour market, thus providing evidence of the increasingly tentative and indirect paths to decent and productive employment that today’s young men and women face.
The W4Y Publications Series covers national reports, with main survey findings and details on current national policy interventions in the area of youth employment, and regional synthesis reports that highlight regional patterns in youth labour market transitions and distinctions in national policy frameworks.
No. 16
For more information, visit our website: www.ilo.org/w4yYouth Employment Programme4 route des MorillonsCH-1211 Genève 22Switzerland [email protected]
Publication Series
Youth Employment ProgrammeEmployment Policy Department
LAB
OU
R MA
RKET TRA
NSITIO
NS O
F YOU
NG W
OM
EN A
ND M
EN IN
EGYPTILO
ISSN 2309-6780