memorandum - vbgov.com · memorandum to: the city of virginia beach from: lewis white and rachael...
TRANSCRIPT

277 Bendix RoadSuite 300
Virginia Beach, VA 23452Main: 757-466-1732Fax: 757-466-1493
Over a Century ofEngineering Excellence
Memorandum
To: The City of Virginia Beach
From: Lewis White and Rachael Johnson on behalf of WSP | Parsons Brinckerhoff
Date: November 8, 2016
Subject: Sherwood Lakes Pump Station – FINAL
Executive Summary
Sherwood Lakes Subdivision Phase 1 and Phase 1B was developed approximately 5 years ago. Theresidential subdivision surrounds a sand borrow pit that has been converted to a 90 acre lake. The lakehandles drainage from the subdivision and from lands adjacent to Princess Anne Road north of thesubdivision. The water level within the lake is controlled by groundwater. The only discharge from thelake is an 18 inch pipe with an invert elevation of 6.3 feet NAVD. The intent was that the lake wouldinfiltrate into the surrounding sandy area. The design normal water surface elevation in North SherwoodLake was 3 feet NAVD, however, the actual water surface elevation varies from about 4.5 feet to 6.0 feetNAVD depending on the groundwater elevation in the vicinity. Because the normal water elevation of thelake did not meet the approved design, the operation and ownership of the lake was not transferred tothe residents in the subdivision surrounding the lake, as intended. The residents have been experiencingflooding and would like the normal water surface elevation lowered to the level that was originallydesigned.
Two design options for lowering the lake level were considered after discussions with the City of VirginiaBeach. These options included deepening the existing stream from the pump station on Locksley Arch tothe culvert crossing Seaboard Road, a distance of about 5000 feet, or installing a low capacity pumpstation to be located near the City sanitary pump station site that discharges to the existing 18 inch stormsystem west of the subdivision. The deepening of the existing stream was eliminated from considerationbecause of the wetland impacts and volume of material involved in the stream excavation. The lowcapacity pump station pumping to the existing piped outfall system in combination with a new ditchconnection to the existing stream is the recommended option for lowering the normal water surfaceelevation to the design level. The maximum flow rate accommodated by the existing piped outfall systemis less than 3.5 cfs. Modifications to this piped outfall system, including pipe lining and the addition of asecondary outfall that ties into the existing ditch system, are highly recommended. Initial drawdown canbe accomplished, if necessary, with a temporary pump while a permanent pump station would maintainthe long-term water elevation.
The calculated time to reduce the water elevation from 6 ft to 3 ft NAVD with a temporary pump at 3.5 cfsduring autumn was 64 days, accounting for groundwater baseflow and evaporation. However,approximately $90,000 can be saved by performing initial drawdown using a permanent pump station. Apermanent pump running continuously at 2.0 cfs with a second pump operating during dry periods wasfound to have a drawdown time of 35 days. Initial drawdown of the lake is recommended during latespring or summer due to reduced baseflows and improved evaporation during these seasons. Apermanent pump station project cost is estimated at approximately $750,000, including bank stabilization;no wetlands disturbances are expected.

Page 2
Over a Century ofEngineering Excellence
Project Description
North Sherwood Lake is a converted borrow pit with a surface area of approximately 87 acres. The lakeprovides stormwater management for a contributing drainage area (CDA) of 53.2 ac of adjacent land, plusan additional 91.6 ac of offsite area. The planned normal water elevation (NWL) for the lake wasapproximately 3 ft. Currently, the NWL of North Sherwood Lake is approximately 6 ft. The residentssurrounding the lake would like the NWL lowered. A temporary pumping station has been considered forthe initial drawdown from 6 ft to 3 ft. These and all other elevations in this memo reference the NAVD88datum unless stated otherwise. A permanent pump station will maintain the lowered water elevation.
Parsons Brinckerhoff’s (PB) project scope of work includes the following:· Determine pump size, pumping rate, and time frame to safely pump water without overtaxing the
existing outfall pipe and ditch;· Analyze the 18-inch outfall from the lake to the outfall ditch to determine its capacity to handle the
flow from the lake during non-rainfall conditions and moderate rainfall conditions;· Validate base flow; and· Analyze and estimate the volume of groundwater coming to the lake in addition to the volume of
water that is within the surface area of the lake.
Existing Conditions
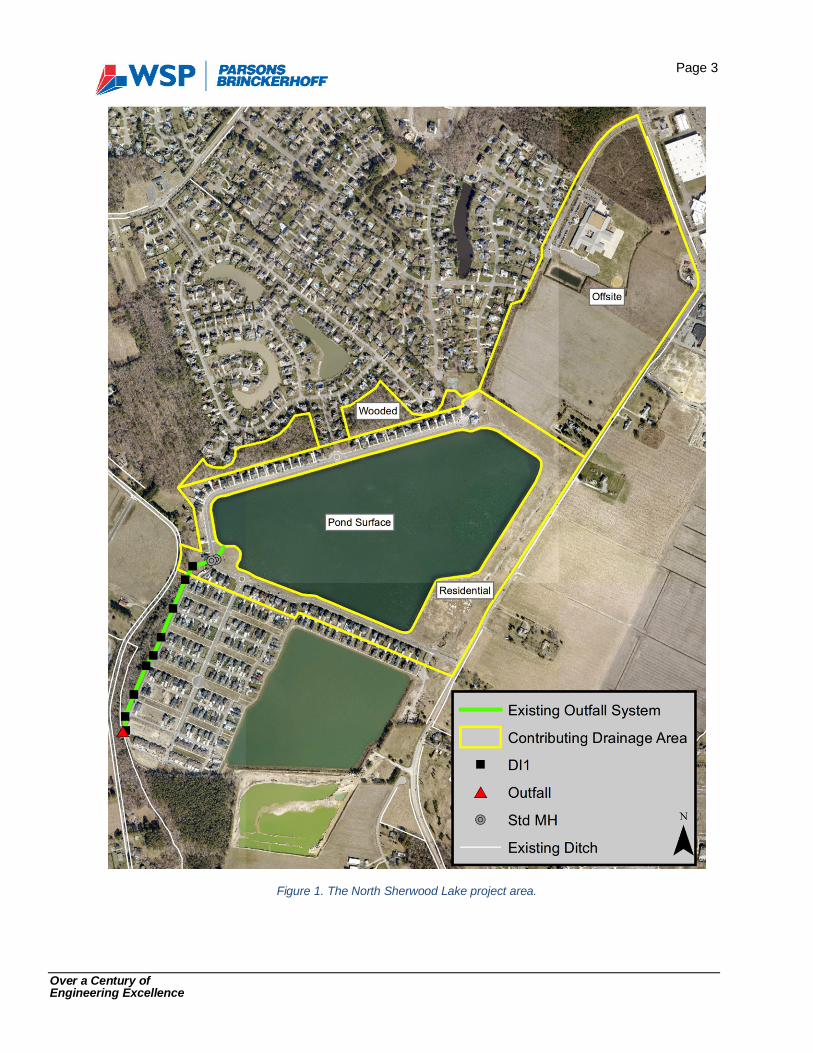
The contributing drainage area to North Sherwood Lake totals 231.3 ac, including the lake surface. Table1 gives detail on the drainage areas and Figure 1 shows the site layout. Sherwood Lakes is located inWatershed 10, the Upper West Neck Creek watershed. The lake outfall system connects to an existingdrainage ditch, which ultimately drains to West Neck Creek in the Southern Watershed.
Table 1. Area and land cover information for North Sherwood Lake contributing drainage areas.
Drainage Area Area (ac) Impervious (%)Residential 53.2 25.2%
Pond Surface 86.5 100.0%Wooded 11.5 0.0%Offsite 80.1 18.9%Total 231.3 49.7%
Page 3
Over a Century ofEngineering Excellence
Figure 1. The North Sherwood Lake project area.
Page 4
Over a Century ofEngineering Excellence
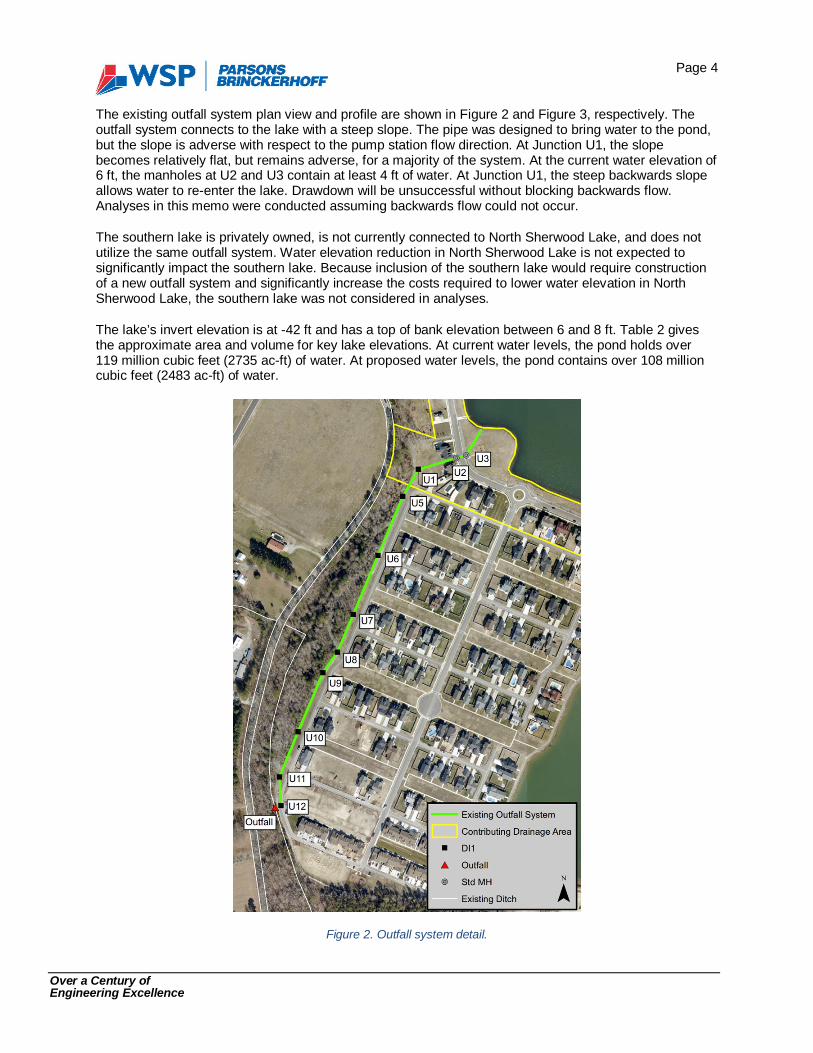
The existing outfall system plan view and profile are shown in Figure 2 and Figure 3, respectively. Theoutfall system connects to the lake with a steep slope. The pipe was designed to bring water to the pond,but the slope is adverse with respect to the pump station flow direction. At Junction U1, the slopebecomes relatively flat, but remains adverse, for a majority of the system. At the current water elevation of6 ft, the manholes at U2 and U3 contain at least 4 ft of water. At Junction U1, the steep backwards slopeallows water to re-enter the lake. Drawdown will be unsuccessful without blocking backwards flow.Analyses in this memo were conducted assuming backwards flow could not occur.
The southern lake is privately owned, is not currently connected to North Sherwood Lake, and does notutilize the same outfall system. Water elevation reduction in North Sherwood Lake is not expected tosignificantly impact the southern lake. Because inclusion of the southern lake would require constructionof a new outfall system and significantly increase the costs required to lower water elevation in NorthSherwood Lake, the southern lake was not considered in analyses.
The lake’s invert elevation is at -42 ft and has a top of bank elevation between 6 and 8 ft. Table 2 givesthe approximate area and volume for key lake elevations. At current water levels, the pond holds over119 million cubic feet (2735 ac-ft) of water. At proposed water levels, the pond contains over 108 millioncubic feet (2483 ac-ft) of water.
Figure 2. Outfall system detail.

Page 5
Over a Century ofEngineering Excellence
Figure 3. The outfall system profile for North Sherwood Lake. The current water elevation of 6 ft is shown.
Table 2. North Sherwood Lake stage-storage table.
ELEVATION (FT) AREA (SF) INCREMENTALVOLUME (CF)
CUMULATIVESTORAGE (CF)
-42 22,676 --40 695,128 562,236 562,236-30 2,055,329 13,152,488 13,714,724-20 2,557,092 23,016,483 36,731,206-10 3,081,401 28,151,748 64,882,9550 3,469,420 32,734,936 97,617,8902 3,536,870 7,006,182 104,624,0723 3,587,165 3,561,988 108,186,0604 3,637,459 3,612,283 111,798,3426 3,729,363 7,366,631 119,164,973
Volume at normal pool (elev. 3.00) = 108,186,060 cf 2483 ac-ftVolume at normal pool (elev. 6.00) = 119,164,973 cf 2735 ac-ft
Page 6
Over a Century ofEngineering Excellence
Alternative Outfall Systems
A gravity outfall system was considered to dewater the lake. A Freedom of Information Act request wassubmitted to the United States Army Corps of Engineers (USACE) to obtain the jurisdictional informationregarding Sherwood Lake and the wetlands boundary. The jurisdictional determination delineates asignificant portion of the adjacent areas to Sherwood lakes as wetlands. The USACE has indicatedverbally at a meeting onsite on August 31, 2016, that mitigation in this area would be 2:1. The meetingnotes are attached in Appendix A. They also indicated that it would be unlikely the required permits wouldbe approved even with mitigation since alternative options, such as a pump station, are available. Inaddition, the USACE indicated a pump station option would provide no wetlands impact. Even assumingmitigation and permits were obtainable, the total cost is anticipated to be excessive. The ditch elevationwould be required to be approximately 6 ft to -0.7 ft for the gravity option to work, which would also havesignificant impact to the wetlands. The pump station option is recommended.
To discharge the pump water, a ditch outfall system could be used as an alternative to the existing pipesystem. A ditch system would require the use of currently unowned real estate. Preliminary calculationsshow the ditch would have to be 10 to 15 ft wide. A ditch outfall system would impact existing wetlandsper the jurisdictional report obtained from the USACE. In our opinion, there would be very little waterquality benefit from the ditch option. We recommend that the existing piped outfall system be used todischarge the pump.
Proposed Pump Station Location
The temporary and permanent pump stations are currently planned to be located adjacent to an existingsanitary pump station off Locksley Arch, at a southwest section of the lake. Due to the condition of theoutfall system, the pump is planned to connect to the existing outfall system at the highest point, JunctionU1. A temporary pumping station will likely feed in through the top of Junction U1, while the permanentpump station will likely connect to the system subsurface. Figure 4 shows a concept of the general pumplocation and connections to the lake and outfall system. The intake pipe must be installed to drain waterdirectly from the lake. The proposed intake pipe is a 24 inch pipe crossing under Locksley Arch,extending into the lake. Survey information is necessary before more detailed plans can be made.

Page 7
Over a Century ofEngineering Excellence
Figure 4. A conceptual image of the pump location, inlet, outlet, and connection to the existing outfall system.
Groundwater Contributions to the Lake
The United States Geological Survey (USGS) operates a groundwater monitoring well in the shallowaquifer within a mile of the lake. The well location is given in Figure 5 and water levels for the period ofrecord are given in Figure 6. The water elevations reference the NGVD29 datum, but can be roughlyconverted to the NAVD88 datum by subtracting 1 ft from the NGVD29 elevation.

Page 8
Over a Century ofEngineering Excellence
Figure 5. The location of the groundwater (GW) monitoring well, USGS 364352076005401 62B 9.
Figure 6. Groundwater elevations recorded at the nearby USGS groundwater monitoring well from 2004 to 2016.Note that NAVD88 elevation is approximately 1 ft lower than NGVD29 datum.

Page 9
Over a Century ofEngineering Excellence
Inflows from groundwater were estimated using the USGS well data with Dupuit assumptions and Darcyflow, where:
=ℎ
Q = Flow rate (cfs)K = Horizontal saturated hydraulic conductivity (ft/s)
A = Area of flow (sq. ft) = Slope of water table (ft/ft)
K was estimated at 11 m/day or 4.18 x 10⁻⁴ ft/s (Smith, 2003); A was drawdown depth (3 ft) multiplied bythe lake perimeter; and was average monthly head difference divided by 100 ft, a conservative estimatefor water table recovery distance from the edge of lake. Average monthly head difference was calculatedusing the USGS well data. The average monthly groundwater inflows are given in Table 3. The averageannual groundwater flow rate was anticipated to be roughly 0.3 cfs. The average monthly groundwatercontributions in Table 3 were added to model simulations.
Table 3. The estimated average groundwater contribution to the lake per month. Groundwater contribution is lowestin August and highest in March.
Month Q (cfs)January 0.37
February 0.39March 0.40April 0.35May 0.32June 0.26July 0.24
August 0.20September 0.24
October 0.28November 0.31December 0.36
Table 4 gives the time to fill the lake by 0.5 ft for the average groundwater flow rate. Even at a high 1.0cfs recharge rate, it would take 20 days to see a 0.5 ft water level rise. For comparison, a 0.5 ft rise in thelake water elevation is expected from a 4-inch, 24-hour storm. Examining both the average monthly flowsin Table 3 and the overall water level trends in Figure 6 show expected seasonal highs and lows. For themost rapid lowering, initial drawdown should occur in the summer or early fall to minimize the amount ofgroundwater pumped from the lake. Since the lake level is controlled by groundwater elevation, the lakelevel is at its highest when the groundwater is highest.
Table 4. Number of days for groundwater flow to raise lake water level by 0.5 ft with no rainfall.
Groundwater Contribution (cfs) Days to Rise 0.5 ft0.3 691.0 20

Page 10
Over a Century ofEngineering Excellence
Initial Drawdown with a Temporary Pump
PCSWMM was used to model the initial drawdown time in North Sherwood Lake. Initial estimates ofoutfall system capacity were between 3 and 4 cfs. A pumping rate of 3.5 cfs was chosen for thetemporary pump to minimize drawdown time. At 3.5 cfs, the hydraulic grade line (HGL) of Junction U6 isjust above ground elevation. To prevent overtopping, the inlet could be sealed or a secondary outfallcould be added to Junction U5 or U6, conceptualized in Figure 7. The secondary outfall reduces the HGLby over 1.5 ft, relieving burden on the existing outfall system and reducing the need for pipe liningdownstream. Survey information is necessary before the secondary outfall option can be further explored.With the secondary outfall, pipe lining is recommended from Junction U1 to Junction U7 to accommodatethe additional stresses imposed on the pipe by the pump discharge. The outfall pipes should be inspectedand cleaned before determining which additional pipes, if any, should be lined.
Figure 7. An example of a secondary outfall at U6 that connects to the existing ditch system.
Hourly rainfall data between 1948 and 2013 was obtained from the Norfolk International Airport anddisaggregated to 15 minute intervals. The drawdown time simulations primarily used rainfall data from2009, an above average rainfall year with a total of 64.2 inches of rainfall. Simulations occurred betweenSeptember 1, 2009 and January 6, 2010. During that time frame, there was a 5-year 24-hour storm andfour storms with over 1 inch of rain in 24-hours. Due to capacity limitations in the existing outfall system,

Page 11
Over a Century ofEngineering Excellence
the pump should be shut off during moderate to heavy rain events. To account for this in model results,when daily rainfall was greater than 0.1 inches, that day was added to the drawdown time. The resultsfrom five simulations are given in Table 5. Total drawdown times ranged from 58 to 86 days, averaging 73days. Except for shutdowns due to wet weather, the temporary pump will run continuously for that timeperiod.
Table 5. Initial drawdown time results of five PCSWMM simulations.
Simulation Begin Date End Date RainfallDrawdownTime (Days)
Days with>0.1 inRainfall
TotalDrawdownTime (Days)
1 10/1/2009 11/26/2009 11.65 56 14 702 10/27/2009 12/30/2009 16.34 64 21 853 9/1/2009 10/26/2009 10.76 55 12 674 9/19/2009 11/4/2009 4.88 46 12 585 11/1/2009 1/6/2010 16.80 66 20 86
Temporary pumping at 3.5 cfs requires that the existing outfall system be lined to accommodateadditional stresses imposed on the pipe by pumping. Lining represents a significant expense at $100/ft,totaling $175,000 for the entire outfall system. This expense may be reduced to $75,000 by installing thesecondary outfall, potentially eliminating the need to line downstream pipes after Junction U7. Pipes willneed to be inspected and cleaned before making final decisions on lining pipes downstream of JunctionU7.
The temporary pump is expected to run 24 hours a day and uses 2 gal/hr of diesel fuel, totaling $13,500over 90 days. The temporary pump does not have the ability to stop pumping during rain events, so itmust be manually stopped and restarted. These costs can be reduced by delaying initial pumping untilsummer. During late autumn, winter, and early spring, evaporation is negligible and groundwater flowsare high. Pumping during summer reduces initial drawdown times, as shown in Table 6. Takingadvantage of summer evaporation and low groundwater flows will reduce costs associated withtemporary pump usage.
Table 6. Summer and autumn 2009 simulation results with evaporation enabled. Without evaporation, drawdowntimes from summer and autumn would be nearly equivalent. Summer has reduced total drawdown times compared to
autumn due to the effect of evaporation.
StartingMonth
RainfallDuring
Simulation(in)
TotalDrawdown
Time(Days)
StartingMonth
RainfallDuring
Simulation(in)
TotalDrawdown
Time(Days)
June 6.05 45 September 10.50 60July 10.77 53 October 11.49 66
August 20.99 78 November 16.80 83
After initial drawdown by the temporary pump, a permanent pump will be installed to maintain the 3 ftwater elevation in the lake. A single 1.5 cfs pump is planned to turn on after the water elevation reaches3.5 ft, and turn off when the elevation returns to 3 ft. A smaller on-off range will be considered for the finaldesign. A second pump will be available for when the first undergoes maintenance, or in case of

Page 12
Over a Century ofEngineering Excellence
emergency. The permanent pump station is designed to remain off for weeks and then run constantly formonths at a time, if necessary. Because of this, non-standard pumps must be used. The permanentpumps will need to be continuous heavy duty machinery requiring additional maintenance.
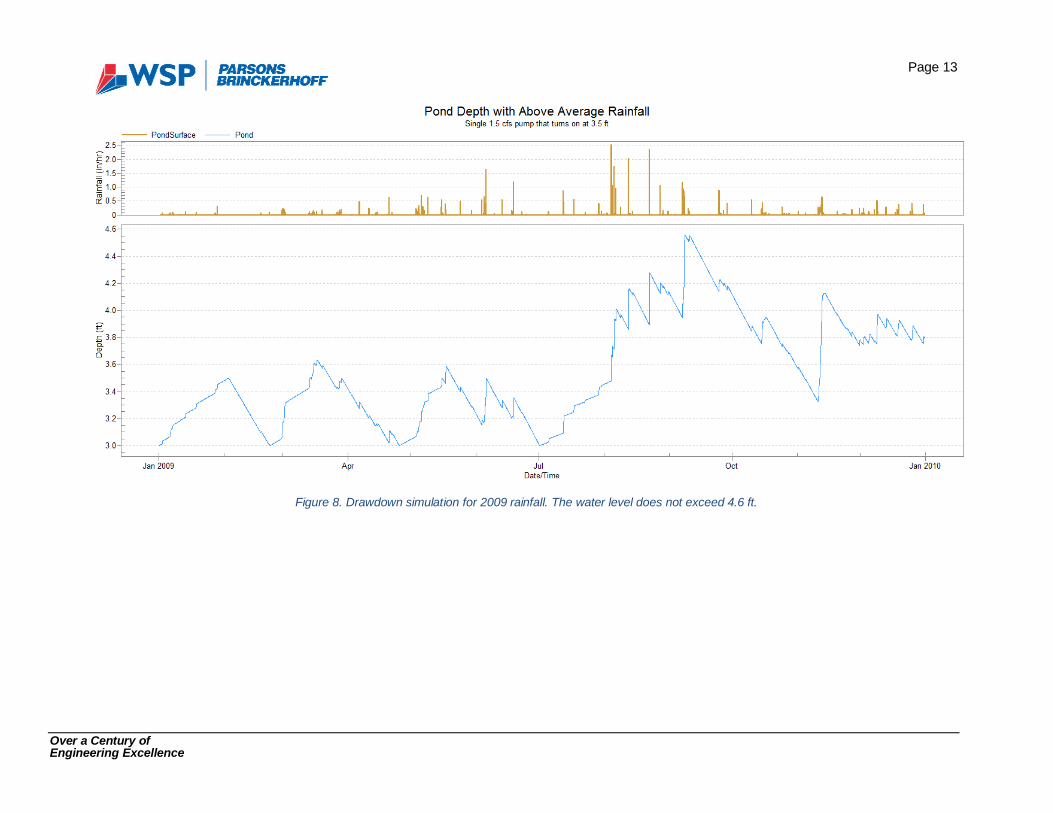
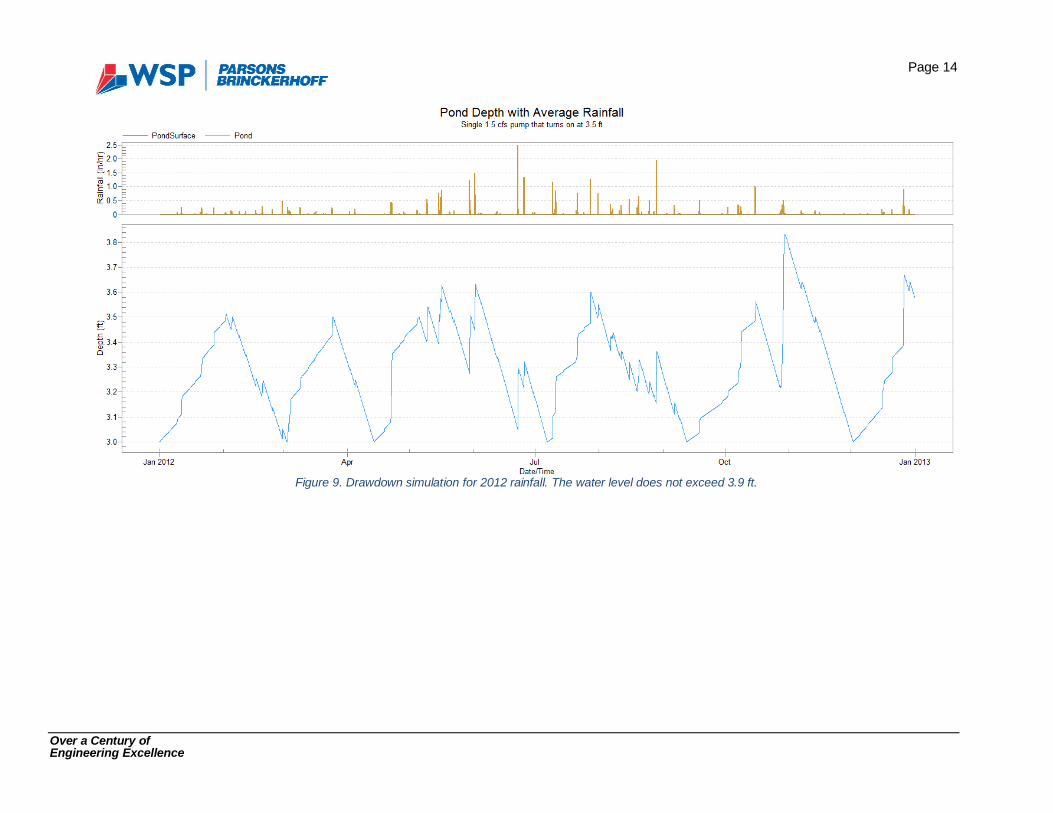
The 1.5 cfs pump was modeled during 2009, an above average rainfall year (64.2 in) and in 2012, anaverage rainfall year (47.9 in). The simulation results are given in Figure 8 and Figure 9, respectively. Thewater level does not exceed 4.6 ft during the 2009 simulation, nor does it exceed 3.9 ft during the 2012simulation. A single 1.5 cfs pump is adequate for average and above average rainfall conditions.
Despite reduced costs as a result of running the temporary pump during summer, those costs stillrepresent significant expense. The total cost of the temporary pump is estimated at $90,000. All costsassociated with temporary pumping can be avoided by using the permanent condition for initialdrawdown. The permanent pump will utilize electricity as a power source and will have a control panel formanaging flow periods, eliminating the need for fuel and labor associated with refueling or turning thepumps on/off during rain. Construction of the permanent condition could proceed during the winter andspring months when initial drawdown is not recommended due to expense. The permanent pump willfunction at a reduced flow rate as compared to the temporary pump, prolonging initial dewatering.However, past experience suggests that prolonging the initial drawdown period may maintain bankstability, which may further reduce expenses.
Due to project timing, the cost savings from eliminating temporary pump usage, and the potential forincreased bank stability, we recommend that the permanent pump station be constructed and used forinitial dewatering of the lake.
Page 13
Over a Century ofEngineering Excellence
Figure 8. Drawdown simulation for 2009 rainfall. The water level does not exceed 4.6 ft.
Page 14
Over a Century ofEngineering Excellence
Figure 9. Drawdown simulation for 2012 rainfall. The water level does not exceed 3.9 ft.

Page 15
Over a Century ofEngineering Excellence
Permanent Pumping Replacing Temporary Pumping
To facilitate initial drawdown of the lake using the permanent pump station, the flow rate of the permanentpumps should be increased to 1.75 or 2 cfs. The permanent pump station is designed to remain off forweeks and then run constantly for months at a time, if necessary. Because of this, the permanent pumpswill need to be continuous heavy duty machinery requiring additional maintenance.
The backup pump may be used to reduce initial drawdown time depending on how the outfall system isaltered. The outfall system alterations therefore affect the initial drawdown time of the permanent system.Without the secondary outfall to reduce the HGL, running the backup pump may overload the existinggravity outfall system, preventing use of the second pump. A summary of when the backup pump can beoperated is given in Table 7 for each outfall condition: the secondary outfall present to the creek, thesecondary outfall not present but Junction U6 is sealed, and no changes made to Junction U6. Even withthe secondary outfall, there is not adequate capacity to accommodate moderate to heavy rain eventswhile the main pump and backup pump are running simultaneously. The backup pump can be used todewater the lake faster, but may destabilize the banks.
Table 7. Summary of when the backup pump can be used for initial or emergency drawdown of the lake.
Secondary Pump Operation ConditionsPump Flow Rate
1.75 cfs 2 cfs
Out
fall
Syst
emAl
tera
tion
SecondaryOutfall
During dryperiods
During dryperiods
Junction U6Sealed
During dryperiods
Cannot beoperated
None Cannot beoperated
Cannot beoperated
The 1.75 and 2 cfs pumps were modeled to determine initial drawdown time. A single simulation wasperformed for each pump flow rate and for backup pump conditions. The backup pump was only inoperation during dry periods. Simulations began on October 1, 2009, a year with above average rainfall.Evaporation and groundwater flow were included in the simulations. The drawdown time is given Table 8.
Table 8. The initial drawdown time using the permanent pump station with pumping beginning in October of an aboveaverage rainfall year.
Pump FlowRate
Numberof Pumps
Drawdown Time(Days)
1.75 cfs1 174
2* 53
2 cfs 1 1422* 35
*Second pump active during dry periods only.

Page 16
Over a Century ofEngineering Excellence
Permanent Water Elevation Increase
All analyses conducted until this point have calculated drawdown to a water elevation of 3 ft. Increasingthe permanent water elevation of the lake may result in some cost savings. Pump run times are reduced,which reduces pump operation and maintenance costs. Raising the permanent water elevation may alsoreduce the amount of bank stabilization required. A single simulation was performed for each flow rate todetermine an approximate drawdown time to permanent water elevations ranging from 3 to 4.5 ft. Allsimulations began October 1, 2009, because that start date gave a drawdown time closest to the averagedrawdown time in Table 5. The simulations included lake evaporation and groundwater baseflow andwere conducted assuming the secondary outfall to the creek was in place. The results of thesesimulations are given in Table 9.
Table 9. Drawdown times for permanent water elevations ranging from 3 to 4.5 ft for each proposed pump rate.
PumpRate(cfs)
No. ofPumps
DrawdownElevation (ft)
TotalDrawdownTime (Days)
3.5 1
3.0 643.5 424.0 344.5 25
2.0 2*
3.0 353.5 304.0 244.5 19
1.75 2*
3.0 533.5 354.0 284.5 21
1.5 2
3.0 673.5 554.0 344.5 26
*Second pump active during dry periods only.

Page 17
Over a Century ofEngineering Excellence
Bank Stabilization
Drawdown is expected to impact the stability of the banks. The sandy shelf is fairly stable except forwhere the bank is steeper, evidenced by Figure 10 in which the sand underneath a concrete path haswashed away, leaving the path unsupported. However, the lake was originally designed for a waterelevation of 3 ft and a flat sand shelf extends far from shore. Wave action is not anticipated. Armoring andother alternatives will be sought to provide the best bank stabilization in the final design.
Figure 10. A photograph of the concrete path leading into the lake from the sanitary pump station. The sandunderneath the concrete has been washed away.
Downstream Impacts
Though the existing outfall system has capacity to handle the designed flow rate, the existing ditchsystem is within a wetland. Impacts to the wetland must be considered, particularly for construction of asecondary outfall. The City of Virginia Beach has been in contact with the Army Corps of Engineers andthere is an Army Corps of Engineers requirement to provide wetland mitigation, possibly through wetlandplantings, wetland creation, or purchasing credit at a wetland mitigation bank.
The additional flow through the ditch system has potential to impact a road crossing under SeaboardRoad. It was determined that the analysis of the outfalls is not needed based on the fact the system willbe an “off peak” system. There would be no adverse effects on the outfalls since the discharge would notexceed 3 cfs, which is the capacity of the discharge piping.
Page 18
Over a Century ofEngineering Excellence
Cost Estimate
Costs for the project were broken down into base costs, temporary pump costs, and permanent pumpcosts for drawdown to a water elevation of 3 ft. Base costs (Table 10) are costs that are independent ofpump type. Base costs were calculated with and without bank stabilization. Property acquisition is notincluded in the base cost because the property is expected to be granted to the City of Virginia Beach atno cost. Temporary pump costs (Table 11) are those associated with use and maintenance of atemporary pump for initial drawdown. Permanent pump costs (Table 12) are directly associated withinstallation of the permanent pump station. Wetland mitigation costs are not included. All costs wererounded to the next $10,000 increment. The total cost of the project, including bank stabilization and thetemporary pump costs, totals over $1,000,000. Without the temporary pump, project costs are estimatedat $920,000 with bank stabilization, and $400,000 without it.
Conclusions
Initial drawdown time using a 3.5 cfs temporary pump averages 73 days when begun in fall. Toaccommodate the flow rate, the outfall system must be altered by sealing Junction U6 or creating asecondary outfall. We recommend creation of a secondary outfall to relieve strain on the outfall system forhigh flows.
We recommend initial drawdown begin during summer due to high evaporation and reduced groundwatercontributions to the lake. These factors reduce initial drawdown times to an average of 58 days at a pumpflow rate of 3.5 cfs.
We recommend not using a temporary pump for initial drawdown of the lake, instead constructing thepermanent pump station and using 1.75 or 2 cfs pumps for initial drawdown. This action eliminates costsfrom temporary pump usage, allows construction during high groundwater seasons, and potentially allowsfor greater bank stability through longer drawdown times.
Survey information is needed to proceed with design of the permanent condition. Inspection and cleaningof the existing outfall is needed to determine the extent of lining. Wetland mitigation and downstreamimpacts must be considered.
Page 19
Over a Century ofEngineering Excellence
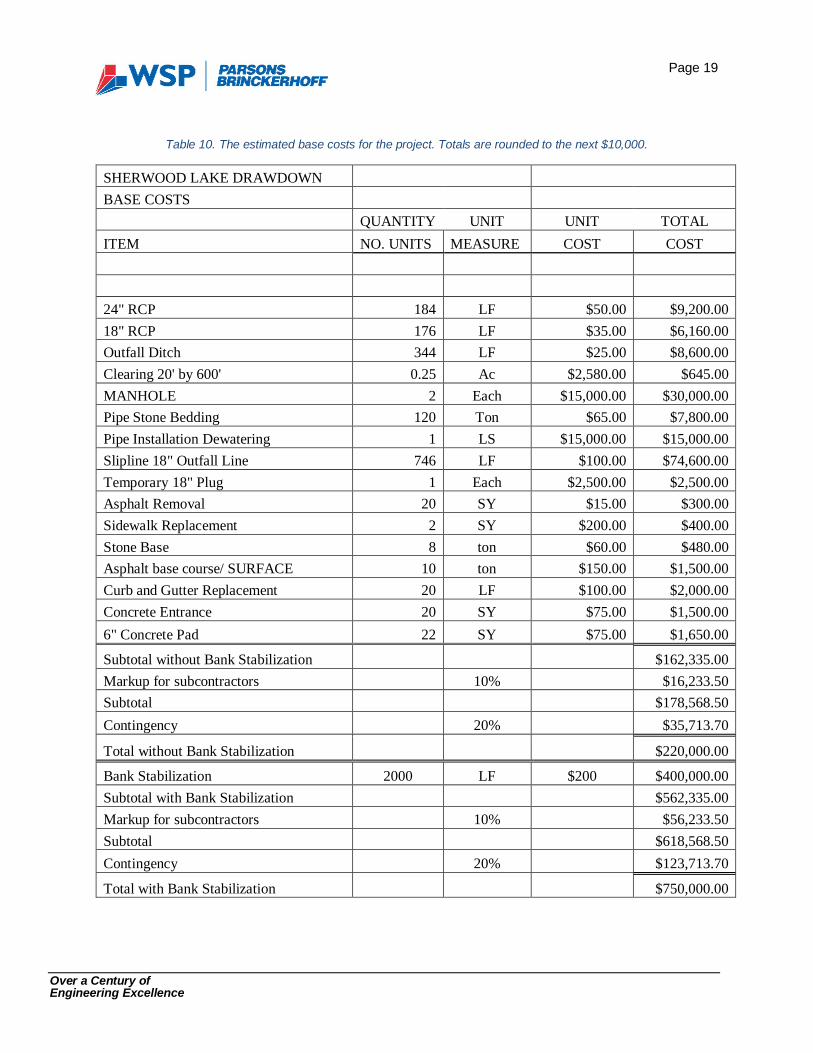
Table 10. The estimated base costs for the project. Totals are rounded to the next $10,000.
SHERWOOD LAKE DRAWDOWNBASE COSTS
QUANTITY UNIT UNIT TOTALITEM NO. UNITS MEASURE COST COST
24" RCP 184 LF $50.00 $9,200.0018" RCP 176 LF $35.00 $6,160.00Outfall Ditch 344 LF $25.00 $8,600.00Clearing 20' by 600' 0.25 Ac $2,580.00 $645.00MANHOLE 2 Each $15,000.00 $30,000.00Pipe Stone Bedding 120 Ton $65.00 $7,800.00Pipe Installation Dewatering 1 LS $15,000.00 $15,000.00Slipline 18" Outfall Line 746 LF $100.00 $74,600.00Temporary 18" Plug 1 Each $2,500.00 $2,500.00Asphalt Removal 20 SY $15.00 $300.00Sidewalk Replacement 2 SY $200.00 $400.00Stone Base 8 ton $60.00 $480.00Asphalt base course/ SURFACE 10 ton $150.00 $1,500.00Curb and Gutter Replacement 20 LF $100.00 $2,000.00Concrete Entrance 20 SY $75.00 $1,500.006" Concrete Pad 22 SY $75.00 $1,650.00
Subtotal without Bank Stabilization $162,335.00Markup for subcontractors 10% $16,233.50Subtotal $178,568.50Contingency 20% $35,713.70
Total without Bank Stabilization $220,000.00
Bank Stabilization 2000 LF $200 $400,000.00Subtotal with Bank Stabilization $562,335.00Markup for subcontractors 10% $56,233.50Subtotal $618,568.50Contingency 20% $123,713.70
Total with Bank Stabilization $750,000.00
Page 20
Over a Century ofEngineering Excellence
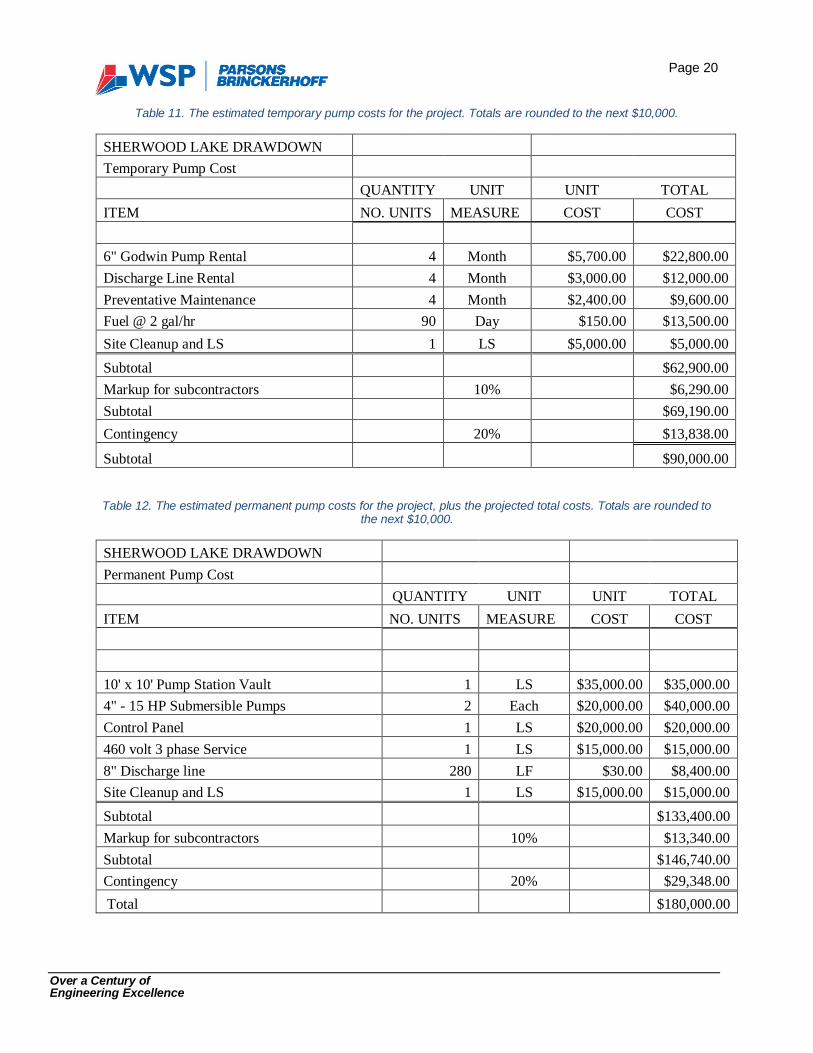
Table 11. The estimated temporary pump costs for the project. Totals are rounded to the next $10,000.
SHERWOOD LAKE DRAWDOWNTemporary Pump Cost
QUANTITY UNIT UNIT TOTALITEM NO. UNITS MEASURE COST COST
6" Godwin Pump Rental 4 Month $5,700.00 $22,800.00Discharge Line Rental 4 Month $3,000.00 $12,000.00Preventative Maintenance 4 Month $2,400.00 $9,600.00Fuel @ 2 gal/hr 90 Day $150.00 $13,500.00Site Cleanup and LS 1 LS $5,000.00 $5,000.00Subtotal $62,900.00Markup for subcontractors 10% $6,290.00Subtotal $69,190.00Contingency 20% $13,838.00
Subtotal $90,000.00
Table 12. The estimated permanent pump costs for the project, plus the projected total costs. Totals are rounded tothe next $10,000.
SHERWOOD LAKE DRAWDOWNPermanent Pump Cost
QUANTITY UNIT UNIT TOTALITEM NO. UNITS MEASURE COST COST
10' x 10' Pump Station Vault 1 LS $35,000.00 $35,000.004" - 15 HP Submersible Pumps 2 Each $20,000.00 $40,000.00Control Panel 1 LS $20,000.00 $20,000.00460 volt 3 phase Service 1 LS $15,000.00 $15,000.008" Discharge line 280 LF $30.00 $8,400.00Site Cleanup and LS 1 LS $15,000.00 $15,000.00Subtotal $133,400.00Markup for subcontractors 10% $13,340.00Subtotal $146,740.00Contingency 20% $29,348.00 Total $180,000.00

Page 21
Over a Century ofEngineering Excellence
References
Smith, B. S. (2003). Ground-water flow and saline water in the shallow aquifer system of the SouthernWatersheds of Virginia Beach, Virginia. US Department of the Interior, US Geological Survey.