member training climate change from ambition to action 13th november 2009 workshop
DESCRIPTION
TRANSCRIPT

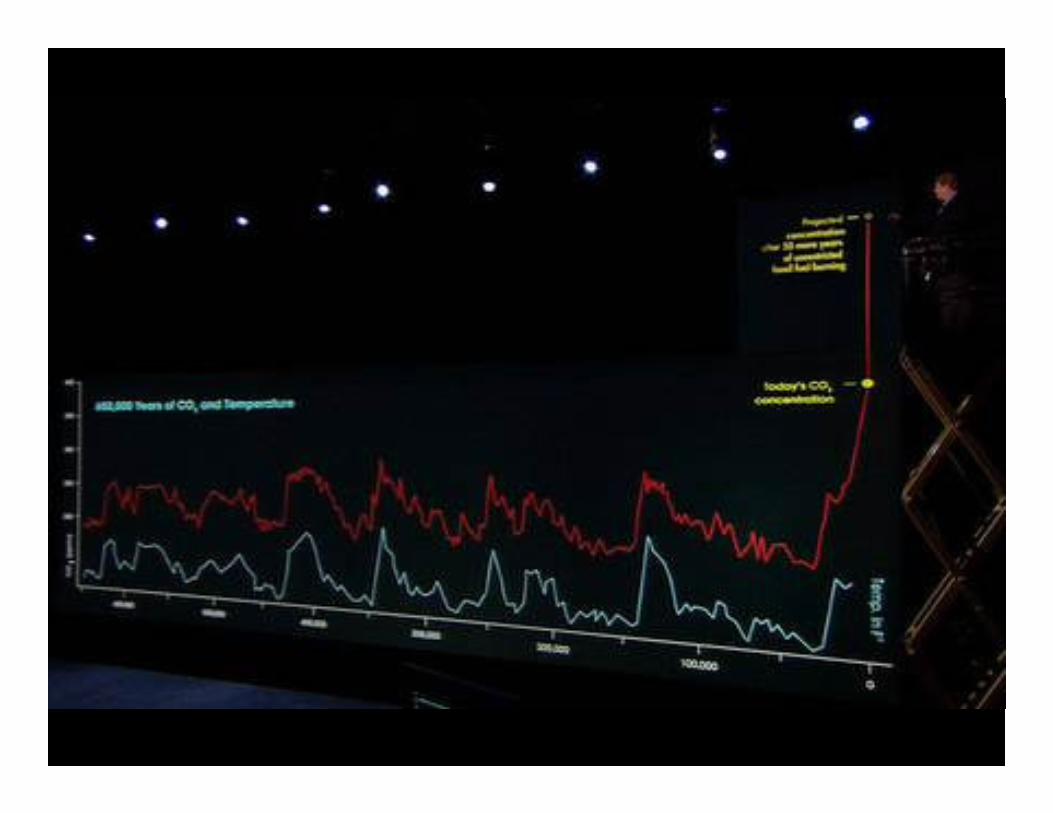
Climate Change <from Ambition to Action>
Richard DaviesChris Allen

QUESTIONS?• What’s good? (Best Practice)
• Who can help us? (Provider
Landscape)
• What can we deliver? (Plan)
• What else do we need?
(leadership, £, regulation, knowledge?)

Session 1 Climate Change,
Peak Oil & Energy Security
<without hot air>Richard Davies
Director
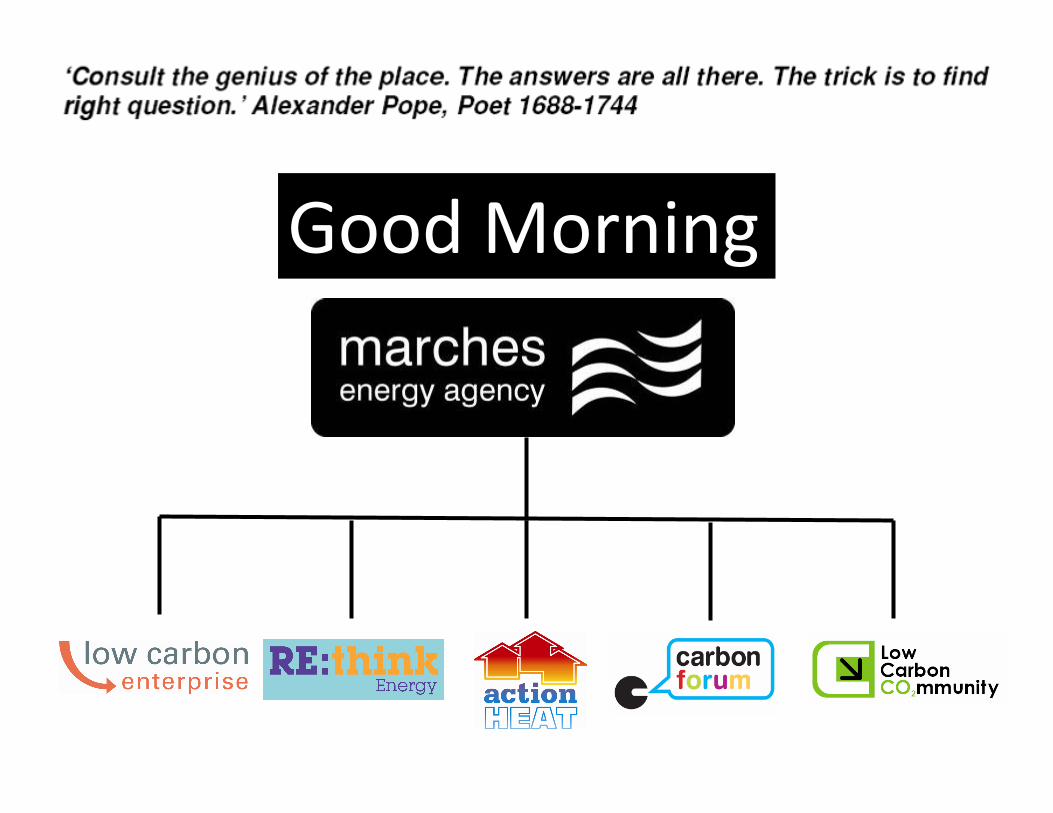
Good Morning


Threat?

The energy
tri-lemma1. Affordability
2. Reliability
3. Low Carbon


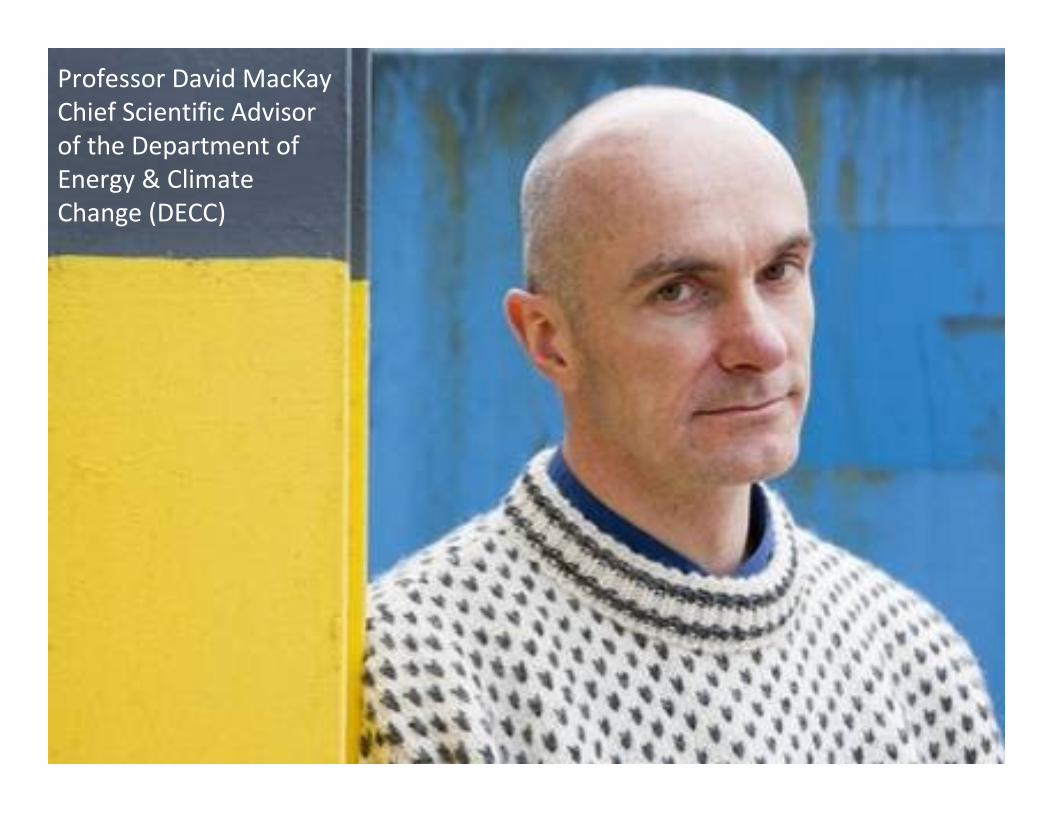
Professor David MacKay
Chief Scientific Advisor
of the Department of
Energy & Climate
Change (DECC)

‘The best scientific projections indicate
that we have very little time left -
indeed, less than one hundred months - in
which to alter our behaviour drastically.
Although I wish it were otherwise, I fear we have reached the point when if we do too little, too late to tackle this problem,
the consequences could be
catastrophic.’
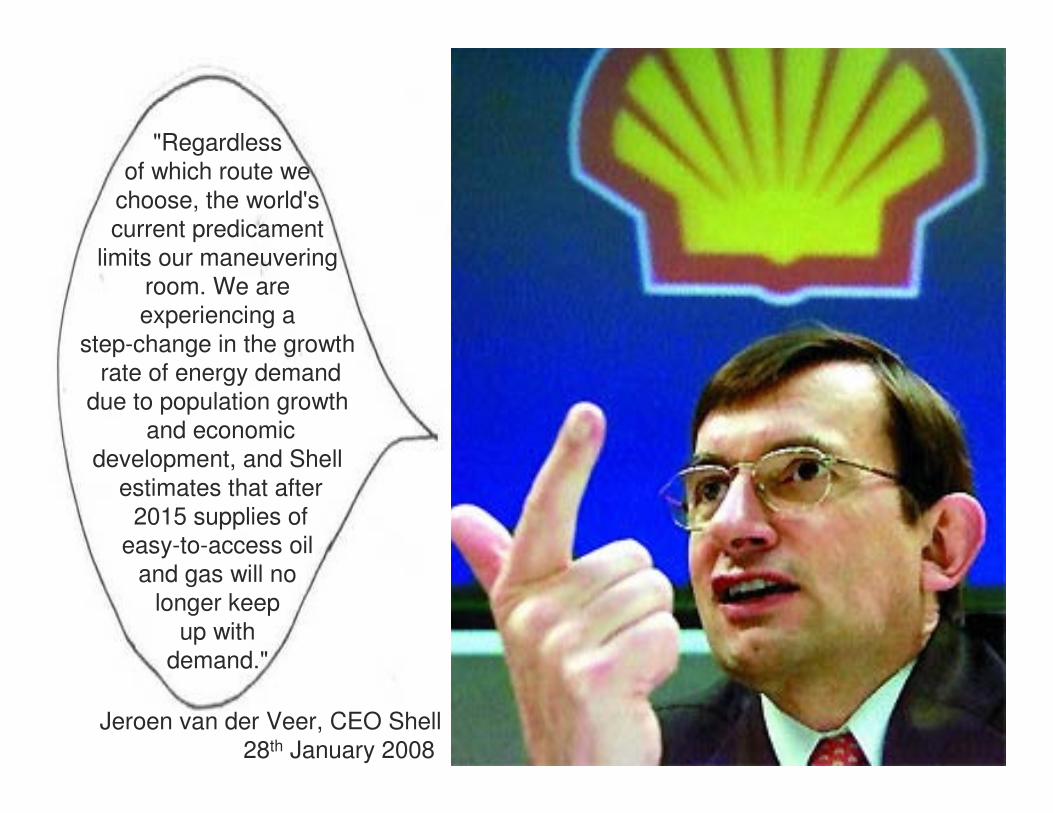
Jeroen van der Veer, CEO Shell
28th January 2008
"Regardless
of which route we
choose, the world's
current predicament
limits our maneuvering
room. We are
experiencing a
step-change in the growth
rate of energy demand
due to population growth
and economic
development, and Shell
estimates that after
2015 supplies of
easy-to-access oil
and gas will no
longer keep
up with
demand."


Safari.lnk


0
100
200
300
400
500
600
700
800
900
1990 1991 1992 1993 1994 1995 1996 1997 1998 1999 2000 2001 2002 2003 2004 2005 2006 2007
millio
n t
on
ne
s
(ca
rbo
n d
ioix
de
eq
uiv
ale
nt)
Basket of greenhouse gases (CO2 equiv)
Carbon Dioxide
Source: AEA


18501850

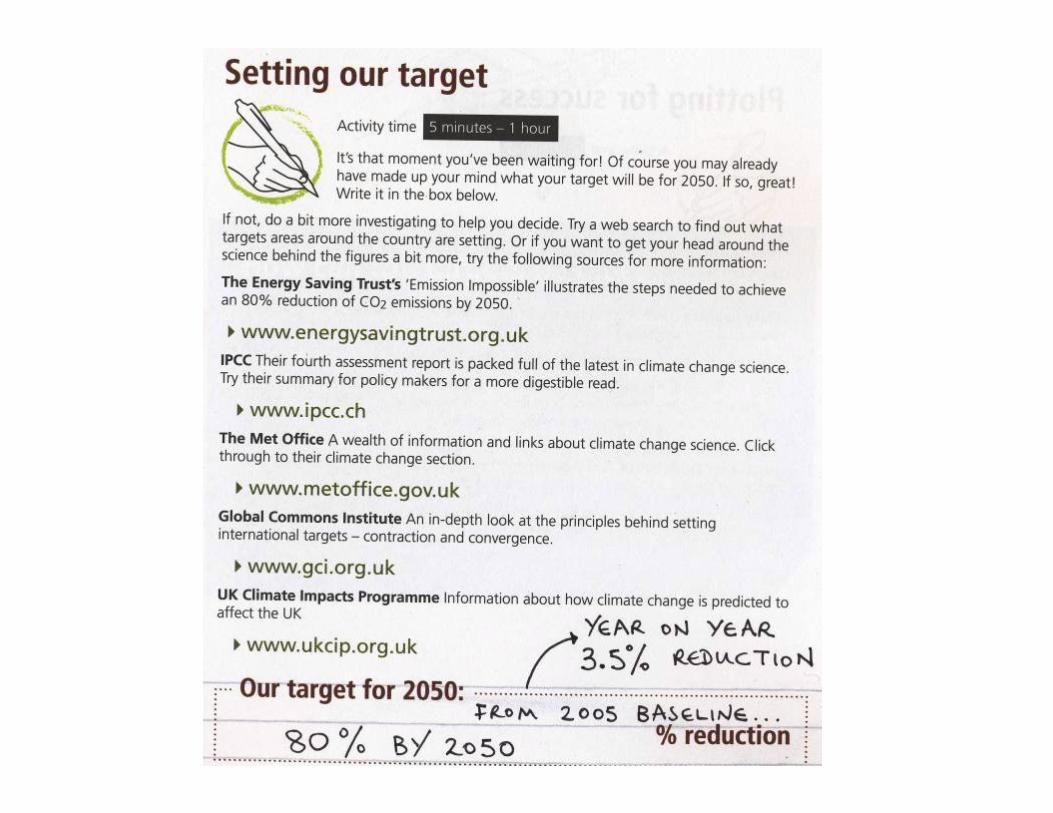
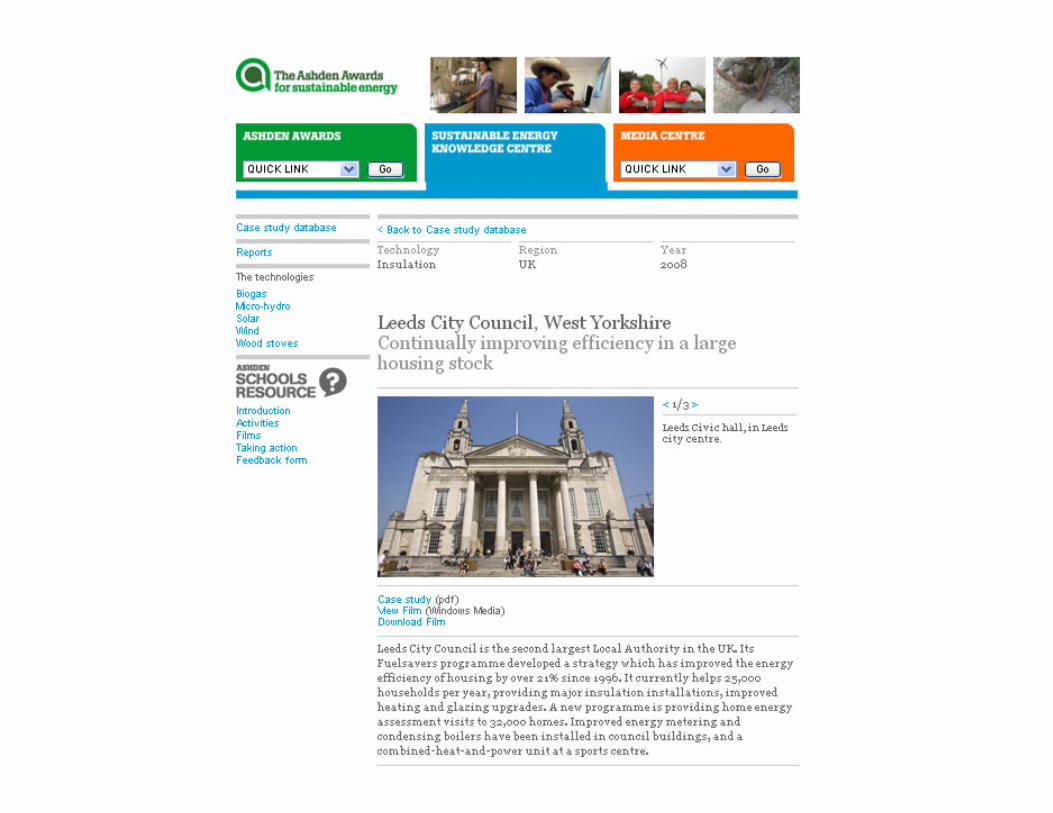
What does this mean for AnyPlace in 2020?Meeting carbon budgets in 2020 will require a reduction in average
per person emissions from the current level of 9 tCO2 to 6 tCO2.
In a County where carbon budgets are achieved, the typical person will:
• Meet more of their energy needs from low-carbon power.
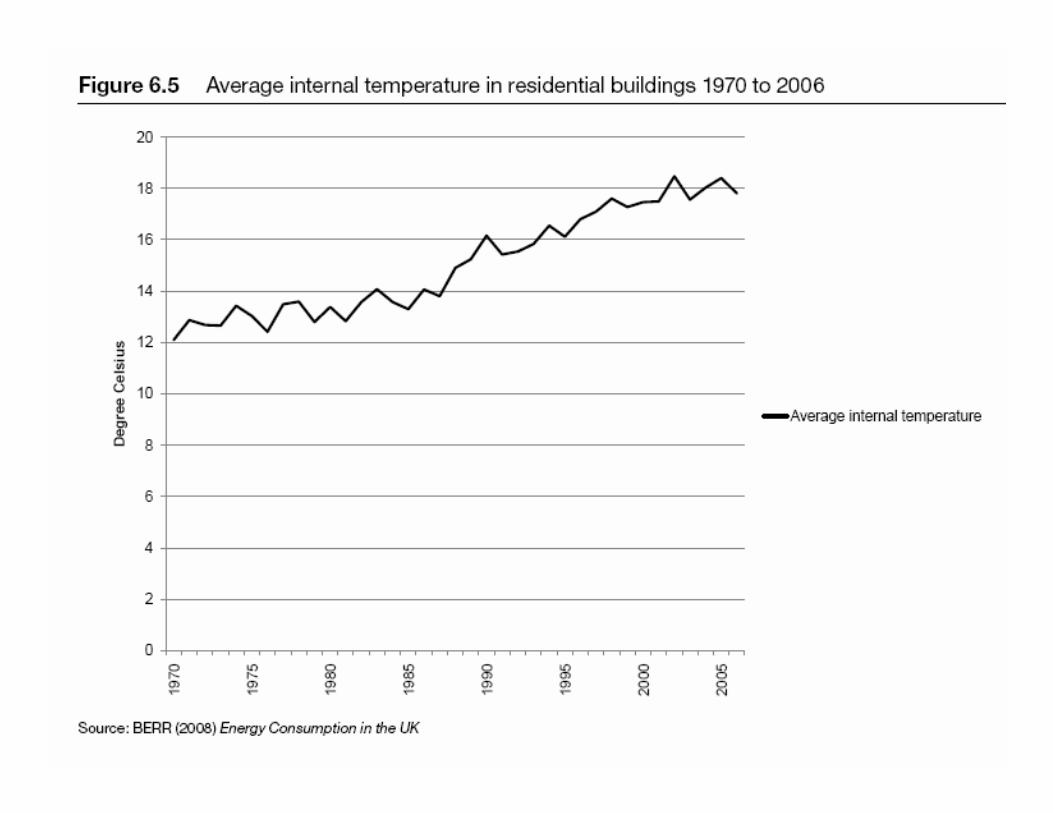
• Live in well-insulated homes with new efficient boilers and advanced
heating controls.
• Purchase energy-efficient appliances and use these on low-carbon cycles
(e.g. low temperature washing and dishwashing).
• Work in energy-efficient offices with power and heating from low carbon
sources.
• Drive more carbon-efficient cars, including hybrids, electric cars or plug-in
hybrids with charging infrastructure at home, at work and in public places.
• Drive in an eco-friendly manner (e.g. not carrying excess weight in the car)
and within the existing speed limit.
• Plan journeys better and use public transport more.
Together these changes would be sufficient to achieve carbon budgets.
They could significantly improve energy security of supply and air quality,
and therefore maintain or improve quality of life.

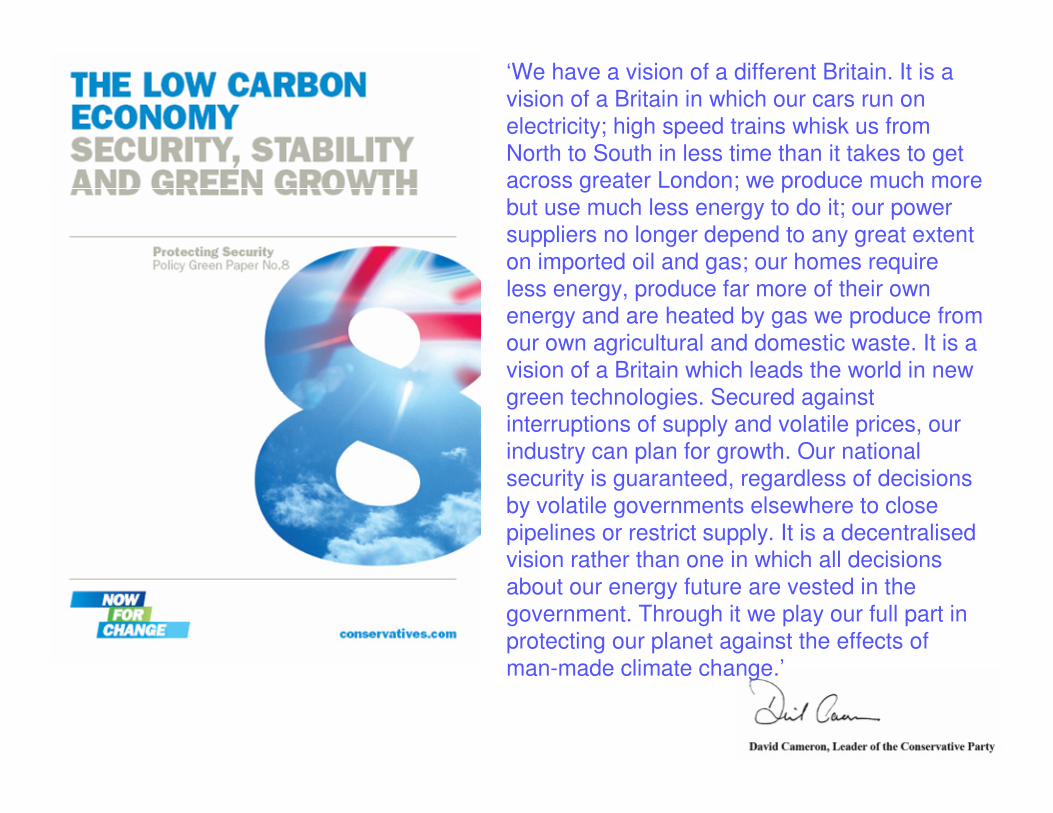
‘We have a vision of a different Britain. It is a vision of a Britain in which our cars run on electricity; high speed trains whisk us from North to South in less time than it takes to get across greater London; we produce much more but use much less energy to do it; our power suppliers no longer depend to any great extent on imported oil and gas; our homes require less energy, produce far more of their own energy and are heated by gas we produce from our own agricultural and domestic waste. It is a vision of a Britain which leads the world in new green technologies. Secured against interruptions of supply and volatile prices, our industry can plan for growth. Our national security is guaranteed, regardless of decisions by volatile governments elsewhere to close pipelines or restrict supply. It is a decentralised vision rather than one in which all decisions about our energy future are vested in the government. Through it we play our full part in protecting our planet against the effects of man-made climate change.’


Opportunity?


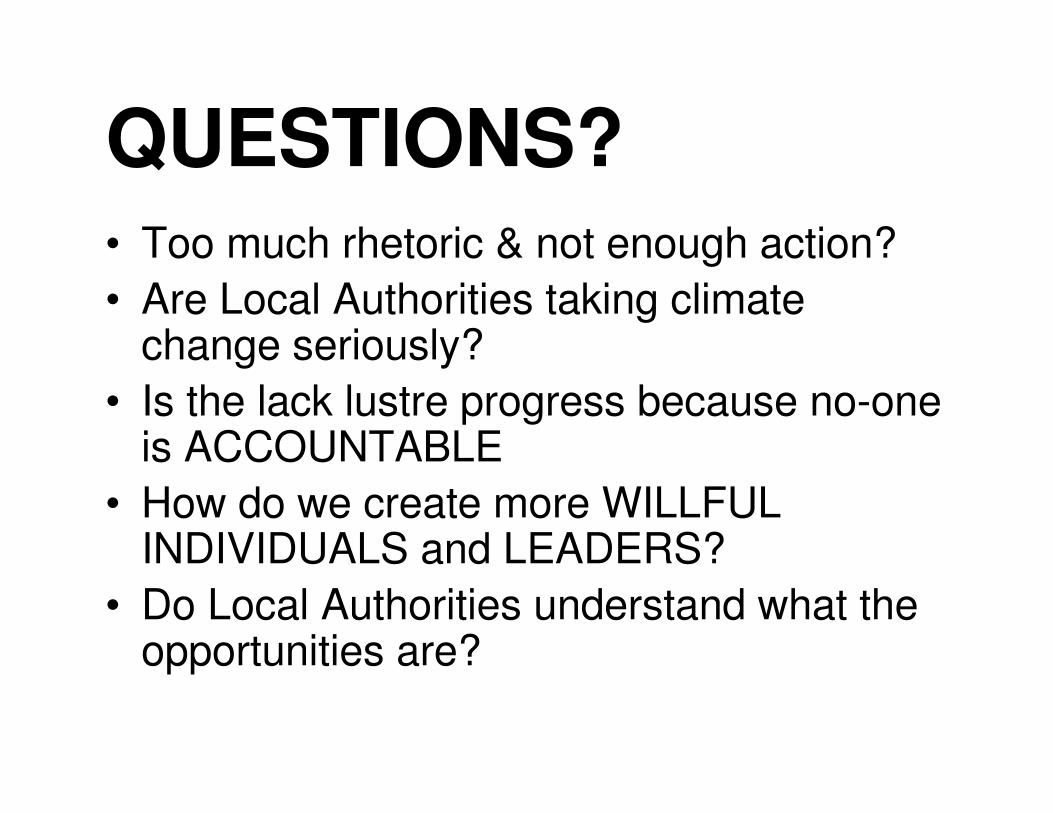
QUESTIONS?• Too much rhetoric & not enough action?
• Are Local Authorities taking climate change seriously?
• Is the lack lustre progress because no-one is ACCOUNTABLE
• How do we create more WILLFUL INDIVIDUALS and LEADERS?
• Do Local Authorities understand what the opportunities are?

Session 2 Low Carbon Communities
<Reducing CO2 emissions. A tour
of National Indicator 186>
Richard Davies
Director
Sub Title
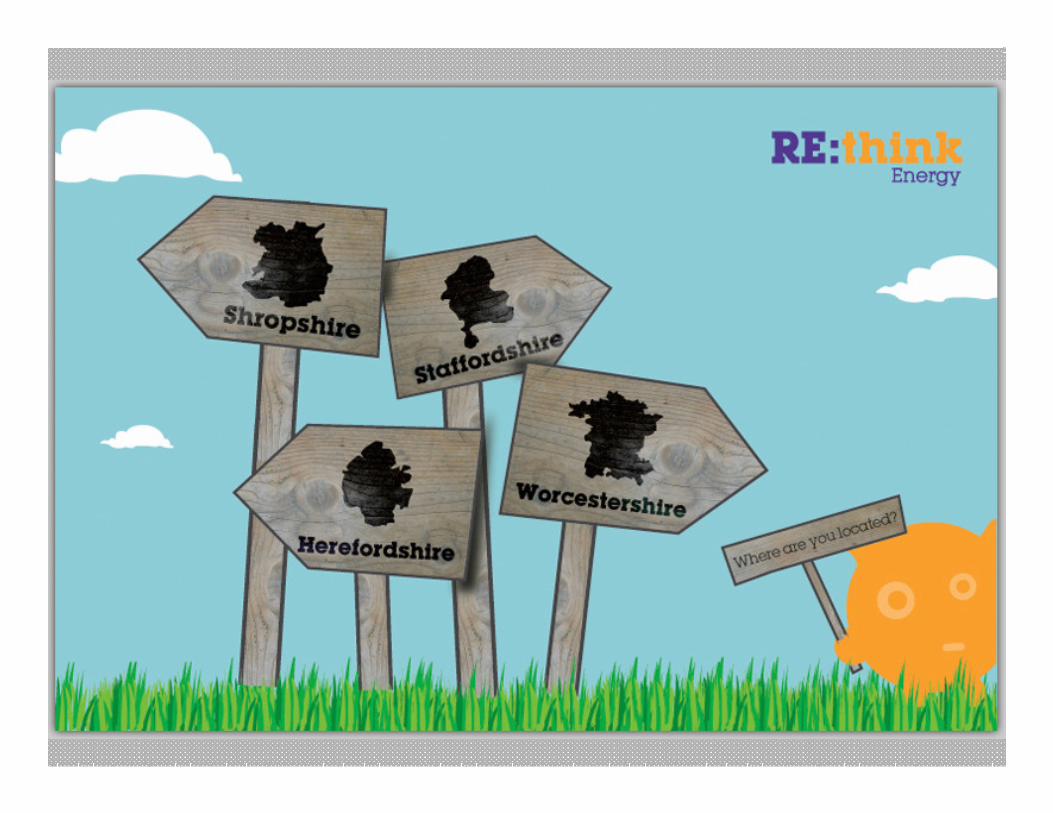
If you don’t know where
you are going you are
almost certain to end
up there

Who’s signed up to NI186?
• Birmingham
• Coventry
• Dudley
• Herefordshire
• Sandwell
• Staffordshire
• Stoke-on-Trent
• Telford & Wrekin
• Warwickshire
• Worcestershire

In the eye of the storm: councils at the
heart of tackling climate change
Climate change mitigation in the local
authority performance framework
James Gorie
DECC – Low carbon economy: local & regional government team

Background to climate Change Indicators
• Need for requirement for local authorities to tackle climate
change recommended by Centre for Sustainable Energy
report in 2005
• Commitment in the 2006 UK Climate Change Programme
for the new local authority performance framework to
include an “appropriate focus” on climate change
• LGA’s Climate Change Commission recommended
stronger requirements for LAs to address climate change in
its 2007 report
• Environmental Audit Committee called for compulsory
climate change targets in report published in 2008

National Indicator 186 – per capita emissions in local authority areas
• Measures all carbon emissions which a local authority and its partners can reasonably influence (does not include emissions from motorways, large industrial installations, etc.)
• Two-thirds of LAAs contain a target against this indicator
• Progress is measured from a 2005 baseline for the period 2005-10 (six calendar years inclusive)
• Emissions data compiled centrally by DECC
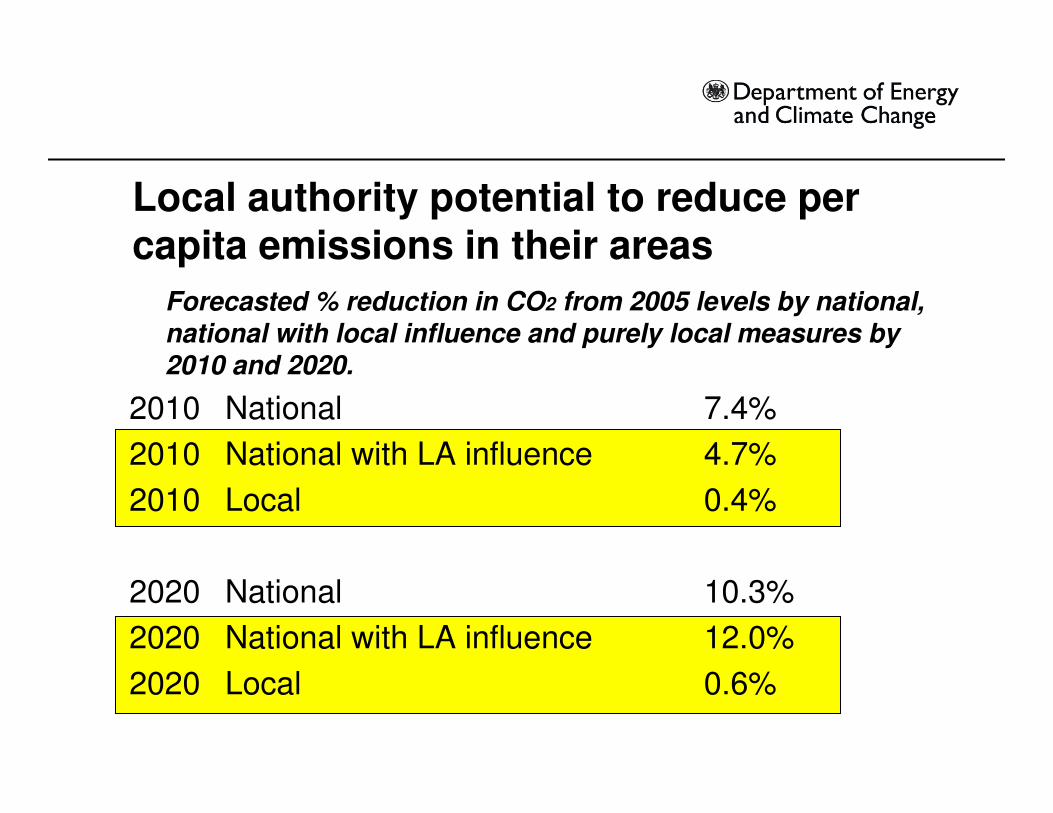
Forecasted % reduction in CO2 from 2005 levels by national, national with local influence and purely local measures by 2010 and 2020.
2010 National 7.4%
2010 National with LA influence 4.7%
2010 Local 0.4%
2020 National 10.3%
2020 National with LA influence 12.0%
2020 Local 0.6%
Local authority potential to reduce per capita emissions in their areas
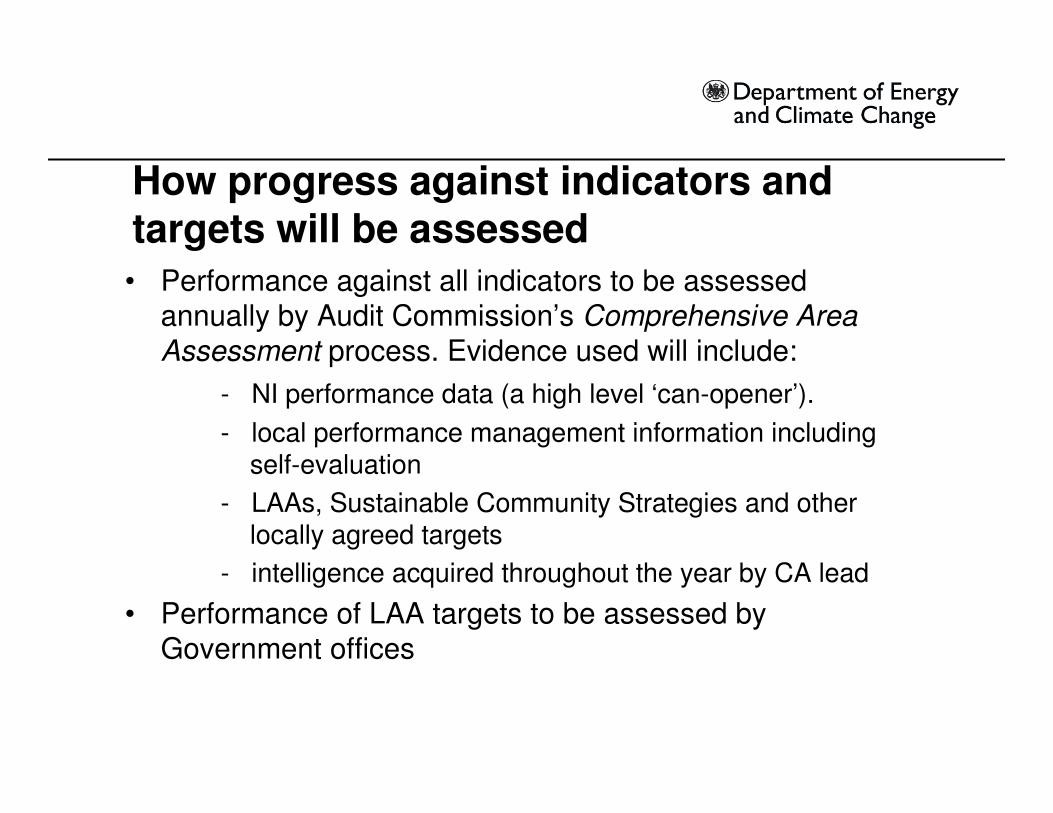
How progress against indicators and targets will be assessed
• Performance against all indicators to be assessed annually by Audit Commission’s Comprehensive Area
Assessment process. Evidence used will include:
- NI performance data (a high level ‘can-opener’).
- local performance management information including self-evaluation
- LAAs, Sustainable Community Strategies and other locally agreed targets
- intelligence acquired throughout the year by CA lead
• Performance of LAA targets to be assessed by
Government offices

What will good performance look like against NI 186 (per capita emissions)?
• Quantitative evidence that emissions are falling in local area is important but qualitative evidence of effective action by local authorities and partners is also key
• Evidence that a credible plan is in place to tackle emissions and that progress is being monitored and achieved
• Evidence of community engagement (working with LSP partners, for example)
• Target set in LAA is challenging and achievable

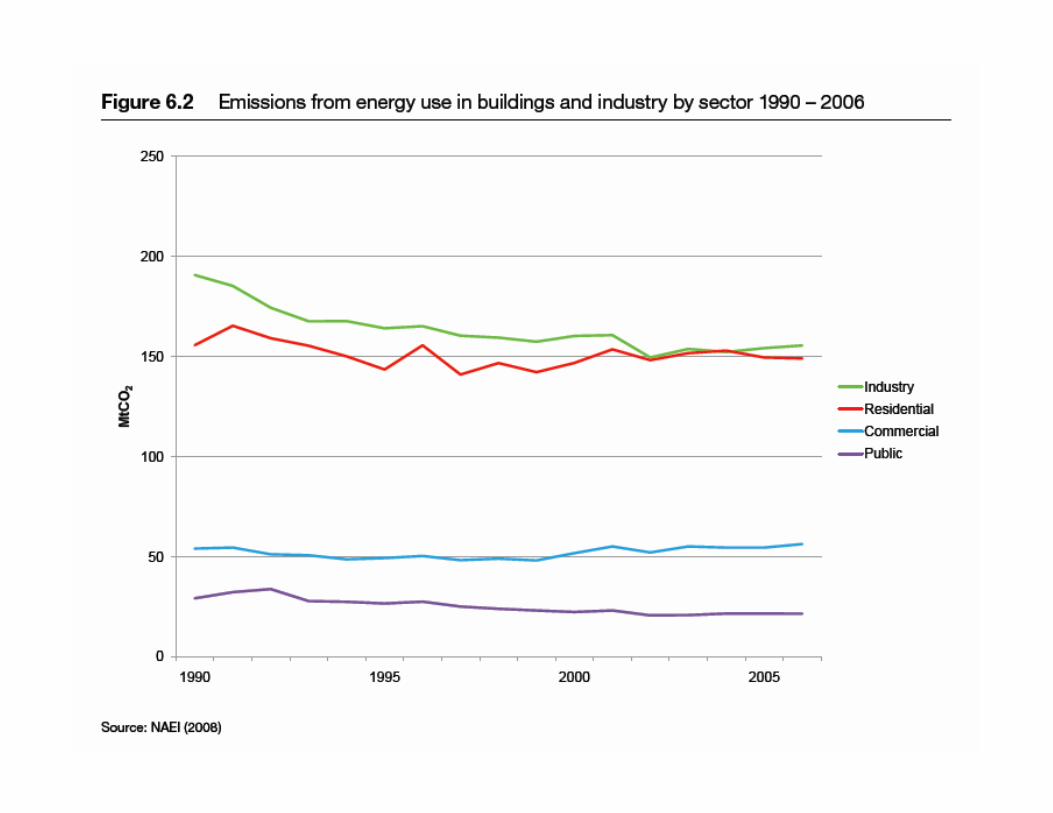
LA Area CO2 Indicator – what is included?
Industry
Agriculture
Domestic
Business & Public Sector
Transport
IncludedExcluded Motorways
+ end user emissions
Refineries
Power Stations
Gas ProductionSolid Fuel Production
Large Industrial Processes:
Chemical
Cement
Iron and Steel
EU-ETS


Climate Change and the CAA
Andy Walford
Service Head Environment
Audit Commission

Where is climate change important in the
assessment of areas and organisations?
• Climate change is a key factor in CAA because-
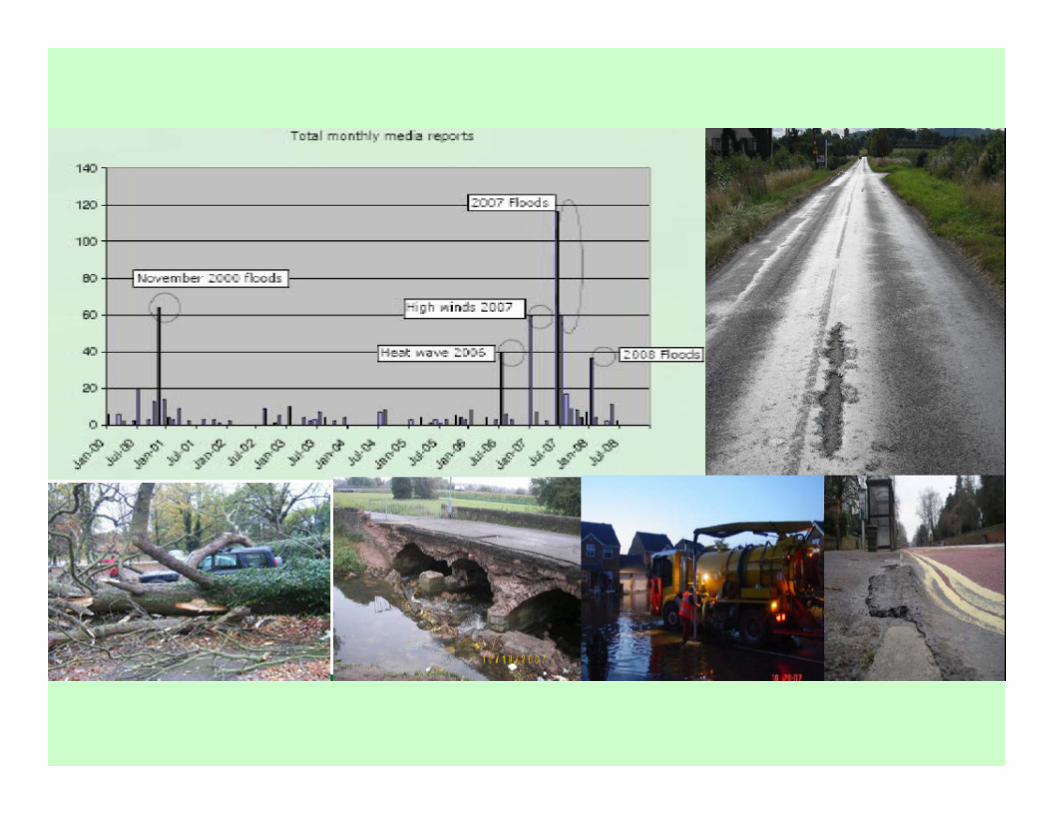
– We have to adapt to a changing climate now- some communities are increasing experiencing the consequences or more extreme weather, others will follow e.g. floods, snowfall, etc….
– And this affects both service delivery and wider outcomes
– Mitigating the environmental damage our society causes is of equal importance; e.g. CO2 emissions, waste, consumption of natural resources etc
In conclusion
• Understanding and responding to climate change is a
key part of the CAA
• It’s much more than just “what do the National Indicators
say?”
• We will want to understand outcomes for the area as
well as organisational performance


SESSION 2 QUESTIONS?
• How many Local Authorities & communities have an understanding of the DESTINATION & ROUTE MAP?
• Who should be deciding on what options are most appropriate? Central Govt. / Elected Members / Others……
• Is this much too complex for ‘lay-people’?

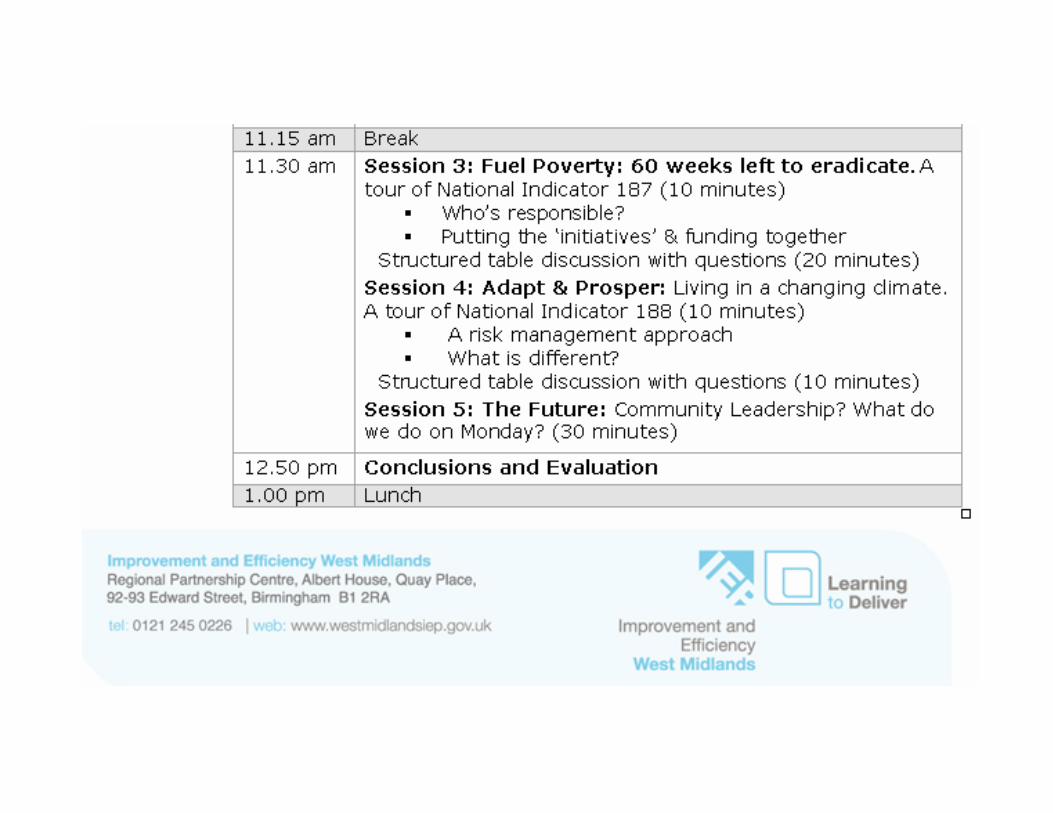
Session 3: Fuel Poverty
60 weeks left to eradicate <A tour of National Indicator 187>
Richard Davies
Director

Who’s signed up to NI187?
• Sandwell
• Walsall• Wolverhampton
• Worcestershire


2414118.4%6,650Wolverhampton South West
2312818.5%6,479Staffordshire Moorlands
2212418.5%7,237Stoke-on-Trent South
2111418.6%5,400Birmingham, Yardley
2010418.7%7,245Birmingham, Selly Oak
199118.9%7,736Burton
188818.9%7,862Coventry North East
178418.9%6,840West Bromwich West
168019.0%6,175West Bromwich East
157919.0%7,389North Shropshire
147619.0%6,280Wolverhampton North East
136619.2%6,250Ludlow
126519.2%6,862Walsall North
116419.2%7,316Leominster
105719.3%6,203Stoke-on-Trent North
95219.3%7,358Birmingham, Erdington
84119.5%6,447Walsall South
73619.7%5,957Birmingham, Hodge Hill
63419.7%5,538Wolverhampton South East
53119.8%7,396Birmingham, Perry Barr
42719.9%6,871Stoke-on-Trent Central
32620.0%6,225Warley
2621.4%8,451Birmingham, Ladywood
1222.0%8,559
Birmingham, Sparkbrook and Small Heath
Ranking out of West Midlands
constituencies (1 = highest proportion
in fuel poverty)
Ranking out of 529 English
constituencies (1 = highest
proportion in fuel poverty)
Percentage of
households who are
living in fuel poverty
Number of fuel
poor households
Constituency
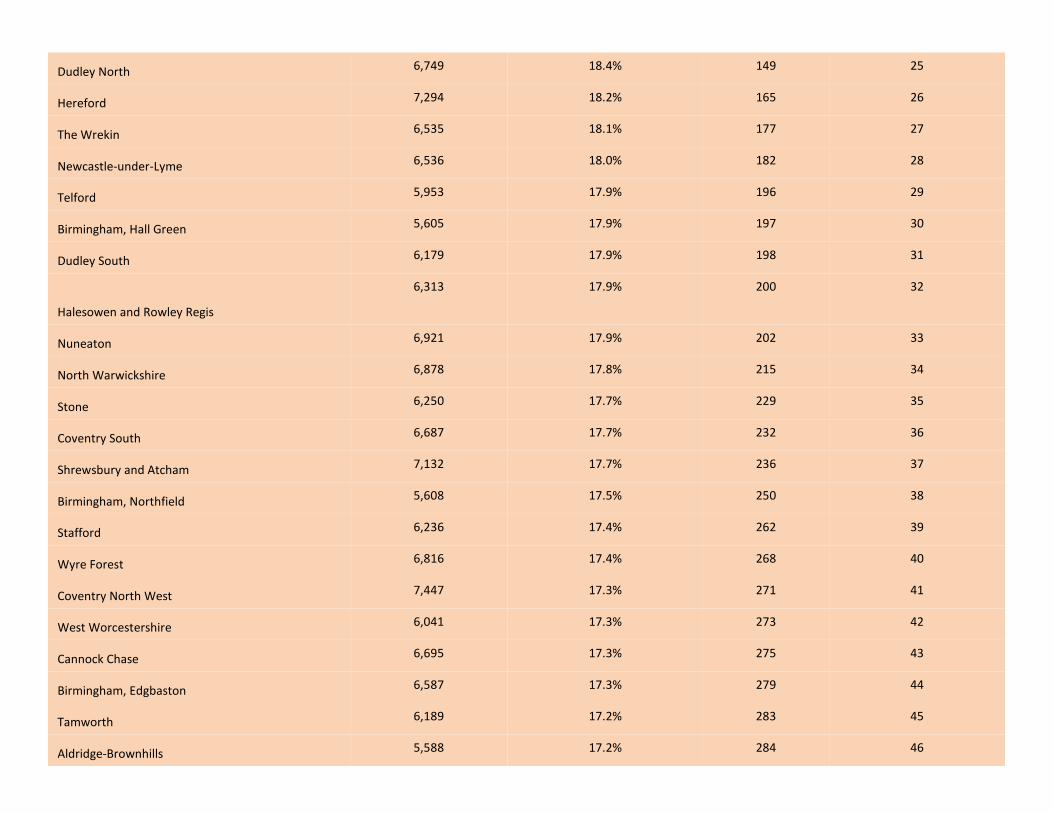
4628417.2%5,588Aldridge-Brownhills
4528317.2%6,189Tamworth
4427917.3%6,587Birmingham, Edgbaston
4327517.3%6,695Cannock Chase
4227317.3%6,041West Worcestershire
4127117.3%7,447Coventry North West
4026817.4%6,816Wyre Forest
3926217.4%6,236Stafford
3825017.5%5,608Birmingham, Northfield
3723617.7%7,132Shrewsbury and Atcham
3623217.7%6,687Coventry South
3522917.7%6,250Stone
3421517.8%6,878North Warwickshire
3320217.9%6,921Nuneaton
3220017.9%6,313
Halesowen and Rowley Regis
3119817.9%6,179Dudley South
3019717.9%5,605Birmingham, Hall Green
2919617.9%5,953Telford
2818218.0%6,536Newcastle-under-Lyme
2717718.1%6,535The Wrekin
2616518.2%7,294Hereford
2514918.4%6,749Dudley North


Session 3 Questions?
• How can we reduce FUEL POVERTY?
• What is the role of an ambitious Local
Authority?
• Who in the region is accountable for
FUEL POVERTY?
• How could we better spend the
existing resources?

Session 4: Adapt & Prosper
Living in a changing climate<A tour of National Indicator 188>
Richard Davies
Director

Who’s signed up to NI188?
• Solihull
• Walsall• Warwickshire
• Worcestershire


NI 188 = Planning to Adapt to
Climate Change
• To ensure LA preparedness to manage risks to service delivery, the public, local communities, local infrastructure, businesses and the natural environment from a changing climate, and to make the most of new opportunities
• The indicator measures progress on assessing and managing climate risks and opportunities, and incorporating appropriate action into local authority and partners’ strategic planning


Session 4 Questions?
• What sort of interventions can a Local Authority make to reduce CLIMATE CHANGE impacts?
• Is this a KNOWLEDGE & CAPABILITY issue within Local Authorities?
• Do the public understand this issue?
• Should we focus on RESILIENCE to prepare for all of the energy and climate challenges?

Session 5: The Future <Community Leadership?
What do we do on Monday?>
Richard Davies
Director


Join the campaign
A campaign to
reduce carbon
dioxide emissions
by 10% in 2010.

Sheffield City Council South Tyneside Council Taunton Deane Borough Council Saffron Walden Town Council Kirklees Council Kirkburn Parish Council Knowsley Metropolitan Borough Council Rochdale Metropolitan Borough Council South Tyneside Council Derby City Council Whittington Hospital NHS Trust North Norfolk District Council London Borough of Brent Environment Agency Birmingham Women's NHS Foundation Trust South Essex Partnership Seed Society Little Wenlock CRed Whitby Town Council Swanley Town Council Whitchurch Association NHS Norfolk Milton Keynes Council London Borough of Waltham Forest University College London London Borough of Waltham Forest Bristol City Council London Borough of Sutton Liberal Democrat Group on North Yorkshire County Council NHS Stockport Tameside MBC Manchester City Council City of York Council London Borough of Sutton Exeter City Council Countryside Council for Wales Epsom & Ewell Borough Council NHS North Somerset Department for International Development NHS West Sussex Newcastle City Council Football Foundation Caddington Surgery Sutton Liberal Democrat Group Harrow Agenda 21 Environmental Forum NHS Central Lancashire………

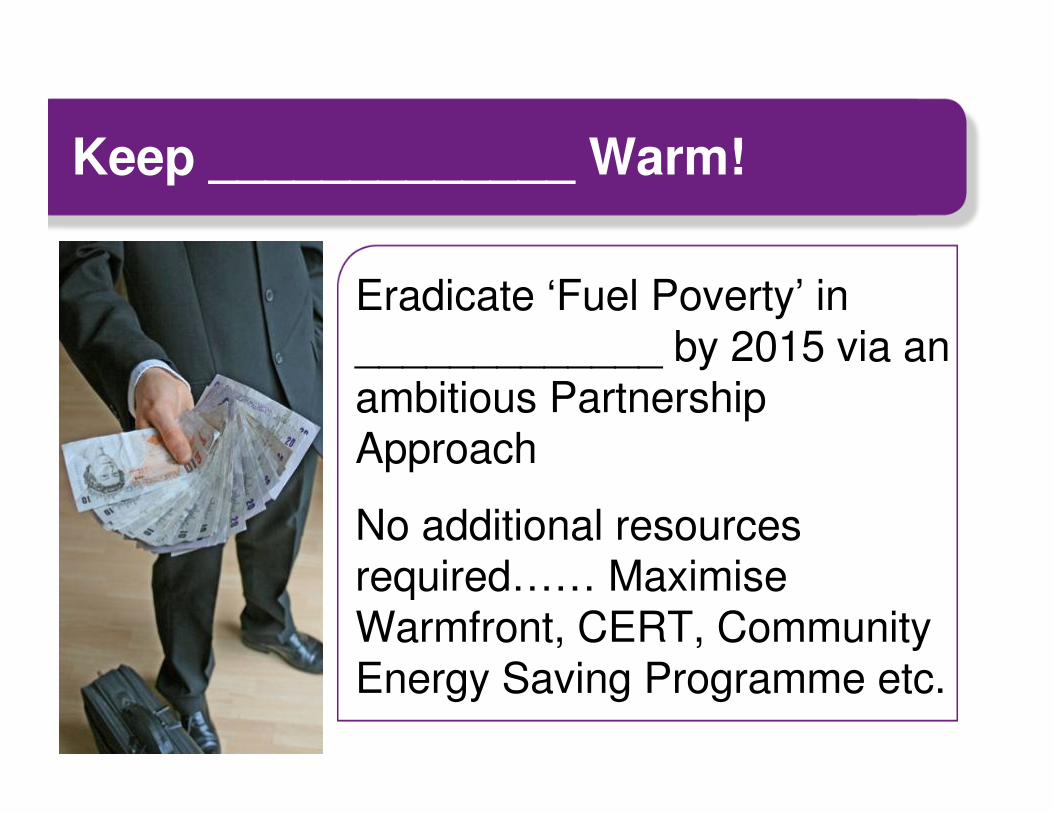
Keep _____________ Warm!
Eradicate ‘Fuel Poverty’ in _____________ by 2015 via an ambitious Partnership Approach
No additional resources required…… Maximise Warmfront, CERT, Community Energy Saving Programme etc.


Low Carbon Community: _________
Launch | _______ Low Carbon Community Network |
VISION: Support, training, connections, inspiration & networking for the ‘bottom up’BRILLIANT organisations & initiatives springing up all over ___________

Microgeneration ___________
Maximise the economic opportunities to _________ of being the MICROGENERATION LOCALITY. Solar thermal, photovoltaics, biomass, heat pumps etc. Manufacturers, installers, retailers, maintenance……


New Development / Growth Point: Zero CO2
Adopt Code for Sustainble Homes ‘Code Level 6’ for all ‘Growth Point’ / new development. This will ‘pre-condition’ _______ developers and builders to be ready for the ‘carbon neutral’ new build & refurbishment revolution.


Low Carbon Travel
All LSP Partners have
‘gold standard’
TRAVEL PLANS
dealing with 1.
Commute 2. Business
Miles & 3. Access to
Services – NIL COST


Big Renewables | AnyPlace?
The UK must deliver 15% of ALL ENERGY from renewables by 2020. This will create up to ½ million new jobs. What, where & how many in AnyPlace?


Biogas | AnyPlace
AnyPlace celebrates
with the UK’s first Biogas Grid. Food &
farm waste creates high
quality methane for
homes & businesses


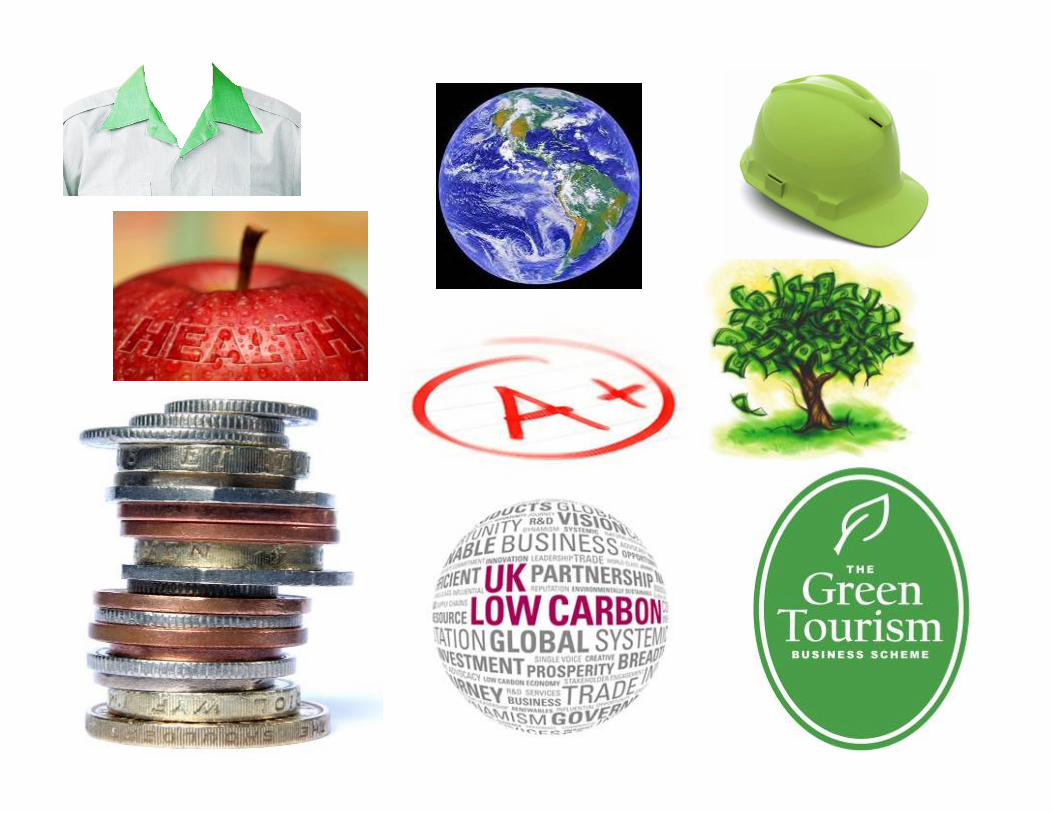
Green Collar Jobs……
PRESS RELEASE 2017 AnyPlace is the UK’s leading locality for Low Carbon Business start ups. (The UK already has 880,000 people working in the Low Carbon Economy in 2009)


Environmental auditor, recycling artisan, waste management officer, ecologist, solar energy consultant, water quality scientist, energy manager, renewable energy administrator, eco journalist, carbon trading accountant, microgeneration buyer, solar panel installer, wind turbine maintenance engineer, bioethanol production supervisor, hydro technology specialist, environmental manager, micro grid electricity network installer,low energy lighting salesperson, sustainable forest manager, climate change adaptation specialist, green charcoal manufacturer, biofuels researcher, energy farmer, photovoltaic inverter retailer, climate change charity officer, sustainable energy fundraiser, green architect, eco constructor, environmental engineer, rural sustainable development planner, eco product designer, environmental education officer, biodieselproduction manager, bioenergy engineer, sustainable investment adviser, eco-tourism manager, fuel cell technician, climate risk broker, environmental health practitioner, electricbicycle technician, renewable energy legal executive, bioenergy economist, renewable energy resource mapper, biofuels research scientist, ground source cooling technologist, biomass briquette manufacturer…….


The Great _________ Refurb
In February 2009 Ed Milliband announced that by 2050 all British homes will be near carbon zero. Is now the right time for __________ to step forward & seek to be the first place in the UK to deliver this in existing homes?


You Choose!


Celebrate……

“Make no little plans. They have no magic to stir men's blood... Make big plans; aim high in hope and work.”Daniel Hudson Burnham 1846-1912
“Search all the parks in all your cities; you'll find no statues of committees.”David Ogilvy 1911-1999

“What we think, or what we
know, or what we believe is, in
the end, of little
consequence. The only
consequence is what we do.”
John Ruskin

"Until one is committed, there is hesitancy, the chance
to draw back. Concerning all acts of initiative (and
creation), there is one elementary truth that ignorance
of which kills countless ideas and splendid plans: that
the moment one definitely commits oneself, then
Providence moves too. All sorts of things occur to help
one that would never otherwise have occurred. A
whole stream of events issues from the decision,
raising in one's favour all manner of unforeseen
incidents and meetings and material assistance, which
no man could have dreamed would have come his
way. Whatever you can do, or dream you can do,
begin it. Boldness has genius, power, and magic in it.
Begin it now." W.H. Murray

www.slideshare.net/mea

thank you