mechanism of warming the okhotsk sea intermediate water...
TRANSCRIPT
Mechanism of warming the Okhotsk Sea Intermediate Water, from consideration on seasonal cycle
Fisheries Oceanography Research Studio “Oyashio-Ya”
Makoto Kashiwai
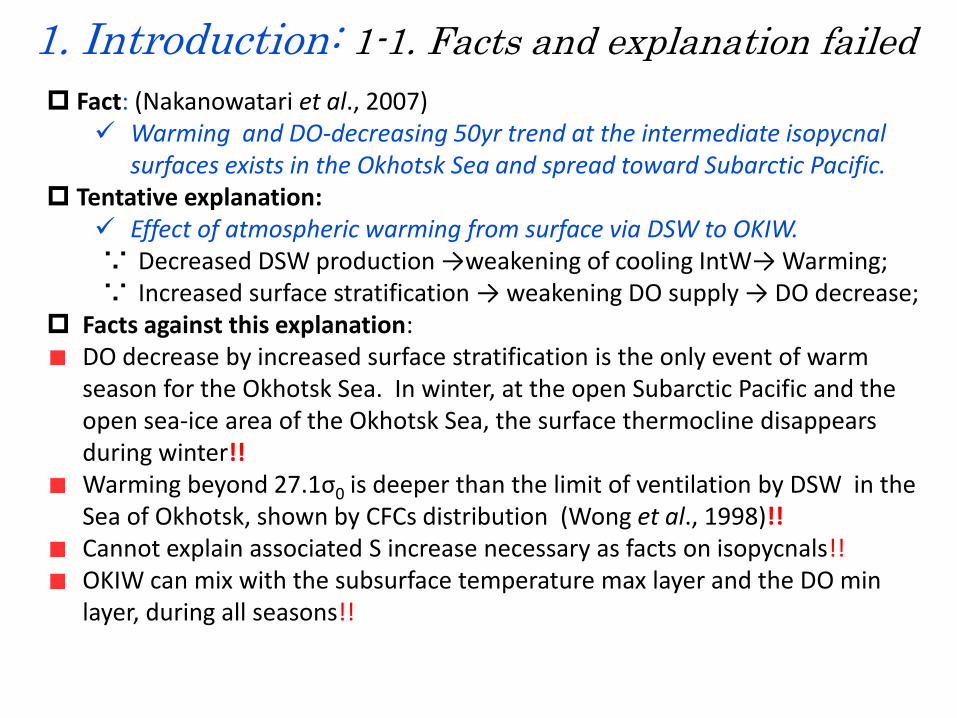
1. Introduction: 1-1. Facts and explanation failed
Fact: (Nakanowatari et al., 2007) Warming and DO-decreasing 50yr trend at the intermediate isopycnal
surfaces exists in the Okhotsk Sea and spread toward Subarctic Pacific. Tentative explanation:
Effect of atmospheric warming from surface via DSW to OKIW. ∵ Decreased DSW production →weakening of cooling IntW→ Warming; ∵ Increased surface stratification → weakening DO supply → DO decrease;
Facts against this explanation: DO decrease by increased surface stratification is the only event of warm season for the Okhotsk Sea. In winter, at the open Subarctic Pacific and the open sea-ice area of the Okhotsk Sea, the surface thermocline disappears during winter!! Warming beyond 27.1σ0 is deeper than the limit of ventilation by DSW in the Sea of Okhotsk, shown by CFCs distribution (Wong et al., 1998)!! Cannot explain associated S increase necessary as facts on isopycnals!! OKIW can mix with the subsurface temperature max layer and the DO min layer, during all seasons!!
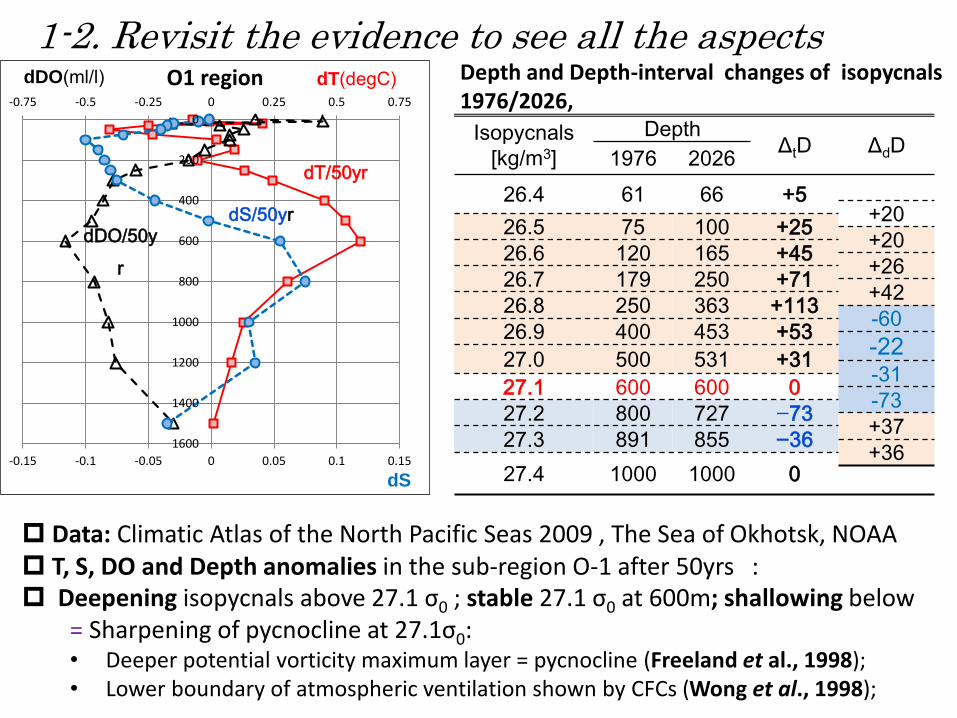
1-2. Revisit the evidence to see all the aspects
dT/50yr
dDO/50y
r
dS/50yr
-0.15 -0.1 -0.05 0 0.05 0.1 0.15
0
200
400
600
800
1000
1200
1400
1600
-0.75 -0.5 -0.25 0 0.25 0.5 0.75
dS
dT(degC) O1 region dDO(ml/l)
Data: Climatic Atlas of the North Pacific Seas 2009 , The Sea of Okhotsk, NOAA T, S, DO and Depth anomalies in the sub-region O-1 after 50yrs : Deepening isopycnals above 27.1 σ0 ; stable 27.1 σ0 at 600m; shallowing below
= Sharpening of pycnocline at 27.1σ0: • Deeper potential vorticity maximum layer = pycnocline (Freeland et al., 1998); • Lower boundary of atmospheric ventilation shown by CFCs (Wong et al., 1998);
Isopycnals
[kg/m3]
Depth ΔtD ΔdD
1976 2026
26.4 61 66 +5 +20
26.5 75 100 +25 +20
26.6 120 165 +45 +26
26.7 179 250 +71 +42
26.8 250 363 +113 -60
26.9 400 453 +53 -22
27.0 500 531 +31 -31
27.1 600 600 0 -73
27.2 800 727 −73 +37
27.3 891 855 −36 +36
27.4 1000 1000 0
Depth and Depth-interval changes of isopycnals 1976/2026,
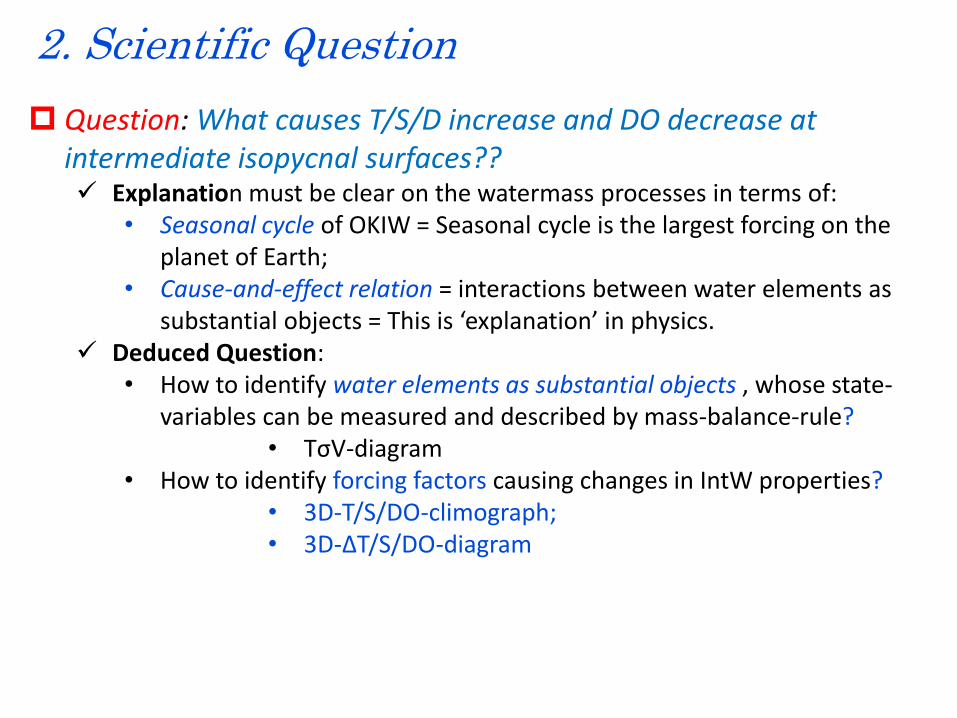
2. Scientific Question
Question: What causes T/S/D increase and DO decrease at intermediate isopycnal surfaces?? Explanation must be clear on the watermass processes in terms of:
• Seasonal cycle of OKIW = Seasonal cycle is the largest forcing on the planet of Earth;
• Cause-and-effect relation = interactions between water elements as substantial objects = This is ‘explanation’ in physics.
Deduced Question: • How to identify water elements as substantial objects , whose state-
variables can be measured and described by mass-balance-rule? • TσV-diagram
• How to identify forcing factors causing changes in IntW properties? • 3D-T/S/DO-climograph; • 3D-ΔT/S/DO-diagram
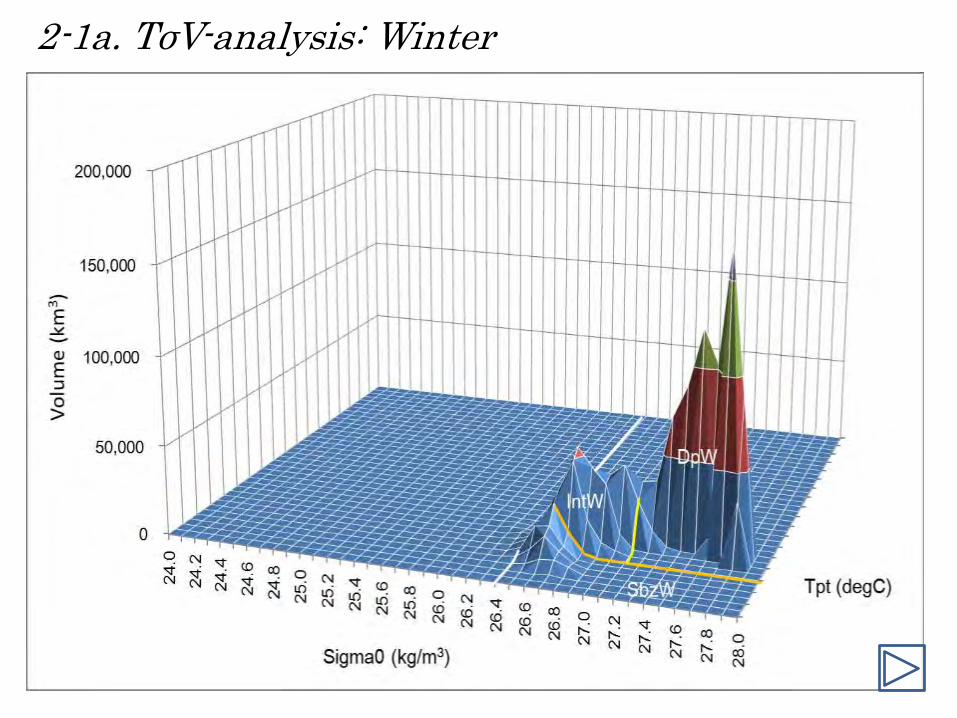
2-1a. TσV-analysis: Winter
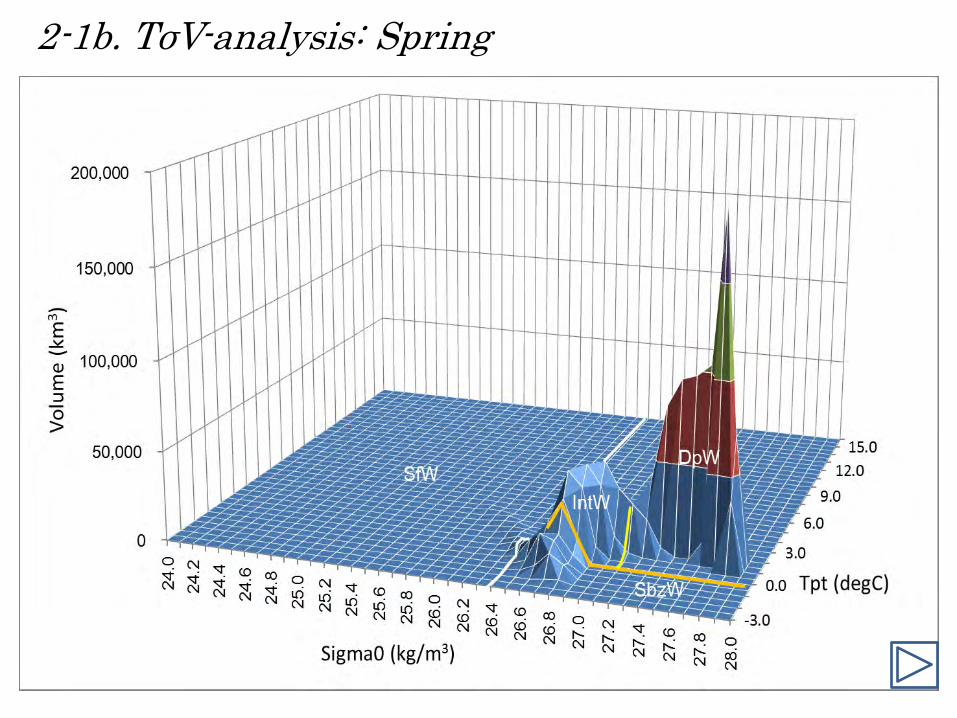
2-1b. TσV-analysis: Spring
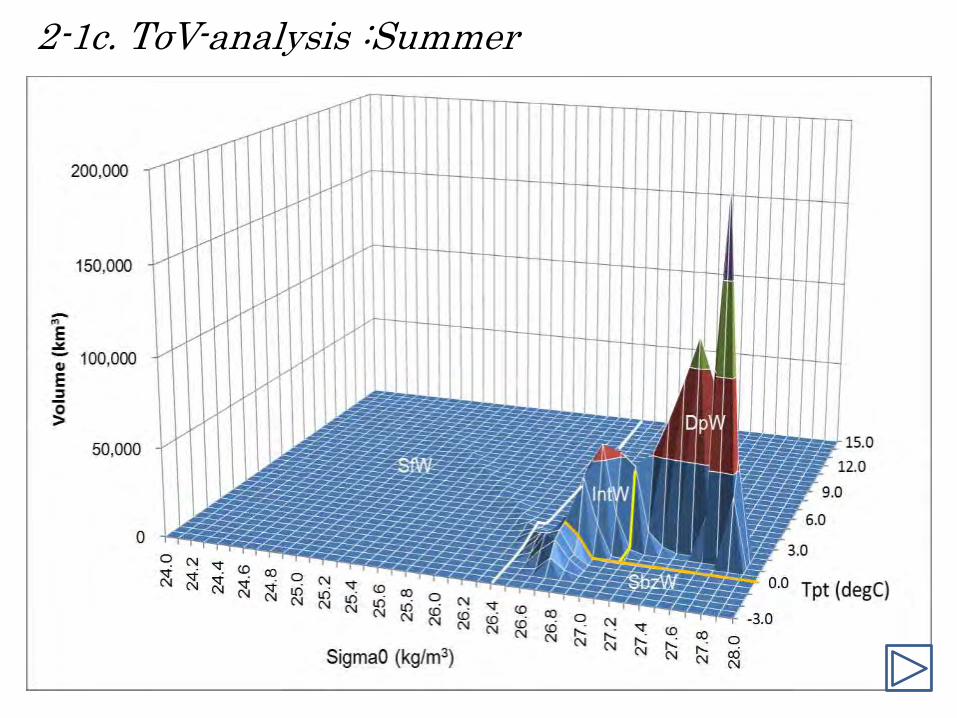
2-1c. TσV-analysis :Summer
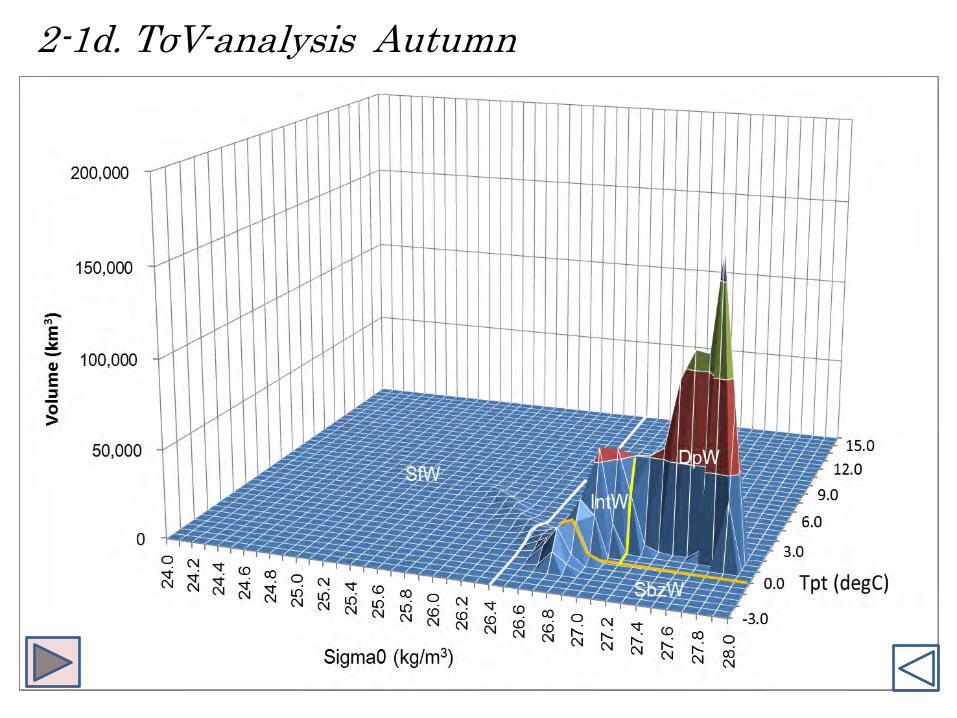
2-1d. TσV-analysis Autumn
2-2. Element Waters Identified by TσV-diagram
Element Water Symbol σ0 Range (kg/m3)
Tpt Range (degC)
Surface Water SfW < 26.4
Subzero Water SbzW 26.4 ≤ ≤ 0
Intermediate Water IntW 26.4 – 27.0
Deep Water DpW 27.1 ≤
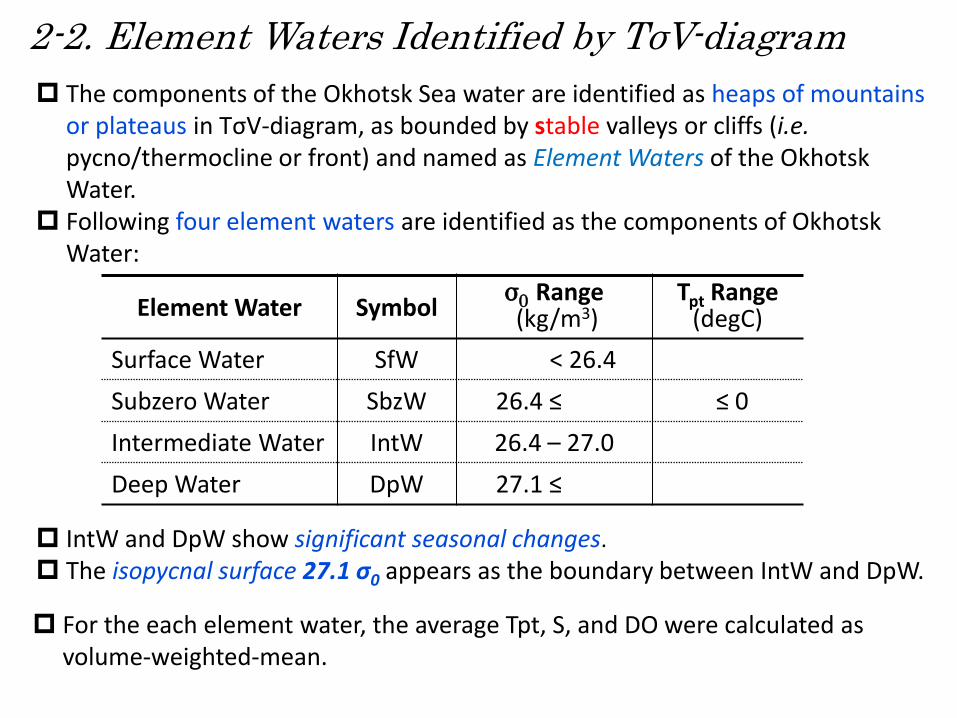
The components of the Okhotsk Sea water are identified as heaps of mountains or plateaus in TσV-diagram, as bounded by stable valleys or cliffs (i.e. pycno/thermocline or front) and named as Element Waters of the Okhotsk Water.
Following four element waters are identified as the components of Okhotsk Water:
For the each element water, the average Tpt, S, and DO were calculated as volume-weighted-mean.
IntW and DpW show significant seasonal changes.
The isopycnal surface 27.1 σ0 appears as the boundary between IntW and DpW.
3. Seasonal Cycle of IntW: 3-1. 3D-Climograph
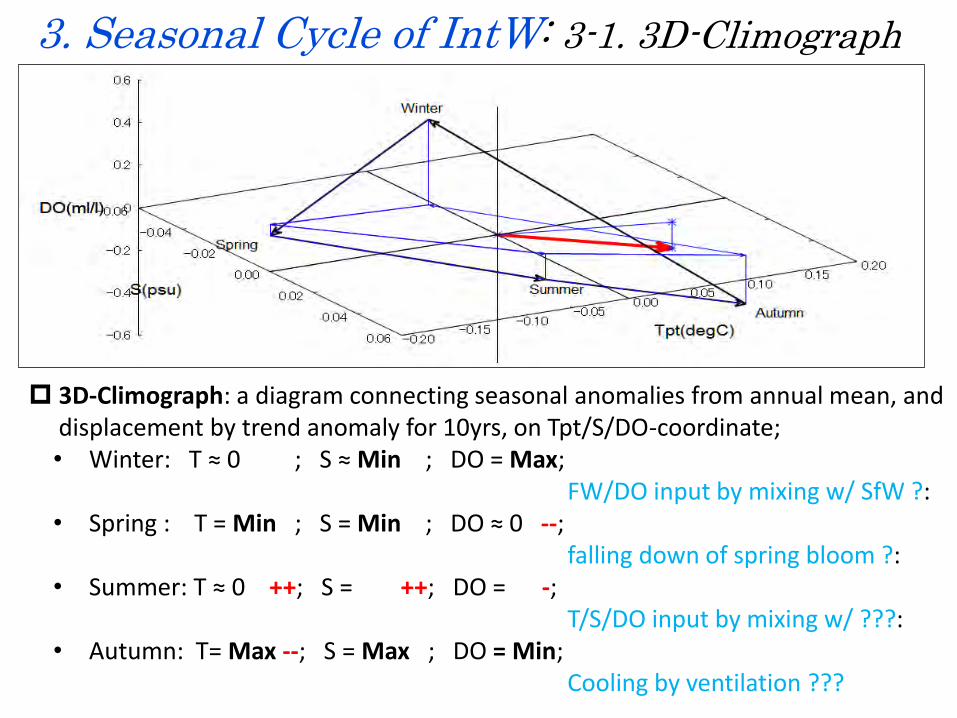
3D-Climograph: a diagram connecting seasonal anomalies from annual mean, and displacement by trend anomaly for 10yrs, on Tpt/S/DO-coordinate; • Winter: T ≈ 0 ; S ≈ Min ; DO = Max; FW/DO input by mixing w/ SfW ?: • Spring : T = Min ; S = Min ; DO ≈ 0 --; falling down of spring bloom ?: • Summer: T ≈ 0 ++; S = ++; DO = -; T/S/DO input by mixing w/ ???: • Autumn: T= Max --; S = Max ; DO = Min; Cooling by ventilation ???
3-2. ΔT/S/DO-diagram a. Winter
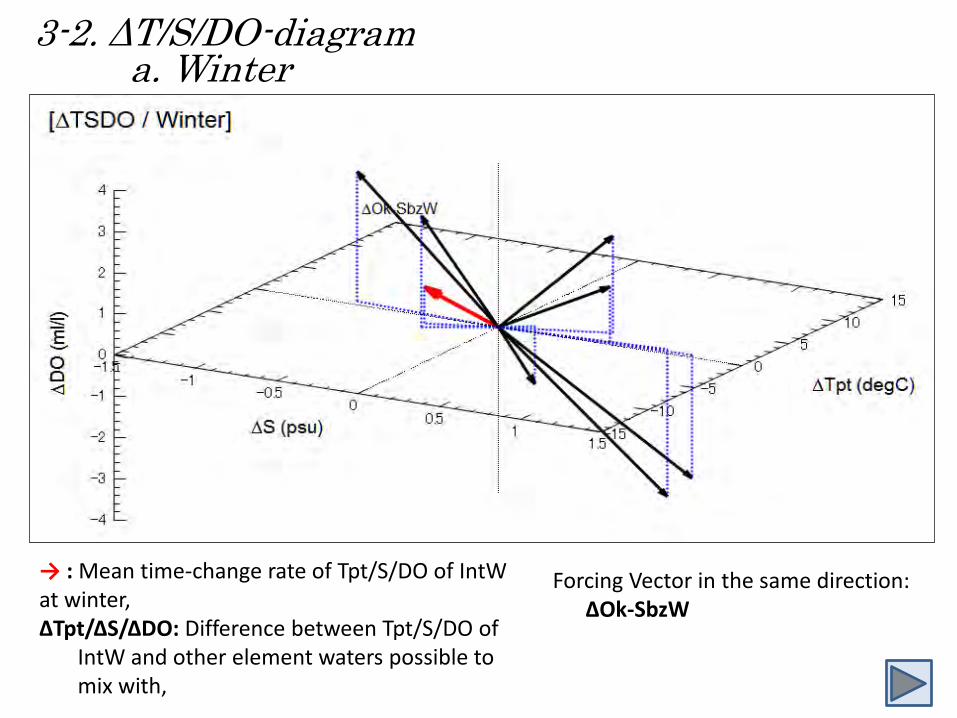
Forcing Vector in the same direction: ΔOk-SbzW
→ : Mean time-change rate of Tpt/S/DO of IntW at winter, ΔTpt/ΔS/ΔDO: Difference between Tpt/S/DO of IntW and other element waters possible to mix with,
3-2. ΔT/S/DO-diagram b. Spring
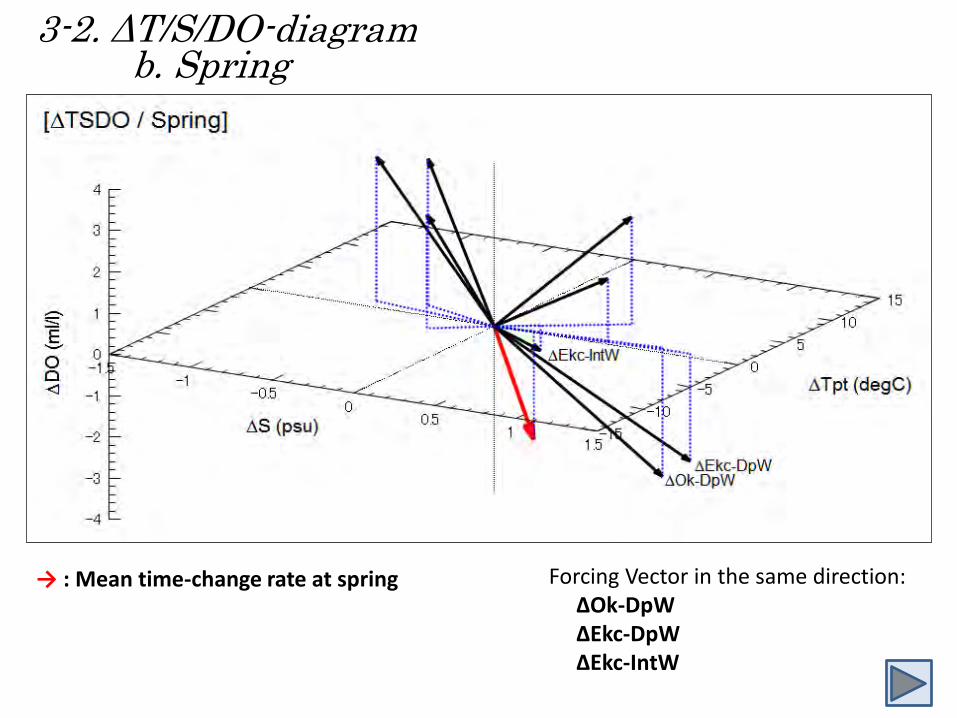
Forcing Vector in the same direction: ΔOk-DpW ΔEkc-DpW ΔEkc-IntW
→ : Mean time-change rate at spring
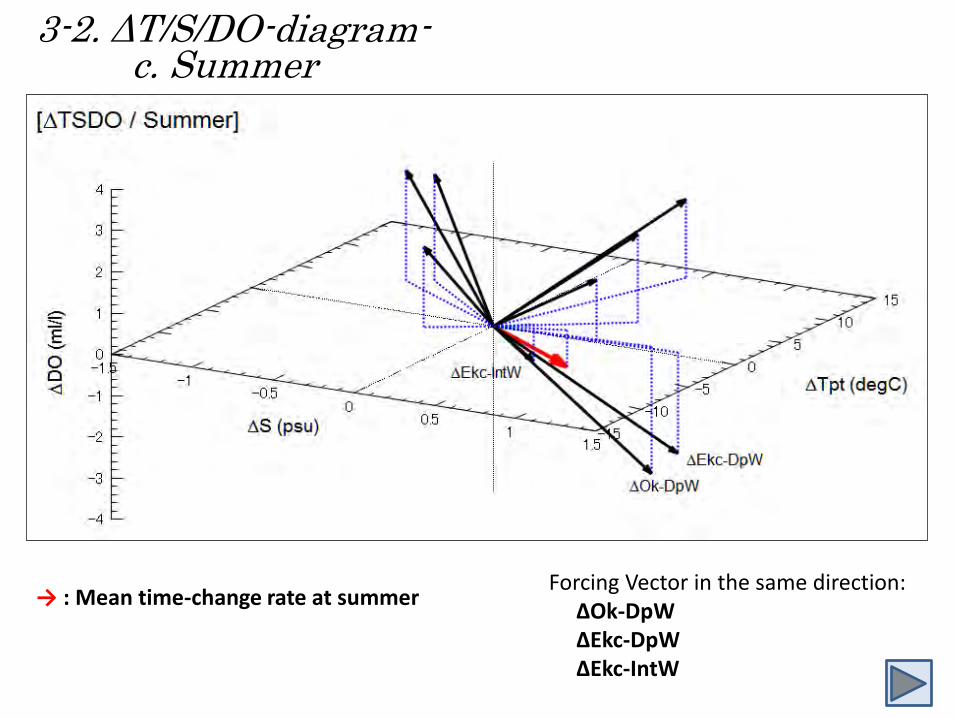
3-2. ΔT/S/DO-diagram- c. Summer
Forcing Vector in the same direction: ΔOk-DpW ΔEkc-DpW ΔEkc-IntW
→ : Mean time-change rate at summer
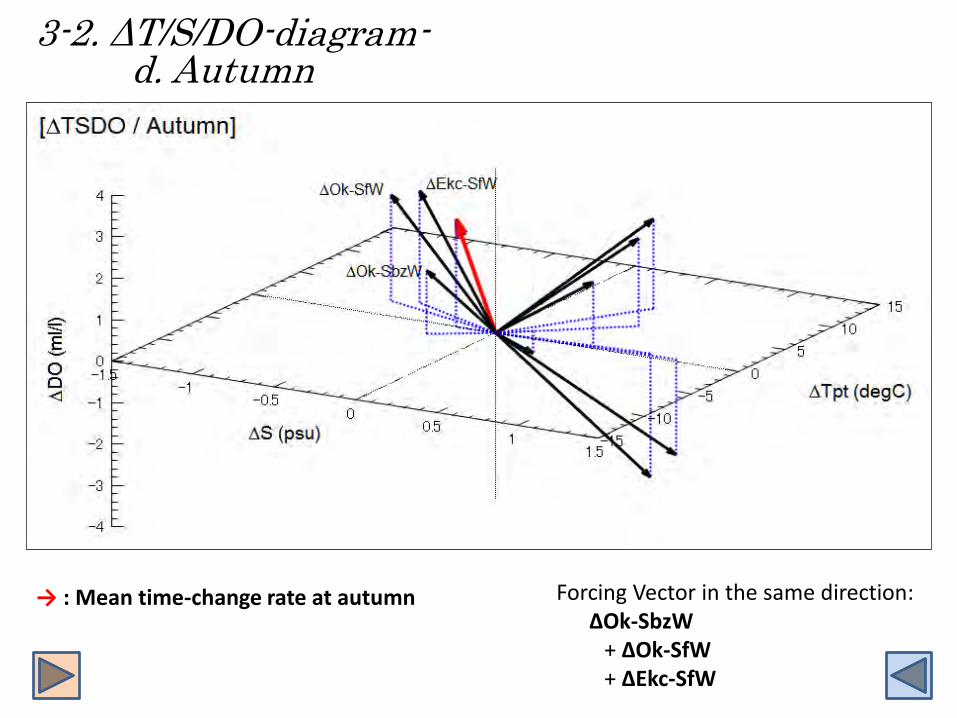
3-2. ΔT/S/DO-diagram- d. Autumn
Forcing Vector in the same direction: ΔOk-SbzW
+ ΔOk-SfW + ΔEkc-SfW
→ : Mean time-change rate at autumn
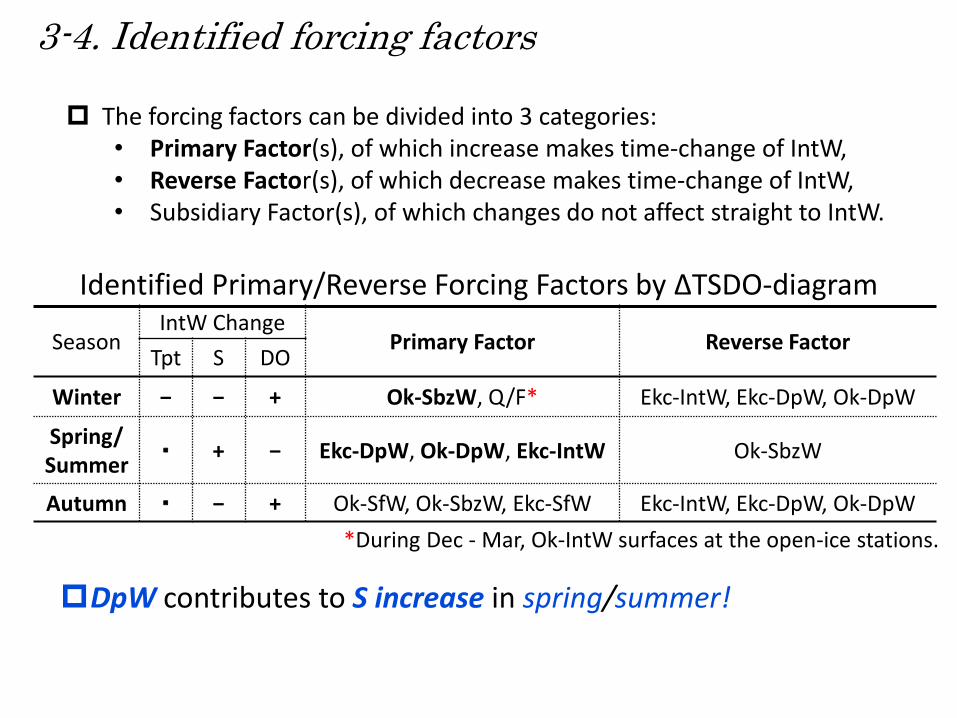
3-4. Identified forcing factors
Season IntW Change
Primary Factor Reverse Factor Tpt S DO
Winter − − + Ok-SbzW, Q/F* Ekc-IntW, Ekc-DpW, Ok-DpW
Spring/ Summer
・ + − Ekc-DpW, Ok-DpW, Ekc-IntW Ok-SbzW
Autumn ・ − + Ok-SfW, Ok-SbzW, Ekc-SfW Ekc-IntW, Ekc-DpW, Ok-DpW
The forcing factors can be divided into 3 categories: • Primary Factor(s), of which increase makes time-change of IntW, • Reverse Factor(s), of which decrease makes time-change of IntW, • Subsidiary Factor(s), of which changes do not affect straight to IntW.
Identified Primary/Reverse Forcing Factors by ΔTSDO-diagram
DpW contributes to S increase in spring/summer!
*During Dec - Mar, Ok-IntW surfaces at the open-ice stations.
4 Consideration on long-term warming: 4-1. Seasonal cycle to Climate Change
Volume of IntW indicates seasonal changes alternating between DpW: no show for economy of time
Seasonal change in depth of the boundary between (IntW/DpW) : → Response of isopycnal surface to spin-up/down of WSAG;
→ Response to seasonal change in strength of Siberian Monsoon;
Enhanced atmospheric circulation can enhance the trend today: • Winter monsoon → Spin-up/down of WSAG;
• Along-shore wind → Coastal upwelling;
• Westerly wind → enhanced upper-layer effluent and lower-layer influent → enhanced contribution of DpW to IntW.
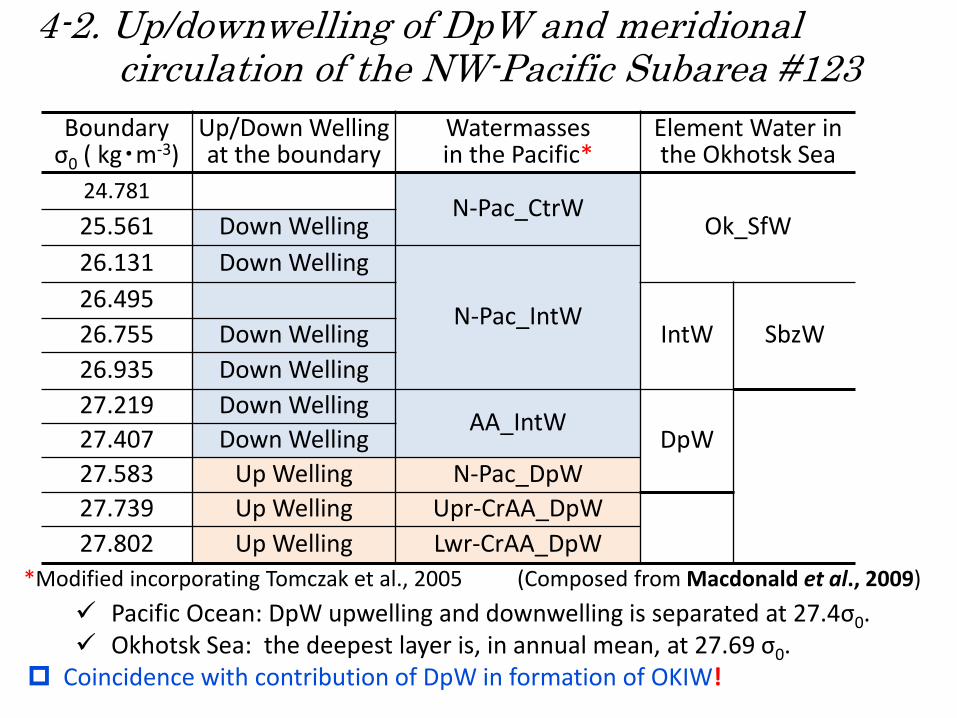
4-2. Up/downwelling of DpW and meridional circulation of the NW-Pacific Subarea #123
Boundary σ0 ( kg・m-3)
Up/Down Welling at the boundary
Watermasses in the Pacific*
Element Water in the Okhotsk Sea
24.781 N-Pac_CtrW
Ok_SfW 25.561 Down Welling
26.131 Down Welling
N-Pac_IntW 26.495
IntW SbzW 26.755 Down Welling
26.935 Down Welling
27.219 Down Welling AA_IntW
DpW 27.407 Down Welling
27.583 Up Welling N-Pac_DpW
27.739 Up Welling Upr-CrAA_DpW
27.802 Up Welling Lwr-CrAA_DpW
*Modified incorporating Tomczak et al., 2005 (Composed from Macdonald et al., 2009)
Pacific Ocean: DpW upwelling and downwelling is separated at 27.4σ0. Okhotsk Sea: the deepest layer is, in annual mean, at 27.69 σ0.
Coincidence with contribution of DpW in formation of OKIW!
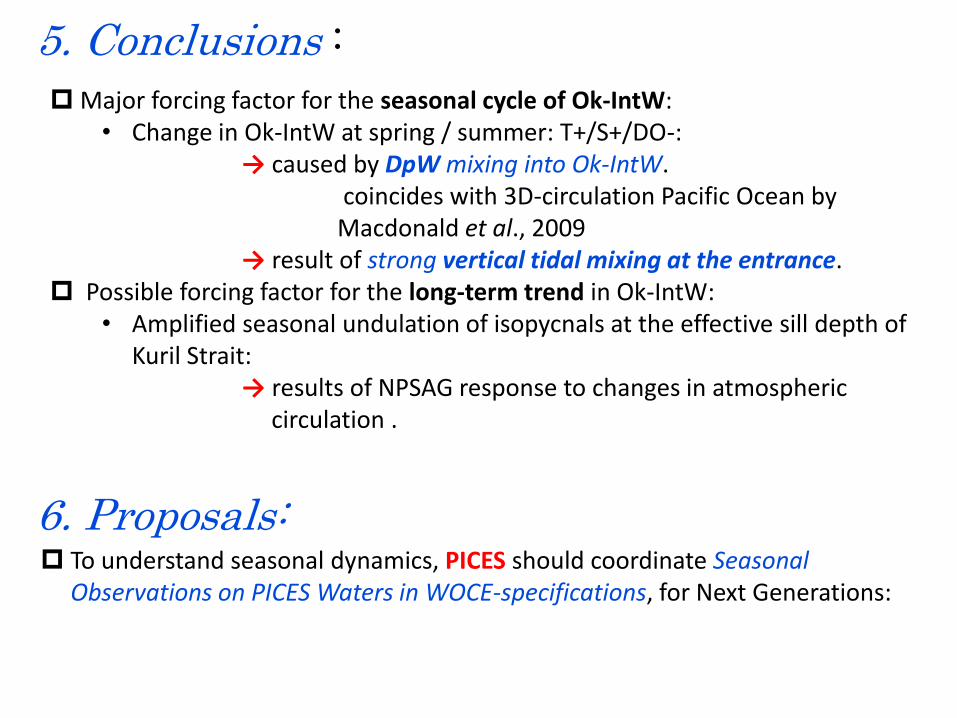
Major forcing factor for the seasonal cycle of Ok-IntW: • Change in Ok-IntW at spring / summer: T+/S+/DO-: → caused by DpW mixing into Ok-IntW. coincides with 3D-circulation Pacific Ocean by Macdonald et al., 2009 → result of strong vertical tidal mixing at the entrance.
Possible forcing factor for the long-term trend in Ok-IntW: • Amplified seasonal undulation of isopycnals at the effective sill depth of
Kuril Strait: → results of NPSAG response to changes in atmospheric circulation .
5. Conclusions :
6. Proposals: To understand seasonal dynamics, PICES should coordinate Seasonal
Observations on PICES Waters in WOCE-specifications, for Next Generations: