mechanical extraction of shea butter: optimisation and...
TRANSCRIPT
Songklanakarin J. Sci. Technol.
41 (4), 879-886, Jul. – Aug. 2019
Original Article
Mechanical extraction of shea butter: Optimisation and characterisation
studies with comparison to other methods of extraction
Elijah Olawale Ajala1, Folorunso Aberuagba2, Adesoji Matthew Olaniyan3,
Mary Adejoke Ajala1, and Oyetunji Babatunde Okedere4
1 Department of Chemical Engineering, Faculty of Engineering and Technology,
University of Ilorin, Ilorin, Nigeria
2 Department of Chemical Engineering, School of Engineering and Engineering Technology,
Federal University of Technology, Minna, Nigeria
3 Department of Agricultural and Bio-Resources Engineering, Faculty of Engineering,
Federal University Oye-Ekiti, Oye-Ekiti, Nigeria
4 Faculty of Engineering and Environmental Sciences,
Osun State University, Osogbo, Nigeria
Received: 8 May 2017; Revised: 21 March 2018; Accepted: 20 April 2018
Abstract Shea butter (SB) production by mechanical extraction (ME) was optimised by box-behnken (BB) experimental design
of response surface methodology (RSM). The process parameters studied (with their ranges) were sample weight (100 – 200 g),
temperature (60 – 120oC) and duration of applied pressure (10 – 30 min) to optimise the yield of SB. The characteristics of the
SB were determined using standard methods and Fourier transform infrared spectroscopy (FTIR). A comparative study of the SB
from ME with other methods of extraction was also performed. The optimum 37% (w/w) yield of SB was obtained from 150 g
sample of shea kernel at 90oC and 20 min. The R2 (0.9957) obtained from analysis of variance showed that quadratic model of
BB fitted the experimental data well. The characteristics of the SB from ME showed non-compromising quality, with a yield
greater than that of traditional method but lower than with solvent method. This study showed that the extraction methods affect
both yield and quality of SB.
Keywords: shea butter, mechanical extraction, box-behnken, FTIR
1. Introduction
Extraction of vegetable oils is nowadays done by
chemical method using solvents such as n-hexane. This gives
a high yield of vegetable oil with short processing time
and low energy consumption. However, due to negative
environmental impacts and potential health risks from using a
solvent in the extraction of vegetable oil, particularly in
industrial scale, the method is regarded hazardous
(Alenyorega, Hussein, & Adon go, 2015). Ikya, Umenger, and
Iorbee (2013) further substan-tiate this claim, when a solvent
was used to extract SB with the relatively high 47.5% yield,
but with compromised charac-teristics appearance, texture,
odour, and general acceptability.
*Corresponding author
Email address: [email protected]
880 E. O. Ajala et al. / Songklanakarin J. Sci. Technol. 41 (4), 879-886, 2019
Hence, an alternative method of extraction is needed to obtain
both high yield of vegetable oil and the required quality for
human consumption and other uses.
One of the available alternative methods is mecha-
nical extraction (ME), which is the most popular globally; it is
safe and simple to use. The vegetable oil from ME has been
reported to be chemical free and rich in protein. This makes
ME advantageous over the more efficient solvent extraction.
However, the ME is relatively inefficient, leaving about 8 to
14% of the available oil in the cake (Singh & Bargale, 2000).
Several efforts have been made by different researchers to
improve the efficiency of ME by optimising the process
parameters such as applied pressure, pressing temperature,
and moisture content of the kernels. For instance, Olaniyan
and Oje (2007a) studied the use of ME to extract SB with a 43
factorial experimental design and obtained a maximum yield
of 35.1%. Further studies by Olaniyan and Oje (2011) using a
model equation with Mechanical Extraction Rig (MER) for
SB gave a maximum yield of 35.39%. The yields obtained
were very low compared to 60% SB present in its kernel
(Axtell, Kocken, & Sandhu, 1993a). Therefore, a more robust
optimisation approach, such as response surface methodology
(RSM), can be employed for optimising ME to improve the
yield of SB without compromising the quality.
RSM is a mathematical tool that employs experi-
mental design with the ultimate goal of evaluating operating
parameters for any process, using minimum numbers of
experimental runs. It is widely used as a technique to
optimise, develop, or improve processes. The main advantage
of RSM, apart from the minimum number of experimental
runs, is that it generates enough information for statistical
acceptability of the results (Akinoso, Aboaba, & Olajide,
2011). The use of RSM for ME of SB is expected to improve
the yield and maintain the quality.
Shea butter is a product of shea fruits. Shea fruit
includes green epicarp, mesocarp (pulp), and a hard endocarp
that ultimately encloses the shea kernel (nut) known as the
embryo (Olaniyan & Oje, 2007). The shea kernel contains
about sixty percent (60%) shea butter (Axtell, Kocken, &
Sandhu, 1993b), which is a major raw material for several
purposes. SB can be used as a lubricant (material for greasing,
engine oil, and baking industries) and as insect repellent and
protection against Simulium infection (Ajala, Aberuagba,
Olaniyan, & Onifade, 2016). Shea butter is also known to
contain a relatively large amount of unsaponifiable content,
between 4 and 11%. The unsaponifiable compounds include
triterpenes, tocopherol, phenols, and sterols, which are anti-
inflammatory with antioxidant properties (Honfo, Akissoe,
Linnemann, Soumanou, & Van Boekel, 2014). Therefore, SB
can be used for medicinal purposes as a sedative in the
treatment of sprains, dislocations, minor aches, and pains;
unguent for skin; and as an antimicrobial agent promoting the
rapid healing of wounds (Ajala et al., 2016). SB consists of
more than 90% triglycerides, comprising more than 50%
unsaturated fatty acids (oleic, stearic, linoleic and palmitic
fatty acids) that are prone to oxidation (Honfo et al., 2014).
The presence of high amounts of unsaturated fatty acids in the
SB causes oxidative degradation of the butter, whether made
by traditional extraction or any other extraction procedure that
involves boiling or improper processing or storage. This leads
to inconsistent quality and limited shelf-life (Lovett, 2004;
Masters, Yidana, & Lovett, 2004). The oxidative degradation
of SB degrades the edibility of the butter, produces sensory
and chemical changes, and reduces the nutritional values
(Nahm, Juliani, & Simon, 2012). This has motivated a lot of
interest in SB extraction and characterisation. Hence there is a
need to compare alternative extraction processes, as this
choice affects the yield and quality of the SB.
This study, therefore, optimised SB extraction by
ME using RSM. Comparative study of extracted SB from
mechanical (SBM), SB from traditional (SBT), SB from
solvent (SBS) and SB from enzymatic (SBE) extraction
methods was performed, assessing yield, physicochemical
properties, and functional groups.
2. Materials and Methods
2.1 Materials
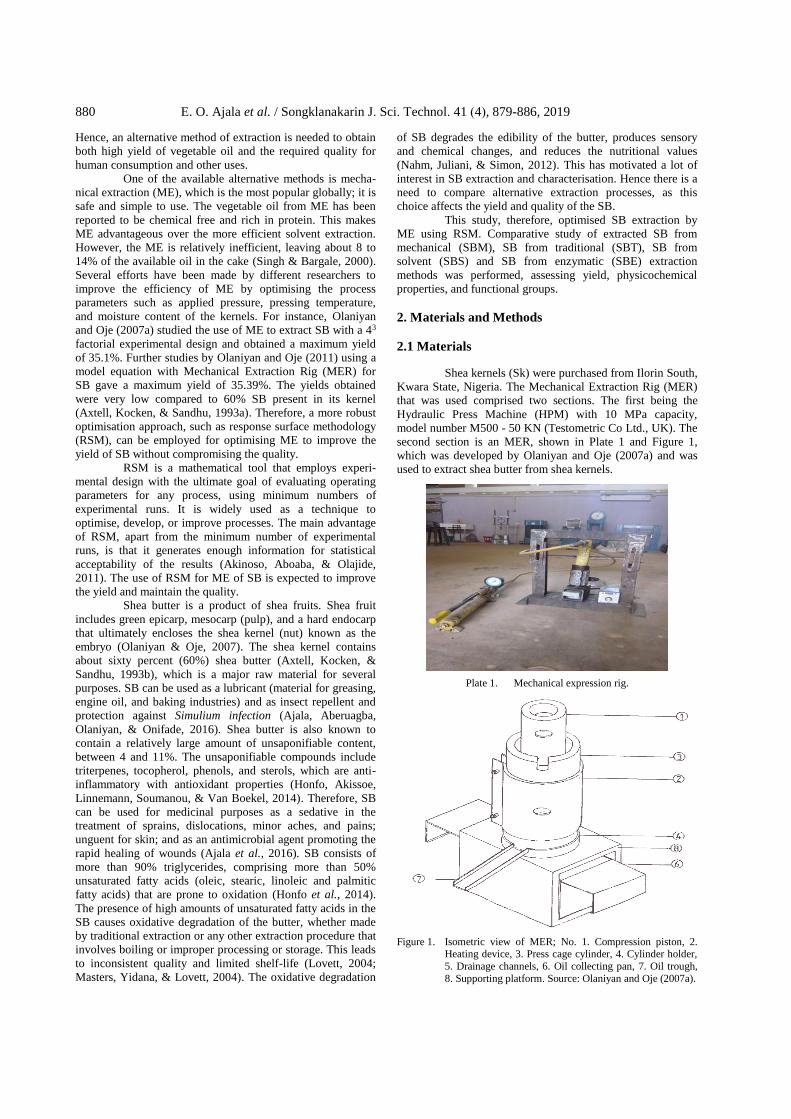
Shea kernels (Sk) were purchased from Ilorin South,
Kwara State, Nigeria. The Mechanical Extraction Rig (MER)
that was used comprised two sections. The first being the
Hydraulic Press Machine (HPM) with 10 MPa capacity,
model number M500 - 50 KN (Testometric Co Ltd., UK). The
second section is an MER, shown in Plate 1 and Figure 1,
which was developed by Olaniyan and Oje (2007a) and was
used to extract shea butter from shea kernels.
Plate 1. Mechanical expression rig.
Figure 1. Isometric view of MER; No. 1. Compression piston, 2. Heating device, 3. Press cage cylinder, 4. Cylinder holder,
5. Drainage channels, 6. Oil collecting pan, 7. Oil trough,
8. Supporting platform. Source: Olaniyan and Oje (2007a).

E. O. Ajala et al. / Songklanakarin J. Sci. Technol. 41 (4), 879-886, 2019 881
2.2 Methods
2.2.1 Box-Behnken (BB) design with quadratic
model in response surface methodology
(RSM)
The quadratic model of BB is an empirical model
that involves a second-order polynomial, which was employed
in this study. The model was fit to experimental data to predict
the yield from independent process parameters, and was used
to maximise the yield by determining the optimal operating
conditions for SB extraction. The model is as shown in
Equation 1:
Y = 1
Where Y represents the predicted response; is the
offset term; is the linear coefficients, and is the
interaction coefficients, while is the independent variable
process parameter.
The BB design of RSM incorporated into the Design
Expert software (version 8) was used to design the experi-
ments. The empirical results from designed experiments were
provided to the software for analysis, which generated
predictive models. The model was further subjected to
optimisation using the software, with the yield of SB as the
objective function to be maximised, and the process para-
meters (factors in the experimental design) as constrains
within prescribed limits. Statistical analysis was also carried
out through RSM using the Design Expert. The regression
coefficients, significant model terms in the regression model,
and optimal factors level for optimum yield of SB, were
obtained.
1) Experimental design for mechanical extraction
The BB design of Design Expert was used in an
optimisation study of SB extraction. The three process
parameters investigated were sample weight of Sk (100 – 200
g), temperature (60 – 120oC) and duration of applied pressure
(10 - 30 min). The ranges chosen for these parameters were
obtained from a preliminary investigation, and are shown in
Table 1a to form seventeen experimental runs matrix shown in
Table 1b.
2) Experimental procedure for mechanical
extraction
The Sk were ground into small particles and sieved
using a mesh to obtain <2.06 mm particle size. The sieved
sample Sk (100, 150 or 200 g) was weighed and poured into
press cage cylinder. The sample in the cylinder was heated
with the aid of a temperature-controlled heater band at desired
temperature (60, 90 or 120oC) for the duration of 30 min.
Thereafter, the sample Sk was compressed by the compression
piston using the HPM at a pressure of 8 MPa for a chosen
period of time (10, 20 or 30 min). The SB extracted was
collected in the output pan and was weighed to determine the
yield using Equation 2. The compression piston was lifted, the
cylinder unscrewed and the residual cake was removed.
Table 1. Experimental factor levels and ANOVA results
(a) Factor levels for optimisation of SBM
Independent variables Range and level
Factor Name Units -1 0 +1
A Sample weight g 100 150 200 B Temperature oC 60 90 120
C Applied pressure time min 10 20 30
(b) Yield of SBM by experimental run
Run
Sample
weight
(g)
Temperature (oC)
Applied
pressure
time (min)
SBM
yield
(%w/w)
1 100.00 60.00 20.00 27.00 2 200.00 60.00 20.00 28.01
3 100.00 120.00 20.00 29.10
4 200.00 120.00 20.00 30.00 5 100.00 90.00 10.00 33.98
6 200.00 90.00 10.00 34.01
7 100.00 90.00 30.00 34.02 8 200.00 90.00 30.00 34.00
9 150.00 60.00 10.00 27.01
10 150.00 120.00 10.00 29.99 11 150.00 60.00 30.00 28.01
12 150.00 120.00 30.00 30.00
13 150.00 90.00 20.00 37.01 14 150.00 90.00 20.00 37.02
15 150.00 90.00 20.00 37.00
16 150.00 90.00 20.00 36.99 17 150.00 90.00 20.00 37.00
(c) ANOVA for response surface quadratic model of SBM
Source of
variation
Coefficient
estimate
Sum of
squares Df
Mean
squares F value P value
Model 37.01 250.79 9 27.87 180.98 < 0.0001 Sig. A 0.32 0.79 1 0.79 5.16 0.0574*
B 1.15 10.63 1 10.63 69.01 < 0.0001
C 0.0075 0.00045 1 0.00045 0.0029 0.9584*
AB 0.055 0.012 1 0.012 0.079 0.7873*
AC -0.065 0.017 1 0.017 0.11 0.7501*
BC -0.11 0.044 1 0.044 0.29 0.6091*
A2 -1.71 12.32 1 12.32 80.01 < 0.0001
B2 -7.03 207.82 1 207.82 1349.7 < 0.0001 C2 -1.28 6.90 1 6.90 44.84 0.0003
Residual - 1.08 7 0.15
Pure
Error
- 0.015 4 0.00368
Cor Total - 251.87 16
CV =
1.22%
R2 =
0.9957
Adj R2 =
0.9902
Pred R2 =
0.9324
*Non Significant
%yield = X 100 2

882 E. O. Ajala et al. / Songklanakarin J. Sci. Technol. 41 (4), 879-886, 2019
2.2.2 Characterisation of SBM
1) Physical and chemical properties
The physical and chemical properties of the SB
were determined using standard methods of analysis (AOAC,
1998). The properties determined were saponification value,
free fatty acid, acid value, iodine value, viscosity, peroxide
values, pH and melting point. The Rudolph Research Ana-
lytical (RRA) DDM 2911 Automatic Digital Density Meter
was used to determine the relative density (Ajala et al., 2016).
2) FTIR
The Bruker ALPHA FT-IR spectrometer was used
for the FTIR analysis of the extracted SB, in the range of
4000–400 cm−1 (Ajala et al., 2016).
3. Results and Discussion
3.1 Statistical analysis of the mechanical extraction
of shea butter
The %yield of SB from ME in the experiments by
the BB design of RSM is shown in Table 1b. The ANOVA for
fitting the second-order response surface model by least
squares is shown in Table 1c. From the table, the p <0.0001 of
the model demonstrates a very high significance to predicting
the response and its suitability. The high F value of the model
(180.98) and a very low p-value (<0.0001) show that the
model is highly significant. The significance of all the
coefficients is established by p – values shown in Table 1c.
The second order terms of the three process
parameters considered were statistically significant, each of
them having p < 0.0005. Also, the low CV (1.22%) shows that
the results of the model are reliable. The quality of the model
is shown by R2 = 0.9957, which indicates that 99% of the
experimental variation was explained by the predictive model.
The high Adj. R2 (0.9902) also supports the significance of the
model, while the high value of predicted R2 (0.9324) indicates
reasonable precision of the fitted model.
3.2 Effect of process variables on the yield of SB
from ME
The effect of sample weight of Sk and temperature
on the %yield of SB is shown in Figure 2a. This figure shows
that the sample weight of 150 g at 90oC gave the maximum
yield of 37% (w/w) SB. It was observed that as the sample
weight and temperature deviate from the centre, the yield of
SB decreases. Figure 2b shows a plot of sample weight of Sk
and duration of applied pressure against yield of SB. From the
plot, the sample weight of 150 g and applied pressure of 8
MPa for 20 min gave the maximum 37% (w/w) yield of SB
and deviation of the two parameters from the centre causes a
decrease in the yield. The interaction between the sample
weight and duration of applied pressure was significant to the
yield. The interaction between duration of applied pressure
and temperature is also shown in Figure 2c. The figure reveals
that the centre point in this plot at a fixed sample weight of
Table 2. Percentage yield of SB obtained from different methods of extraction.
Extraction Method %Yield Source
Traditional (a) 27.2
(b) 28 (c) 34.1
Akingbala et al. (2006)
Coulibaly et al. (2009) Ikya et al. (2013)
Solvent (a) 47.5 (b) 53.77
(c) 66.90
Ikya et al. (2013) Nkouam et al. (2007)
Ajala et al. (2015b)
Supercritical CO2 39.57 Nkouam et al. (2007) Enzymatic 42.95 Ajala et al. (2015a)
Mechanical (a) 24.0
(b) 35.90 (c) 37
Akingbala et al. (2006)
Olaniyan and Oje (2011) This study
150 g gives the maximum 36% yield of SB. The interactions
show similar trends in Figs. 2b and 2c. The results show that
the maximum 37% (w/w) yield of SB was obtained with
sample weight 150 g, temperature 90oC and duration of
applied pressure 20 min, which is similar to the report of
Olaniyan and Oje (2011), where heating temperature, applied
pressure and loading rate of 82.24°C, 9.69 MPa and 2.50 mm
min-1, respectively, gave the maximum 35.39% yield of SB in
a 43 factorial experimental design. However, Mohagir, Bup,
Abi, Kamga, and Kapseu (2015) obtained a better yield of
45.7% SB, when RSM with Doehlert experimental design was
used for the optimisation of kernel preparation conditions
before press extraction of SB. However, the roasting
temperature (160 - 225oC) used was rather too high and may
have affected the quality of the SB produced.
3.3 Optimisation of mechanical extraction of shea
butter
The coefficients of the response surface model for
ME of SB as provided by Equation 3 were evaluated. The
optimal variables that gave maximum percentage yield of SB
for ME were obtained by using the regression fit, in the
Design Expert software.
3
The optimum %yield of SB (37%, w/w of Sk) was
found at sample weight 154.67 g, temperature 92.49oC and
duration of applied pressure 19.97 min. Experiments were
carried out to validate the model predictions of the para-
meters, and the yield of SB obtained was 36.87% (w/w). Thus,
the verification experiments confirmed validity of the pre-
dictive model. The error between the predicted and the
validated result was 0.353, which is low, and within the limits
(0–5%) of allowable error, and this result indicates good
reproducibility of the experiments. This shows that the model
predictions are in good agreement with the experimental
results.

E. O. Ajala et al. / Songklanakarin J. Sci. Technol. 41 (4), 879-886, 2019 883
Table 3. Physico-chemical properties of SBT, SBS, SBM, and SBE.
Properties SBT SBS SBE SBM
Relative Density 0.908 0.851 0.931 0.912
Kinematic Viscosity (mm2s-1) 30.68 44.84 19.72 26.57 Melting point (oC) 33.0 40.5 30.0 37.5
Free fatty acid (%) 9.0 23.89 6.85 8.10
Acid value (mgKOH/g oil) 21.85 48.63 13.21 18.39 Peroxide value (meq O2/kg) 9.80 11.00 12.10 13.80
Iodine value (gI2/100 g oil) 61.90 70.30 67.28 58.50
Saponification ( mgKOH/g oil) 208.00 202.9 193.90 180.20 pH value 6.09 5.02 5.53 5.38
Sources Ajala et al., 2015b Ajala et al., 2015a This Study
Design-Expert® SoftwareFactor Coding: Actual% Oil yield (w/w)
Design points above predicted valueDesign points below predicted value37
27
% Oil yield (w/w) = 37Std # 13 Run # 6X1 = A: Sample weight (g) = 150X2 = B: Temperature (oC) = 90
Actual FactorC: Loading time (mins) = 20.00
60
75
90
105
120
100
125
150
175
200
26
28
30
32
34
36
38
%
O
il y
ield
(w
/w
)
A: Sample weight (g) B: Temperature (oC)
(a) Weight and temperature (Time fixed at 20 min)
Design-Expert® SoftwareFactor Coding: Actual% Oil yield (w/w)
Design points above predicted valueDesign points below predicted value37.11
26.63
X1 = A: Sample weight (g)X2 = C: Applied pressure time (min)
Actual FactorB: Temperature (oC) = 90.00
10
15
20
25
30
100
125
150
175
200
33
34
35
36
37
38
% O
il y
ield
(w
/w)
A: Sample weight (g)C: Applied pressure time (min)
(b) Weight and time (Temperature fixed at 90oC)
Design-Expert® SoftwareFactor Coding: Actual% Oil yield (w/w)
Design points above predicted valueDesign points below predicted value37.11
26.63
X1 = B: Temperature (oC)X2 = C: Applied pressure time (min)
Actual FactorA: Sample weight (g) = 150.00
10
15
20
25
30
60
75
90
105
120
26
28.4
30.8
33.2
35.6
38
% O
il y
ield
(w
/w)
B: Temperature (oC)C: Applied pressure time (min)
(c) Temperature and time (Weight fixed at 150 g)
Figure 2. Effect of weight, temperature and time on %yield of SBM
in 3D plots
This study has clearly demonstrated the applicability
and reliability of RSM for the optimisation of extraction
variables in SB extraction using ME method.
3.4 Comparative analysis of SB from ME with other
methods of extraction
3.4.1 Percentage yield of SBM
Table 2 shows the yields of SB obtained from
different methods of extraction. The table shows that the
maximum yield obtainable for SB was from solvent
extraction, as reported by Ajala et al. (2016) (66.90% (w/w))
and Ikya et al. (2013) (47.5%). Nkouam, Kapseu, Barth,
Dirand, and Tchatchueng (2007) corroborate the fact that
solvent extraction of SB gave higher yield (53.77%) than even
supercritical CO2 methods (39.57%, w/w). The maximum
yield for mechanical extraction of SB was 35.90% (Olaniyan
& Oje, 2011) and that of enzymatic extraction was 42.9%
(Ajala, Aberuagba, Olaniyan, & Onifade, 2017). From this
study, 37% SB (w/w) yield was obtained, which clearly shows
that ME could not yield over 40% SB. However, the yield of
ME (37% SB) was more than those of traditional extraction
method reported by Akingbala, Falade, Adebesi, Baccus-
Taylor, and Lambert (2006), and Coulibaly, Ouédraogo, and
Niculescu (2009), as 27 and 28% SB (w/w), respectively.
3.4.2 Physico-chemical properties
Table 3 shows the physicochemical properties of
SBM as compared with other samples of SB from other
extraction methods.
1) Relative density and kinematic viscosity (mPa.s)
The relative density (RD) of SBM is 0.912 (Table
3); an indication that the RD of the SBM is relatively high
compared to SBT (0.908) and SBS (0.851) but lower than
SBE (0.931) as shown in Table 3. This may be as a result of
fine particles and impurities present in the SBM after
gravitational settling. The RD of SBM falls between 0.870
and 0.917 as reported by Olaniyan and Oje (2007a), which is
also similar to the find of Hee (2011).
The kinematic viscosity (Kv, mm2 s-1) was 26.57 for
SBM (Table 3). The Kv of SBM is the lowest among SBT and
SBS
(oC)
(oC)
884 E. O. Ajala et al. / Songklanakarin J. Sci. Technol. 41 (4), 879-886, 2019
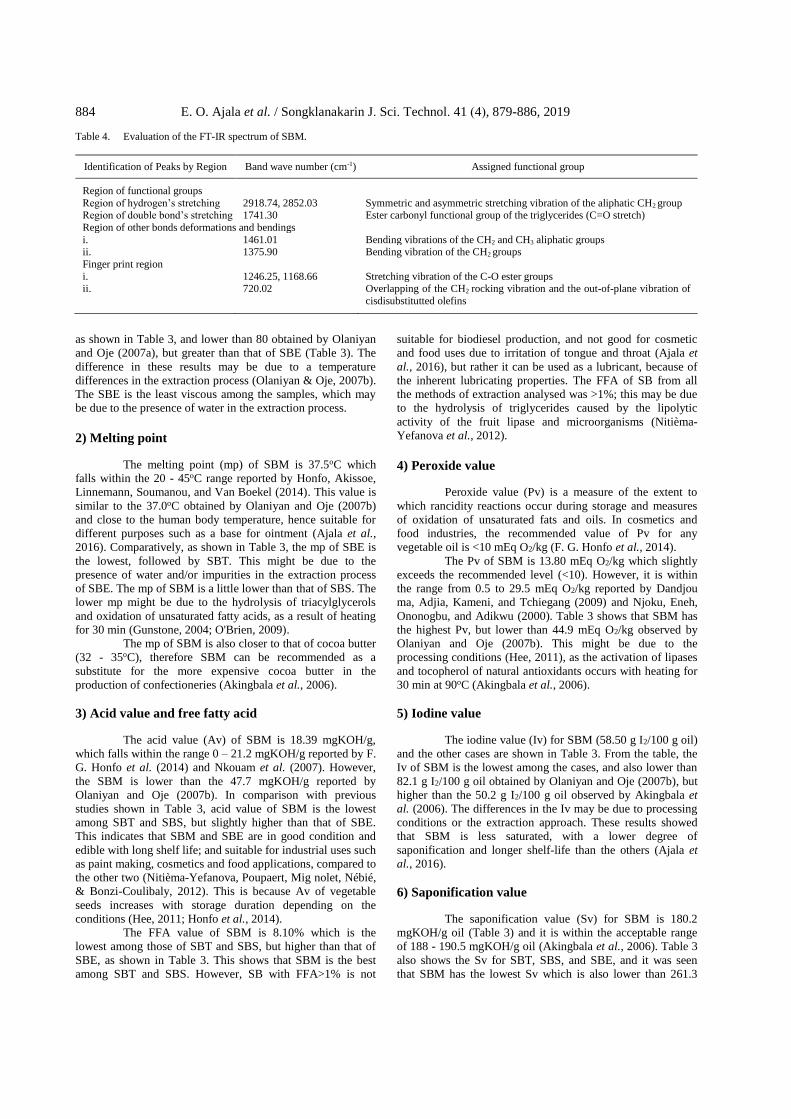
Table 4. Evaluation of the FT-IR spectrum of SBM.
Identification of Peaks by Region Band wave number (cm-1) Assigned functional group
Region of functional groups
Region of hydrogen’s stretching 2918.74, 2852.03 Symmetric and asymmetric stretching vibration of the aliphatic CH2 group Region of double bond’s stretching 1741.30 Ester carbonyl functional group of the triglycerides (C=O stretch)
Region of other bonds deformations and bendings
i. 1461.01 Bending vibrations of the CH2 and CH3 aliphatic groups ii. 1375.90 Bending vibration of the CH2 groups
Finger print region
i. 1246.25, 1168.66 Stretching vibration of the C-O ester groups ii. 720.02 Overlapping of the CH2 rocking vibration and the out-of-plane vibration of
cisdisubstitutted olefins
as shown in Table 3, and lower than 80 obtained by Olaniyan
and Oje (2007a), but greater than that of SBE (Table 3). The
difference in these results may be due to a temperature
differences in the extraction process (Olaniyan & Oje, 2007b).
The SBE is the least viscous among the samples, which may
be due to the presence of water in the extraction process.
2) Melting point
The melting point (mp) of SBM is 37.5oC which
falls within the 20 - 45oC range reported by Honfo, Akissoe,
Linnemann, Soumanou, and Van Boekel (2014). This value is
similar to the 37.0oC obtained by Olaniyan and Oje (2007b)
and close to the human body temperature, hence suitable for
different purposes such as a base for ointment (Ajala et al.,
2016). Comparatively, as shown in Table 3, the mp of SBE is
the lowest, followed by SBT. This might be due to the
presence of water and/or impurities in the extraction process
of SBE. The mp of SBM is a little lower than that of SBS. The
lower mp might be due to the hydrolysis of triacylglycerols
and oxidation of unsaturated fatty acids, as a result of heating
for 30 min (Gunstone, 2004; O'Brien, 2009).
The mp of SBM is also closer to that of cocoa butter
(32 - 35oC), therefore SBM can be recommended as a
substitute for the more expensive cocoa butter in the
production of confectioneries (Akingbala et al., 2006).
3) Acid value and free fatty acid
The acid value (Av) of SBM is 18.39 mgKOH/g,
which falls within the range 0 – 21.2 mgKOH/g reported by F.
G. Honfo et al. (2014) and Nkouam et al. (2007). However,
the SBM is lower than the 47.7 mgKOH/g reported by
Olaniyan and Oje (2007b). In comparison with previous
studies shown in Table 3, acid value of SBM is the lowest
among SBT and SBS, but slightly higher than that of SBE.
This indicates that SBM and SBE are in good condition and
edible with long shelf life; and suitable for industrial uses such
as paint making, cosmetics and food applications, compared to
the other two (Nitièma-Yefanova, Poupaert, Mig nolet, Nébié,
& Bonzi-Coulibaly, 2012). This is because Av of vegetable
seeds increases with storage duration depending on the
conditions (Hee, 2011; Honfo et al., 2014).
The FFA value of SBM is 8.10% which is the
lowest among those of SBT and SBS, but higher than that of
SBE, as shown in Table 3. This shows that SBM is the best
among SBT and SBS. However, SB with FFA>1% is not
suitable for biodiesel production, and not good for cosmetic
and food uses due to irritation of tongue and throat (Ajala et
al., 2016), but rather it can be used as a lubricant, because of
the inherent lubricating properties. The FFA of SB from all
the methods of extraction analysed was >1%; this may be due
to the hydrolysis of triglycerides caused by the lipolytic
activity of the fruit lipase and microorganisms (Nitièma-
Yefanova et al., 2012).
4) Peroxide value
Peroxide value (Pv) is a measure of the extent to
which rancidity reactions occur during storage and measures
of oxidation of unsaturated fats and oils. In cosmetics and
food industries, the recommended value of Pv for any
vegetable oil is <10 mEq O2/kg (F. G. Honfo et al., 2014).
The Pv of SBM is 13.80 mEq O2/kg which slightly
exceeds the recommended level (<10). However, it is within
the range from 0.5 to 29.5 mEq O2/kg reported by Dandjou
ma, Adjia, Kameni, and Tchiegang (2009) and Njoku, Eneh,
Ononogbu, and Adikwu (2000). Table 3 shows that SBM has
the highest Pv, but lower than 44.9 mEq O2/kg observed by
Olaniyan and Oje (2007b). This might be due to the
processing conditions (Hee, 2011), as the activation of lipases
and tocopherol of natural antioxidants occurs with heating for
30 min at 90oC (Akingbala et al., 2006).
5) Iodine value
The iodine value (Iv) for SBM (58.50 g I2/100 g oil)
and the other cases are shown in Table 3. From the table, the
Iv of SBM is the lowest among the cases, and also lower than
82.1 g I2/100 g oil obtained by Olaniyan and Oje (2007b), but
higher than the 50.2 g I2/100 g oil observed by Akingbala et
al. (2006). The differences in the Iv may be due to processing
conditions or the extraction approach. These results showed
that SBM is less saturated, with a lower degree of
saponification and longer shelf-life than the others (Ajala et
al., 2016).
6) Saponification value
The saponification value (Sv) for SBM is 180.2
mgKOH/g oil (Table 3) and it is within the acceptable range
of 188 - 190.5 mgKOH/g oil (Akingbala et al., 2006). Table 3
also shows the Sv for SBT, SBS, and SBE, and it was seen
that SBM has the lowest Sv which is also lower than 261.3
E. O. Ajala et al. / Songklanakarin J. Sci. Technol. 41 (4), 879-886, 2019 885
mgKOH/g oil obtained by Olaniyan and Oje (2007a). The
reason may be due to the 90oC press temperature with 30 min
heating time, as the temperature is inversely proportional to
Sv ( Olaniyan & Oje, 2007a).
7) pH value
The pH of SBM is 5.38 (Table 3). The pH values
show that SBM is acidic, though less acidic than SBS but
more acidic than SBE (Table 3). The acidity in the SB is due
to the unsaturated fatty acids (Nwabanne, 2012). Generally,
the physicochemical properties of SBM observed in this study
may be affected by the experimental procedures, as well as
quality and pre-treatment of the kernels before crushing, as
was reported by Coulibaly et al. (2009).
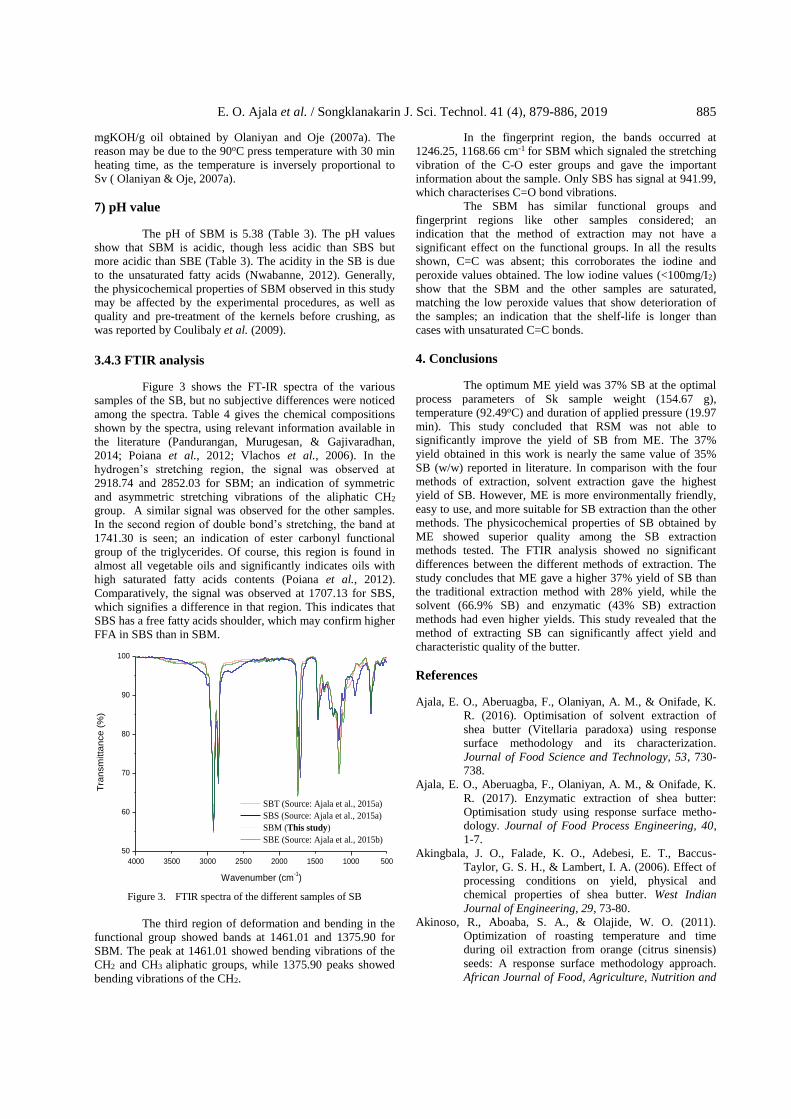
3.4.3 FTIR analysis
Figure 3 shows the FT-IR spectra of the various
samples of the SB, but no subjective differences were noticed
among the spectra. Table 4 gives the chemical compositions
shown by the spectra, using relevant information available in
the literature (Pandurangan, Murugesan, & Gajivaradhan,
2014; Poiana et al., 2012; Vlachos et al., 2006). In the
hydrogen’s stretching region, the signal was observed at
2918.74 and 2852.03 for SBM; an indication of symmetric
and asymmetric stretching vibrations of the aliphatic CH2
group. A similar signal was observed for the other samples.
In the second region of double bond’s stretching, the band at
1741.30 is seen; an indication of ester carbonyl functional
group of the triglycerides. Of course, this region is found in
almost all vegetable oils and significantly indicates oils with
high saturated fatty acids contents (Poiana et al., 2012).
Comparatively, the signal was observed at 1707.13 for SBS,
which signifies a difference in that region. This indicates that
SBS has a free fatty acids shoulder, which may confirm higher
FFA in SBS than in SBM.
4000 3500 3000 2500 2000 1500 1000 500
50
60
70
80
90
100
Tra
nsm
itta
nce
(%
)
Wavenumber (cm-1)
SBT (Source: Ajala et al., 2015a)
SBS (Source: Ajala et al., 2015a)
SBM (This study)
SBE (Source: Ajala et al., 2015b)
Figure 3. FTIR spectra of the different samples of SB
The third region of deformation and bending in the
functional group showed bands at 1461.01 and 1375.90 for
SBM. The peak at 1461.01 showed bending vibrations of the
CH2 and CH3 aliphatic groups, while 1375.90 peaks showed
bending vibrations of the CH2.
In the fingerprint region, the bands occurred at
1246.25, 1168.66 cm-1 for SBM which signaled the stretching
vibration of the C-O ester groups and gave the important
information about the sample. Only SBS has signal at 941.99,
which characterises C=O bond vibrations.
The SBM has similar functional groups and
fingerprint regions like other samples considered; an
indication that the method of extraction may not have a
significant effect on the functional groups. In all the results
shown, C=C was absent; this corroborates the iodine and
peroxide values obtained. The low iodine values (<100mg/I2)
show that the SBM and the other samples are saturated,
matching the low peroxide values that show deterioration of
the samples; an indication that the shelf-life is longer than
cases with unsaturated C=C bonds.
4. Conclusions
The optimum ME yield was 37% SB at the optimal
process parameters of Sk sample weight (154.67 g),
temperature (92.49oC) and duration of applied pressure (19.97
min). This study concluded that RSM was not able to
significantly improve the yield of SB from ME. The 37%
yield obtained in this work is nearly the same value of 35%
SB (w/w) reported in literature. In comparison with the four
methods of extraction, solvent extraction gave the highest
yield of SB. However, ME is more environmentally friendly,
easy to use, and more suitable for SB extraction than the other
methods. The physicochemical properties of SB obtained by
ME showed superior quality among the SB extraction
methods tested. The FTIR analysis showed no significant
differences between the different methods of extraction. The
study concludes that ME gave a higher 37% yield of SB than
the traditional extraction method with 28% yield, while the
solvent (66.9% SB) and enzymatic (43% SB) extraction
methods had even higher yields. This study revealed that the
method of extracting SB can significantly affect yield and
characteristic quality of the butter.
References
Ajala, E. O., Aberuagba, F., Olaniyan, A. M., & Onifade, K.
R. (2016). Optimisation of solvent extraction of
shea butter (Vitellaria paradoxa) using response
surface methodology and its characterization.
Journal of Food Science and Technology, 53, 730-
738.
Ajala, E. O., Aberuagba, F., Olaniyan, A. M., & Onifade, K.
R. (2017). Enzymatic extraction of shea butter:
Optimisation study using response surface metho-
dology. Journal of Food Process Engineering, 40,
1-7.
Akingbala, J. O., Falade, K. O., Adebesi, E. T., Baccus-
Taylor, G. S. H., & Lambert, I. A. (2006). Effect of
processing conditions on yield, physical and
chemical properties of shea butter. West Indian
Journal of Engineering, 29, 73-80.
Akinoso, R., Aboaba, S. A., & Olajide, W. O. (2011).
Optimization of roasting temperature and time
during oil extraction from orange (citrus sinensis)
seeds: A response surface methodology approach.
African Journal of Food, Agriculture, Nutrition and
886 E. O. Ajala et al. / Songklanakarin J. Sci. Technol. 41 (4), 879-886, 2019
Development, 11(6), 5300-5317.
Alenyorega, E. A., Hussein, Y. A., & Adongo, T. A. (2015).
Extraction yield, efficiency, and loss of the
traditional hot water floatation (HWF) method of oil
extraction from the seeds of Allanblackia flori-
bunda. International Journal of Scientific and
Technology Research, 4, 92-95.
Axtell, B., Kocken, E., & Sandhu, R. (1993a). Oil processing:
Food cycle technology. London, England: Practical
Action Publishing.
Axtell, B., Kocken, E., & Sandhu, R. (1993b). Oil processing:
Food cycle technology source book. London,
England: Practical Action Publishing.
Coulibaly, Y., Ouédraogo, S., & Niculescu, N. (2009). Experi-
mental study of shea butter extraction efficiency
using a centrifugal process. ARPN Journal of
Engineering and Applied Sciences, 4, 14-19.
Dandjouma, A. K. A., Adjia, H. Z., Kameni, A., & Tchiegang,
C. (2009). Traditional production and commer-
cialization of Shea butter in North-Cameroon.
Tropicultura, 27, 3-7.
Gunstone, F. D. (2004). Rapeseed and canola oil: Production,
processing, properties and uses. London, England:
Blackwell Publishing.
Hee, S. N. (2011). Quality characteristics of West African
shea butter (Vitellaria paradoxa) and approaches to
extend shelf-life. New Jersey, NJ: The State
University of New Jersey.
Honfo, F. G., Akissoe, N., Linnemann, A. R., Soumanou, M.,
& Van Boekel, M. A. J. S. (2014). Nutritional com-
position of shea products and chemical properties of
shea butter: A Review. Critical Reviews in Food
Science and Nutrition, 54(5), 673-686.
Ikya, J. K., Umenger, L. N., & Iorbee, A. (2013). Effects of
extraction methods on the yield and quality
characteristics of oils from shea nut. Journal of
Food Resource Science, 2, 1-12.
Lovett, P. (2004). The shea butter value chain, Refining in
West Africa (WATH Technical Report No. 3).
Retrieved from http://hubrural.org/IMG/pdf/wath_
shea_butter_refining_in_west_africa.pdf
Masters, E. T., Yidana, J. A., & Lovett, P. N. (2004).
Reinforcing sound management through trade: Shea
tree products in Africa. Unasylva, 210, 46-52.
Mohagir, A. M., Bup, N. D., Abi, C. F., Kamga, R., & Kap
seu, C. (2015). Optimisation of kernels preparation
conditions involved in the press extraction of shea
(Vitellaria paradoxa Gaertner F.) butter. American
Journal of Food Science and Technology, 3, 103-
110.
Nahm, H. S., Juliani, H. R., & Simon, J. E. (2012). Effects of
selected synthetic and natural antioxidants on the
oxidative stability of shea butter (Vitellaria
paradoxa subsp. paradoxa). Journal of Medicinally
Active Plants, 1(2), 69-75.
Nitièma-Yefanova, S., Poupaert, J. H., Mignolet, E., Nébié, R.
C. H., & Bonzi-Coulibaly, L. Y. (2012). Characteri-
zation of some non-conventional oils from Burkina
Faso. Journal de la Société Ouest-Africaine de
Chimie, 033, 67-71.
Njoku, O. U., Eneh, F. U., Ononogbu, I. C., & Adikwu, M. U.
(2000). Compositional and toxicological studies on
Shea butter. Journal of Nutraceuticals, Functional
Medical Foods, 2, 33-39.
Nkouam, G. B., Kapseu, C., Barth, D., Dirand, M., &
Tchatchueng, J. B. (2007). Oil extraction from shea
nut kernel (Vitellaria paradoxa Gaertn) and
Canatium Pulp (Canarium schweinfurthii Engl.)
using supercritical CO2 and hexane: A comparative
study. Research Journal of Applied Sciences, 2,
646-652.
Nwabanne, J. T. (2012). Kinetics and thermodynamics study
of oil extraction from fluted pumpkin seed.
International Journal of Multidisciplinary Sciences
and Engineering, 3, 11-15.
O'Brien, R. D. (2009). Fats and oils: Formulating and
processing for applications (3rd ed.). Boca Raton,
Fl: CRC Press.
Olaniyan, A. M., & Oje, K. (2007a). Development of mecha-
nical expression rig for dry extraction of shea butter
from shea kernel. Journal of Food Science Techno-
logy, 44, 465-470.
Olaniyan, A. M., & Oje, K. (2007). Quality characteristics of
shea butter recovered from shea kernel through dry
extraction process. Journal of Food Science Techno-
logy, 44, 404-407.
Olaniyan, A. M., & Oje, K. (2007b). Quality characteristics of
shea butter recovered from shea kernel through the
dry extraction process. Journal of Food Science
Technology, 44, 404-407.
Olaniyan, A. M., & Oje, K. (2011). Development of model
equations for selecting optimum parameters for the
dry process of shea butter extraction. Journal of
Cereals and Oilseeds, 2, 47-56
Pandurangan, M. K., Murugesan, S., & Gajivaradhan, P.
(2014). Application of FTIR spectroscopy to assess
the groundnut oil adulteration. Journal of Chemical
and Pharmaceutical Research, 6, 553-560.
Poiana, M., Mousdis, G., Alexa, E., Moigradean, D., Negrea,
M., & Mateescu, C. (2012). Application of FT-IR
spectroscopy to assess the olive oil adulteration.
Journal of Agroalimentary Processes and Techno-
logies, 18, 277-282.
Singh, J., & Bargale, P. C. (2000). Development of a small
capacity double stage compression screw press for
oil expression. Journal of Food Engineering, 43, 75-
82.
Vlachos, N., Skopelitis, Y., Psaroudaki, M., Konstantinidou,
V., Chatzilazarou, A., & Tegou, E. (2006). Appli-
cations of Fourier transform-infrared spectroscopy
to edible oils. Analytica Chimica Acta, 573–574,
459–465.