life cycle analysis of shea butter biodiesel using greet
TRANSCRIPT

LIFE CYCLE ANALYSIS OF SHEA BUTTER BIODIESEL USING GREET SOFTWARE
by
SOLOMON QUANSAH
B.S., University of Science and Technology, 1999
A REPORT
submitted in partial fulfillment of the requirements for the degree
MASTER OF SCIENCE
Department of Chemical Engineering
College of Engineering
KANSAS STATE UNIVETRSITY
Manhattan, Kansas
2012
Approved by:
Major Professor
Dr. John Schlup

Abstract
In this study, life cycle analysis (LCA) of shea butter biodiesel from Well-to-Pump
(WTP) is considered utilizing information gathered from Anuanom Industrial Bio Products Ltd.
(AIBP) in Ghana, West Africa. The information presented in this report starts with shea plant
cultivation, proceeds through harvesting of shea fruits, extraction of shea butter from shea
kernels, and finishes with the production of shea butter biodiesel via homogenous acid–alkali
transesterification reactions utilizing methanol. After researching the conversion of shea butter to
biodiesel, the GREET software was explored as a tool to perform LCA.
Shea butter is an excellent alternative feedstock to produce biodiesel on an industrial
scale. Though research into shea plant cultivation and subsequent conversion into biodiesel in
Ghana has not received formal attention, it has huge potential in the biodiesel industry. The tree
originates in Africa and is tropical and drought-resistant. Although even some basic agronomic
characteristics of shea butter are not yet fully understood, the plant enjoys a booming interest,
which may hold the risk of unsustainable practice.
The GREET software from the Argonne National laboratory of the US Department of
Energy (DOE) was used in LCA. The software is a very useful tool specifically designed for
LCA focused on energy and emissions of different production processes, including biodiesel
production. This software is managed by DOE research laboratory and is made available for
public use. The GREET software allow users perform many existing fuel production processes.
To perform an LCA on shea butter biodiesel which is a new feedstock to the GREET software,
some of the requisite information, and data input has to be sent to the Argonne National
Laboratory personnel for input. For a new biodiesel feedstock such as shea butter which is not
part of the GREET software database, it is important to work with the Argonne National
laboratory to perform the LCA.

iii
Table of Contents
List of Figures…………………………………………………………………………………......v
List of Tables……………………………………………………………………………………..vi
Acknowledgement……………………………………………………………………………….vii
Chapter 1- Introduction…………………………………………………………………………....1
Chapter 2 – Shea Butter to Biodiesel Production ......................................................................... 3
The Shea Butter and its Plant…………………………………………………………………...3
Shea Nut Cultivation and Output Levels in Ghana…………………………………....4
Uses of Shea Butter………………………………………………………………………….4
Physical and Chemical Properties of Shea Butter………………………………………………5
Transesterification Process of Biodiesel Production…………………………………………....6
Homogenous Catalytic Production of Shea Butter Biodiesel…………………………………..7
Chapter 3 – Life Cycle Analysis Tools and GREET Software…………………………………..10
Life Cycle Analysis Tools………………………………………………………………….....10
GREET Software Background Information…………………………………………………...11
The Purpose of the GREET Software for LCA………………………………………….....11
Organization Supporting the GREET Software………………………………………….....12
The GREET Software Structure……………………………………………………………12
GREET Software Sources of Data/Information to Perform LCA……………………….....13
Soybean Biodiesel Data Input for GREET Software…………………………………….....14
Soybean Biodiesel LCA User Input Data …………………………...……………………..19
The GREET Calculation Logic and Input Options ………………….………………………..20
Explanation of Input Parameters……………………………………………………………21
Running the GREET Software………………………………………………………...……...22
Output of the GREET Software LCA………………………………………………………...24
Chapter 4 – Life Cycle Analysis (LCA) System Boundaries……………………………………29
Goal and Scope of LCA Study………………………………………………………………..29
LCA Functional Unit………………………………………………………………………….30
iv
Life Cycle Inventory (LCI) Analysis……………………………………………………….....30
Data Collection……………………………………………………………………………..30
Data Analysis…………………………………………………………………………….....30
Life Cycle Impact Assessment………………………………………………………………...30
Interpretation…………………………………………………………………………………..31
Stages in Shea Butter Biodiesel LCA Boundaries…………………………………………….31
Shea Nuts Farming Stage…………………………………………………………………...32
Shea Nuts Transportation……………………………………………………………….…...32
Shea Butter Extraction………………………………………………………………….…...33
Shea Butter Transesterification……………………………………………………….……..33
Shea Butter Transportation to Fuel Pump Station…………………………………………..33
Chapter 5 – Performing LCA of Shea Butter Biodiesel Using GREET Software………………34
Data for Computing Shea Butter Biodiesel LCA……………………………………………..34
Data Requiring Argonne National Laboratory Entry…………………………………………35
AIBP Ltd. Missing Data Substution…………………...………………….………………...36
User Input Data on Shea Butter biodiesel…………………………………………………...40
Chapter 6 – Conclusion…………………………………………………………………………..43
Chapter 7– Future Work……………………………………………………................................44
References………………………………………………………………………………………..45
Appendix A – The Life Cycle Analysis (LCA)………………………………………………….49
Appendix B – Output Result of Biodiesel LCA from Soybeans Using GREET Software……...56

v
List of Figures
Figure 2.3 Process Flow Sheet for Production of Biodiesel from Shea Butter …………………. 8
Figure 3.1 Calculation Logic for the GREET Software……………………..…………………..21
Figure 3.2 Screen Images of Main Steps………………...…… ………………………………...23
Figure 3.3 Schematic Explaining Figure 3.2………………………………..…………………...24
Figure 3.4 Graphical Representation of Table 3.4……………………………...………………..26
Figure 4.1 Stages in Shea Butter Biodiesel LCA Boundaries……………….………..…………32
Figure A.1 Phases and Applications of an LCA…………………………………………………50
Figure A.2 Process Representation……………………………………………………...……….53

vi
List of Tables
Table 2.1 Physical and Chemicals Properties of Crude Shea Butter……………………………...5
Table 2.2 Fatty Acid Composition of Shea Butter………………………………………………..6
Table 3.1 Different LCA Software Tools…………………………………………..……………10
Table 3.2 Soybeans Biodiesel LCA Inputs for GREET Software……………….. ……………..15
Table 3.3 User Input and GREET Software Default Values for Soybeans Biodiesel LCA……..18
Table 3.4 GREET Software Output Result for Soybeans Biodiesel LCA on Energy/Fuels…….25
Table 3.5 GREET Software Output Result for Soybeans Biodiesel LCA on Emissions….….....27
Table 5.1 Shea Butter Biodiesel Input Data for Argonne National Laboratory Entry……….…38
Table 5.2 User Input on Shea Butter Biodiesel LCA……………………………………………41
Table A.1 Summary of Inputs and Outputs of the Process………………………………………54
Table A.2 Computed Environmental Impact Categories……………………………………......54
Table B.1 Well-to-Pump Energy Consumption and Emissions…………………………………57
Table B.2 Soybeans Biodiesel LCA Inputs for GREET Software………………………..…… 58
Table A.3 User Input and GREET Software Default Values for Soybeans Biodiesel LCA…... 60

vii
Acknowledgement
In writing this report I would like to express my gratitude to Dr. John R. Schlup for
extraordinary oversight throughout the early stages of the report to its final stage. My sincere
thanks to other supervisory committee members: Dr. L.T. Fan and Dr. Peter H. Pfromm for their
invaluable contributions and coordination on the report completion.
I want to recognize the contribution of the Anuanom Industrial Bio Products Ltd. (AIBP)
in Ghana, who provided meaningful data on shea plant cultivation and on shea butter biodiesel
production. Most of the data presented in this report would not have been possible without their
effort. I want to express my gratitude to the operations manager, George Niako; production
supervisor, Alex Oduro and the supporting team of the AIBP Ltd. for providing the needed
information in support of this report.
Andrew J. Burnham and Vicki L. Skonicki at the Argonne National Laboratory have
been extremely helpful in responding to my inquiries on the GREET software when writing this
report. I appreciate their patience in explaining the GREET software’s operation.
Below is a quote from the Department of Energy, DOE in line with the usage of their
software, “The software and the data base information used for the LCA analysis was developed
by the UChicago Argonne, LLC as Operator of Argonne National Laboratory under contract No.
DE-AC02-06CH11357 with the Department of Energy (DOE)”.

1
Chapter 1 - Introduction
Liquid fuel use accounts for the single largest share of petroleum consumption in the
world, including Ghana. In 1993 motor vehicles alone consumed 732 metric tons of gasoline and
diesel on a trajectory that indicate a sharp increase in future (Robin, 2003). Increased demand of
gasoline and diesel are as a result of the growth in light-duty vehicle (LDV) travel on the roads in
many countries than before. In the 1980s Ghana had many buses in the cities and rural
communities for mass transportation. The situation is different today because individual vehicles
ownership has increased significantly. Fuel is more efficiently used in mass transportation than
personal ownership. There is high demand for fuel to keep pace with growing demand of energy
(Robin, 2003).
The world’s most oil-rich region has become extremely unstable, which heightens energy
security concerns. Furthermore, competition for petroleum has increased dramatically as a result
of rapid economic growth in developing countries. Finally, exploration, production, and use of
petroleum-based fuels generate greenhouse gas (GHG) emissions, which contributes to climate
change as confirmed in a recent report prepared by the Intergovernmental Panel on Climate
Change (IPCC, 2007).
Considering the challenges facing the world on its continued reliance on fossil-based
fuels in the transportation sector, many researchers are exploring alternatives. Finding alternative
fuels which are carbon neutral and have minimal GHG impacts would allow Ghana to reduce
dependency on foreign oil and decrease environmental burdens. Clean alternative fuels stand the
chance of boosting domestic fuel production and offering jobs to the unemployed. One plausible
way to develop domestic fuel is by using a locally produced feedstock, shea butter, and further
processing it into biodiesel fuel. The shea butter is not a new raw material in Ghana, but it
relatively new as a feedstock for biodiesel.
Shea butter is considered as a potential feedstock available for biodiesel production.
Though mostly found in the tropical part of the world in a limited landscape, it is possible to
extend cultivation in many part of the world when advanced agriculture technology is employed.
Shea butter biodiesel when blended with conventional fuel has the potential to reduce carbon
emissions and the green house gases of most concern. Conventional uses of shea butter have

2
been in the chocolate, cosmetics, body lotions and similar industries. Biodiesel is being produced
out of shea butter by the Anuanom Industrial Bio Products Ltd. (AIBP) in Ghana, West Africa.
Conventional biodiesel production methodology is employed to produce biodiesel from
shea butter. The shea butter is obtained via cultivation of the shea plant, harvesting of mature
shea fruits; extraction of the shea butter from shea kernels and subsequently undergoes
transesterification to produce biodiesel. These processes define the boundaries of the LCA for
this report.
Since 1995, with support primarily from DOE’s Office of Energy Efficiency and
Renewable Energy, Argonne National Laboratory has been developing the Greenhouse Gases,
Regulated Emissions and Energy Use in Transportation (GREET) model. The latest version —
GREETS 1.7 and revised to version 1.8 — is capable of analyzing more than 100 transportation
fuel pathways and 75 vehicle/fuel systems (Brinkman et al., 2005). The GREET model has been
updated frequently to reflect new feedstocks, processing technologies, fuels, and vehicle
systems.
For a given vehicle and fuel system, GREET separately calculates the following qualities.
• Consumption of total energy (energy in non-renewable and renewable sources), fossil fuels
(petroleum, natural gas, and coal combined), petroleum, natural gas, and coal;
• Emissions of carbon-dioxide (CO2) -equivalent GHGs — primarily CO2, methane (CH4), and
nitrous oxide (N2O); and
• Emissions of six criteria pollutants: VOCs, carbon monoxide (CO), nitrogen oxides (NOX),
particulate matter measuring 10 micrometers or less (PM10), particulate matter measuring 2.5
micrometers or less (PM2.5), and sulfur oxides (SOX) (Huo et al., 2008).
These criteria pollutant emissions are further separated into total and urban emissions.
This study was an attempt to evaluate the benefit of shea butter biodiesel by considering energy
use and the environmental impact relating to gaseous emissions from a life-cycle analysis
perspective.

3
Chapter 2 - Shea Butter to Biodiesel Production
The shea butter plant is a wonderful plant because of its versatility in different medical
and food applications. The products of shea butter are widely used around the world in lotions,
chocolate and other products (DeMoss, 2001). The plant is not widely cultivated around the
world, being mainly limited to the tropical areas of Africa, owing to the plant’s characteristics.
As the plant attracts attention in other industries, research and development could expand its
cultivation to other parts of the world. Especially with interest being shown in industries such as
the biodiesel industry, it is likely shea butter could become attractive for cultivation in other parts
of the world.
Physical and chemical characteristics of the plant have been determined, and its fruit has
with appreciable free fatty acid content (Adomako, 1982). Thus, converting shea butter into
biodiesel would require the use of acid and alkali to reduce the free fatty acid to a level
acceptable for a homogeneous catalytic transesterification process. It is not surprising interest in
harnessing the full potential of shea butter in Ghana has grown stronger. Currently significant
progress is being made undertaking biodiesel production from shea butter on a small scale.
The Shea Butter and Its Plant
Shea butter is derived from a plant in the family Sapotacea called Vitellaria paradoxa.
Shea butter plants are native to tropical Africa, reaching upwards of 12 to 20 metres in height. Its
branches are short and thick, with a grayish bark, red inside, and deeply sprung; the cork divides
into small irregular quadrangular prisms. It is very resistant to bush fires. The branches, more or
less spreading, are short and thick with ring-shaped rolls. The leaves are borne only at the end of
the branches. The branches are large, isolated, and membranous. They are covered with a
brownish down when young. They become tough and glabrous on the adult plant. Fruition occurs
only once a year. The fruit is a greenish-yellow ellipsoidal or spherical berry and is harvested
when fully mature as the nut (DeMoss, 2001).

4
Shea Nuts Cultivation and Output Levels in Ghana
The cultivation of shea trees is not well studied due to the long time required to reach
maturity. The common practice is to employ traditional farming techniques for shea tree
cultivation. It may require upwards of 15 to 25 years before bringing a new planting into fruition.
The trees are usually well protected by farmers and stakeholders because of their economic
value.
Ghana is the leading producer of the shea nut worldwide at about 200,000 tonnes
annually. Other countries that produce the shea nut are Ivory Coast, Senegal, Mali, Togo, Benin,
and Nigeria. Ghana exports half of West Africa’s shea nuts, approximately 160,000 tonnes. At
present Ghana processes 15,000 tonnes of shea-nut into shea butter for export while 70,000
tonnes are processed for domestic use. The problem is that local processing methods dominate,
which are laborious due to lack of modern mechanization and proper equipment (Ronnie, 2010).
In the 2008/2009 growing season, Ghana shipped close to 80,000 tonnes of raw shea
nuts, and about 35,000 tonnes were neither exported nor processed domestically. Storage over
time reduces the quality of the nuts with the majority becoming rotten (Ronnie, 2010).
Uses of Shea Butter
Shea butter has unsurpassed ability to maintain and protect the skin from environmental
damage. It is used to protect the skin from sunburn and eczema, as well as to rejuvenate the skin.
Due to its exceptional healing qualities, it is employed in scalp and hair applications. When
refined, it is utilized as an edible butter, which is used as a cocoa butter equivalent (in high
quality Swiss chocolates, for example) as a base for high quality cosmetics; and, more recently,
in the aromatherapy industry. Shea butter is also used in the care of household pets and farm
animals (DeMoss, 2001).
For centuries, Africans massaged it on their body after washing, to relax muscles and to
soften the skin, especially during the dry/hot seasons. Shea butter has been used to treat sprains,
wounds and colds. Other uses include as an aftershave and as a hair balm as it fixes dry, brittle,
and damaged hair. Many Africans depend on shea butter as their substitute for the more valuable
dairy butter. It is also employed as a natural source of antioxidants and vitamin E.

5
Physical and Chemical Properties of Shea Butter
. The shea nuts contain about 50% of fat, consisting mainly of stearic (36-47%) and oleic
(33-50%) acids (DeMoss, 2001). Shea butter is extracted from the nut of the African shea tree
(Vitellaria paradoxa) by crushing, boiling, stirring and refining. Another method of extracting
the shea butter from the shea nut is through roasting, pressing to separate the raw butter from its
cake, and refining the butter. The physical and chemical properties of crude shea butter have
been analyzed at the Cocoa Research Institute of Ghana by Adomako (1982). The properties
reported are provided in Table 2.1.
Table 2.1 Physical and Chemical Properties of Crude Shea Butter
Characteristic Content
Ash content 3.2 %
Melting point 38.0-39.5°C
Slip point 36.7-37.4 oC
Iodine number 64.2%
Acid Free fatty acid (as oleic) 6.8 wt%
Saponification number 179.6-190.0
Unsaponifiable matter 7.3-9.0%
Fat Content 52.1%
Solidification point 26.5-30.0°C
Degree of unsaturation 0.59
Acid number 13.4
Source: Adomako (1982)
The fatty acid composition of shea butter reported by Salunke et al. (1986) is presented in Table
2.2.

6
Table 2.2 Fatty Acid Composition of Shea Butter
Fatty Acids Mean Values
Palmitic 3.6 %
Stearic 44.4%
Oleic 42.4%
Linoleic 5.9%
Source: Salunkhe and Desai (1986)
Transesterification Process of Biodiesel Production
Biodiesel is produced via transesterification involving a chemical reaction between the
triglyceride and alcohol in the presence of a catalyst. It consists of a sequence of three
consecutive reversible reactions where triglycerides are converted to diglycerides, diglycerides
are converted to monoglycerides, and monoglycerides to glycerol and a fatty acid ester. In each
step an ester is produced. Thus, three ester molecules are produced from one molecule of
triglyceride (Shama, 2007). It also gives glycerol as a by-product, which has commercial value.
Commonly used alcohols include methanol, ethanol, propanol and butanol. The yield of
biodiesel is independent of the type of the alcohol used, and the selection of the alcohol
employed depends on cost and performance. Methanol is typically preferred over others due to
its low cost (Ramadhas, 2005).
The conventional catalysts used are acid or alkali catalysts depending upon the nature of
the oil used for biodiesel production. The free fatty acids (FFA) content in the raw oil is
particularly important in the choice of the catalyst. FFA should not exceed a certain amount
when considering transesterification with an alkali catalyst. Canakci and Van Gerpan, (1999,
2001) reported that transesterification was not feasible if FFA content in the oil was about 3%.
Ramadhas et al.(2005) and Veljkovic et al.(2006) used rubber seed oil and tobacco seed oil,
respectively, with higher free fatty acid content (17%). They demonstrated that it can be reduced
to FFA values not exceeding 2.0% by acid transesterification using H2SO4 as a catalyst. Sharma
and Singh (2007) also favored acid (H2SO4) transesterification prior to alkaline
transesterification with karanja oil as a feedstock, which has a FFA content of 2.53%. In the

7
same manner, the acid value of jatropha, which corresponds to 14% FFA, was reduced to less
than 1% by using H2SO4 (Tiwari, 2007).
For oil samples with FFA below 2.0%, alkaline transesterification is preferred over the
acid catalyzed transesterification as the former is reported to proceed about 4000 times faster
than the latter (Fakuda et al., 2001). Common catalysts that have been employed during alkaline
transesterification in industrial applications include sodium hydroxide and potassium hydroxide,
among others. The biodiesel and glycerine produced via alkaline transesterification have to be
purified to remove residual catalyst, typically by multiple washings with hot distilled water.
Ramadhas et al. (2005) have reduced the acid value to less than 2.0% through acid catalyst,
followed by alkaline transesterification. The amount of catalyst used for alkaline
transesterification ranged between 0.3% and 1.0%. Sarin et al.(2007), prepared a series of
biodiesels from the edible oils such as sunflower, soybean, and palm oil as well as non-edible
oils such as jatropha and karanja.
Homogenous Catalytic Production of Shea Butter Biodiesel
Shea butter is similar to jatropha with the free fatty acid (FFA) content exceeding 2.0%.
Therefore converting the shea butter into biodiesel would require using an acid catalyst followed
by an alkaline catalyst in order to be successful in producing biodiesel. The acid and alkali
catalysts are mixed with the feeds in a liquid phase before undergoing a reaction with the shea
butter for a period of time. The homogenous catalysts of alkali and acid are recovered and
recycled back to the feed stream. The schematic below depicts production processes for biodiesel
from shea butter. It is a summary of activities showing biodiesel production from shea butter
from a company called Anuanom Industrial Bio Products Ltd (AIBP) in Ghana.

8
Figure 2.3 Process Flow Sheet for Production of Biodiesel from Shea Butter
Distillation Column 1Distillation Column 2
Distillation Colum 3
M M
M,B,F,G,C
SA
C
F
Reactor 1B,F,G,C
Extration Unit
B
F
B,F
W
Reactor 2
HA W
G,C
W
G
S
Crystallizer
G,S
W,S,G
Legend:
F – Shea butter, SA – Sulfuric acid, HA – Hydrochloric acid, W – Water, M – Methanol,
C – Catalyst, G – Glycerine, B – Biodiesel, S – Salt.

9
Prior to the transesterification reaction, the shea butter is pre-treated with sulfuric acid
(0.5 wt. %) to reduce the FFA from 6.8 % to less than 2.0 %, which is also recommended by
Ramadhas et al. (2005). The amount of alkaline catalyst, NaOH, added is about 1 wt. % on the
basis of the amount needed to neutralize the unreacted acid in the pre-treatment stage and to
catalyze the tranesterification reaction.
The shea butter, catalyst, and alcohol are fed into reactor 1 at a temperature of 60-80 oC
and a pressure of 4 bars. After 2-4 hours of residence time, the fat is converted to biodiesel and
glycerol co-product. The products of reactor 1 are fed to distillation column 1 to separate the
methanol. It is recycled back to the feed stream of reactor 1. Biodiesel from the tranesterification
reaction is separated from the glycerol via water washing in the extraction unit. The majority of
the glycerol and NaOH are removed with the washing stream. Unreacted shea butter and
biodiesel products enter into distillation column 2 to separate the two components. The un-
reacted NaOH is neutralized with HCl in the reactor 2, and the products directed into the
distillation column 3 to remove the excess water used in the extraction unit. The remaining salt
and glycerol are separated using a crystallizer.

10
Chapter 3 - Life Cycle Analysis (LCA) Tools and GREET Software
Life Cycle Analysis Tools
Numerous and diverse life cycle analysis tools are available today, and selecting a
suitable tool to accomplish a particular LCA objective can be a challenge. SimaPro and Gabi, for
example, are familiar LCA software tools used extensively in the US and Europe for conducting
LCA of industrial processes. Some LCA software are specifically designed to suit specific
studies such as GREET for fuels applications. A group of research institutes called the “LCA
Network of the IRIS1 association” have carried out a survey of the LCA software tools presently
available on the global market. The survey focused on applicability, data availability and
practical procedure when using the software. Software suppliers were contacted by e-mail and by
post. The survey was comprised of responses from 22 supplies of 24 software tools (Anna et al.,
2000). Some of the LCA software tools reported are listed below.
Table 3.1 Different LCA Software Tools
LCA
Software
Tools
Boustead Cambridge
Engineering
Selector
Eco
CUMPAN
1.44
ECO-it
1.0
EcoLab EcoScan
3.0
EPS 4.0
Design
System
Sima Pro GaBi3 GEMIS Simbox
version
2.6
JEMAI
-LCA
PEMS
v4.6
Source: Anna et al., 2000
The study found the following information about the LCA software tools.
• 19 of the software tools are intended for LCA experts, 15 for design engineers, and 18 for
environmental engineers. Nine (9) were intended for all types of users.
• 17 of the software are designed for accounting LCA, 14 are designed for function-based LCA,
and 14 for screening LCA. Some of the softwares are designed for all types of LCA.
• Almost all of the software packages comply with the ISO 14040 standards. While almost every
software package is available in English, some of them employ another language as well (Anna
et. al, 2000).
For the purpose of this report, the GREET software was employed, because it is one of
the most successful LCA tools and used by the U.S. DOE. GREET is an acronym for

11
Greenhouse Gases, Regulated Emissions and Energy Use in Transportation. It has been a useful
modeling tool for simulating LCA of vehicle fuels with emphasizes on energy and emissions of
fuels. It is used by research in alternative energies including new fuel feedstock has made it the
preferred software choice for general public. The software is freely accessible at the DOE
website http://greet.es.anl.gov/.
GREET Software Background Information
Performing life cycle assessment for fuels and vehicles has evolved in the past 20 years.
It has mainly employed for the vehicle/fuel system from Well-to-Wheels (WTW), which is also
called fuel cycle analysis. Such fuel cycle analysis has been adopted by the DOE to incorporate
hydrogen fuels, bio-fuels, and biodiesel with the goal of reducing transportation green house
gases (Wang, 2007).
In order to broaden the scope of life cycle assessment, the GREET model was developed
in the Argonne National Laboratory of the Department of Energy (DOE) as an LCA tool to
examine transportation fuels and vehicle technologies. Fuels such as gasoline, diesel, ethanol,
and biodiesel can be simulated by the GREET tool to determine energy use and emissions. Its
uses include estimation of greenhouse gases (CO2, CH4, N2O), six criteria pollutants (VOC, CO,
NOx, SOx, PM10, and PM2.5), and VOCs. The most recent version is GREET 1.7 which focuse on
LCA’s of fuels production. GREET 1.7 has been updated to GREET 1.8 to reflect new
feedstocks, processing technologies, fuels, and vehicle systems (Wang, 2007).
The Purpose of the GREET Software
The purpose of the software developed by Argonne National Laboratory of DOE is to
perform fuel life cycle analysis of different fuel production options using different feedstocks.
Fuel use in transportation vehicles accounts for a large percentage of all energy use in the United
States. Significant emissions result from production of fuels, which is known as Well-to-Pump,
to meet the needs of the transportation sector in the growing energy consumption. It not
surprising the GREET tool has played an important role in life cycle analysis. LCA using
GREET has been applied to common feedstocks such as crude oil, natural gas, biomass, nuclear,
fats and oils (Elgowainy et al., 2007). For example soybeans are one feedstock used to produce
biodiesel. Currently GREET is able to perform LCA for than 100 fuel production pathways using

12
different feedstocks and it is continually updated to seek alternative feedstocks suitable for
vehicle fuels (Elgowainy et al., 2007).
Organizations Supporting the GREET Software
While the US Department of Energy played the major role in GREET’s development and
its application in different fields in fuel research. Other organizations, however, have supported
the GREET’s software development and applications at Argonne National Laboratory in
different ways. Organizations behind the effort include:
DOE, which began to support GREET development and applications at Argonne in 1995;
General Motors Corporation (2000-05): produced two reports that are standard citation
sources used by auto and oil industry;
Illinois Department of Commerce and Economic Opportunities (1997-98, 2002-03): closely
worked with the ethanol industry and governmental agencies to examine ethanol’s energy
and environmental benefits;
Argonne’s results have changed the debate on ethanol at the U.S. Environmental Protection
Agency (2003-04, 06), GREET was incorporated into EPA’s MOVES model and is assisted
the EPA in its rule making of renewable fuel standards (Wu et al., 2007);
In-kind support from BP (2000-01), Chevron (2002-04), ExxonMobil (2000-01) and Shell
(2000-04); and
U.S. Department of Agriculture, since 1997 (Wu et al., 2007).
The GREET Software Structure
The GREET software is comprised of two main pieces: a graphical Visual Basic interface
and an Excel program. When the software is downloaded from the DOE website onto a computer
and starts to run, what you see on the screen as you proceed to the next page is the GREET GUI
in Visual Basic format. The GREET GUI interacts with the user to input or select options such as
the year the LCA is being conducted, the fuel pathway, type of fuel, etc. It is only this part of the
GREET software that the software user or the public has access for data input or option
selection. The second unit is the GREET 1.7 and its updated version GREET 1.8, which is a
spreadsheet program running in the background of the GREET GUI containing all the necessary
formulas and information from Argonne National Laboratory for computing energy use and

13
emissions. The public has no access to it; it can only be modified by Argonne National
Laboratory (Wang, 2007).
The GREET Software Sources of Data to Perform LCA
The GREET software depends on multiple data sources to perform life cycle analysis.
Information for GREET software came from the public literature, engineering analysis such as
ASPEN simulations, particularly for mass and energy balances. Stakeholders may provide
Argonne National Laboratory with process inputs on fuel type, fuel usage, system efficiencies,
and material and energy balances of the feedstock to fuel production.
Sources of information required for performing LCA with the GREET software can be
categorized into two main groups. Those data that requires Argonne National laboratory
personnel to enter into the GREET software and interpret the information received. This specific
information includes:
Yield – Usually presented as bushel of the harvested feedstock per acre of land used for
cultivation.
Energy Use - Energy used for cultivating and harvesting of the feedstock.
Fertilizer use – Use for feedstock farming from plant cultivation to the harvesting stage.
N2O Emissions – Contribute to green house gas emissions.
Insecticides- Used for pest and insect control, contribute material and energy balances and air
emissions.
Material and Energy balances of the feedstock extraction- This involves feedstock from its
raw state to extracting oil/fat and refinery.
Material and energy balances of the feedstock to biodiesel production - All processes
associated with converting the fat/oil into biodiesel.
Co-products – Credits for co-products in LCA to address the energy and emission burdens of
the primary products, especially when the co-products have value in the market place. For
example co–products in soybean biodiesel includes soy meal and glycerin.
A typical representation of values used by Argonne National Laboratory in performing
soybeans biodiesel LCA from a publication published on soybeans biodiesel LCA by Huo et al.
(2008) has the following data, and is presented in Table 3.2 and Table 3.3 in the next pages.

14
Soybean Biodiesel Data Input for GREET Software
The data in Table 3.2 represents GREET software input on soybeans biodiesel according
to a publication (Huo et al., 2008). It’s separated from Table 3.3 to indicate that only Argonne
National Laboratory personnel could enter it into the software. However, the data in Table 3.3
was obtained from running the GREET software for soybean biodiesel. The data appears in the
software as default values, which can easily be selected or modified by the software user. Prior to
1 lb soybeans oil extraction, 42.0 bushel of soybeans was used as a basis for the computation in
the inputs Tables.

15
Table 3.2 Soybeans Biodiesel LCA Inputs for GREET Software
Parameters Significance Soybeans Data
Yield Yield in bushel per acre. 42.0 bushel/acre
Energy Use Energy used in soybeans
farming to harvesting.
Total energy use is estimated to be
22,084 Btu/bu: 64% diesel, 18%
gasoline, 8% LPG, 7% natural gas,
and 3% electricity
Fertilizer Use
Fertilization of soybeans
farming.
Usage of fertilizer: 61.2 g/bu N,
186.1 g/bu P and 325.5g/bu K. The
total energy used per gram of
fertilizer produced are 45.9 Btu/g N,
13.29 Btu/g P and 8.42/g K
N2O N2O emissions from soybeans
farming contributing to GHG
emissions.
0.3-3% of N20 emission to the air.
Oil Extraction Soybeans are crushed; oil is
extracted and refined.
Input:
Soybeans (lb) = 5.7
Steam (Btu) = 2,900 (44.5%)
NG (Btu) = 2,800 (43.0%)
Electricity (Btu) = 614(9.4%)
N-hexane (Btu) = 205 (3.1%)
Total Energy (Btu) = 6,519 (100%)
Output:
Soy Oil (lb) = 1
Soy Meal (lb) = 4.48
Source: Huo et al. (2008).

16
Table 3.2 Soybeans Biodiesel LCA Inputs for GREET Software (Continued)
Parameters Significance Soybeans Data
Biodiesel
Production Transesterification process uses
alcohol (ethanol or methanol) in
the presence of a catalyst
(sodium hydroxide) to form
ethyl or methyl ester.
Inputs:
Soy Oil (lb) = 1.001
Methanol(lb) = 0.1001
NaOH(lb) = 0.0050
Sodium Methoxide (lb) = 0.0125
Hydrochloric acid(lb) = 0.0071
NG(Btu) = 888
Electricity (Btu) = 46
Outputs:
Biodiesel (lb) = 1
Glycerin (lb) = 0.116
Co-Products Soy meals and glycerin co-
products have applications
similar to soybeans and
conventional glycerin. Energy
and emission associated with
their processes would have to
be evaluated separately, in order
to reduce energy and emission
burdens of the primary product.
Soy meals: Displacement ratio of soy meal to
Soy beans is determined by protein content.
Soy meal contains 48% protein, and
soybeans contain 40% protein. Thus 1lb of
soy meal replaces 1.2 lb of soybeans.
Source: Huo et al. (2008)

17
Soybeans Biodiesel LCA User Input Data
In addition to the information in Table 3.2, which requires Argonne National Laboratory
assistance, Table 3.3 was generated from the GREET software default values. It allows interested
person running the GREET software the opportunity to alter the default data to a new set of data
readily available. This data appear in GREET GUI as the default values used by the Argonne
National Laboratory. If a user’s aim is to simulate an outcome with new data, then these data
must replace the default values already in the software. These user input data are generalized into
combustion technological shares, combustion efficiencies, fuel type shares and facility location
shares. Table 3.3 shown below detailed out specifics of the data within the GREET software to
yield an LCA for biodiesel production from soybeans.

18
Table 3.3 User Input and GREET Software Default Values for Soybeans Biodiesel LCA
Electricity generation Soy Beans Input
Marginal Electricity generation
U.S average
electricity for
Transportation and
Stationary use
Residual oil 2.7%
NG 18.9%
Coal 50.7%
Nuclear 18.7%
Biomass 1.2%
Others 7.7%
Advanced Power
Plants Technology
Shares
NG turbine combined cycle
technology share 44.0%
NG turbine simple-cycle
technology share 36.0%
Advanced coal technology
share 0.0%
Advanced biomass technology
share 0.0%
Nuclear Plants for
Electricity Generation Light water reactor(LWR)
Plants Tech. Shares
Gas Diffusion 25.00%
Centrifuge 75.00%
High temperature gas-cooled
reactor (HGTR) Gas Diffusion 25.00%
Centrifuge 75.00%
Biomass Power Plant
Feedstock Share
Woody Biomass Share 100.0%
Herbaceous Biomass Share 0.0%
Source: Wang, M.,Wu, Y., Elgowainy, A. , (2007)

19
Table 3.3 User Input and GREET Software Default Values for Soybeans and Biodiesel
LCA (Continued)
Fuel Production Assumptions
Residual Utility Boiler Efficiency 34.8%
NG Utility Boiler efficiency 34.8%
NG Simple Cycle Turbine Efficiency 33.1%
NG Combined Cycle Turbine
Efficiency 53.0%
Coal Utility Boiler Efficiency 34.1%
Biomass Utility Boiler Efficiency 32.1%
Advanced Biomass Power Plant
Efficiency 38.4%
Electricity Transmission and
Distribution Loss 8.0%
Energy intensity in HTGR reactors
(MWh/g of U-235) 8.704
Energy intensity in LWR reactors
(MWh/g of U-235) 6.926
Electricity Use of Uranium
Enrichment (KWh/SWU): Gaseous
Diffusion Plants for LWR electricity
generation 2,400
Electricity Use of Uranium
Enrichment (KWh/SWU): Centrifuge
Plants for LWR electricity generation 50.00
Electricity Use of Uranium
Enrichment (KWh/SWU): Gaseous
Diffusion Plants for HTGR electricity
generation 2,400
Electricity Use of Uranium
Enrichment (KWh/SWU): Centrifuge
Plants for HTGR electricity generation 50.00
Source: Wang, M.,Wu, Y., Elgowainy, A. , (2007)

20
The GREET Software Calculation Logic and Input Options
The GREET software estimates energy use and emissions associated with production of
biodiesel for LCA using the calculation logic described Figure 3.1 below. Thus, a user can
decide to maintain or change input parameters above the dotted lines in the diagram below
(emissions factors, combustion technology shares, energy efficiencies, fuel type shares, and
facility location share) if a new values are available. Different feedstocks other than soybeans
(e.g. shea butter) would require different material and energy balances at various stages of the
biodiesel production
The calculation logic used in the GREET’s LCA utilizes information from feedstock
farming and transportation, extraction of oil/fat, transesterification of oil/fat to biodiesel. Energy
use and emission rates are allocated between biodiesel and by-products according to the
displacement method. The calculation logic used for computing energy and emission rates is
shown in Figure 3.1 and consists of the following four sections:
Scenario control and key input parameters in this section derive primarily from the Inputs
sheet. Thus, this section is the interactive link between the Inputs sheet and biodiesel GREET
software.
The shares of combustion processes for each stage, which are used for emission calculations.
Calculation of energy use and emissions for individual stages. In this section, GREET
calculates energy use and emissions for each individual stage by considering energy and
material use, energy efficiency, fuel use by type, fuel use by combustion technology, etc.
Summary of energy use and emissions to generate an output results.

21
Figure 3.1 Calculation Logic for the GREET Software
Inputs:
………………………………………………………………………………………………………………………….
Computations:
Source: Elgowainy et al. (2007).
Explanation of Input Parameters
Emission Factors
Emission factors are values, usually available on the U.S. EPA database used to estimate the rate
at which a pollutant is released into the atmosphere (or captured) as a result of some process
activity or unit throughput. This sheet presents emission factors for individual combustion
technologies that burn various fuels. GREET uses these emission factors throughout the software
to calculate emissions associated with these combustion technologies (Elgowainy et al., 2007).
Combustion Technology Share
It represents a portion of combustion processes contributing to various stages of the production
process. This is usually determined on a pilot scale or practical operation of the biodiesel
production. The information in the table is classified into these categories.
Emission Factors Combustion
Technology Shares
Total Emissions
Energy
Efficiencies
Energy Use by
Fuel Type
Fuel Type Shares Facility Location Share
Urban Emissions

22
Energy Efficiencies
Energy efficiencies are associated with different fuels utilized in a biodiesel production process.
Different sources of energy would have varied efficiencies due to the nature of the fuel.
Fuel Type Share
The fuel type which in this case is biodiesel would have a market share. This value is usually in
percent. The input information presents the key assumptions for various fuel production
processes are presented. Since these parameters may change over time, lookup (time-series)
tables are developed for each parameter over the period from 1990 to 2020, in five-year intervals
(Elgowainy et al., 2007).
Facility Location Share
The facility location varies at different places of biodiesel production processes. For example a
location in an urban setting in Ghana would be different from a rural setting. Biodiesel
production and environmental regulation changes will be different at these locations (urban and
rural).
Running the GREET Software
The GREET software requires a computer system compatible with the software. Its GUI
is designed to run under Windows XP or Windows Vista along with Microsoft, EXCEL 2000,
EXCEL XP, EXCEL 2003 and EXCEL 2007. It is not compatible with the Macros operating
system. (Elgowainy, 2008).
After verifying that the computer system is compatible with the GREET software, the
software can be installed by downloading the files onto the computer to run both the GREET 1.8
and the GREET GUI. The main functions of the GREETGUI are to:
receive input from the user through option buttons, check boxes, and input text boxes;
communicate these inputs to an underlying Excel spreadsheet model (GREET); and
run the GREET software model in the background and subsequently display results in the
form of tables in another Excel output file (Elgowainy, 2008).

23
Once the software is installed, the GREETGUI would go through the main steps from
one session to another as shown in Figure 3.2. What each step accomplishes is explained in
Figure 3.3 in the same order in which the Figure 3.2 is presented. For example the first symbol in
Figure 3.2 is explained in Figure 3.3 as GREET software logo. The second phase of GREET
GUI represents “copyright and information screens appear”, explained in Figure 3.3 via the
second box and so on.
Figure 3.2 Screen Images of Main Steps
Source: A. Elgowainy, 2008. (Permission of ANL, UChicago Argonne, LLC for the U.S. DOE)

24
Figure 3.3 Schematic Explaining Figure 3.2
Source: A. Elgowainy, 2008
Output of the GREET Software LCA
The final result is generated in tabular format. The result represents Well-To-Pump
(WTP) total energy and emissions associated with different stages involved in converting
fats/oils into biodiesel. The LCA results generated have significant practical impart in making
decisions involving reducing green house gas emissions and reducing carbon foot print. Decision
makers become better informed about products or services with access to LCA result.
An example of WTP output result of soybeans biodiesel generated from Tables 3.2 and
3.3 input data using the 2010 information is depicted in Tables 3.4 and 3.5. Appendix B has
Table B.1 as the original version of the result from which Tables 3.4 and 3.5 were generated, and
classified into energies and emissions, respectively. Total energy (193,718 Btu) represents
combined energies utilized, in the form of fossil fuels, 190,215 Btu (coal, NG and petroleum)
plus renewable energy (wind, solar, biomass, nuclear, hydro energy). The difference between the
Copyright and
information
screens.
GREET
software logo
Fuel production
pathway.
Year(s) to be simulated
and fuel type selection
(e.g. biodiesel).
Feedstock (GREET’s
database), production
,and fuel market shares.
Outputs files of energy
use and emission rates.
Review of key
assumptions for fuel
production.
Fuels blend (mixing)
options, including fuel
blending with or
without petroleum
diesel.
25
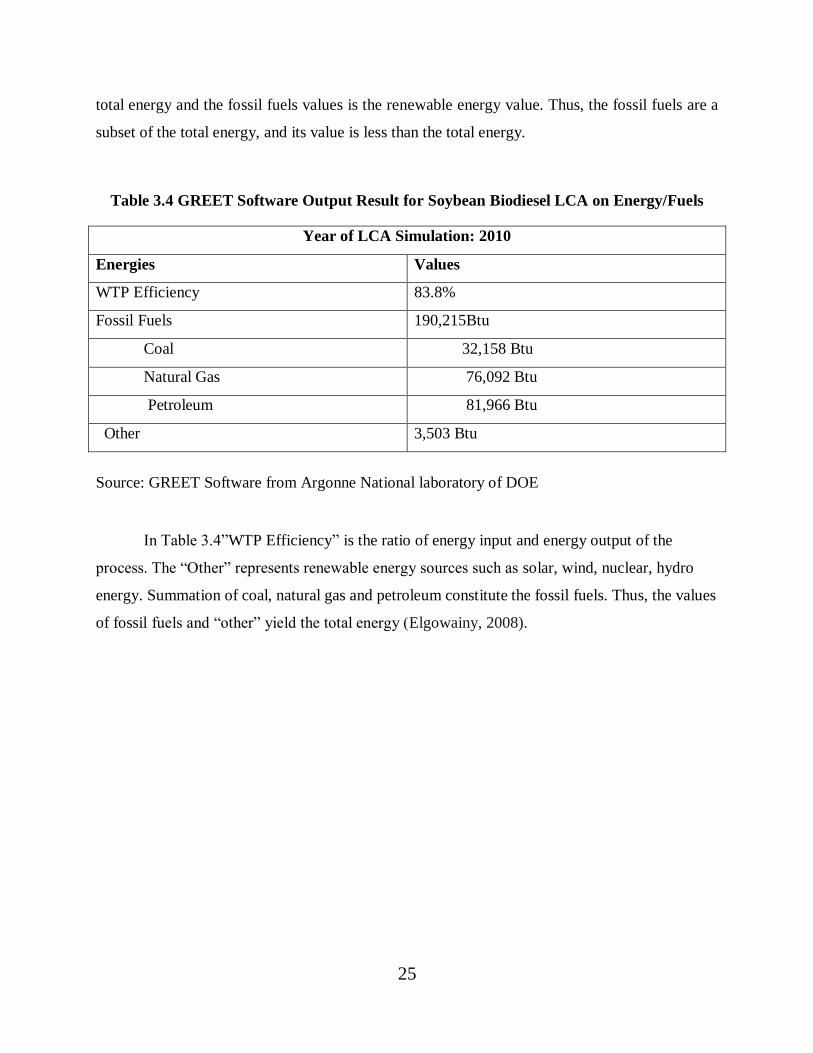
total energy and the fossil fuels values is the renewable energy value. Thus, the fossil fuels are a
subset of the total energy, and its value is less than the total energy.
Table 3.4 GREET Software Output Result for Soybean Biodiesel LCA on Energy/Fuels
Year of LCA Simulation: 2010
Energies Values
WTP Efficiency 83.8%
Fossil Fuels 190,215Btu
Coal 32,158 Btu
Natural Gas 76,092 Btu
Petroleum 81,966 Btu
Other 3,503 Btu
Source: GREET Software from Argonne National laboratory of DOE
In Table 3.4”WTP Efficiency” is the ratio of energy input and energy output of the
process. The “Other” represents renewable energy sources such as solar, wind, nuclear, hydro
energy. Summation of coal, natural gas and petroleum constitute the fossil fuels. Thus, the values
of fossil fuels and “other” yield the total energy (Elgowainy, 2008).
26
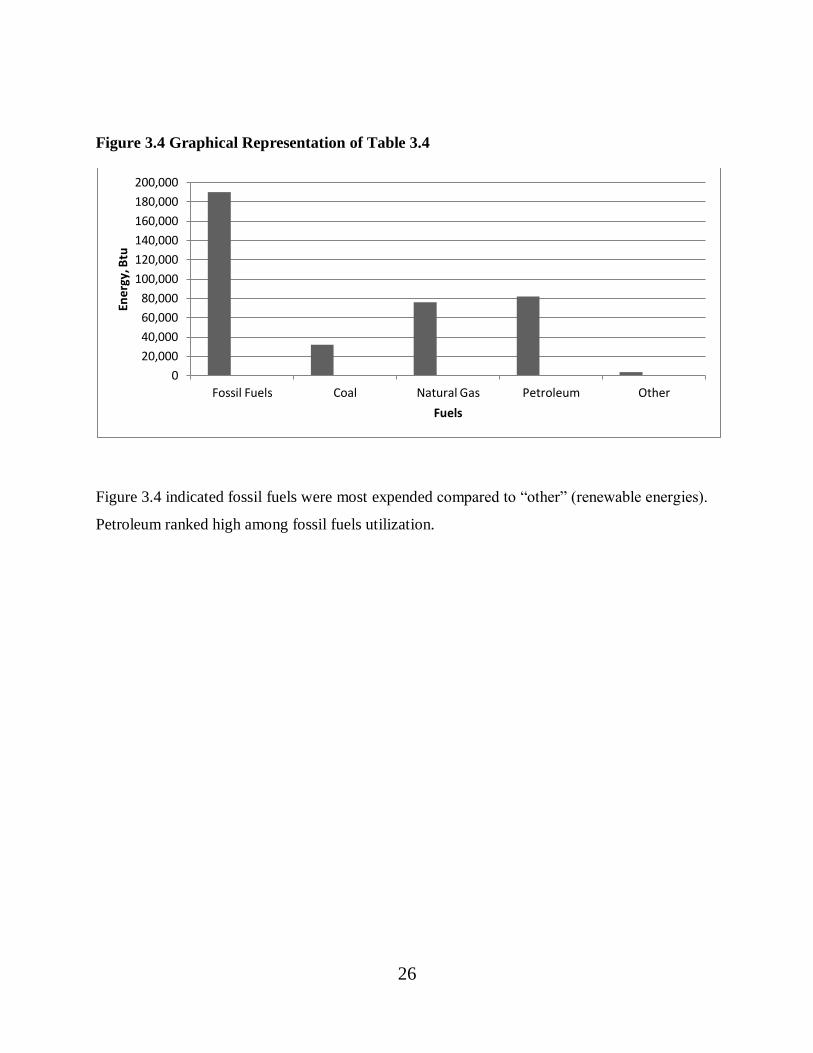
Figure 3.4 Graphical Representation of Table 3.4
Figure 3.4 indicated fossil fuels were most expended compared to “other” (renewable energies).
Petroleum ranked high among fossil fuels utilization.
0
20,000
40,000
60,000
80,000
100,000
120,000
140,000
160,000
180,000
200,000
Fossil Fuels Coal Natural Gas Petroleum Other
Ene
rgy,
Btu
Fuels

27
Table 3.5 GREET Software Output Result for Soybean Biodiesel LCA on Emissions
Year of LCA Simulation: 2010
Emissions Values
Green House Gases (GHG)
GHGs 18,175 g/mmBtu
CO2 (w/ C in VOC & CO) 15,488 g/mmBtu
CH4 104.527 g/mmBtu
N2O 0.248 g/mmBtu
Six Criteria Pollutants
VOC: Total 7.774 g/mmBtu
CO: Total 12.630 g/mmBtu
NOx: Total 42.768 g/mmBtu
PM10: Total 8.676 g/mmBtu
PM2.5: Total 3.470 g/mmBtu
SOx: Total 20.615 g/mmBtu
VOC: Urban 2.990 g/mmBtu
CO: Urban 3.412 g/mmBtu
NOx: Urban 9.233 g/mmBtu
PM10: Urban 1.603 g/mmBtu
PM2.5: Urban 0.932 g/mmBtu
SOx: Urban 6.588 g/mmBtu
Source: GREET Software from Argonne National laboratory of DOE
The units for the emissions values in Table 3.5 are in g/mmBtu (grams per million British
thermal Units). GHGs value is the total including CO2, CH4, N2O plus other unreported GHG
gases. Thus, the total value for GHGs is more than the summation of CO2, CH4, N2O gases. The
six criteria pollutants are divided into total emissions consisting of urban emissions and non-
urban emissions. The total emissions represent the entire process for the six criteria pollutants

28
(VOC, CO, NOx, PM10, PM2.5 and SOx). Urban emissions are therefore a subset of the total
emissions.
Table 3.5 shows that carbon dioxide (CO2) and green house gases (GHG) are
predominant emissions from the soybeans biodiesel LCA.

29
Chapter 4 - Life Cycle Analysis (LCA) System Boundaries
Life cycle analysis (LCA) is an approach frequently employed to evaluate environmental
aspects and potential impacts associated with products, processes and services in different fields.
Application of LCA on products requires a compressive understanding of both the upstream and
downstream of the processes involved in achieving the end products. The results of LCA
techniques have proven useful in furnishing documents as part of decision-making towards
sustainability and green initiatives.
The International Organization of Standardization (ISO), a world wide body federation of
natural standard bodies has standardized this framework with the ISO 14040 and 14043.
According to the ISO standards, an LCA is carried out in four distinct phases: Goal and Scope,
LCA Inventory, LCA Impact Assessment and Interpretation.
Some common terms used often in the LCA applications are Well-to-Pump; Well-to-
Wheels, etc., on a specific defined LCA scope. Well-to-Pump is a specific LCA involving the
conversion of feedstocks beginning at the well or other sources to fuels to the fueling station.
Well-to-Wheels LCA is used for LCA of feedstock conversion into fuel and finally utilization in
transportation vehicles.
Goal and Scope of the LCA Study
The goal and scope of an LCA describes the system to be studied. For this report, the
objectives of this particular study were to identify and quantify energy used and emissions
associated with processes involved producing biodiesel from shea butter in Ghana. Through this
study, it will seek to identify activities that are not performing sustainably and then suggest
improvement options or impact reduction strategies towards the sustainability of the system
studied. The results of such a study could be used by the AIBP in Ghana, scientists, stakeholders,
in decision-making to improve the shea butter biodiesel production industry and other. The
system being studied is sub-divided into five main stages as described in Figure 4.1 in the next
pages.
LCA Functional Unit
Life cycle analysis (LCA) is a relative approach, which is structured around a functional
unit. This functional unit defines what is being quantified (ISO 14040, 1997). For this study, the

30
functional unit chosen was 44.1 lb of shea nuts. The shea butter value of 44.1 lb is included in
the data provided by AIBP Ltd. All the inputs and outputs in the life cycle processes focus on the
functional unit to produce the end result.
Life Cycle Inventory (LCI) Analysis
The life cycle inventory (LCI) analysis segment is the second phase of LCA. It is an
inventory of input/output data with regard to the system being studied. Every stage in the system
process from the cultivation of the shea plant; harvesting of the shea nuts; extraction of the shea
butter and subsequent biodiesel production would have inputs and outputs. The information
collected constitutes the inventory analysis. The inventory analysis consists of two major steps:
data collection and data analysis.
Data Collection
Data for shea butter biodiesel production starting with shea plant cultivation was obtained
from biodiesel producers in Ghana called Anuanom Industrial Bio Products Ltd. (AIBP) and the
literature. A summary of the data collection to be used for the LCA will be presented in Tables
5.1 and 5.2 respectively.
Data Analysis
The data collected would have to be analyzed for accuracy before being used for an LCA.
In this case errors are minimized from the outset and throughout the various stages. Knowing
that reliability of the final LCA output depends on the data analysis. It also makes it easier to
identify missing information required to perform the LCA.
Life Cycle Impact Assessment
This step calculates the likely human and ecological effects of material consumption and
environmental releases identified during the inventory analysis. Classification and
characterization following the ISO 14042 (2000) guidelines would be applied to the inventory
data in order to assess their potential impacts on the environment. According to these guidelines,
four optional elements, namely, normalization, valuation, grouping and data quality analysis may
be included in the impact assessment. However, this study will focus on a Well-to-Pump of shea
butter biodiesel LCA of energy utilized and emissions released per the defined goal and scope. It
will not relate the four optional environmental impact criteria mentioned above.

31
Interpretation
The fourth stage of the LCA seeks to interpret the results obtained from the LCA analysis
generated by an LCA. Ambiguous interpretation has the consequence of obscuring the intent of
the study and from a reasonable outcome. For a shea butter biodiesel LCA would require rational
interpretation of energy and emissions associated with the study meaningfully.
Discussion of life cycle analysis definition, structure and components, importance of
LCA, applications of LCA and numerical illustration an LCA can be found in Appendix A.
Stages in Shea Butter Biodiesel LCA Boundaries
AIBP Ltd. in Ghana, West Africa, had begun producing biodiesel from shea butter to
serve the need for the quest for alternative fuels. Communication with AIBP Ltd. concerning
biodiesel production in Ghana revealed the various stages employed in making shea butter
biodiesel.
Figure 4.1 depicts the LCA boundaries defined the LCA boundaries for the GREET
analysis reported herein. The life cycle analysis of shea butter biodiesel is divided into five
stages:
1. Shea nut farming
2. Shea nut transportation to shea butter extraction site
3. Shea butter extraction
4. Shea butter transesterification
5. Biodiesel Transportation to fuel pump station

32
Figure 4.1 Stages in Shea Butter Biodiesel LCA Boundaries
Shea butter farming stage
Shea Nuts Farming
Producing shea butter begins at the farming stage where the shea plants are cultivated in
large trails of land. The shea plants are nurtured at the early stages of growth. The application of
insecticide, fungicides and irrigation methods ensure progressive development until the plants
reach sufficient maturity to bear fruit. Though the plant is resistance to many diseases, extra care
is taken to provide the right conditions for the plant to thrive. Material and energy balances are
accounted in this stage regarding fertilizer, fungicides, and fuel used to assist in LCA analysis.
Shea Nuts Transportation
When the shea fruits mature, the color of the fruits turns into orange. If the shea fruits hang
on their trees without timely harvesting, the orange color changes and then to deep orange and
the to dark brown. The shea fruit is harvested in small groups onto the ground and is later
Shea Nut Farming: Cultivation, fertilizer and
pesticides applications, machinery use, manpower.
Shea Nut Transportation: Harvest to processing
site, vehicle operation.
Shea Butter Extraction: Removing husk, drying
nuts, roasting nuts, pressing oil, boiling to separate
impurities, decanting to refine shea butter.
Shea Butter Transesterification: Conversion of
shea butter to biodiesel employing methanol and
NaOH.
Biodiesel Transportation to Fuel Station: Biodiesel
produced is transported via trucks.
33
gathered together in mountain-like heaps. In this way fruit is not scattered across the farm, which
is tedious to gather together without loses. Manpower is utilized to assist loading the shea fruits
on trucks. They are transported to a processing location where the husks or outer coverings are
removed, and the nuts are dried for the next stage.
Shea Butter Extraction The shea shea nuts after harvest are gathered together and dried in the open air and sun for
days, with the time depending on the atmospheric temperature and humidity. Some farmers use
forced heated air to dry the shea nuts because it’s quicker and does not depend on the weather
conditions. The outer cover of the dried shea fruit is removed and the nuts roasted in an oven for
about 30 minutes at 80oC while monitoring the color changes and smell. A fat extraction unit
crushes and presses the dried shea nut to force the butter from the fiber into a crude dark brown
fat. The fat is boiled with water several times to remove particulate matter. Color is removed via
addition of a small amount of color removing agent. The entire content of fat is filtered to
eliminate any residual particulates present. Afterwards, the shea butter obtained is refined before
the tranesterification process.
Shea Butter Transesterification This is the critical stage bringing together different substances of shea butter, catalysts,
methanol to produce biodiesel through a chemical reaction process called transesterificaion. The
reaction proceeds to completion to yield biodiesel with glycerin as a co-product. Reactors,
distillation columns, liquid extraction unit and holding tanks are required at various stages. A
significant amount of water is employed in separating biodiesel from glycerin. Additional
information on shea butter transesterification can be found in chapter 2.
Biodiesel Transportation to Fuel Pump Station
The last stage of the biodiesel LCA boundary deals with transportation of biodiesel
produced to respective designations at the pump stations. It is at the pump stations that vehicles
can have access to it. It is anticipated that trucks will be used to carry the biodiesel. Trucks
depend on fuel for conveying biodiesel to pump stations, which in turn generates emissions.

34
Chapter 5 - LCA of Biodiesel Production from Shea Butter Using
the GREET Software.
The GREET software is a great tool for performing LCA on different fuel feedstocks
including biodiesel, Argonne National laboratory has successfully used it in many different
applications. This report seeks to employ the GREET software to perform biodiesel life cycle
analysis using shea butter as a feedstock. Prior to utilizing the software to perform the LCA, all
the requisite data/information for the software must be readily available. This chapter is focused
on gathering relevant data to perform a meaningful LCA of biodiesel production from shea
butter.
There is not much information available in the literature because shea butter biodiesel is
not widely known. Most academic and reference books speak little about the subject. After
collecting all the data, some of it would have to be forwarded to Argonne National Laboratory
for its entry into the GREET software. The other shea better biodiesel data meant for the GREET
GUI (GREET’s user interface) would not necessary require Argonne National Laboratory to
input the data, because the user can input these data directly. However, for initial debut of shea
butter biodiesel LCA in the GREET software, it might be beneficial for Argonne National
Laboratory personnel to input both sets of data.
Data for Computing Shea Butter Biodiesel LCA
In Ghana, West Africa, an emerging producer of biodiesel from shea butter known as
Anuanom Industrial Bio Products Ltd. (AIBP) is exploring alternative commercial uses of shea
butter. Through phone communications with the AIBP, I requested the information required for
performing shea butter LCA using GREET software, the parameters in Tables 5.1 and 5.2 in the
next pages. The parameters stated in the two tables represent the requirements to perform
GREET software LCA on a biodiesel system. They are parallel to soybeans biodiesel LCA input
in previous GREET database studies.
Information exhibited in Table 5.1 is obviously unique because it was directly received
from AIBP, based on three years (2007, 2008 and 2009) of average operation. Biodiesel
production is mainly carried out batch process so that they can have better oversight of
individual activities. Therefore, small quantities of raw materials have been utilized. Units

35
associated with information in Table 5.1 are in acres, bushels (bu), pounds (lb) and British
thermal units (Btu). The metric system of measurement is often used in Ghana for most
industries. However, it was communicated to the company that the GREET uses imperial units
and information should have imperial units.
Data Requiring Argonne National Laboratory Entry
The significance of each parameter in Table 5.1 is briefly explained via the background
information in column 2. Data received from the AIBP Ltd. appears in column 3. These are
yield, energy use, shea butter extraction inputs and outputs, and biodiesel inputs and output. A
yield of 174.24 is the ratio of shea nuts harvested prior to fat extraction and shea nuts planted
during cultivation. Three different energy sources (gasoline, diesel, and electricity) were used in
shea nuts farming activities and are partitioned into respective percentages based on total fuel
usage. The total energy used in Btu appears in the table, making it easier to compute individual
energies. Shea butter extraction derives from using a basis of 44.1 lb of shea nuts to produce
17.64 lb output as shea butter. The sources of energies employed in shea butter extraction are
steam, natural gas (NG), and electricity. Other energy sources unrelated to aforementioned
energies are designated as “Other”.
Transformation of fat extraction into shea butter biodiesel begins with 17.64 lb of shea
butter produced. Materials of methanol, sodium hydroxide and sulfuric acid together with NG
and electricity constituent the initial inputs for the biodiesel production. The specific quantities
assigned to each material used in the process are based upon data received from AIBP. Detailed
explanation of transesterification processes and functions of each material appear in the
preceding chapters. Data lacking in AIBP information provided are addressed in the next pages
entitled “AIBP Missing Data Substitution”. Incomplete data for the shea butter obviously hinders
performing LCA with the GREET software.

36
AIBP Ltd. Missing Data Substitution
Efforts have been made to provide the missing data lacking in the AIBP’s information in
Tables 5.1 and 5.2. The rational for substitution these missing data are clearly addressed in the
following sections.
Fertilizer Use in Shea Plant Cultivation
Fertilization of shea butter farming usually occurs at the seedlings and transplanting
stages, and an estimated 2 mg N and 6.4 mg P kg-1
soil per plant were used (Mahamadi et al.,
2009). Caroline (2009) reported 230 trees occupy a hectare (2.471 acres). From Table 5.1, the
yield of the shea nut is 174.24 bushel per acre, implies 186mg N and 5957.1 mg P fertilizer were
required for the shea nut farming. Huo et al., (2008) reported energy used for producing fertilizer
is 45.9 Btu/g N and 13.29 Btu/ g P.
N20 Emission
Emission of N2O depends on quantity of fertilizer used (2 mg N and 6.4 mg P kg-1
).
These amounts are very small compared to soybeans fertilization. Therefore the amount of N2O
that would be released is estimated close to 0.1%, compared to soybean fertilization of 186.1g/bu
P and 61.2g/bu N used beyond seedlings and transplants (Huo et al., 2008).
Co-products
The objective of calculating the credit allotted for co-products in life-cycle analysis in
order to fairly address the energy and emission burdens of the primary product, especially when
the co-products have value in the marketplace (Wang et al., 2005). In addressing shea butter
meal and glycerin co-products, shea butter meal is found application similar to shea butter, and
glycerin’s application is comparable to conventional glycerin. Their energy and emission
burdens would be different and they have to be evaluated separately.
Natural Gas (NG) and Residual Oil
Natural gas and oil contribute to fuel sources in Ghana. For transportation and stationary
sources, approximately 45% from residual oil and 5% from natural gas (Ernest, 2005).

37
“Other” Sources of Energy
In addition to fossil fuels, other sources of energy in the GREET’s input involve
renewable energies such as wind, solar, biomass, hydro energy, nuclear. Ghana depends on
hydro energy intermittently due to fluctuating water reservoir levels. When operational it
accounts for nearly 45-55% of the Ghana’s energy needs (Ernest, 2005).
NG Turbine Combined Cycle Technology Share/NG Turbine Simple Cycle Technology Share
Simple and combined cycles operate on natural gas to provide substantial industrial
energy use in Ghana. However, not many of these systems operate compared to the United States
simple and combined cycles. It would be reasonable to assign 30% and 25% to NG combined
and simple cycles, lower than that of the United States.
Residual Utility Boiler Efficiency / NG Utility Boiler Efficiency / NG Simple Cycle Turbine
Efficiency / NG Combined Cycle Turbine Efficiency / Electricity Transmission and
Distribution Loss
Electricity transmission and distribution loss in Ghana is reported as 14% (Ernest, 2005).
Barney et al. (2003) and O’Callaghan (1981) provided low and high values efficiencies for
Residual Utility Boiler Efficiency 30-38%, NG Utility Boiler Efficiency 30-38%, NG Simple
Cycle Turbine Efficiency 28-40%, and NG Combined Cycle Turbine Efficiency 45-58%. Lower
to average ranges of efficiencies mentioned above would suffice for the GREET input.

38
Table 5.1 Shea Butter Biodiesel Input Data for Argonne National Laboratory Entry
Parameters Significance Shea Butter Data
Yield
Yield is bushel per acre. 174.24 bushel/acre
Energy Use Energy used in soybean farming to
harvesting.
Total energy used is estimated
to be 110,000 Btu/bu: 50%
diesel, 30% gasoline and 20%
electricity.
Fertilizer Use Fertilization of soybeans farming. Total fertilizer application is
186mg N and 5957mg P.
Energy used is 45.9 Btu/g N
and 13.29Btu/g P.
Nitrogen Dioxide, N2O N2O emissions from soybeans
farming contributing to GHG
emissions.
0.08%
Fat (Shea Butter)
Extraction
Soybeans are crushed; oil is extracted
and refined.
Input:
Shea nuts (lb) = 44.1
Steam (Btu) = 14,500
NG(Btu) = 14,000
Electricity (Btu) = 3070
Other (Btu) = 1030
Total Energy(Btu) = 33,100
Output:
Shea butter (lb) = 17.64
Shea butter Meal (lb) = 26.0
Source: 3-year average data from Anuanom Industrial Bio Products Ltd. (AIBP)

39
Table 5.1 Shea Butter Biodiesel Input Data for Argonne National Laboratory Entry
(Continued)
Parameters Significance Shea Butter Data
Biodiesel Production Transesterification process use
with alcohol (ethanol or methanol)
in the presence of catalyst (sodium
hydroxide) to form ethyl or methyl
ester
Inputs:
Shea butter (lb) = 17.64
Methanol (lb) = 2.94
NaOH(lb) = 0.1764
Sulfuric acid (lb) = 0.0882
NG(Btu) = 14,208
Electricity (Btu) = 782
Outputs:
Biodiesel (lb) = 16.758
Glycerin (lb) = 0.602
Co-Products
Soy meals and glycerin co-
products have applications similar
to soybeans and conventional
glycerin. Energy and emission
associated with their processes
would have to be evaluated
separately, in order to reduce
energy and emission burdens of
the primary product.
0.0%
Source: 3-year average data from Anuanom Industrial Bio Products Ltd. (AIBP)

40
User Input Data on Shea Butter Biodiesel LCA
Argonne National Laboratory Personnel need to enter the aforementioned data in Table
5.1 into the GREET Software. On the contrary, Table 5.2 data can be entered directly by anyone
running the software. This table mainly deals with various systems employed to produce energy
for biodiesel production. Accounting for electricity producing systems through their shares and
efficiencies, enable emissions generated in the processes to be fully accounted for by the GREET
software. Thus, the GREET incorporates energy sources and technologies into its software.
Energy production from nuclear, biomass and coal have not matured into full scale
industrial commercialization in Ghana and provide no industrial or domestic energy supply. The
shea butter biodiesel producing company in Ghana does not utilize such energy sources.
Logically, identifying these input parameters as ‘not application’ is justifiable. However, for the
purpose of clearly indicating the full range of parameters appearing in the GREET software,
these were shown in the first column.
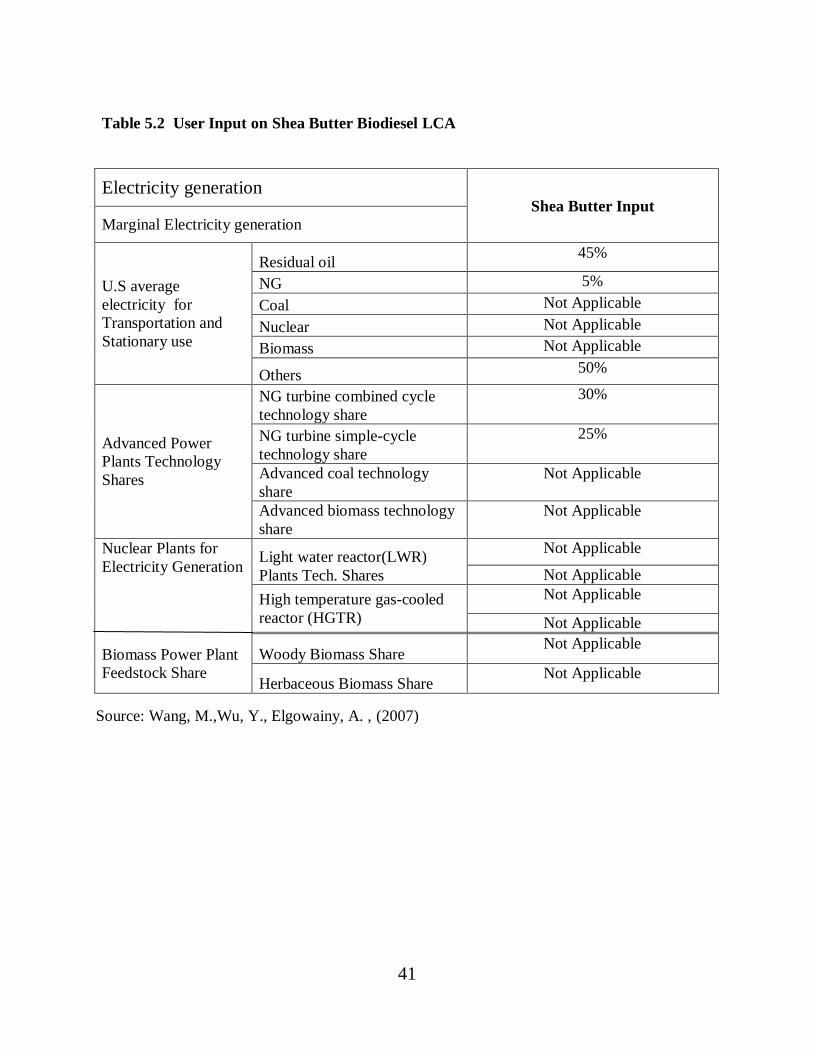
41
Table 5.2 User Input on Shea Butter Biodiesel LCA
Electricity generation Shea Butter Input
Marginal Electricity generation
U.S average
electricity for
Transportation and
Stationary use
Residual oil 45%
NG 5%
Coal Not Applicable
Nuclear Not Applicable
Biomass Not Applicable
Others 50%
Advanced Power
Plants Technology
Shares
NG turbine combined cycle
technology share
30%
NG turbine simple-cycle
technology share
25%
Advanced coal technology
share
Not Applicable
Advanced biomass technology
share
Not Applicable
Nuclear Plants for
Electricity Generation Light water reactor(LWR)
Plants Tech. Shares
Not Applicable
Not Applicable
High temperature gas-cooled
reactor (HGTR)
Not Applicable
Not Applicable
Biomass Power Plant
Feedstock Share
Woody Biomass Share Not Applicable
Herbaceous Biomass Share Not Applicable
Source: Wang, M.,Wu, Y., Elgowainy, A. , (2007)

42
Table 5.2 User Input on Shea Butter Biodiesel LCA (Continued)
Fuel Production Assumptions
Residual Utility Boiler Efficiency 32%
NG Utility Boiler efficiency 32%
NG Simple Cycle Turbine Efficiency 28%
NG Combined Cycle Turbine Efficiency 47%
Coal Utility Boiler Efficiency Not Applicable
Biomass Utility Boiler Efficiency Not Applicable
Advanced Biomass Power Plant Efficiency Not Applicable
Electricity Transmission and Distribution Loss 14%
Energy intensity in HTGR reactors (MWh/g of U-
235)
Not Applicable
Energy intensity in LWR reactors (MWh/g of U-235) Not Applicable
Electricity Use of Uranium Enrichment
(KWh/SWU): Gaseous Diffusion Plants for LWR
electricity generation
Not Applicable
Electricity Use of Uranium Enrichment
(KWh/SWU): Centrifuge Plants for LWR electricity
generation
Not Applicable
Electricity Use of Uranium Enrichment
(KWh/SWU): Gaseous Diffusion Plants for HTGR
electricity generation
Not Applicable
Electricity Use of Uranium Enrichment
(KWh/SWU): Centrifuge Plants for HTGR electricity
generation
Not Applicable
Source: Wang, M.,Wu, Y., Elgowainy, A. , (2007)

43
Chapter 6 – Conclusion
Information gathered on shea butter’s physical and chemical characteristics demonstrates
that it can effectively be used to produce shea butter biodiesel via homogeneous
transesterification reaction. However, because shea butter has a higher free fatty acid content as
compared to other biodiesel feedstocks, such as soybeans, an acid catalyst followed by an alkali
catalyst are being employed in the transesterification reaction. Application of an acid catalyst is
an important step to ensure that shea butter is successfully converted to biodiesel.
Relevant information relating to the LCA boundary conditions, starting from the shea
nuts farming to the production of biodiesel was obtained. Some data were unavailable from the
AIBP’s sources and could not provide information for this report. Missing data were derived
from other sources to fulfill the requirements for the LCA.
Obviously, information furnished in this report is a complete lists of input parameters the
GREET software would require to execute biodiesel LCA. The completed data demanded by the
software is clearly defined in Tables 5.1 and 5.2. Table 5.1 data would have to be forwarded to
the Argonne National Laboratory personnel to enter into the GREET software. However, Table
5.2 data is enterable in the software by anyone. Until these set of data discussed in the two
Tables are successfully introduced into the GREET software, shea butter biodiesel LCA result
would hardly be produced.

44
Chapter 7–Future Work
Generating an output result of biodiesel from shea butter should be the primarily
objective in future, in order to determine its socio-economic benefits and environmental impacts.
Efforts should be made to collaborate with the GREET Argonne National Laboratory personnel
to assist with entering the data mentioned in chapter 5. If the output result is produced from the
GREET software, it would have to be presented to convey meaningful thoughts about the
report’s objective. Without properly looking at individual output parameters to interpret the
significance of the result, it would hardly realized the important of this study and the potential
environmental burden.
Previous biodiesel LCA in the GREET accounts for the co-products to reduce the
environmental impacts of the primarily product(s). Biodiesel from shea butter has two co-
products, shea meal and glycerin. The shea meals resulted from extraction of shea butter from
the shea kernels, while glecerin is produced from a transesterification reaction. Evaluation of
these products to access equivalent amounts deemed acceptable would improve the overall
output result.

45
References
Anna Karin Jönbrink, IVF Camilla Wolf-Wats, IVL,Maria Erixon, CPM Pär Olsson, SIK Erik
Wallén, SIK. (2000). “IVL Software Survey IVL Report”. B1390 7 IVL Report No. B
1390.
Ahmed, I., Decker, J., and Morris, D. (1994). “How Much Energy Does It Take to Make a
Gallon of Soydiesel?” Prepared for the National Soy Diesel Development Board. 22-56.
Adomako, D. (1982). Prospects for the Development of the Shea Nut Industry in Ghana.
Cocoa Research Institute, Ghana, Technical Bulletin No. 7.
Brinkman, N., Wang, M., Weber, T., and Darlington, T. (2005). “GM Study: Well-to-Wheels
Analysis of Advanced Fuel/Vehicle Systems – A North American Study of Energy Use,
Greenhouse Gas Emissions, and Criteria Pollutant Emissions.” No. 2.
Barney L. Capehart, Wayne C Turner, William J. Kennedy. (2003). Guide to Energy
Management. Fouth Edition. 257-383.
Collins, K. (2007). The New World of Biofuels: Implications for Agriculture and Energy,
Presented at EIA Energy Outlook, Modeling, and Data Conference, March. Washington
D.C.
Caroline Carette, Mayumi Malotaux, Mirjam van Leeuwen, Mirjam Tolkamp.(2009). Shea Nut
and Butter in Ghana Opportunities and Constraints for Local Processing. 13-44.
Canakci, M., Van Gerpen, J. (2001). “Biodiesel Production from Oils and Fats with High Free
Fatty Acids”. Transactions of the ASAE 44, 1429–1436.
Consoli, F., Allen, D., Boustead, I., Fava, J., Franklin, W., Jensen, A.A., et al. (1993). “A
Code of Practice. Guidelines for Life-Cycle Assessment. Pensacola, USA: SETAC”
Canakci, M., Van Gerpen, J. (2003). “A Pilot Plant to Produce Biodiesel from High Free Fatty
Acid Feedstocks.” Transactions of the ASAE 46, 945–954.
DeMoss, S. (2001). “Horticultural Information on the Shea Nut Tree.” USAID R&RS Service
Project, 1-3.
EIA (Energy Information Administration). (2007). Annual Energy Outlook 2007,
U.S. Department of Energy, available at http://www.eia.doe.gov/oiaf/aeo/, accessed Nov.
2007.
Elgowainy, A. (2008). “Introduction to GREET 1.8 Excel Model”. Center for Transportation
Research, Argonne National Laboratory, 4-9.

46
Ernest Aryeetey. (2005). “Guide to Electric Power in Ghana”. Resource Center for Energy
Economics and Regulation Institute of Statistical, Social and Economic Research
University Of Ghana, Legon. 21-30.
Elgowainy, A. (2008). “Introduction to GREET 1.8 Graphical User Interface.” Center for
Transportation Research. Argonne National Laboratory, 3-43.
Energy Information Administration, EIA. (2007). Annual Energy Outlook 2007, DOE/EIA-
0383(2007), Available at http://www.eia.doe.gov/oiaf/aeo/pdf/0383(2007).pdf, accessed
May 23, 2007.
Fukuda H, Kondo A, Noda H. (2001). “Biodiesel Fuel Production by Transesterification of
Oils”. J Biosci Bioeng, 92, 405–16.
Frankl, P., Rubik F. (2000). “Life Cycle Assessment in Industry and Business”. Berlin: Springer-
Verlag.
Harding, K.G., Dennis, J.S., von Blottnitz, H., Harrison, S.T.L. (2007). “A life-Cycle
Comparison between Inorganic and Biological Catalysis for the Production of Biodiesel.”
Journal of Cleaner Production 16, 1368-1378.
Huo, H.,Wang, M., Bloyd, C., Putsche, V. (2008). “Life-Cycle Assessment of Energy and
Greenhouse Gas Effects of Soybean-Derived Biodiesel and Renewable Fuels.” Energy
System Division.
International Standard ISO 14001.(1996). Environmental Management Systems—Requirements
with Guidance for Use.
International Standard ISO 14040. (1997). Environmental Management—Life Cycle,
Assessment Principles and Framework.
International Standard ISO 14041. (1998). Environmental Management—Life Cycle
Assessment—Goal and Scope Definition and Inventory Analysis.
International Standard ISO 14042.(2000). Environmental Management—Life Cycle
Assessment—Life Cycle Impact Assessment.
International Standard ISO 14043. (2000). Environmental Management—Life Cycle
Assessment—Life Cycle Interpretation.
International Standard ISO 14048. (2001). Environmental Management—Life Cycle
Assessment—Data Documentation Format.
International Standard TR ISO TR 14062. (2002).Environmental Management—Integrating
Environmental Aspects into Product Design.

47
Mensah, S.A. (2010). “Jatropha Oil Production as Biofuel for Shea Butter Processing Machine in
Ghana:Quality Characteristics and Storability of the Derived Shea Butter”. Master of
Philosophy Food Science Thesis.
Mahamadi Dianda, Jules Bayala, Tahir Diop, Sibiri Jean Ouédraogo. (2009). Improving Growth
of Shea Butter Tree Seedlings Using Mineral N, P and Arbuscular Mycorrhizal (AM)
Fungi. Biotechnol. Agron. Soc. Environ. 2009 13(1), 93-102
Ntiamoah, A., Afrane, B.(2007). “Environmental impacts of cocoa production and processing in
Ghana: life cycle assessment approach”. Chemical Engineering Department, Kwame
Nkrumah University of Science & Technology, Kumasi, Ghana. November Issue.
O’ Callaghan, P. W. (1981). Design and management for Energy Conservation. A handbook for
Energy Managers, Plant Engineers and Designers’. 101-222.
Pennington, D.W., Potting, J., Finnveden, G., Lindeijer, E., Jolliet, O., Rydberg, T., et al. (2004).
“Life Cycle Assessment—PART 2: Current Impact Assessment Practice. Environ Int”.
Ranganathan, S.V., Narasimhan, S.L.(2007). “An Overview of Enzymatic Production of
Biodiesel”. Bioresource Technology 99, 3975-3981. 23-45.
Robin Murphy (2003). “Eaeth Trends – The Environmental Information Portal”. p. 1-6.
Ronnie, A. (2010). Business Times African Magazine. March edition, BT.
Ramadhas, A.S., Jayaraj, S., Muraleedharan, C. (2005). “Biodiesel Production from High FFA
Rubber Seed Oil”. Fuel 84, 3354-3366.
Rebitzer, G.(2002). Integrating Life Cycle Costing and Life Cycle Assessment for Managing
Costs and Environmental Impacts in Supply Chains. Cost Management in Supply Chains.
Heidelberg: Physical, p. 128– 46.
Rebitzer, G., Hunkeler, D.(2002). Simplifying Life Cycle Assessment—A Comparison of
Methods. Proceedings of the SETAC Annual Meeting in Vienna, Austria, May 12– 16.
Brussels, Belgium: Society of Environmental Toxicology and Chemistry (SETAC).
Rebitzera, G., Ekvallb,T., Frischknechtc, R., Hunkelerd, D., Norrise, G., Rydbergf, G., Schmidt,
W.P., Suhh, S.,Weidemai, B.P., Pennington, D.W. (2003). “Life Cycle Assessment Part
1: Framework, Goal and Scope Definition, Inventory Analysis, and Applications”
Sharma, Y.C., Singh, B., Upadhyay, S.N. (2008). “Advancement and Characterization of
Biodiesel: A Review”. Fuel 87, 2355-2373.
Sharma, Y.C, Singh, B. (2007). “Development of Biodiesel from Karanja, a Tree Found in Rural
India”. Fuel 87, 2413-2425.

48
Salunkhe, D.K. and Desai, B.B. (1986). Post-Harvest Biotechnology of Oil Seeds, CRC
Press, Inc., Boca Raton. pp. 204-205.
Sarin R, Sharma M, Sinharay S, Malhotra RK. (2007). “Jatropha-Palm Biodiesel Blends: An
Optimum Mix for Asia”. Fuel 86:1365–71.
Schmidt, W.P., Sullivan JL.(2002). Weighting in Life Cycle Assessments in A Global Context.
Int. J Life Cycle Assess,1– 10.
Tiwari AK., Kumar A., Raheman H. (2007). “Biodiesel Production from Jatropha Oil (Jatropha
curcas) with High Free Fatty Acids: An Optimized Process”. Biomass Bioenergy 31:569–
75.
Wang, M.,Wu, Y., Elgowainy, A. (2007).”Operating Manual for GREET: Version 1.7. Center
for Transportation Research. Argonne National Laboratory.
Wang, M. (2007). “Overview of GREET Model Development at Argonne”. Center for
Transportation research. Argonne National Laboratory, 2-31.
West, H.W., Posarac, D., Ellis, N., Muthukumar, K. (2008). Assessment of Four Biodiesel
Production Process Using HYSYS. Plant. Bioresource Technology 99. 6587-6601.
Wu, M., Wang, M., Liu,J., Huo, H. (2007). “Life-Cycle Assessment of Corn-Based Butanol as a
Potential Transportation Fuel”. Energy System Division.

49
Appendix A - The Life Cycle Assessment (LCA)
There are many reasons to conduct an LCA. It can be used to reduce environmental
impact and waste, reduce costs, focus product development, support marketing claims, improve
product quality, enhance corporate image and identify appropriate performance indicators.
Further, performing an LCA creates common metrics that can be compared and shared across a
company, or with suppliers and partners (Rebitzer, G. et al., 2003).
Definition of Life Cycle Assessment (LCA)
LCA is a technique to assess the environmental aspects and potential impacts associated
with a product, process, or service by compiling an inventory of relevant energy and material
inputs and environmental releases, evaluating the potential environmental impacts associated
with identified inputs and releases, interpreting the results to help make a more informed
decision about the human health and environmental impacts of products, processes, and activities
(International Standard SO 14043, 2000).
Life Cycle Assessments have been performed on varieties of products and processes,
including jet engines, diapers, drinking cups, computers, remediation techniques, and trash
disposal. For a typical product, LCA accounts for the supply of raw materials needed to produce
the product, the manufacturing of intermediates, and finally the product itself. It also includes
packaging, transportation of raw materials, intermediates and the product, use of the product and
disposal of the product after use. This sequence is called “Cradle to Grave” assessment. If there
is a product that generates no waste, that is, all materials are recyclable or can be turned into
biologically safe nutrients; you could also explore “Cradle to Cradle” standards (Rebitzer, G et
al., 2003).
The Structure and Components of LCA
An LCA practitioner tabulates the emissions and the consumption of resources, as well as
other environmental exchanges at every relevant stage (phase) in a product’s life cycle, from
‘‘cradle to grave’’. They include raw material extractions, energy acquisition, materials
production, manufacturing, use, recycling, ultimate disposal, and others. The complete life cycle,
together with its associated material and energy flows, is called product system. After the
compilation, tabulation, and preliminary analysis of all environmental exchanges (emissions,
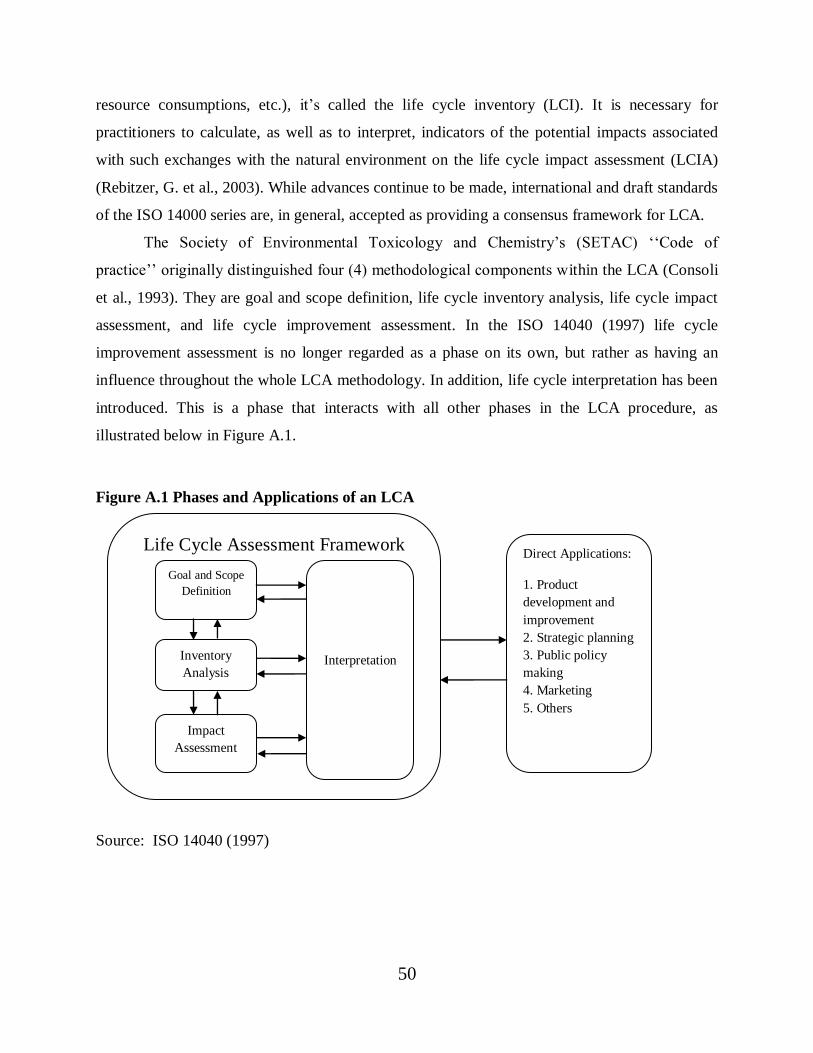
50
resource consumptions, etc.), it’s called the life cycle inventory (LCI). It is necessary for
practitioners to calculate, as well as to interpret, indicators of the potential impacts associated
with such exchanges with the natural environment on the life cycle impact assessment (LCIA)
(Rebitzer, G. et al., 2003). While advances continue to be made, international and draft standards
of the ISO 14000 series are, in general, accepted as providing a consensus framework for LCA.
The Society of Environmental Toxicology and Chemistry’s (SETAC) ‘‘Code of
practice’’ originally distinguished four (4) methodological components within the LCA (Consoli
et al., 1993). They are goal and scope definition, life cycle inventory analysis, life cycle impact
assessment, and life cycle improvement assessment. In the ISO 14040 (1997) life cycle
improvement assessment is no longer regarded as a phase on its own, but rather as having an
influence throughout the whole LCA methodology. In addition, life cycle interpretation has been
introduced. This is a phase that interacts with all other phases in the LCA procedure, as
illustrated below in Figure A.1.
Figure A.1 Phases and Applications of an LCA
Source: ISO 14040 (1997)
Life Cycle Assessment Framework
Goal and Scope
Definition
Inventory
Analysis
Interpretation
Direct Applications:
1. Product
development and
improvement
2. Strategic planning
3. Public policy
making
4. Marketing
5. Others
Impact
Assessment

51
The Goal and Scope
Definition of an LCA goal and scope provides a description of the product system in
terms of the system boundaries and a functional unit. The scope determines which processes,
environmental concerns will be included and economic or social good is provided by the goods
or services in question (Consoli et al., 1993).
Life Cycle Inventory (LCI)
The inventory provides information about all environmental inputs and outputs from all
parts of the product system involved in the life cycle assessment. This involves gathering
information about the product, data collection and verification of data for inputs and outputs.
Inputs include: materials, energy, chemicals, and ‘other’. Outputs include air emissions, water
emissions, solid wastes and other at different times (e.g. use phase of a car compared to its
disposal), and over different time periods (multiple generations in some cases, e.g. for land
filling). The processes within the life cycle and the associated material and energy flows as well
as other exchanges are modeled to represent the product system and its total inputs and outputs,
respectively. This result in a product system model and an inventory of environmental exchanges
related to the functional unit (ISO 14042, 1998).
Life Cycle Impact Assessment (LCIA)
The LCIA provides indicators and the basis for analyzing the potential contributions of
the resource extractions and wastes/emissions in an inventory to potential impacts. The result of
the LCIA is an evaluation of a product life cycle, on a functional unit basis, in terms of several
impacts categories (such as climate change, toxicological stress, noise, land use, etc.) and, in
some cases, in an aggregated way (such as years of human life lost due to climate change,
carcinogenic effects, noise, etc. ) (ISO 14042, 2000).
Life Cycle Interpretation
The last step is an analysis of the impact data, which leads to the conclusion as to whether
the ambitions from the goal and scope are achievable. It occurs at every stage in an LCA. If two
product alternatives are compared and one alternative shows higher consumption of each
material and of each resource, an interpretation purely based on the LCI can be conclusive. A

52
practitioner, however, may also wants to compare across impact categories, particularly when
there are trade-offs between product alternatives, it may desirable to prioritize areas of concern
within a single life cycle study (ISO 14048, 2000).
For example, emissions of CO2 in one life cycle may result in a higher climate change
indicator than in another; the alternative involves more pesticides and has a higher potential
contribution to toxicological impacts. A stakeholder may therefore want more information to
decide which difference is a higher priority. As outlined in part 2 (Pennington et al., 2004),
resolving such issues is often an optional step, but one that clearly warrants attention, drawing
not only on natural sciences but relying heavily on social science and economics.
The Functional Unit
The functional unit is a quantitative description of the service performance of the
investigated product system(s). For a refrigerator, the functional unit may, for example, be
described in ‘‘cubic meter years of cooling to 15 oC below room temperature”. The functional
unit is the important basis that enables alternative goods, or services, to be compared and
analyzed. The functional unit is not usually just a quantity of material. Since a system is usually
linearly modeled, the result of all scale linearly with the functional unit, and its magnitude is of
little importance. As an example, consider an LCA of electricity production. The magnitude of
the functional unit (megawatt hour, smaller, or larger) does not affect the conclusions since the
average emissions of the electricity system scale linearly with the functional unit (Rebitzer, G. et
al., 2003).
Example of Life Cycle Assessment
LCA provides great lesson to examine a product from “cradle to grave”, by visualize it in
a broader picture. Previous examination of environmental attributes of a yogurt cup and lid
performed indicated that every time a cup of yogurt is sold, a plastic cup and lid is created as the
primary packaging. The box and plastic wrap to hold and transport the cup become the secondary
packaging. By looking at the cup alone and the environmental impact of the primary packaging,
LCA has shown that it could miss the potentially greater environmental burden from the
secondary packaging (Schmidt and Sullivan, 2002).

53
For instance, consider the packaged product was packaged in highly recyclable cups in a
heavy box that used toxic inks and solvent adhesives to seal it. If only the primary packaging is
examined, then it might be considered a good packaging because it is recyclable. In fact, the total
“product delivery system” (PDS) could have significantly greater environmental impact than if
the cup were made from a non-recyclable, stronger material, which would allow for a lighter
weight box. LCA has enlightened examination of the entire PDS to visualize the entire picture
and the total environmental burden of getting a cup of yogurt to the store shelves. The resources
used to deliver product to customers extend far deeper than most would assume when picking a
cup of maple vanilla yogurt off the shelf at the grocery store (Frankl and Rubik, 2000).
Numerical Illustration
Figure A.2 represents an overall process for this illustration. The life of the process is 5
years. The goal is to identify and quantify environmental impacts of the process. Assuming a
material input A denotes the functional unit. A and B are individual input materials and C is
energy input. D, E and F are the desired product, gaseous emission and liquid waste,
respectively.
Figure A.2 Process Representation
A D
B E
F
C
Table A.1 is a summary of inputs and outputs quantities of a 5-year average data.
Overall Process

54
Table A.1 Summary of Inputs and Outputs of the Process
Inputs Amount
A 900 lb/hr
B 270 lb/hr
C 40 MJ/hr
Outputs
D 1059 lb/hr
E 150 lb/hr
F 10 lb/hr
Computed impact categories of gaseous emission, E and liquid waste, F appear in Table A.2.
Table A.2 Computed Environmental Impact Categories
Outputs
Environmental Impact
Characterization/Equivalent Factor from
the CML Impact Assessment Factors of
2001
Impact
Score
Environmental
Impact
Categories (lb)
E 150 lb/hr Global Warming Potential (GWP 100 years) 15 150 x 15 = 2250
Ozone Layer Depletion Potential (ODP) 12 150 x 12 = 1800
F 10 lb/hr Human Toxicity Potential (HTP) 7 10 x 7 = 70
Acidification Potential (AP) 6 10 x 6 = 60
Freshwater Aquatic Eco-Toxicity Potential
(FAETP)
3 10 x 3 = 30
Note that “Environmental impact categories” in column 4 of Table A.2 have been calculated by
multiplying the output amounts of gaseous and liquid effluents in column 1 with their respective
“impact scores” in column 3.
Results indicate appreciable levels of ozone layer depletion potential and global
warming potential of E have adverse effects on the environment. They have significant impact

55
on climate change or global warming. This implies that the process must be improved to
minimize these impact categories. All other impacts categories quantified in the Table A.2,
enable comparison with allowable limits of such substances into the environment by the
regulatory agencies. Appropriate emissions control measures may be instituted to reduce output
materials associated with high environmental impacts.
56
Appendix B – Output Result of Biodiesel LCA from Soybeans Using GREET
Software
An output result of biodiesel LCA from soybeans, Well-to-Pump (WTP), is shown in
Table B.1, in its original format with no changes made to the Table. This outcome resulted from
personally running through the GREET software using the default input values in Table B.3. The
other input data in Table B.2 was reported by a publication (Huo et al., 2008), and was entered
into GREET software by the Argonne National Laboratory personnel. The result has total
energy, WTP energy efficiency, fossil fuels (petroleum, coal and natural gas) and emissions
lumped into Table B.1. Different colors have been used to group the results according to total
energy and efficiency, fossil fuels, green house gases (GHG) and the six criteria pollutants.

57
Table B.1 Well-to-Pump Energy Consumption and Emissions
(Btu or grams per mmBtu of Fuel Available at Fuel Station Pumps)
Year: 2010 Values
Total Energy 193,718
WTP Efficiency 83.8%
Fossil Fuels 190,215
Coal 32,158
Natural Gas 76,092
Petroleum 81,966
CO2 (w/ C in VOC & CO) 15,488
CH4 104.527
N2O 0.248
GHGs 18,175
VOC: Total 7.774
CO: Total 12.630
NOx: Total 42.768
PM10: Total 8.676
PM2.5: Total 3.470
SOx: Total 20.615
VOC: Urban 2.990
CO: Urban 3.412
NOx: Urban 9.233
PM10: Urban 1.603
PM2.5: Urban 0.932
SOx: Urban 6.588

58
Table B.2 Soybeans Biodiesel LCA Inputs for GREET Software
Parameters Significance Soybeans Data
Yield Yield in bushel per acre. 42.0 bushel/acre
Energy Use Energy used in soybeans
farming to harvesting.
Total energy use is estimated to be
22,084 Btu/bu: 64% diesel, 18%
gasoline, 8% LPG, 7% natural gas,
and 3% electricity
Fertilizer Use
Fertilization of soybeans
farming.
Usage of fertilizer: 61.2 g/bu N,
186.1 g/bu P and 325.5g/bu K. The
total energy used per gram of
fertilizer produced are 45.9 Btu/g N,
13.29 Btu/g P and 8.42/g K
N2O N2O emissions from soybeans
farming contributing to GHG
emissions.
0.3-3% of N20 emission to the air.
Oil Extraction Soybeans are crushed; oil is
extracted and refined.
Input:
Soybeans (lb) = 5.7
Steam (Btu) = 2,900 (44.5%)
NG (Btu) = 2,800 (43.0%)
Electricity (Btu) = 614(9.4%)
N-hexane (Btu) = 205 (3.1%)
Total Energy (Btu) = 6,519 (100%)
Output:
Soy Oil (lb) = 1
Soy Meal (lb) = 4.48
Source: Huo et al. (2008).

59
Table B.2 Soybeans Biodiesel LCA Inputs for GREET Software (Continued)
Parameters Significance Soybeans Data
Biodiesel
Production Transesterification process uses
alcohol (ethanol or methanol) in
the presence of a catalyst
(sodium hydroxide) to form
ethyl or methyl ester.
Inputs:
Soy Oil (lb) = 1.001
Methanol(lb) = 0.1001
NaOH(lb) = 0.0050
Sodium Methoxide (lb) = 0.0125
Hydrochloric acid(lb) = 0.0071
NG(Btu) = 888
Electricity (Btu) = 46
Outputs:
Biodiesel (lb) = 1
Glycerin (lb) = 0.116
Co-Products Soy meals and glycerin co-
products have applications
similar to soybeans and
conventional glycerin. Energy
and emission associated with
their processes would have to
be evaluated separately, in order
to reduce energy and emission
burdens of the primary product.
Soy meals: Displacement ratio of soy meal to
Soy beans is determined by protein content.
Soy meal contains 48% protein, and
soybeans contain 40% protein. Thus 1lb of
soy meal replaces 1.2 lb of soybeans.
Source: Huo et al. (2008)

60
Table B.3 User Input and GREET Software Default Values for Soybeans Biodiesel LCA
Electricity generation Soy Beans Input
Marginal Electricity generation
U.S average
electricity for
Transportation and
Stationary use
Residual oil 2.7%
NG 18.9%
Coal 50.7%
Nuclear 18.7%
Biomass 1.2%
Others 7.7%
Advanced Power
Plants Technology
Shares
NG turbine combined cycle
technology share 44.0%
NG turbine simple-cycle
technology share 36.0%
Advanced coal technology
share 0.0%
Advanced biomass technology
share 0.0%
Nuclear Plants for
Electricity Generation Light water reactor(LWR)
Plants Tech. Shares
Gas Diffusion 25.00%
Centrifuge 75.00%
High temperature gas-cooled
reactor (HGTR) Gas Diffusion 25.00%
Centrifuge 75.00%
Biomass Power Plant
Feedstock Share
Woody Biomass Share 100.0%
Herbaceous Biomass Share 0.0%
Source: Wang, M.,Wu, Y., Elgowainy, A. , (2007)
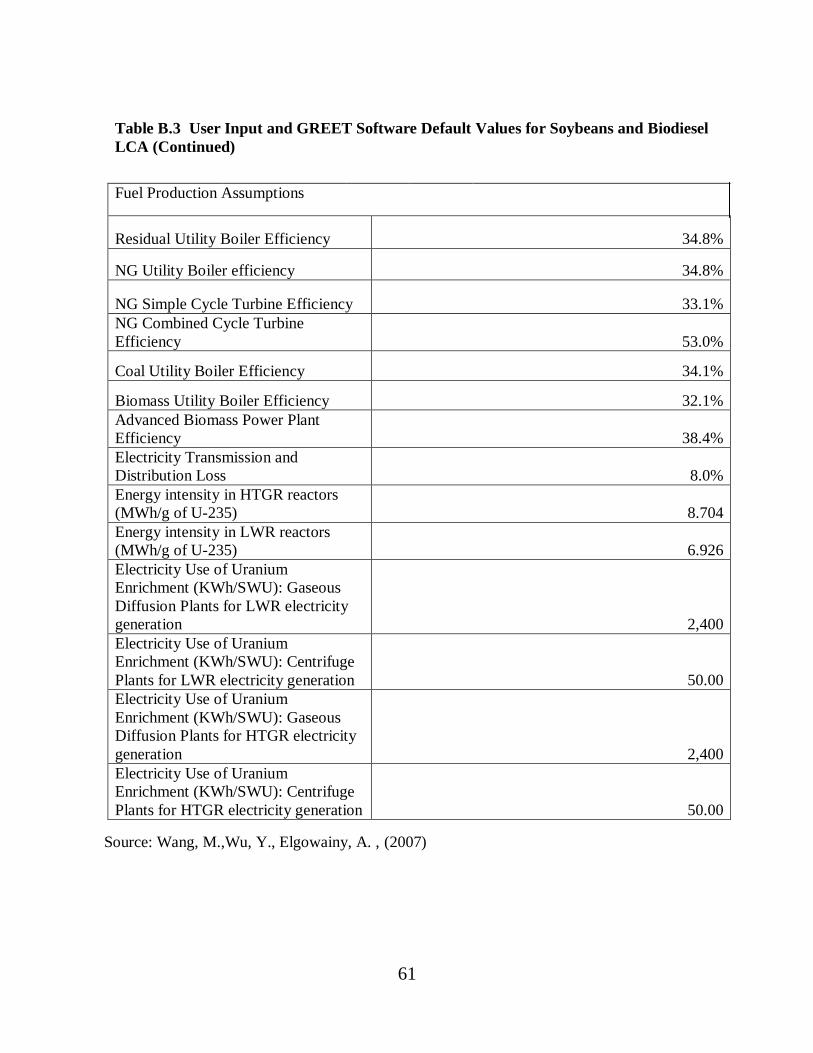
61
Table B.3 User Input and GREET Software Default Values for Soybeans and Biodiesel
LCA (Continued)
Fuel Production Assumptions
Residual Utility Boiler Efficiency 34.8%
NG Utility Boiler efficiency 34.8%
NG Simple Cycle Turbine Efficiency 33.1%
NG Combined Cycle Turbine
Efficiency 53.0%
Coal Utility Boiler Efficiency 34.1%
Biomass Utility Boiler Efficiency 32.1%
Advanced Biomass Power Plant
Efficiency 38.4%
Electricity Transmission and
Distribution Loss 8.0%
Energy intensity in HTGR reactors
(MWh/g of U-235) 8.704
Energy intensity in LWR reactors
(MWh/g of U-235) 6.926
Electricity Use of Uranium
Enrichment (KWh/SWU): Gaseous
Diffusion Plants for LWR electricity
generation 2,400
Electricity Use of Uranium
Enrichment (KWh/SWU): Centrifuge
Plants for LWR electricity generation 50.00
Electricity Use of Uranium
Enrichment (KWh/SWU): Gaseous
Diffusion Plants for HTGR electricity
generation 2,400
Electricity Use of Uranium
Enrichment (KWh/SWU): Centrifuge
Plants for HTGR electricity generation 50.00
Source: Wang, M.,Wu, Y., Elgowainy, A. , (2007)