measuring the onset of mine tailings erosion
TRANSCRIPT

Measuring the onset of mine tailings erosion
M. Haneef-Mian, Ernest K. Yanful, and Robert Martinuzzi
Abstract: The present study gives details of a methodology for estimating the critical shear stress for erosion of minetailings and other naturally occurring cohesive sediments. Erosion of a cohesive sediments bed occurs when the criticalshear stress is exceeded to break the interparticle bond. Experiments were conducted in a 30 cm diameter laboratorycolumn and calibrated using laser Doppler anemometry. The results showed that the erosion pattern of mine tailingsparticles was similar to those of fine-grained cohesive sediments. A power-law relation of the form E = α[(τ – τcr)/τcr]
n
is suggested for mine tailings, where E is the erosion rate, α is a coefficient, τ is the shear stress, τcr is the criticalshear stress, and n is an exponent. The computed values of α, n, and τcr in the power-law equation were found to becomparable to values derived from experiments in a rotating circular flume. The derived expression for rate of erosionmay be incorporated in resuspension and transport models for fine mine tailings of a similar nature.
Key words: mine tailings, laser Doppler velocimetry, wall shear stresses, critical shear stress for erosion, erosion – shearstress relationship.
Résumé : La présente étude donne des détails d’une méthodologie pour estimer la contrainte de cisaillement critiquepour l’érosion des stériles ou résidus miniers et autres sédiments cohérents présents dans la nature. L’érosion d’un litde sédiments cohérents se produit lorsque la contrainte de cisaillement critique est dépassée au point de briser les liensinter-particules. Des expériences ont été réalisées en laboratoire dans une colonne de 30 cm de diamètre et étalonnéeau moyen d’anémométrie au laser Doppler. Les résultats montrent que le schéma d’érosion des particules des stérilessont semblables à ceux des sédiments cohérents à grains fins. On suggère pour les stériles ou résidus miniers une relationde loi de puissance de la forme E = α[(τ – τcr)/τcr]
n. On a trouvé que les valeurs calculées de α, n et τcr dansl’équation de loi de puissance étaient comparables aux valeurs dérivées des expériences dans un canal circulaire rotatif.L’expression dérivée pour la vitesse d’érosion peut être incorporée dans des modèles de remise en suspension et detransport pour les stériles ou résidus miniers fins de nature similaire.
Mots-clés : stériles ou résidus miniers, vélocimétrie Doppler à laser, contrainte de cisaillement pariétal, contrainte decisaillement critique pour l’érosion, relation érosion – contrainte de cisaillement.
[Traduit par la Rédaction] Haneef-Mian et al. 489
Introduction
The use of shallow water covers for containing sulfide-bearingmine tailings in nonarid climates has gained importance overthe years due largely to their effectiveness as oxygen barriers(Li et al. 1997; Adu-Wusu et al. 2001; Yanful and Catalan2002; Mian and Yanful 2003). Tailings ponds receive largequantities of mine tailings that include sand-, silt-, and clay-
sized materials. Current design methodology for mine tail-ings ponds requires that a certain minimum water coverdepth be implemented above the tailings to minimize wind-induced bottom erosion and resuspension. Deeper water coversare not favoured because of the need to construct high dams.The satisfactory performance of these tailings ponds then islargely determined by the concentration and susceptibility tooxidation of resuspended tailings in the pond water. Adu-Wusu et al. (2001) and Catalan and Yanful (2002) haveobserved field erosion and resuspension of tailings particles attwo sites in New Brunswick and northern Ontario, Canada.Mian and Yanful (2004) noted that the cohesive nature ofmine tailings may contribute to suspended solids concentra-tions in water cover that are higher than the Canadian Federaleffluent discharge limit of 25 mg·L–1. Mitchener et al. (1996)noted that the mode of erosion of the bed (i.e., whether iteroded like a cohesive or noncohesive sediment) was veryimportant in sediment transport calculations. Cohesive bedserode in chunks that have a tendency to disaggregate andpotentially lead to increases in particle concentrations in thewater column. Thus, estimates of the suspended sedimentloads for a cohesive sediment bed assuming noncohesivebehaviour may lead to erroneous results.
The erosion of mine tailings is important from an engi-neering standpoint because it is related to the maintenanceof a minimum water cover depth in tailings ponds. For sedi-
Can. Geotech. J. 44: 473–489 (2007) doi:10.1139/T06-116 © 2007 NRC Canada
473
Received 15 June 2005. Accepted 10 October 2005.Published on the NRC Research Press Web site at cgj.nrc.caon 31 May 2007.
M. Haneef-Mian.1 AMEC Earth and Environmental, 4810-93rd Street, Edmonton, AB T6E 5M4, Canada.E.K. Yanful.2 Department of Civil and EnvironmentalEngineering, The University of Western Ontario, London,ON N6A 5B9, Canada.R. Martinuzzi.3 Advance Fluid Mechanics Research Group,Department of Mechanical and Materials Engineering, TheUniversity of Western Ontario, London, ON N6A 5B9,Canada.
1Present address: Stantec Consulting, 10160–112 St.,Edmonton, AB T5K 2L6, Canada.
2Corresponding author (e-mail address: [email protected]).3Present address: Department of Mechanical andManufacturing Engineering, University of Calgary, Calgary,
Can
. Geo
tech
. J. D
ownl
oade
d fr
om w
ww
.nrc
rese
arch
pres
s.co
m b
y M
erce
d (U
CM
) on
05/
06/1
4Fo
r pe
rson
al u
se o
nly.

ments to erode, shear stresses acting on the sediment–waterinterface should generally be higher than a critical value,normally referred to as the “critical shear stress”. The criticalshear stress of cohesive sediments is influenced by a numberof physical and geological factors, including turbulent stressat the sediment–water interface, water content of the depos-ited sediments, mineralogical composition (for example,different clay minerals), and the compositions of pore waterand eroding fluid (saline or brackish). Other controlling fac-tors include thixotropy and consolidation of the material andits resulting fabric, biological processes, content and originof organic matter, and amounts of sand and silt (Kamphuisand Hall 1983; Torfs et al. 1996). The effects of turbulentstress and water content are qualitatively known and under-stood (Krone 1962; Partheniades 1962, 1965; Fukuda andLick 1980), however, these effects are not quantitativelypredictable and each sediment must be investigated inde-pendently (Lee et al. 1981).
Work on surface erosion of cohesive soils was initiateddecades ago by a number of researchers, including Ariathuraiand Arulanandan (1978). These researchers investigated thephysicochemical properties of both eroding water and porefluids. Dunn (1959) and Smerdon and Beasley (1961) relatedthe erosional resistance of cohesive soils to their plasticityindex, Migniot (1968) related it to dry density and yieldstress, and Kamphuis and Hall (1983) related it to vanestrength and unconfined shear strength. The devices used inmost of the investigations were the rotating cylinder, thelong recirculating flume, the pinhole setup, and the sub-merged vertical jet (Moore and Masch 1962; Krishnamurthy1983; Chapuis and Gatien 1986; Lefebvre et al. 1986;Rohan et al. 1986). Partheniades et al. (1968) and Mehtaand Partheniades (1975, 1982) have used an annular flumeto study the erosion and deposition behaviour of kaoliniteunder flow. Other researchers (Krone 1962; Sheng and Lick1979; Fukuda and Lick 1980; Mehta et al. 1982; Parchureand Mehta 1985; Xu 1991) used rotating circular flumes tostudy the erosion and deposition behaviour of soft depositedbeds. Schünemann and Kühl (1991) used a propeller stirringEROMES system, comprised of a propeller placed 10 cmabove a 60 cm thick sediment bed. The EROMES systemis a patented development of the GKSS Research Centre,Geesthact, Germany, for conducting erosion measurementson naturally formed muddy sediments. The system uses arti-ficially induced turbulence to erode samples and keep theeroded matter stored in suspension (Schünemann and Kühl1991, 1993). Tsai and Lick (1987) used a vertically oscillat-ing plunger 27.9 cm in diameter. The height of the water inthe plunger above the sediment was maintained at 12.7 cm.In nearly all erosion studies, a smooth bed is typicallyassumed and, from a sequence of steady state values of wallshearing stress combined with an equilibrium value of masssuspended, a quantitative entrainment function is established.Almost all the experiments conducted in the cited studieshave reported that the entrainment rate increases rapidly forstresses greater than the stress needed to initiate noticeableentrainment, that is, the critical shear stress.
Detailed experiments were conducted to study the effectsof wall shearing stresses on the erosion behaviour of minetailings and to measure the critical shear stress for erosion.Yanful and Catalan (2002) and Mian and Yanful (2004) have
used the rotating circular flume (RCF) (Krishnappan 1993)for determining the erosion behaviour of mine tailings. Inthese studies, although the RCF provided a reliable estimateof the erosion characteristics of the tailings, it involved theuse of a large amount of tailings, approximately 90 kg. Inaddition, the RCF facility may not always be available oraccessible, testing in the RCF is expensive, and the RCFdoes not easily allow for a close examination of the erodingsurface. To address some of these difficulties, a relativelysimple erosion testing system is proposed in the presentstudy. This paper describes the design of the system (here-after called the column), the calibration of the column, andthe distribution of the wall shear stress over the columnradius during erosion testing. Although the flow pattern gen-erated in the column is different from that generated by cur-rents or waves, the prime agents of sediment entrainment,one can obtain a reasonable estimate of the critical shearstress for erosion of fine mine tailings by comparing theresults from the column with those from the RCF and otherpublished devices used in studying cohesive sediment ero-sion.
Materials and methods
Tailings and sediment samplesThe mine tailings sample used in the erosion experiments
was obtained from the Heath Steele lead–zinc mine tailingsarea located 50 km northeast of Miramichi, north-central NewBrunswick, Canada. The second sample in the erosion experi-ment was a south London silt, chosen because its particle-sizedistribution was close to that of the mine tailings and did notcontain sulfide minerals. Sulfide-bearing materials tend tooxidize during resuspension. Oxidation can alter the particle-size distribution and lead to flocculation of the particles.
Description of laboratory columnThe entrainment experiments were carried out in a Plexi-
glas column 30 cm in diameter and shown schematically inFig. 1. The height of the column was 126 cm from top tobottom. The column was fitted with top and bottom remov-able plates, each 3 cm thick. Resuspension was induced by atwo-blade Teflon stirrer 12 cm in diameter and placed 60 cmabove the sediment surface. The height of the water was85 cm during the experiments. The total length of the stirrerfrom top to bottom was approximately 50 cm (Fig. 1). Analternating current (ac) motor controlled the stirrer, andinput power to the stirrer was regulated by a direct current(dc) voltage regulator. To keep the stirrer stationary, the topcover plate was fitted with a bearing assembly. Samplingports for the measurement of sediment concentrations werelocated 5, 30, 48, and 70 cm from the bottom of the column.Using an optical tachometer, the stirrer speed was calibratedagainst the voltage regulator with an accuracy of ±2%. Thecolumn used 85 cm of water above the sediment bed. Inprevious studies (e.g., Fukuda and Lick 1980; Krishnappan1993) much smaller water depths were used, typically 8–20 cm. The water depth of 85 cm is realistic, as it is close towater depths found in engineered water covers used in minetailings disposal.
© 2007 NRC Canada
474 Can. Geotech. J. Vol. 44, 2007
Can
. Geo
tech
. J. D
ownl
oade
d fr
om w
ww
.nrc
rese
arch
pres
s.co
m b
y M
erce
d (U
CM
) on
05/
06/1
4Fo
r pe
rson
al u
se o
nly.

Velocity profiles in the laboratory columnTo map the flow field in the column, a Thermo-Systems
Inc. (TSI) laser doppler probe model LDP 100 (Thermo-Systems Inc., Shoreview, Minn.) was used to measure theazimuthal velocity profiles. Titanium dioxide (TiO2) parti-cles (<2 µm) were used as seeding material. The probe wasconnected to a TSI Intelligent Flow Analyzer (IFA) 600signal processor, which in turn was connected to a TSI model6261 16-bit direct memory access (DMA) board and Laservecsoftware. To determine the wall shear stress as a function ofthe radial position and stirrer speed, azimuthal velocity mea-surements were made at 1, 3, 6, 9, 11, 13, and 14 cm alongthe column radius (from the side wall of the column) at stirrerspeeds of 60, 80, 100, 120, 140, and 170 rpm. In general,20–40 azimuthal velocity measurements were made withinthe bottom boundary layer, and several more were takenwithin the core of the fluid. Although the overall structure ofthe mean flow field for this kind of geometry is expected tobe axisymmetric (Schlichting 1979), velocity measurements
were also taken at 14 and 16 cm (1 cm on either side of thecolumn centre) to verify axisymmetry.
Mineralogical composition of the tailings and soil samplesThe mineralogical and elemental composition of mine tailings
can vary from one site to another as a result of differences inthe ore and mill grind. To identify the most abundant mineralphases in the Heath Steele mine tailings and south Londonsilt, a Rigaku rotating anode X-ray diffractometer (RigakuAmericas, Inc., The Woodlands, Tex.) that employed cobaltKα radiation was used. Standard procedures were followedfor sample preparation and mineral identification (Dixon andWeed 1977; Brindley and Brown 1989; Moore and Reynolds1997). To obtain semiquantitative mineralogical information,a quartz mineral standard was included in the X-ray diffrac-tion analysis, and the calibrated amount of quartz in the samplewas used along with mineral peak height ratios for the nonclayminerals. As noted later in the paper, semiquantitative infor-mation on constituent clay minerals was obtained using the
© 2007 NRC Canada
Haneef-Mian et al. 475
Fig. 1. Schematic of the laboratory column.
Can
. Geo
tech
. J. D
ownl
oade
d fr
om w
ww
.nrc
rese
arch
pres
s.co
m b
y M
erce
d (U
CM
) on
05/
06/1
4Fo
r pe
rson
al u
se o
nly.

X-ray diffractograms and supplementary chemical data, suchas cation exchange capacity (CEC) and ethylene glycol retention(Soderman and Quigley 1965; Kashir and Yanful 2001).
Particle-size distribution of the tailings and soil samplesThe particle-size distributions of the samples were deter-
mined using a Malvern Mastersizer model Hydro 2000S withAutosample 2000. The Malvern Mastersizer (MalvernInstruments Ltd., Malvern, UK) utilizes the principle of lightscattering to measure drop size. McNeil et al. (1996) used asimilar method to determine particle sizes between 1 and500 µm in bottom sediments from the Trenton Channel ofthe Detroit River, Michigan. Haralampides et al. (1993) usedthe Malvern particle size analyzer to measure particle sizesfor the fine portion (<0.075 mm) of surficial bed sedimentstaken from the Upper St. Clair River. Several previous studies(Adu-Wusu et al. 2001; Catalan and Yanful 2002) have usedthe Malvern method to obtain particle-size distributions for awide range of tailings with reasonable reproducibility.
The procedure used in the present study involved mixing0.2–0.4 g of solids with 100 mL of deionized water containing1 g sodium hexametaphosphate as a dispersant. About 20 mLof this mixture was added to the analyzer ultrasonic bath,which already contained a solution of 1 g of dispersant in1 L of water. The ultrasonic bath was operated until thegrain-size distribution curve stabilized (5–10 min). Each testwas repeated nine times, and the average of 10 readings wasobtained.
Entrainment experimentsFor the present study, a certain amount of tailings or soil
sample was made into slurry by mixing with tap water in alarge container. The contents of the container were thenmixed by manual stirring using a wooden rod. The slurrywas then poured into the column to a height of approxi-mately 2–3 cm. Full mixing was then ensured by first mixingthe content with a hand-held rod and then rotating the stirrerat 170 rpm. This operation was maintained for 15–20 minand then slowed down gradually to a complete stop, thusallowing the tailings to deposit evenly on the column bed tocreate what is known as a “deposited bed” (Mehta et al.1982). This is analogous to the bed formed in lakes aftersediments are resuspended by storms and subsequentlydeposited during calmer periods. This method of bed prepa-ration is similar to that used by other researchers (Sheng andLick 1979; Fukuda and Lick 1980).
The tailings arrived in the laboratory covered with pondwater from the field. The electrical conductivity of the tail-ings was measured to be 1000 µs·cm–1, which is similar tovalues measured on fresh unoxidized tailings by Yanful andVerma (1999). The tap water used for preparing the tailingsslurry had a conductivity of 700 µs·cm–1, which was close tothat of the pond water. Generally, this small difference inconductivity is not expected to change the structure of thetailings. The use of treated tap water (for example, the pres-ence of chlorine) could affect microbiological activity in thetailings, for example, by decreasing the biological oxidationrate. While the use of tap water could reduce oxidation ofthe tailings, resuspension using the Teflon stirrer could increaseoxidation, as was shown by Yanful and Verma (1999) andYanful et al. (2000). Thus the two activities could have a
compensatory effect, resulting in an overall negligible neteffect on the measured critical shear stress of the tailings.Yanful et al. used tap water in their experiments and showedthat the marginal difference in tailings pore water quality atthe beginning of the experiments did not affect conductivity,metal concentrations, bed shear stress, and turbulent kineticenergy throughout the experiments.
Consolidation timeThe time elapsed between the cessation of rotation and the
start of each erosion test is referred to as consolidation time.Hayter and Mehta (1986) noted that cohesive sediments inestuaries can exist in four different physical states: as mobilesuspension, stationary suspension, partially consolidated bed,and settled fully consolidated bed. A stationary suspension, apartially consolidated bed, and a settled bed may erode if theshear stress mobilized at the bed exceeds the critical shearstress. Mehta et al. (1982) referred to the entrainment from aconsolidating or settled bed as resuspension. A settled bedresults from the consolidation of the stationary phase due tooverburden and thixotropic rearrangement. As consolidationproceeds, the aggregates in layers below the surface are crushed,and a comparatively stronger, more tightly packed unit results.When consolidation is completed after a relatively long periodof perhaps several days, the shear strength and density distri-butions become invariant and the bed acquires more uniformproperties (Mehta et al. 1989). Parchure and Mehta (1985)noted that consolidation is complete in a period ranging froma few days to a week or two.
To explain the influence of consolidation time on erosion,tailings and soil samples were allowed to settle and consoli-date for various periods of time: 3 and 4 days for HeathSteele mine tailings and 4 days for the south London silt.These consolidation times were similar to those used in therotating circular flume. For example, Zreik et al. (1998) used1.8–18.0 days, and Haralampides et al. (1993) used 1.7–5.0 days. In addition, Parchure and Mehta (1985) noted thatconsolidation is complete in a period ranging from a few daysto a week or two.
Suspended solids concentrationsThe column was fitted with a sampling port located on the
side wall. This port was flush with the column wall andallowed water samples to be withdrawn for measuring sus-pended sediment concentrations. The orifice of the samplingport was positioned approximately 30 cm above the columnbottom. Once the samples were collected, the sediment con-centrations were measured by gravimetry, which involvedweighing of bulk and oven-dry, filtered suspended sediments.
Results and discussion
X-ray diffractograms of the tailings and soil samplesFigures 2 and 3 show X-ray diffractograms of Heath Steele
mine tailings and south London silt, respectively. The mineral-ogical composition of Heath Steele upper cell tailings con-sisted of pyrite (50%–65% by weight), kaolinite (10%–20%),smectite (4%–6%), mica (2%–5%), quartz, and a small amountof other sulfide minerals, such as pyrrhotite, sphalerite, andgalena (Yanful and Catalan 2002). The relative density oftailings was determined using the method described by Bowles
© 2007 NRC Canada
476 Can. Geotech. J. Vol. 44, 2007
Can
. Geo
tech
. J. D
ownl
oade
d fr
om w
ww
.nrc
rese
arch
pres
s.co
m b
y M
erce
d (U
CM
) on
05/
06/1
4Fo
r pe
rson
al u
se o
nly.
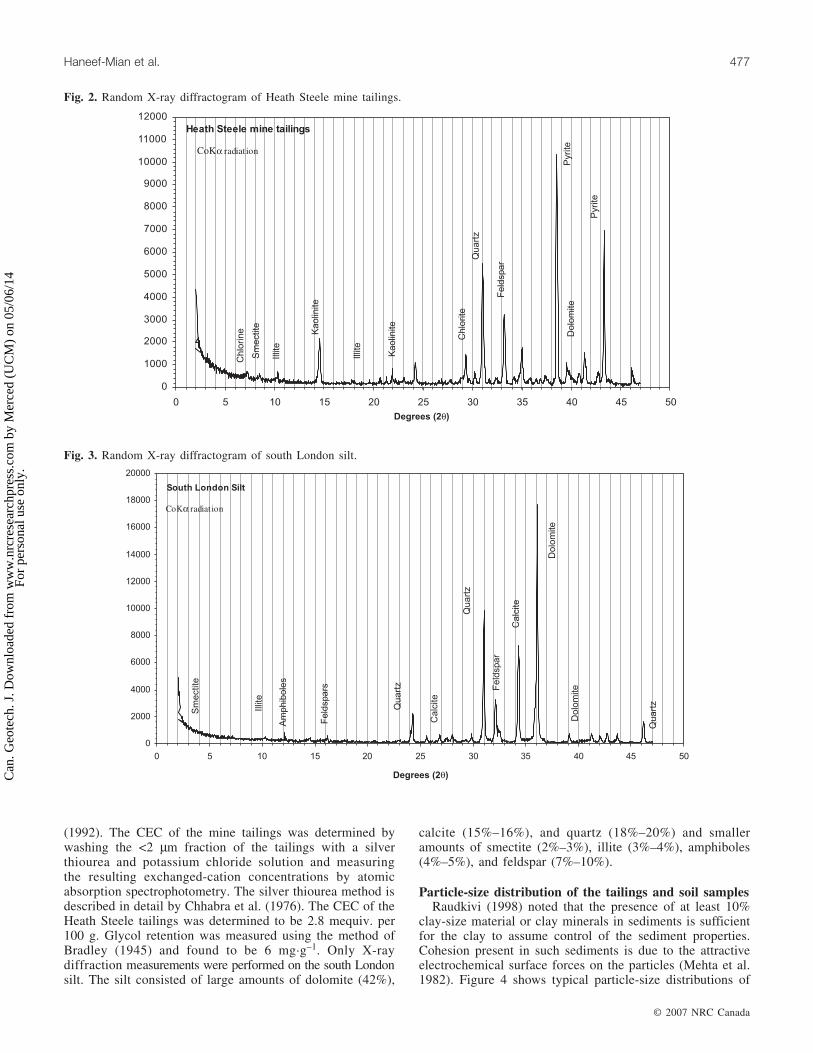
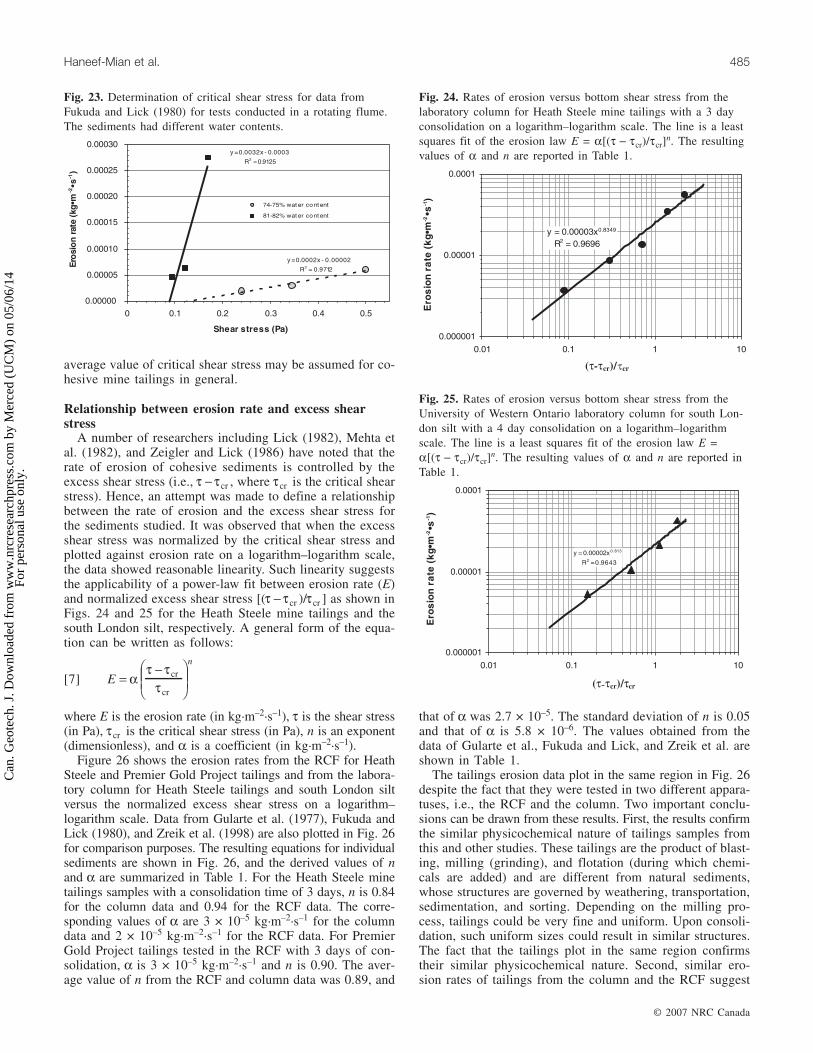
(1992). The CEC of the mine tailings was determined bywashing the <2 µm fraction of the tailings with a silverthiourea and potassium chloride solution and measuringthe resulting exchanged-cation concentrations by atomicabsorption spectrophotometry. The silver thiourea method isdescribed in detail by Chhabra et al. (1976). The CEC of theHeath Steele tailings was determined to be 2.8 mequiv. per100 g. Glycol retention was measured using the method ofBradley (1945) and found to be 6 mg·g–1. Only X-raydiffraction measurements were performed on the south Londonsilt. The silt consisted of large amounts of dolomite (42%),
calcite (15%–16%), and quartz (18%–20%) and smalleramounts of smectite (2%–3%), illite (3%–4%), amphiboles(4%–5%), and feldspar (7%–10%).
Particle-size distribution of the tailings and soil samplesRaudkivi (1998) noted that the presence of at least 10%
clay-size material or clay minerals in sediments is sufficientfor the clay to assume control of the sediment properties.Cohesion present in such sediments is due to the attractiveelectrochemical surface forces on the particles (Mehta et al.1982). Figure 4 shows typical particle-size distributions of
© 2007 NRC Canada
Haneef-Mian et al. 477
Fig. 2. Random X-ray diffractogram of Heath Steele mine tailings.
Fig. 3. Random X-ray diffractogram of south London silt.
Can
. Geo
tech
. J. D
ownl
oade
d fr
om w
ww
.nrc
rese
arch
pres
s.co
m b
y M
erce
d (U
CM
) on
05/
06/1
4Fo
r pe
rson
al u
se o
nly.

Heath Steele mine tailings and south London silt. The quan-tity of particles finer than 62 µm present in both bed tailingsand silt was 95% by volume. Soulsby (1997) noted that cohe-sion plays an important role in the behaviour of mixed sedi-ments if more than 10% of the sediment is finer than 62 µm(silts and clays). The particle diameter at which 50% of thematerial by weight is finer, D50, was 12 µm for Heath Steelemine tailings and 14 µm for south London silt. It was thusinferred from Fig. 5 that the tailings and silt contained a suffi-cient amount of fine particles to induce cohesive behaviour.
In addition to particle size, cohesion may also be definedby behaviour. A coarse silt, for example, can behave likenoncohesive fine sand in fresh water but may be cohesive inan ocean environment. Similarly, a fine sand may exhibitcohesiveness in salt water (US Army Corps of Engineers2002). Blake et al. (2004) noted that for smaller cohesivesediment particles (i.e., <200 µm), the critical shear stress isa function of many more sediment variables than particlesize and cannot always be calculated from a single formula-tion.
Velocity profiles and shear stress determinationVelocity data were collected from experiments in which
each of the radial positions and stirrer speeds was repeatedat least twice. Figures 5 and 6 show examples of the velocitydata where the azimuthal mean velocity U is plotted as afunction of the vertical distance Z above the bottom plate.The data shown are for radial positions of 6 and 9 cm (fromthe side wall of the column) and stirrer speeds in the rangeof 60–170 rpm. Similar profiles were obtained for radialpositions of 1, 3, 11, 13, and 14 cm. Figures 7 and 8 showthe velocity data normalized by the maximum velocity forall the stirrer speeds at radial positions of 6 and 9 cm. It canbe observed that the velocity data for both 6 and 9 cmcollapse on the same curve, indicating that the laboratorycolumn was able to generate a steady increase in velocitywith an increase in stirrer speed. Figure 9 shows that themaximum velocity at radial positions of 1, 3, 6, 9, 11, 13,and 14 cm increased linearly with an increase in stirrer speed.It can be established from Fig. 9 that the flow in the columnwas well controlled and that the three-dimensional effects
can be neglected, i.e., there is only one principal shear stresscomponent. It is instructive to note that the decrease in max-imum velocity observed at a radius of 14 cm can be attrib-uted to the boundary layer developing on the cylinder wall
© 2007 NRC Canada
478 Can. Geotech. J. Vol. 44, 2007
Fig. 4. Particle-size distribution of Heath Steele mine tailingsand south London silt.
Fig. 5. Azimuthal velocity profiles as a function of increasingstirrer speed at a radial position of 6 cm inside the column fromthe side wall. Umean, mean velocity.
Fig. 6. Azimuthal velocity profiles as a function of increasingstirrer speed at a radial position of 9 cm inside the column fromthe side wall.
Can
. Geo
tech
. J. D
ownl
oade
d fr
om w
ww
.nrc
rese
arch
pres
s.co
m b
y M
erce
d (U
CM
) on
05/
06/1
4Fo
r pe
rson
al u
se o
nly.

(located at 15 cm). Figure 10 shows the azimuthal velocityprofiles at 1 cm on each side of the column centre. Thevelocity profiles are almost identical in the two cases, thusconfirming axisymmetry of the flow structure.
Determination of wall shear stressThe wall shear stress was determined at each radial posi-
tion and for a certain stirrer speed in the following manner.The azimuthal velocity profile at each location was firstfitted with a best-fit curve, as shown in Fig. 11. The slope ofthe curve was determined at each measurement point andconverted to the corresponding shear stress values
[1] τ µ=∂∂
u
z
where τ is the shear stress (in Pa), µ is the dynamic viscosity(1.002 × 10⁻⁶ Pa·s at 20 °C) (Tchobanoglous and Schroeder1987), and ∂u/∂z is the slope of the curve.
Values obtained using eq. [1] were plotted against thenumber of measurements, for example, as shown in Figs. 12aand 12b for radial positions of 6 and 11 cm at stirrer speedsof 100 and 140 rpm, respectively. The almost constant valueof the shear stress in the near-wall region (laminar sublayer)was taken to be the wall shear stress pertaining to each stirrerspeed.
To determine that the calculated wall shear stresses agreedwith theory in the near-wall region, the velocity data wereexpressed in wall coordinates. Schlichting (1979) noted thatin the immediate neighbourhood of the wall, where theturbulent shearing stress decreases to zero and the laminarstresses predominate (i.e., in the laminar sublayer), the velocitydistribution should follow the “Law of the wall”. This lawrefers to the observation that in nonseparating boundary layerflows, as in the present study, a universal relationship in thenear-wall region is observed when the friction velocity, v*,and kinematic viscosity, ν, are used to scale velocity anddistance for the wall.
Thus, according to the Law of the wall,
[2] U Z Z+ + += ≤for 5
where
[3] Zzv+ =
*ν
[4] Uuv
+ =*
[5] v* =τ
ρwall
In the above eqs. [3]–[5], z is the vertical distance from thebottom plate (in m), u is the measured mean azimuthalvelocity (in m·s–1), ν is the fluid kinematic viscosity (1 ×10⁻⁶ m2·s–1 at 20 °C) (Tchobanoglous and Schroeder 1987),ρ is the fluid density (in kg·m–3), τwall is the wall shear stress(in Pa), and Z+ and U+ are the wall variables scaled with νand the friction velocity v* to yield the “universal” law ofthe wall relationships.
Examples of the data fitted into the Law of the wall coor-dinates are shown in Figs. 13a and 13b for two stirrer speedsof 100 and 140 rpm, respectively. It can be seen that theplots are linear in the laminar sublayer, as expected fromeq. [2], thus confirming the validity of the wall shear stressesand the presence of a laminar sublayer. This procedure wasrepeated for all the radial positions and stirrer speeds.
The wall shear stresses determined from eq. [1] are plot-ted as a function of the stirrer rotation speed and radial posi-tion in Fig. 14. For a particular stirrer rotation speed, theshear stresses were averaged over the radius to obtain amean value of the wall shear stress. Figure 15 shows themean shear stresses plotted against the stirrer rotation speed.
Erosion parametersFor the erosion experiments, the tailings were first poured
into a container. The contents of the container were then
© 2007 NRC Canada
Haneef-Mian et al. 479
Fig. 7. Normalized azimuthal velocity profiles as a function ofincreasing stirrer speed at a radial position of 6 cm inside thecolumn from the side wall.
Fig. 8. Normalized azimuthal velocity profiles as a function ofincreasing stirrer speed (in rpm) at a radial position of 9 cminside the column from the side wall. Umax, maximum velocity.
Can
. Geo
tech
. J. D
ownl
oade
d fr
om w
ww
.nrc
rese
arch
pres
s.co
m b
y M
erce
d (U
CM
) on
05/
06/1
4Fo
r pe
rson
al u
se o
nly.

mixed thoroughly for approximately 30 min using a handstirrer. The slurry was then poured into the flume. Full mix-ing was ensured by rotating the stirrer at a relatively highspeed (170 rpm, which corresponds to a bed shear stress ofapproximately 0.31 Pa). Such an operation was maintainedfor a period of about 20–30 min and then slowed down grad-ually to a complete stop. This allowed the tailings to settle,resulting in a final sediment thickness of 2–3 cm. This allowedthe tailings to deposit evenly on the column bed to createwhat is known as a “deposited bed” (Mehta et al. 1982).This is analogous to the bed formed in a lake after sedimentsare resuspended by storms and subsequently deposited duringcalmer periods. This method of bed preparation is in accor-
© 2007 NRC Canada
480 Can. Geotech. J. Vol. 44, 2007
Fig. 9. Increase in maximum velocity with an increase in stirrer speed for radial positions of 1, 3, 6, 9, 11, 13, and 14 cm in the column.
Fig. 10. Nearly identical azimuthal velocity profiles at 1 cm on eachside of the column centre, confirming axisymmetry at 100 rpm.
Fig. 11. Polynomial fit of the azimuthal velocity profile at100 rpm and 6 cm inside the column from the side wall.
Fig. 12. Wall shear stress at (a) 100 rpm and 6 cm radial posi-tion, and (b) 140 rpm and 11 cm radial position.
Can
. Geo
tech
. J. D
ownl
oade
d fr
om w
ww
.nrc
rese
arch
pres
s.co
m b
y M
erce
d (U
CM
) on
05/
06/1
4Fo
r pe
rson
al u
se o
nly.

dance with work done by other researchers (Sheng and Lick1979; Fukuda and Lick 1980).
The depth of water in the column was kept at 85 cm duringthe experiments. In the entrainment experiments, the waterwas initially at rest and the sediment concentration in theoverlying water was approximately zero. The stirrer was thenrotated at a constant speed corresponding to a desired shearstress (Fig. 15). The sediment concentration in the overlyingwater increased rapidly initially and then attained steady statein approximately 15–30 min. Typical concentration–time datafor the Heath Steele tailings for 4 days of consolidation and abed shear stress of 0.11 Pa are shown in Fig. 16. The sedi-ment concentration levelled off and reached a steady valuewithin 1 h. This behaviour is typical of cohesive sediments and
has also been observed by other researchers (Lick 1982;Parchure and Mehta 1985; Partheniades 1986).
A number of researchers including Mehta et al. (1982)and Dyer (1986) have noted that, for cohesive sediments, anincrease in velocity will cause erosion of the top sedimentlayer, once the induced shear stress, τ b, becomes greaterthan the critical erosion shear stress, τcr , of the sedimentbed. For a certain shear stress increment, the concentrationswill initially increase rapidly but will level off gradually to aconstant value, when a depth of erosion is reached where τcrequals the imposed shear stress. If the shear stress is in-creased in small increments, erosion will result in an in-crease in suspended solids concentration. A further increasein shear stress will cause an additional increase in concentra-tion. Figure 17 illustrates this phenomenon observed in thelaboratory column showing plots of concentration and shearstress versus time. It can be seen from Fig. 17 that the con-centration increased initially at the first shear stress step,levelled off at a certain value, and then increased again asthe applied shear stress was increased.
Critical shear stress for erosionThe prediction of critical shear stress for erosion is an
important issue from the point of view of tailings disposal.To estimate the critical shear stress for erosion of tailings, adifferent set of experiments was conducted where the stirrerrotation speed was increased in steps and held constant for a
© 2007 NRC Canada
Haneef-Mian et al. 481
Fig. 14. Variation of radial wall shear stress with stirrer rotationrate (radial position of 1 cm starts from the side wall of the col-umn).
Fig. 15. Mean wall shear stress as a function of stirrer rotation rate.Fig. 13. Azimuthal velocity at (a) 6 cm radial position in theLaw of the wall coordinates for 100 rpm, and (b) 11 cm radialposition in the Law of the wall coordinates for 140 rpm.
Fig. 16. Concentration of suspended tailings plotted versus timein a single shear experiment.
Can
. Geo
tech
. J. D
ownl
oade
d fr
om w
ww
.nrc
rese
arch
pres
s.co
m b
y M
erce
d (U
CM
) on
05/
06/1
4Fo
r pe
rson
al u
se o
nly.

period of 1 h in each step. The corresponding total sus-pended solids concentrations were recorded for each shearstress increment after each hour. The particle concentrationdata were then converted to entrainment rates using the fol-lowing relationship:
[6] Ed C C
tt=−f i( )
∆
where E is the erosion rate (in g·m–2·s–1), df is the height ofwater in the column overlying the sediment bed (in m), Ct isthe concentration (in mg·L–1) at the end of each shear stressstep of time interval t (in s), and Ci is the concentration(in mg·L–1) at the beginning of the shear stress step of timeinterval t (in s).
The erosion rates thus determined were plotted against therespective shear stresses as shown in Fig. 18 for Heath Steelemine tailings (3 day consolidation). A trend line was fittedto the data and extrapolated to zero concentration, corre-sponding to a certain shear stress. This value of the shearstress was taken to be the critical shear stress for erosion ofthe Heath Steele mine tailings. The value of the criticalshear stress was determined to be 0.102 Pa. Any value ofshear stress greater than this was thought to cause erosion ofthe bottom tailings. The same procedure was followed fordetermining the critical shear stress for erosion of the southLondon silt for 4 days of consolidation time and was foundto be 0.114 Pa (Fig. 19). As expected, the values of criticalshear stress for the south London silt and the mine tailingsare different because of the varying physical properties ofthe two samples and different consolidation times. The criticalshear stress values thus determined are reported in Table 1together with the physical properties of the tailings and silt.
Comparison of critical shear stress from the laboratorycolumn with that from studies in rotating flumes
A number of studies using rotating flumes (Partheniadesand Passewal 1970; Lick 1982; Mehta et al. 1982) haveshown that the critical shear stress needed to initiate sedi-ment erosion in freshwater sediments is approximately onthe order of 0.1 Pa. Torfs et al. (1996) also reported valuesof critical shear stress between 0.1 and 0.2 Pa for clay andsand mixtures of various proportions.
Figure 20 shows a plot comparing flume data for HeathSteele mine tailings from Yanful and Catalan (2002) andPremier Gold Project tailings from Mian and Yanful (2007)with results from the laboratory column for Heath Steeleupper cell tailings (present study). A couple of observationscan be made from Fig. 20. First, Yanful and Catalan ob-served a critical shear stress value of 0.12 Pa for erosion ofHeath Steele mine tailings from time series measurements ofconcentration versus shear stress in the RCF. The concentra-tion versus shear stress data from Yanful and Catalan areconverted to erosion rates and plotted according to the meth-odology described in the present study to determine the criti-cal shear stress for erosion of Heath Steele tailings. Theresults, shown in Fig. 20, give a value of 0.12 Pa for the crit-ical shear stress, which is similar to the value obtaineddirectly form the flume data by Yanful and Catalan. Simi-larly, Mian and Yanful reported a critical shear stress valueof 0.09 Pa for the Premier Gold Project tailings based on theRCF measurements. The same data when plotted accordingto the methodology described in this study gave a criticalshear value of 0.10 Pa (Fig. 20). The similar values of criti-cal shear stress from the two approaches confirm the validityof the methodology described here for determining the criti-cal shear stress. Second, the values of critical shear stressdetermined for the Heath Steel upper cell tailings from boththe RCF and the laboratory column are comparable. Thesmall difference between the two observed values (0.10 Pa
© 2007 NRC Canada
482 Can. Geotech. J. Vol. 44, 2007
Fig. 17. Concentration of suspended tailings plotted versus timein a multiple shear stress experiment, showing typical cohesivesediment profile for a 3 day consolidation time.
Fig. 18. Determination of critical shear stress for erosion ofHeath Steele mine tailings with a 3 day consolidation time.
Fig. 19. Determination of critical shear stress for erosion forsouth London silt with a 4 day consolidation time.
Can
. Geo
tech
. J. D
ownl
oade
d fr
om w
ww
.nrc
rese
arch
pres
s.co
m b
y M
erce
d (U
CM
) on
05/
06/1
4Fo
r pe
rson
al u
se o
nly.

© 2007 NRC Canada
Haneef-Mian et al. 483
τ cr
(Pa)
Ero
sion
para
met
ersb
Mat
eria
lP
rope
rtie
sD
evic
eus
eda
Con
soli
dati
onti
me
(day
s)W
ater
cont
ent
(%)
Cal
cula
ted
(thi
sst
udy)
Obs
erve
d(f
lum
es)
α (kg·
m–2
s·–1
)n
Hea
thS
teel
eup
per
cell
tail
ings
85%
silt
-siz
ean
d5%
sand
-siz
em
ater
ial;
D50
=13
µm
;ka
olin
ite
=10
%–2
0%;
smec
tite
=4%
–6%
;m
ica
=2%
–5%
;re
lativ
ede
nsit
y=
4.0;
spec
ific
sur-
face
=0.
87m
2 ·g–1
;C
EC
=2.
8m
equi
v./1
00g;
gly-
col
rete
ntio
n=
6m
g·g–1
RC
F3
—0.
120
0.12
2×10
–50.
940
Pre
mie
rG
old
Pro
ject
tail
ings
Illi
te=
8%–1
0%;
chlo
rite
=5%
–8%
;C
EC
=3.
2m
equi
v./1
00g;
glyc
olre
tent
ion
=7
mg·
g–1;
D50
<11
µm
RC
F3
—0.
100
0.09
3×10
–50.
900
Hea
thS
teel
uppe
rce
llta
ilin
gs(t
his
stud
y)85
%si
lt-s
ize
and
5%sa
nd-s
ize
mat
eria
l;D
50=
13µ
m;
kaol
init
e=
10%
–20%
;sm
ecti
te=
4%–6
%;
mic
a=
2%–5
%;
rela
tive
dens
ity
=4.
0;sp
ecif
icsu
rfac
e=
0.87
m2 ·g
–1;
CE
C=
2.8
meq
uiv.
/100
g;gl
ycol
rete
ntio
n=
6m
g·g–1
Col
umn
3—
0.10
2na
3×10
–50.
840
Sou
thL
ondo
nsi
lt(t
his
stud
y)85
%si
lt;
D50
=14
µm
Col
umn
4—
0.11
4na
2×10
–50.
815
Bos
ton
Blu
eC
lay
(Zre
iket
al.
1998
)S
peci
fic
grav
ity
=2.
78;
liqu
idli
mit
=43
%;
plas
tic
lim
it=
23%
RC
F1.
8—
0.20
0na
1×10
–40.
813
Bos
ton
Blu
eC
lay
(Zre
iket
al.
1998
)S
peci
fic
grav
ity
=2.
78;
liqu
idli
mit
=43
%;
plas
tic
lim
it=
23%
RC
F18
.5—
0.30
0na
9×10
–51.
780
Dre
dged
spoi
l,T
ham
esR
iver
(Gul
arte
etal
.19
77)
—W
ater
tunn
el—
113–
222
0.16
0na
2×10
–50.
900
Wes
tern
Bas
in,
Lak
eE
rie
(Fuk
uda
and
Lic
k19
80)
—R
otat
ing
flum
e—
81–8
20.
090
na2×
10–4
0.52
0
Cen
tral
Bas
in,
Lak
eE
rie
(Fuk
uda
and
Lic
k19
80)
—R
otat
ing
flum
e—
74–7
50.
130
na2×
10–5
0.90
0
a RC
F,ro
tatin
gci
rcla
rfl
ume.
b See
eq.
[7].
Tab
le1.
Ero
sion
para
met
ers
for
min
eta
ilin
gsfr
omth
eco
lum
nan
dth
eR
CF.
Can
. Geo
tech
. J. D
ownl
oade
d fr
om w
ww
.nrc
rese
arch
pres
s.co
m b
y M
erce
d (U
CM
) on
05/
06/1
4Fo
r pe
rson
al u
se o
nly.

from the laboratory column versus 0.12 Pa from the RCFdata) was likely because of the method of shear stress gener-ation (stirrer induced in the column in contrast to rotation ofthe top and bottom lids in opposite directions in the RCF),spatial variation of the wall shear stresses (uniform over theflume radius versus mean of seven slightly different valuesof shear stress over the column radius), and the amount ofsample used (90 kg in the flume versus a few kilograms inthe column). The two values are within ±15% of each other.It can be observed from Fig. 20 that extrapolations of all theplots converge to shear stresses of 0.10–0.12 Pa for all thetailings samples from both the RCF and the column.
To compare the values of critical shear stresses obtainedfor mine tailings with those obtained from naturally occur-ring cohesive sediments, data were taken from Gularte et al.(1977), Fukuda and Lick (1980), and Zreik et al. (1998) andplotted in a manner similar to that of Fig. 20 to determinethe critical shear stresses. These resulting plots are shown inFigs. 21–23. For the data from Zreik et al., the critical shearstress values for Boston Blue Clay were 0.20 and 0.30 Pawith consolidation times of 1.8 and 18.5 days, respectively.The critical shear stress value from Fukuda and Lick forLake Erie sediments with 74%–75% water content was 0.13 Pa,whereas for the same sediments with 81%–82% water con-tent the value was 0.09 Pa. The critical shear stress forThames River sediments from Gularte et al. was 0.16 Pa. Asummary of the sediment properties, the type of equipmentused for erosion experiments, and the resulting critical shearstress values is presented in Table 1.
It can be noted from Table 1 that for naturally occurringcohesive sediments the critical shear stress for erosion isdifferent for individual sediments. For naturally occurringcohesive sediments studied by other researchers, the criticalshear stress values ranged from 0.09 Pa for Lake Eriesediment with a water content of 81%–82% to 0.30 Pa forBoston Blue Clay with a consolidation time of 18.5 days.The standard deviation for critical shear stress for naturallyoccurring cohesive sediments was 0.08 Pa. On the otherhand, the critical shear stress values for various mine tailingssamples tested in two different apparatuses, i.e., the labora-
tory column and the RCF, fell within a close range of 0.10–0.12 Pa, with a standard deviation of 0.01 Pa. Such behav-iour suggests a similar physicochemical nature of fine minetailings. This observation would seem to suggest that an
© 2007 NRC Canada
484 Can. Geotech. J. Vol. 44, 2007
Fig. 20. Critical shear stress for data from the column for Heath Steel mine tailings and from the RCF for Heath Steele and PremierGold Project tailings. Extrapolations of the plots converged to shear stresses of 0.10–0.12 Pa.
Fig. 21. Determination of critical shear stress for Boston BlueClay for tests conducted in the RCF. Data from Zreik et al.(1998).
Fig. 22. Determination of critical shear stress for data fromGularte et al. (1977) for sediments tested in a recirculating watertunnel.
Can
. Geo
tech
. J. D
ownl
oade
d fr
om w
ww
.nrc
rese
arch
pres
s.co
m b
y M
erce
d (U
CM
) on
05/
06/1
4Fo
r pe
rson
al u
se o
nly.
average value of critical shear stress may be assumed for co-hesive mine tailings in general.
Relationship between erosion rate and excess shearstress
A number of researchers including Lick (1982), Mehta etal. (1982), and Zeigler and Lick (1986) have noted that therate of erosion of cohesive sediments is controlled by theexcess shear stress (i.e., τ τ− cr , where τcr is the critical shearstress). Hence, an attempt was made to define a relationshipbetween the rate of erosion and the excess shear stress forthe sediments studied. It was observed that when the excessshear stress was normalized by the critical shear stress andplotted against erosion rate on a logarithm–logarithm scale,the data showed reasonable linearity. Such linearity suggeststhe applicability of a power-law fit between erosion rate (E)and normalized excess shear stress [(τ τ− cr )/τcr ] as shown inFigs. 24 and 25 for the Heath Steele mine tailings and thesouth London silt, respectively. A general form of the equa-tion can be written as follows:
[7] E
n
=−
α
τ ττ
cr
cr
where E is the erosion rate (in kg·m–2·s–1), τ is the shear stress(in Pa), τcr is the critical shear stress (in Pa), n is an exponent(dimensionless), and α is a coefficient (in kg·m–2·s–1).
Figure 26 shows the erosion rates from the RCF for HeathSteele and Premier Gold Project tailings and from the labora-tory column for Heath Steele tailings and south London siltversus the normalized excess shear stress on a logarithm–logarithm scale. Data from Gularte et al. (1977), Fukuda andLick (1980), and Zreik et al. (1998) are also plotted in Fig. 26for comparison purposes. The resulting equations for individualsediments are shown in Fig. 26, and the derived values of nand α are summarized in Table 1. For the Heath Steele minetailings samples with a consolidation time of 3 days, n is 0.84for the column data and 0.94 for the RCF data. The corre-sponding values of α are 3 × 10⁻⁵ kg·m–2·s–1 for the columndata and 2 × 10⁻⁵ kg·m–2·s–1 for the RCF data. For PremierGold Project tailings tested in the RCF with 3 days of con-solidation, α is 3 × 10⁻⁵ kg·m–2·s–1 and n is 0.90. The aver-age value of n from the RCF and column data was 0.89, and
that of α was 2.7 × 10⁻⁵. The standard deviation of n is 0.05and that of α is 5.8 × 10⁻⁶. The values obtained from thedata of Gularte et al., Fukuda and Lick, and Zreik et al. areshown in Table 1.
The tailings erosion data plot in the same region in Fig. 26despite the fact that they were tested in two different appara-tuses, i.e., the RCF and the column. Two important conclu-sions can be drawn from these results. First, the results confirmthe similar physicochemical nature of tailings samples fromthis and other studies. These tailings are the product of blast-ing, milling (grinding), and flotation (during which chemi-cals are added) and are different from natural sediments,whose structures are governed by weathering, transportation,sedimentation, and sorting. Depending on the milling pro-cess, tailings could be very fine and uniform. Upon consoli-dation, such uniform sizes could result in similar structures.The fact that the tailings plot in the same region confirmstheir similar physicochemical nature. Second, similar ero-sion rates of tailings from the column and the RCF suggest
© 2007 NRC Canada
Haneef-Mian et al. 485
Fig. 23. Determination of critical shear stress for data fromFukuda and Lick (1980) for tests conducted in a rotating flume.The sediments had different water contents.
Fig. 24. Rates of erosion versus bottom shear stress from thelaboratory column for Heath Steele mine tailings with a 3 dayconsolidation on a logarithm–logarithm scale. The line is a leastsquares fit of the erosion law E = α[(τ τ− cr)/τcr]
n. The resultingvalues of α and n are reported in Table 1.
Fig. 25. Rates of erosion versus bottom shear stress from theUniversity of Western Ontario laboratory column for south Lon-don silt with a 4 day consolidation on a logarithm–logarithmscale. The line is a least squares fit of the erosion law E =α[(τ τ− cr)/τcr]
n. The resulting values of α and n are reported inTable 1.
Can
. Geo
tech
. J. D
ownl
oade
d fr
om w
ww
.nrc
rese
arch
pres
s.co
m b
y M
erce
d (U
CM
) on
05/
06/1
4Fo
r pe
rson
al u
se o
nly.

the applicability of the column and its results. Data fromGularte et al. (1977), Fukuda and Lick (1980), and Zreik etal. (1998) plotted in different regions in Fig. 26, indicatingdifferent erosion rates and erosion parameters.
Results such as those reported in Fig. 26 and Table 1 arenot surprising because, as discussed earlier, the critical shearstress of cohesive sediments is controlled by a number ofphysical and geological factors, including mineral composi-tion (different clay minerals), composition of the pore waterand eroding fluid (saline or brackish), thixotropy and consol-idation of the material and its resulting fabric, biologicalprocesses, the content and origin of organic matter of diverseorigin, and the amounts of sand and silt (Kamphuis and Hall1983; Torfs et al. 1996).
Based on the aforementioned results, the following ero-sion equation for cohesive mine tailings is suggested:
[8] E = ×−
−2 10 5 τ 0.107
0.107
0.89
where E is the erosion rate (in kg·m–2·s–1); τ is the appliedshear stress (in Pa); 0.107 is the average value of criticalshear stress for cohesive mine tailings (in Pa); and 2 ×10⁻⁵ and 0.89 are average values of α (in kg·m–2·s–1) and n(dimensionless), respectively, for cohesive mine tailingsdetermined from Table 1.
Example of application of eq. [8]From eq. [8], one can estimate the required water cover
depth for cohesive mine tailings disposal. The values of α, n,and τcr are known, but the bed shear stress τ is not. The bedshear stress is a function of wind intensity, direction, andduration, fetch of the tailings pond, and the depth of thewater cover. Once these parameters are known from sitemeasurements, the depth of water cover required to mini-mize the net amount of resuspension can be estimated. Thisprocess of estimating the required water cover depth hasbeen incorporated into a design methodology described indetail by Samad and Yanful (2005). The method has beenvalidated for a number of sites including the Heath Steelelower cell tailings area. Yanful and Catalan (2002) performedan evaluation of the effect of the range of values for themeasured critical shear stress on the depth of water cover forthe Heath Steele site. For measured lower and upper boundvalues of 0.12 and 0.17 Pa, respectively, for the critical shearstress, Yanful and Catalan showed that the minimum depthof water cover required to eliminate resuspension was 1.18–1.34 m compared with the preclosure nominal design depthof 1.00 m initially adopted for the site. Design calculationsperformed by Samad and Yanful (2005) indicate that a 0.30 mdifference in water depth can change the suspended tailingsconcentration by 20 mg·L–1. This can be significant whenone considers that the Canadian effluent discharge limit fortotal suspended solids is 25 mg·L–1 (Mian and Yanful 2004).
© 2007 NRC Canada
486 Can. Geotech. J. Vol. 44, 2007
Fig. 26. Rates of erosion versus bottom shear stresses obtained from the RCF and the laboratory column for three mine tailings, southLondon silt, and Boston Blue Clay on a logarithm–logarithm scale. Data from Zreik et al. (1998), Gularte et al. (1977), and Fukudaand Lick (1980) have also been plotted. The lines are least squares fits of the erosion law E = α[(τ τ− cr)/τcr]
n. The equation arisingfrom each line is plotted on that line. The values of α and n thus obtained are reported in Table 1.
Can
. Geo
tech
. J. D
ownl
oade
d fr
om w
ww
.nrc
rese
arch
pres
s.co
m b
y M
erce
d (U
CM
) on
05/
06/1
4Fo
r pe
rson
al u
se o
nly.

Summary and conclusions
The study presented an investigation of the critical shearstress for erosion of cohesive mine tailings. A laboratorycolumn for measuring the critical shear stress for erosion ofcohesive sediments has been developed and calibrated. Thecolumn was 1.2 m tall and 30 cm in diameter. A Teflon stirrerwas used to exert shear stresses on the bottom sediments.The Law of the wall was used to obtain wall shear stressvalues for various stirrer rotation rates. The following con-clusions are drawn based on the observations:(1) For the range of stirrer rotation speeds used in this study
(40–170 rpm), the shear stresses increased linearly withan increase in stirrer rotation speeds.
(2) In typical resuspension experiments in the columninvolving mine tailings, the sediment concentrationsincreased rapidly initially and attained a steady statevalue within 1 h. Such behaviour was similar to resultsobtained for naturally occurring cohesive sediments inrotating circular flumes by other researchers.
(3) A methodology has been described for determining thecritical shear stress for erosion of cohesive mine tailingsand cohesive sediments in general. Yanful and Catalan(2002) observed from concentration versus time data inthe rotating circular flume (RCF) that the critical shearstress for erosion of Heath Steele mine tailings was0.12 Pa. The same data plotted according to the method-ology described in this study gave a value of 0.12 Pa.Similarly, Mian and Yanful (2007) observed a value of0.09 Pa for the critical shear stress of Premier Gold Pro-ject tailings from the RCF. The same data when plottedaccording to the methodology proposed in the presentstudy gave a critical shear value of 0.10 Pa. The observa-tions strengthen the validity of the approach suggestedfor determining the critical shear stress. The critical shearstress for erosion of Heath Steele mine tailings deter-mined from the laboratory column was comparable withthat obtained for the same tailings in the RCF.
(4) The critical shear stress values obtained in this studywere 0.102 and 0.114 Pa for the Heath Steele mine tail-ings and south London silt, respectively. These valuesare of the same order of magnitude as those reported inthe literature for naturally occurring cohesive sediments.
(5) The results from this study support the existence of apower-law relation between the erosion rate and normal-ized excess shear stress. The parameters in the power-law relation were found to be identical for mine tailingstested in the RCF and the column, confirming the simi-lar physicochemical nature of the tailings particles andthe applicability of the column results.
(6) Based on the results, a general erosion equation hasbeen suggested for cohesive mine tailings particles andfor use in calculating minimum water cover depths formine tailings disposal. Equation [8] gives a reasonablefirst approximation of the relation between erosion rateand shear stress which may be used for designing a newwater cover or for analyzing sediment concentration inexisting water covers. As the values of the erosion pa-rameters are slightly different for individual sediments,however, it is recommended that erosion tests should berun for individual mine tailings where possible.
In cases where resources are limited, the approach pro-posed in the present study should give a reasonable estimateof the critical shear stress. Although the study has increasedthe understanding of the erosion behaviour of cohesive minetailings, much more needs to be done before a quantitativepredictive transport model can be developed for shallowwater covers.
Acknowledgments
The work described in this paper has been funded by theNatural Sciences and Engineering Research Council of Canada(NSERC) in the form of a Premier’s Research ExcellenceAward to E.K. Yanful. Noranda, Inco, BHP Billiton, Boliden,Falconbridge, Cambior, Newmont Canada, and Tech Corpo-ration have been industrial partners.
References
Adu-Wusu, C., Yanful, E.K., and Mian, M.H. 2001. Field evidenceof resuspension in a mine tailings pond. Canadian GeotechnicalJournal, 38(4): 796–808.
Ariathurai, R., and Arulanandan, K. 1978. Erosion rates of cohe-sive soils. Journal of the Hydraulics Division, ASCE, 104(HY2):279–283.
Blake, A.C., Chadwick, D.B., White, P.J., and Jones, C.A. 2004.Interim guide for assessing sediment transport at Navy facilities.Space and Naval Warfare Systems Center, San Diego, Calif.
Bowles, J.E. 1992. Engineering properties of soils and their mea-surement. 4th ed. McGraw-Hill, New York.
Bradley, W.F. 1945. Diagnostic criteria for clay minerals. Ameri-can Mineralogist, 30: 704–713.
Brindley, G.W., and Brown, G. 1989. Crystal structures of clayminerals and their X-ray identification. Monograph 5, Mineral-ogical Society, London, UK.
Catalan, L.J.J., and Yanful, E.K. 2002. Sediment trap measurementof suspended mine tailings in a shallow water cover. Journal ofEnvironmental Engineering, ASCE, 128(1): 19–30.
Chapuis, R.P., and Gatien, T. 1986. An improved rotating cylindertechnique for quantitative measurements of the scour resistanceof clays. Canadian Geotechnical Journal, 23(1): 83–87.
Chhabra, R., Pleysier, J., and Cremers, A. 1976. The measurementof the cation exchange capacity and exchangeable cations insoils: a new method. In Proceedings of the International ClayConference, Mexico City, 16–23 July 1975. Edited by S.W. Bailey.Applied Publishing Ltd., Wilmette, Ill. pp. 439–449.
Dixon, J.B., and Weed, C.B. 1977. Minerals in soil environments.Soil Science Society of America, Madison, Wisc.
Dunn, I.S. 1959. Tractive resistance of cohesive channels. Journalof the Soil Mechanics and Foundations Division, ASCE, 85(3):1–24.
Dyer, K.R. 1986. Coastal and estuarine sediments. Wiley, NewYork.
Fukuda, M.K., and Lick, W. 1980. The entrainment of cohesivesediments in fresh water. Journal of Geophysical Research, 85:2813–2824.
Gularte, R.C., Kelly, W.E., Nacci, V.A., Stephens, H.S., Coles,N.G., and Clarke, J.A. (Editors). 1977. Threshold erosionalvelocities and rates of erosion for redeposited estuarine dredgematerials. In Proceeding of 2nd 233 International Symposiumon Dredging Technology at Texas A&M University. Vol. 1.
© 2007 NRC Canada
Haneef-Mian et al. 487
Can
. Geo
tech
. J. D
ownl
oade
d fr
om w
ww
.nrc
rese
arch
pres
s.co
m b
y M
erce
d (U
CM
) on
05/
06/1
4Fo
r pe
rson
al u
se o
nly.

Haralampides, K., McCorquodale, J.A., and Krishnappan, B.G. 1993.Deposition properties of fine sediments. Journal of HydraulicEngineering, ASCE, 129: 230–234.
Hayter, E.J., and Mehta, A.J. 1986. Modeling cohesive sedimenttransport in estuarial waters. Applied Mathematical Modeling,10: 294–303.
Kamphuis, K.W., and Hall, K.R. 1983. Cohesive material erosionby unidirectional current. Journal of Hydraulic Engineering,ASCE, 109(1): 49–60.
Kashir, M., and Yanful, E.K. 2001. Hydraulic conductivity ofbentonite permeated with acid mine drainage. Canadian Geo-technical Journal, 38(5): 1034–1048.
Krishnamurthy, M. 1983. Incipient motion of cohesive soils. InProceedings of the Conference on Frontiers in Hydraulic Engi-neering, Cambridge, Mass., 9–12 August 1983. Edited by H.T.Shen. ASCE, New York. pp. 96–101.
Krishnappan, B.G. 1993. Rotating circular flume. Journal ofHydraulic Engineering, ASCE, 119(6): 758–767.
Krone, R.B. 1962. Flume studies of the transport of sediment inestuarial shoaling processes. Final Report, Hydraulic EngineeringLaboratory and Sanitary Engineering Research Laboratory, Uni-versity of California, Berkeley, Calif.
Lee, D.-Y., Lick, W., and Kang, S.W. 1981. The entrainment anddeposition of fine grained sediments in Lake Erie. Journal ofGreat Lakes Research, 7(3): 224–233.
Lefebvre, G., Rohan, K., and Millete, J.-P. 1986. Erosivity of intactclay: Influence of the natural structure. Canadian GeotechnicalJournal, 23(4): 427–434.
Li, M., St-Arnaud, L., and Aubé, B. 1997. Considerations in theuse of shallow water covers for decommissioning reactive tail-ings. In Proceedings of the 4th International Conference on AcidRock Drainage, Vancouver, B.C., 31 May – 6 June 1997. MENDReport 7.2b, MEND Secretariat, Natural Resources Canada,Ottawa, Ont. Vol. 1, pp. 115–130.
Lick, W. 1982. Entrainment, deposition, and transport of fine-grainedsediments in lakes. Hydrobiologia, 91: 31–40.
McNeil, J., Taylor, C., and Lick, W. 1996. Measurements of erosionof undisturbed bottom sediments with depth. Journal of HydraulicEngineering, ASCE, 122: 316–324.
Mehta, A.J., and Partheniades, E. 1975. An investigation of thedepositional properties of flocculated fine sediments. Journal ofHydraulics Research, 12(4): 361–381.
Mehta, A.J., and Partheniades, E. 1982. Resuspension of depositedcohesive sediment beds. In Proceedings of the 18th CoastalEngineering Conference, Cape Town, South Africa, 14–19 Nov-ember 1982. ASCE, New York. Vol. 2, pp. 1569–1588.
Mehta, A.J., Parchure, T.M., Dixit, J.G., and Ariathurai, R. 1982.Resuspension potential of deposited cohesive sediment beds. InEstuarine comparisons. Edited by V.S. Kennedy. University ofMaryland, Cambridge, Md. pp. 591–609.
Mehta, A.J., Hayter, E.J., Parker, W.R., Krone, R.B., and Teeter,A.M. 1989. Cohesive sediment transport I: Process description.Journal of Hydraulic Engineering, ASCE, 115(8): 1076–1093.
Mian, M.H., and Yanful, E.K. 2003. Tailings erosion and resus-pension in two mine tailings ponds due to wind waves. Advancesin Environmental Research, 7(4): 745–765.
Mian, M.H., and Yanful, E.K. 2004. Analysis of wind-driven resus-pension of metal mine sludge in a tailings pond. Journal ofEnvironmental Engineering and Science, 3(2): 119–135.
Mian, M.H., and Yanful, E.K. 2007. Erosion characteristics andresuspension of sub-aqueous mine tailings. Journal of Environ-mental Engineering and Science. 6: 175–190.
Migniot, C. 1968. Étude des propriétés physique de différents sédi-ments trés fines et de leur comportement sous des actions hydro-dynamiques. La Houille Blanche, 23(7): 591–620. [In French.]
Mitchener, H.J., Torfs H., and Whitehouse, R.J. 1996. Erosion ofmud/sand mixtures. Coastal Engineering, 29: 1–25.
Moore, W.L., and Masch, F.D. 1962. Experiments on the scourresistance of cohesive soils. Journal of Geophysical Research,67(4): 1437–1446.
Moore, D.M., and Reynolds, R.C., Jr. 1997. X-ray diffraction andthe identification and analysis of minerals. Oxford UniversityPress Inc., New York.
Parchure, T.M., and Mehta, A.J. 1985. Erosion of soft cohesivesediment deposits. Journal of Hydraulic Engineering, ASCE,111(10): 1308–1326.
Partheniades, E. 1962. A study of erosion and deposition of cohe-sive soils in salt water. Ph.D. thesis, University of California,Berkeley, Calif.
Partheniades, E. 1965. Erosion and deposition of cohesive soils.Journal of the Hydraulics Division, ASCE, 91(HY1): 105–138.
Partheniades, E. 1986. A fundamental framework for cohesivesediment dynamics. In Estuarine cohesive sediment dynamics:lecture notes on coastal and estuarine studies. Edited by A.J.Mehta. Springer Verlag, New York. pp. 219–250.
Partheniades, E., and Passewal, R.E. 1970. Erodibility of channelswith a cohesive boundary. Journal of the Hydraulics Division,ASCE, 96(HY3): 755–771.
Partheniades, E., Cross, R.H., and Ayora, A. 1968. Further resultson the deposition of cohesive sediments. In Proceedings of the11th International Conference on Coastal Engineering, London,UK. ASCE, New York. Vol. 2, pp. 723–742.
Raudkivi, A.J. 1998. Loose boundary hydraulics. A.A. Balkema,Rotterdam, the Netherlands.
Rohan, K., Lefebvre, G., Douville, S., and Milette, J.-P. 1986. Anew technique to evaluate erosivitiy of cohesive material. Geo-technical Testing Journal, ASTM, 9(2): 87–92.
Samad, M.A., and Yanful, E.K. 2005. A design approach forselecting the optimum water cover depth for subaqueous dis-posal of sulfide mine tailings. Canadian Geotechnical Journal,42(1): 207–228.
Schlichting, H. 1979. Boundary-layer theory. 7th ed. McGraw-Hill,New York.
Schünemann, M., and Kühl, H. 1991. A device for erosion mea-surements on naturally formed muddy sediments: the EROMES-System. Report GKSS 91/E/18, GKSS Research Centre, Geesthact,Germany.
Schünemann, M., and Kühl, H. 1993. Experimental investigations ofthe erosional behaviour of naturally formed mud from the Elbeestuary and adjacent Wadden Sea. In Nearshore and estuarinecohesive sediment transport. Edited by A.J. Mehta. Coastal andEstuarine Studies Series, American Geophysical Union, Washing-ton, D.C. Vol. 42, pp. 314–330.
Sheng, Y.P., and Lick, W. 1979. The transport and resuspension ofsediments in a shallow lake. Journal of Geophysical Research,84(C4): 1809–1826.
Smerdon, E.T., and Beasley, R.P. 1961. Critical traction forces incohesive soils. Agricultural Engineering, 42: 26–29.
Soderman, L.G., and Quigley, R.M. 1965. Geotechnical propertiesof three Ontario clays. Canadian Geotechnical Journal, 2(2):167–189.
Soulsby, R. 1997. Dynamics of marine sands: a manual for practicalapplications. Thomas Telford Publications, Inc., London, U.K.
Tchobanoglous, G., and Schroeder, E.D. 1987. Water quality. Addison-Wesley Publishing Company, Inc., Reading, Mass.
© 2007 NRC Canada
488 Can. Geotech. J. Vol. 44, 2007
Can
. Geo
tech
. J. D
ownl
oade
d fr
om w
ww
.nrc
rese
arch
pres
s.co
m b
y M
erce
d (U
CM
) on
05/
06/1
4Fo
r pe
rson
al u
se o
nly.

Torfs, H., Mitchener, H., Huysentruyt, H., and Toorman, E. 1996.Settling and consolidation of mud. Coastal Engineering, 29: 27–45.
Tsai, C.H., and Lick, W. 1987. Resuspension of sediments fromLong Island Sound. Water Science and Technology, 21(6/7):155–184.
US Army Corps of Engineers. 2002. Coastal engineering manual.Engineer Manual 1110-2-1100, US Army Corps of Engineers,Washington, D.C.
Xu, Y. 1991. Transport properties of fine grained sediments. Ph.D.thesis, University of California, Santa Barbara, Calif.
Yanful, E.K., and Catalan, L.J. 2002. Predicted and field-measuredresuspension of flooded mine tailings. Journal of EnvironmentalEngineering, ASCE, 128: 341–351.
Yanful, E.K., and Verma, A. 1999. Oxidation of flooded mine tail-ings due to resuspension. Canadian Geotechnical Journal, 36(5):826–845.
Yanful, E.K., Verma, A., and Straatman, A.S. 2000. Turbulence-driven metal release from resuspended pyrrhotite tailings. Jour-nal of Geotechnical and Geoenvironmental Engineering, ASCE,126: 1157–1165.
Zeigler, C.K., and Lick, W. 1986. The transport of fine grainedsediments in shallow waters. Environmental Geology and WaterSciences, 11(1): 123–132.
Zreik, D.A., Krishnappan, B.G., Germaine, J.T., Madsen, O.S., andLadd, C.C. 1998. Erosional and mechanical strengths of depos-ited cohesive sediments. Journal of Hydraulic Engineering, ASCE,124(1): 1076–1085.
© 2007 NRC Canada
Haneef-Mian et al. 489
Can
. Geo
tech
. J. D
ownl
oade
d fr
om w
ww
.nrc
rese
arch
pres
s.co
m b
y M
erce
d (U
CM
) on
05/
06/1
4Fo
r pe
rson
al u
se o
nly.
This article has been cited by:
1. Akué Sylvette Awoh, Mamert Mbonimpa, Bruno Bussière, Benoît Plante, Hassan Bouzahzah. 2014. Laboratory Study of HighlyPyritic Tailings Submerged Beneath a Water Cover Under Various Hydrodynamic Conditions. Mine Water and the Environment. [CrossRef]
2. Akué Sylvette Awoh, Mamert Mbonimpa, Bruno Bussière. 2013. Field Study of the Chemical and Physical Stability of HighlySulphide-Rich Tailings Stored Under a Shallow Water Cover. Mine Water and the Environment 32:1, 42-55. [CrossRef]
Can
. Geo
tech
. J. D
ownl
oade
d fr
om w
ww
.nrc
rese
arch
pres
s.co
m b
y M
erce
d (U
CM
) on
05/
06/1
4Fo
r pe
rson
al u
se o
nly.