measuring teacher effectiveness with the stallings...
TRANSCRIPT

Inside the Black Box of the Classroom
Measuring teacher effectiveness with the Stallings “classroom snapshot”
Barbara Bruns
Lead Education Economist
Education Global Practice
The World Bank
SIEF/NYU Workshop on EducationOutcome Measurement
May 11-12, 2015

Education production functions usually estimate a “reduced version” based on data available
2
Student Learning
Outcomes(test scores, pass and graduation
rates)
Teacher Classroom practice
Student characteristics(family background and
sometimes prior year tests)
School characteristics (spending per student, pupil-
teacher ratios)
Teacher Content knowledge
(formal qualifcations, years of experience, salaries) sometimes tests
Teaching skill and motivation
But two key components• teacher skill and
motivation and
• teacher pratice in theclassroom
are not easily measured
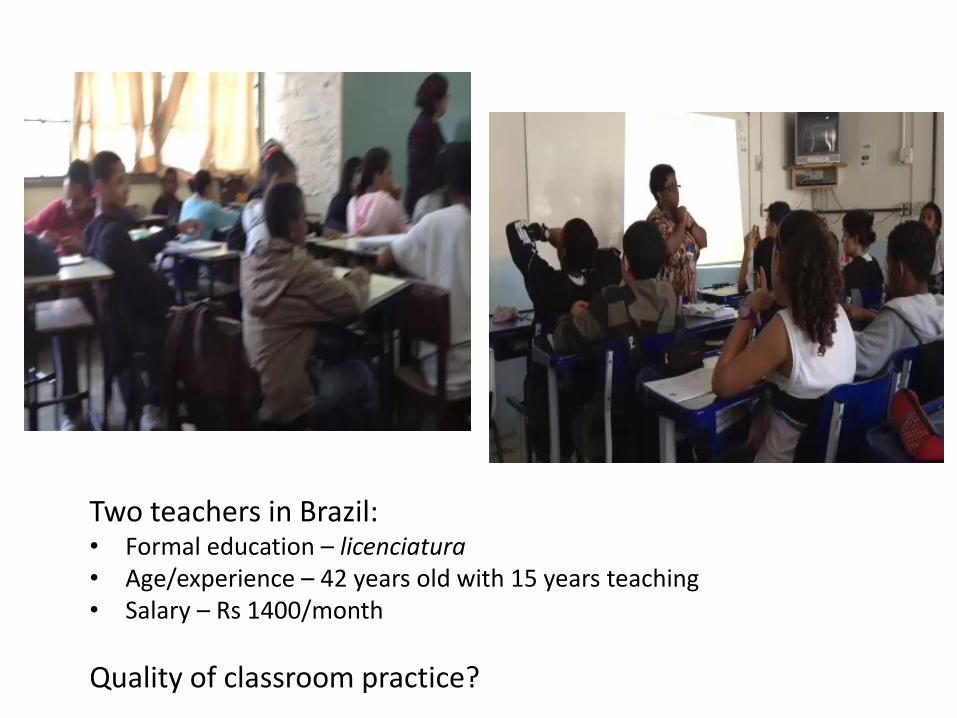
Two teachers in Brazil:• Formal education – licenciatura• Age/experience – 42 years old with 15 years teaching• Salary – Rs 1400/month
Quality of classroom practice?

Classroom observation allows us to measure directly the key output of the education system
4
Teacher classroom practice
Student characteristics
School characteristics
Teacher Content knowledge
Teaching skill and motivation
Student Learning
Outcomes

Theory of action: any results caused by a change in teacherpolicy (standards, incentives, training) must come through changesin teacher effort and/or effectiveness in classroom
ACTIVITIES
Curriculumdesign
Teacher trainingSchool
supervision
INPUTS
FinancingSalariesSchool
constructionBooks
ICT/Materials
Output
Teacherpractice in
theclassroom
Inputs
Activities
Results
OutcomesStudentlearning
GraduationRates
EmploymentWage gains
Standardized classroom observation allows us to measure
these changes

Classroom observations using the Stallings method

Classroom observation – alternative tools, depending
on purpose
System diagnosis/impact evaluation Robust data that is representative at the system level
Use trained observers in the classroom or video footage analyzed later
Most cost-effective: 1-2 observers visit each school observing the maximum number of classrooms possible in a single day (for small schools, one observer; schools with more than 10 classrooms, 2 observers)
Best method: Stallings Classroom snapshot
2010 study by Prof. Matthew Jukes reviewed main alternatives (CLASS, ETP method, SSOS (special strategies observation system), VTBI (Vergilio), COKER, STARS (Spaulding), OCEPT and concluded that Stallings had key advantages
Individual teacher performance evaluation Observe and analyze individual teachers’ practice for formative or personnel actions
Expert observers in the classroom - but multiple visits are essential
Or video footage analyzed later
Best examples: Washington DC Impact program, Cincinnati Teacher Evaluation System, Chile’s Docentemas, CLASS
Gates MET study (Kane et al 2013): “valid assessment of an individual teacher’s performance
requires multiple observations and use of an instrument that captures teacher content mastery,
quality of curriculum delivery, pre-class preparation and other school contributions” 7

What does it measure? Teacher’s use of instructional time Use of materials, including ICT Core pedagogical practices Ability to keep students engaged
Stallings “classroom snapshot” instrument:
How does it work?• 10 observations of each
class taken at regular
intervals
• coded using a standardized
grid

Scanning the classroom
15
seconds
The classroom “snapshot”
Observing a classroom Divide the total class time by 10 to
determine the interval betweenobservations. For a 50 minute class50/10= 5, meaning an observationis made every 5 minutes
Wait 3 minutos (after the official
start time of the class) for the firstobservation
Each observation lasts 15seconds, starts with the teacher
and scans the room in a circle tonote what the students are doing
After the 15 seconds, the observerwrites a brief description of whatwas seen in a box on the page andthen codes it (this aids in ex postquality assurance)
360º
The observer repeats this 10 times duringthe class at regular intervals

Stallings “classroom snapshot” Advantages: low inference, high inter-rater reliability (greater than .7) can
be achieved with a one week, 40 hour training course metrics not affected by curriculum or language of instruction,
therefore comparable across countries generates robust quantitative data on classroom dynamics
across a school system and within schools US good practice benchmarks and growing body of cross-
country data available
Research protocol: Randomly selected, representative sample of schools (ideally
15-20% of schools in system) Randomly selected classrooms within schools (among
targeted grades and subjects) No warning to schools of date and time of observations
Teacher anonymity 10

Limitations of Stallings method
• But…still need careful interpretation of results • Hawthorne effects• No data yet on noisiness of data (ie, would an individual school look
different on a second or third visit?)
• Cannot assign causality to correlations • Most school systems have non-random assignment of teachers to classes
(senior teachers get to choose their classes; student are tracked into classrooms by ability)
• So…is it a better teacher or better students producing better dynamics?
• Instrument does not capture content• Curriculum content• Teacher content mastery
Two 6th grade math classes -- in Singaporeand Peru -- may look identical on Stallingsmeasures, while students in Singaporeare 3 years ahead in math content

Stallings’ “Good Practice” Benchmarks from US research
12Source: Stallings and Knight (2003)
Stallings Benchmarks for Effective Time Use (from US research)
TeacherInstruction 85%
Active Instruction 50% or more
Reading aloud
Instruction/Explanation
Question and answer/discussion
Drill and practice
Projects (cooperative learning)
Passive Instruction 35% or less
Monitoring Copying
Monitoring Seatwork
Classroom Management 15% or less
Giving Assignments (verbal instruction)
Managing with Students
Disciplining Students
Managing Alone
Off-Task Socializing with Students 0%
Socializing with Others
StudentsOff-Task 6% or less
Uninvolved
Acting out

OBSERVATION CODING GRID
MATERIAL
ACTIVITY
NO
MATERIALTEXTBOOK NOTEBOOK
BLACK
BOARDLEARNING AIDES ICT COOPERATIVE
1. READING ALOUDT 1 S L E 1 S L E 1 S L E 1 S L E 1 S L E 1 S L E S L E
I 1 S L 1 S L 1 S L 1 S L 1 S L 1 S L S L
CHECK IF CHORAL READING
2.DEMONSTRATION/ LECTURE
T 1 S L E 1 S L E 1 S L E 1 S L E 1 S L E 1 S L E S L E
I 1 S L 1 S L 1 S L 1 S L 1 S L 1 S L S L
3. DISCUSSION/QUESTIONS
AND ANSWERS
T 1 S L E 1 S L E 1 S L E 1 S L E 1 S L E 1 S L E S L E
I 1 S L 1 S L 1 S L 1 S L 1 S L 1 S L S L
4. PRACTICE
& DRILLT 1 S L E 1 S L E 1 S L E 1 S L E 1 S L E 1 S L E S L E
I 1 S L 1 S L 1 S L 1 S L 1 S L 1 S L S L
5. ASSIGNMENT/ CLASS
WORKT 1 S L E 1 S L E 1 S L E 1 S L E 1 S L E 1 S L E S L E
I 1 S L 1 S L 1 S L 1 S L 1 S L 1 S L S L
6. COPYINGT 1 S L E 1 S L E 1 S L E 1 S L E 1 S L E 1 S L E S L E
I 1 S L 1 S L 1 S L 1 S L 1 S L 1 S L S L
7. VERBAL
INSTRUCTIONT 1 S L E 1 S L E 1 S L E 1 S L E 1 S L E 1 S L E S L E
I 1 S L 1 S L 1 S L 1 S L 1 S L 1 S L S L
8. SOCIAL
INTERACTIONT 1 S L E
I 1 S L
9. STUDENT(S)UNINVOLVED
I 1 S L
10. DISCIPLINET 1 S L E
11. CLASSROOM
MANAGEMENTT 1 S L E
I 1 S L
12. CLASSROOM MANAGEMENT ALONE T
13. TEACHER SOCIAL INTERACTION OR TEACHER UNINVOLVED T
14. TEACHER OUT OF THE ROOM T
School No.:Classroom No. Exact time of observation:
What was the teacher doing?
What were the students doing?
How many students were visibly not engaged?
Grade: Subject:

Coding grid
FIGURE 1: EXCERPT FROM CLASSROOM SNAPSHOT (APPENDIX 2)
CLASSROOM OBSERVATION SNAPSHOT
MATERIAL
ACTIVITY
NO MATERIAL
TEXTBOOK NOTEBOOK BLACK BOARD
LEARNING
AIDES ICT COOPERATIVE
1. READING ALOUD T 1 S L E 1 S L E 1 S L E
1 S L E 1 S L E 1 S L E S L E
I 1 S L 1 S L 1 S L 1 S L 1 S L 1 S L S L
CHECK IF CHORAL READING
T line: Indicates activities that
involve the teacher
I line: Indicates activities
that involve the student & not the teacher
1, S, L, E: Indicate one
individual, a small, large group and entire class respectively

School and Classroom Demographic information

How do teachers perform in the classroom?

New evidence from classroom observations in over 15,000 classrooms in 7 LAC countries
País Región Año Grados Escuelas Aulas
México Distrito Federal 2011 1-9 201 2335
Honduras Nacional 2011 3,6,9 153 758
Jamaica Nacional 2011 4,5,9,10 200 1,000
Perú Nacional 2012 4 400 1195
Callao 2011 2 201 313
San Martin 2011 2 67 320
Brasil Minas Gerais 2009 5, 9,12 75 150
2011 8-9,11-12 604 3,020
Pernambuco2009 2-5,8,9 228 1100
2010 2-5,8,9 301 1,505
Rio de Janeiro
(municipalidad)2010 4-6,8,9 100 896
2011 3-9 131 665
Rio de Janeiro
(estado) Piloto 2012 9,10- 12 60 (58) 281
Colombia Nacional 2011 5,9,11 200 1091
Antioquia 2011 5,9,11 84 995
República
Dominicana Piloto0 2012 1-8 10 51
Total 3015 15675

Teachers have weak classroom management skills: one day/week is wasted
Average use of instructional time in 15,000 LAC Classrooms, 2010-2013
52%
61% 62% 64% 64% 65%
85%
39%
28% 25% 24%27% 25%
15%9% 11%
14% 12% 10% 9%
0%0%
10%
20%
30%
40%
50%
60%
70%
80%
90%
100%
México D.F. Jamaica Perú Honduras Brasil Colombia Indicadorde BuenasPrácticasStallings
Porc
enta
je d
el T
iem
po
To
tal d
e C
lase
s
Actividades académicas Administración de la clase Profesor fuera de tarea
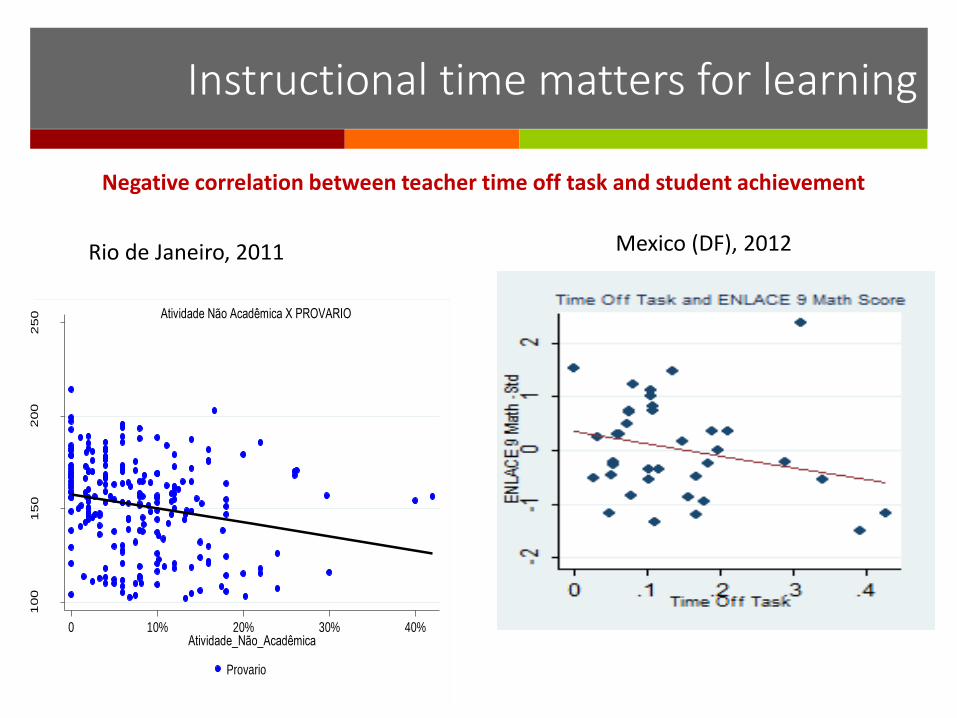
Instructional time matters for learning
Negative correlation between teacher time off task and student achievement
100
150
200
250
0 10% 20% 30% 40%Atividade_Não_Acadêmica
Provario
Atividade Não Acadêmica X PROVARIO
Rio de Janeiro, 2011 Mexico (DF), 2012

Teacher practice is very traditional
Source: Bruns and Luque, 2014
62%
48%46% 45% 45%
43%
20%
35%39%
36%39%
31%
12%
17%15% 16% 16%
24%
3%1% 1% 2%
0%2%
0%
10%
20%
30%
40%
50%
60%
70%
80%
90%
100%
Mexico Jamaica Peru Brazil Honduras Colombia
Textbook/ Notebook/ Didactic Material Blackboard Without Material ICT
Teachers spend half their time at the blackboard and use ICT less than 2% of time

Teachers’ weak skills leave students unengaged
Average share of time entire class engaged in 15,000 LAC classrooms, 2010-2013
52%
61% 62%64% 64% 65%
21% 21%25%
19%23%
19%
0%
10%
20%
30%
40%
50%
60%
70%
Mexico D.F. Jamaica Peru Honduras Brazil Colombia
Perc
ent
of
Tota
l Cla
ss T
Ime
Time on Instruction Time on Instruction with Entire Class Engaged
Source: Bruns and Luque, 2014

Débil gestao da sala no promedio, mas ha grande variacao entre escolas
01
23
4
De
nsity
0 .1 .2 .3 .4 .5 .6 .7 .8 .9 1Time on Instruction
Brazil Across School Variation
0.5
11
.52
Den
sity
0 .2 .4 .6 .8 1Time on Instruction
kernel = epanechnikov, bandwidth = 0.0503
Peru AcrossSchool Variation
01
23
4
De
nsity
0 .1 .2 .3 .4 .5 .6 .7 .8 .9 1Time on Instruction
Honduras Across School Variation
01
23
4
De
nsity
0 .1 .2 .3 .4 .5 .6 .7 .8 .9 1Time on Instruction
Mexico Across School Variation
01
23
4
De
nsity
0 .1 .2 .3 .4 .5 .6 .7 .8 .9 1Time on Instruction
Jamaica Across School Variation
01
23
4
De
nsity
0 .1 .2 .3 .4 .5 .6 .7 .8 .9 1Time on Instruction
Colombia Across School Variation
BrasilHonduras
México Jamaica Colombia
Perú
Average performance is weak, but huge variation across schools
Distribution of schools, ranked by average share of time used for instruction.

Enorme variacao na produtividade de profesores dentro de uma escola
Range in use of class time by highest and lowest teachers within a school (25th and 75th percentile schools)
Variations in teacher practice within schools are as large as across schools

Political economy of teacher evaluation(and classroom observations)

“Stopwatches can be used to evaluate the teachers”
“The World Bank and State Secretariat of Education are trying to control teacher practices inside
the classroom”
First experience – Pernambuco 2009: call for a general strike against the “STALIN” method

“With Stallings…we will treat schools like factories”
Reactions in Mexico, 2012
“…it is an ‘inquisition’ of educators”

Reactions in Rio de Janeiro, October 2012
27

Reactions of policymakers

“We know much of this intuitively, but this is the first time we have harddata we can take back to our regional offices and schools to discuss and work on.”Secretary of Education, Minas Gerais
Brasil
A unique source of quantitative, system-wide feedback for managers
“This is one of the most useful collaborations we have ever had with the World Bank.”
Permanent Secretary of Education, Jamaica
“No one is going to stop me from going into my schools to figure out how to improve their quality”
Governor Eduardo Campos, Pernambuco

A resource for teacher training
“Before the Stallings observations, I didn’t know where my best teachers were! Now we can go back to their classrooms and film their practice to use in our training courses. This will be something completely new.”
--Claudia Costin, Secretary of Education Rio Municipality
JamaicaRio Municipality

Two key implications for teacher policy
Teachers perform very differently and deserve to be treated differently
… which implies reform of the career path
Within every school there are some excellent teachers… which implies scope for raising school performance bypromoting more interaction among teachers

1. Career path reforms: emerging lessons from experience in LAC
• Comprehensive teacher performance evaluation –
• MET (Kane et al) and Chile’s experience suggest that classroom observation isthe critical component
• Use expert observers for validity and system-wide learning
• Classroom observation instrument must capture quality of teacher-studentinteraction (more sophisticated than Stallings)
• DO NOT try to include value-added learning measures
• Promotions based on evaluated performance
• Establish parallel career streams for managers, content experts and master teachers (a la Singapore)
• Offer individual coaching for teachers seeking to improve
• Credible threat of dismissal for teachers with consecutive poor evaluations
• Rewards for (school-level) learning gains with school-based bonus pay (notindividual teacher bonuses)

2. Professional learning communities: leveraging the excellent teachers in every school

Secret of high-performing systems
School-level collaboration provides teachers with informal performance feedback and spreads best practice
Japan’s Lesson study: ensures that all teachers use the most effective methods of math instruction
Singapore and Shanghai: Teachers regularly observe each other and give informal feedback
Finland: Teachers work together on lesson plans and assessing students’ progress
Ontario, Canada: Expert advisers help schools increase teacher interaction and build “professional learning communities”
Rio de Janeiro municipality: teachers spend one afternoon per week collaborating on curriculum and lesson plans
Ceara, Brasil: teachers receive coaching to improve classroom effectiveness
Teachersin Finland
Teachers in Rio de Janeiro

Ceara: SIEF-funded RCTTreatment schools receive a Bulletin with classroom observation results plus optionalcoaching to stimulate teachers to work together
Escola Saber do AmanhãEscola Saber do Amanhã
Bulletins show each school how:• their use of time, materials and student engagement compare with other schools in their district, state and the Stallings benchmarks (front
page) and• how (unamed) individual teachers compare on these dimensions (back page)

Teacher feedback and coaching program in Ceara, Brazil
01
23
4D
ensity
20% 40% 60% 100%80%
Tempo de Instrução
Ceará: distribution of schools by average time on
instruction, 2014
Escola com
menor tempo -
35%
Escola com
maior tempo -
95%
Pa
tam
ar O
CD
E (
85
%)
Randomized evaluation with 150 treatmentand 150 comparison schools will show:
• Does receiving school-level feedback onStallings results stimulate teachers to interact more, observe each other, and share classroom practice?*
• Does greater interaction among teachersreduce large within-school variation in teacher practice and improve averagepractice?**
• Does improved classroom practicecorrelate with improvements in studentlearning (value-added learning gains)?***
*Measured through activity log maintained by school directors/pedagogical coordinators** Measured as difference between baseline classroom observations in treatment and comparison schools (Nov. 2014) and endline classroom observations (Nov. 2015)***Measured as value added learning gains on state achievement tests between Nov. 2014 and Nov. 2105
