measuring skills in developing countries - public...
TRANSCRIPT

1
Measuring Skills in Developing Countries
Rachid Laajaj* and Karen Macours**
January 2017
ABSTRACT
Measures of cognitive, noncognitive and technical skills are increasingly used in development economics to analyze determinants of skills formation, the role of skills in economic decisions or simply because they are potential confounders. Yet in most cases, these measures have only been validated in developed countries. This paper tests the reliability and validity of some of the most commonly used skills measures in a rural developing context. We administrated a survey with a series of skills measurement to more than 900 farmers in western Kenya, and asked the same questions again after three weeks to test the reliability of the measures. To test predictive power, we also collected information on agricultural practices and production during four following seasons. The results show the cognitive skills measures are reliable and internally consistent, while technical skills are difficult to capture and very noisy. The evidence further suggests that measurement error in noncognitive skills is non-classical, as correlation between questions are driven in part by answering patterns of respondents and the phrasing of the questions. Addressing both random and systematic measurement error using common psychometric practices and repeated measures leads to improvements and clearer predictions, but does not address all concerns. The paper provides a cautionary tale for naïve interpretations of skill measures. It also points to the importance of addressing measurement challenges to establish the relationship of different skills with economic outcomes. Based on these findings, we derive guidelines for skill measurement and interpretation in similar contexts.
* Universidad de Los Andes
**Paris School of Economics and INRA1
1 Jack Pfeiffer provided invaluable research assistance and programming skills, field support, tenacity and ideas throughout the project and we gratefully acknowledge all his contributions to this project. Mattea Stein and Irene Clavijo, Juan Diego Luksic, and Freddy Felipe Parra Escobar provided excellent research assistance. Data collection was organized through IPA Kenya. We are indebted the excellent field team for key contributions during piloting and translation and for all efforts during the main baseline collection. We are indebted to Chris Soto for many suggestions and insights from the psychometric literature. We are grateful for inputs received from colleagues at PSE and seminar participants at EUDN, IFPRI, Navarra, Nova, Oxford, Trinity College Dublin, World Bank, the ISI World Statistics Congress, to Gero Carletto and Renos Vakis for continuous encouragements and support, to the World Bank’s Living Standards Measurement Study (LSMS) team for funding of the survey experiment through a grant from DFID, and to the FAO and DFID-ESRC for funding of the follow-up data collection rounds. All errors are our own. Contacts: [email protected]; [email protected]

2
1. INTRODUCTION
Cognitive and noncognitive skills are often considered key to understand economic decision-
making. Empirical work with data from the US and Europe has made important advances in
understanding both the causes and the consequences of skill formation (Heckman, 2007).
Increasingly, cognitive, noncognitive and technical skills have also become the focus of analysis in
development economics, with recent work on the determinants of skill formation (Attanasio et al,
2015), and the importance of skills for later life outcomes (Gertler et al., 2014). Development
economists have also long worried about the role of many hard-to-observe skills as potential
confounders in empirical analyses.
The low level of skills among farmers in developing countries is thought to be one of the main
drivers of productivity differences between the agricultural and other sectors in the economy
(Lagakos and Waugh, 2013). Young (2013) argues that sorting on skills explains the urban-rural
productivity gaps observed in most developing countries and Gollin et al. (2014) show that
productivity differences become smaller when accounting for observed human capital differences.
Understanding such potential selection at the micro-level arguably requires measures that go
beyond years of schooling attained or literacy and more complex measures of skills or abilities are
sometimes included in household surveys in developing countries. Yet the measurement of skills
in developing country field conditions poses substantial challenges, and the related measurement
error and its potential implications for empirical work have received little attention.
This paper contributes with the results of a skill measurement experiment among farmers in rural
Kenya, to document the measurement challenges and discuss potential solutions and implications.
We designed and implemented a relatively large survey focused on measuring different types of
skills, and use the data from this survey experiment to shed light on the reliability and validity of a
wide set of commonly used skill measures and on the predictive power of the measured skills. We
refer to cognitive skills as those that capture hard skills such as abstract reasoning power, language
and math skills; noncognitive skills capture soft or socio-emotional skills, including a wide set of
personality traits, such as self-esteem, tenacity, conscientiousness, locus-of-control, and attitudes-
to-change. Our measure of technical skills focus on agricultural knowledge and know-how, given
that our data comes from poor rural individuals whose main occupation is in agriculture.2
2 Hence we broadly follow the distinction of Heckman and Kautz (2012) who distinguish between cognitive abilities,
personality traits, and other acquired skills.

3
There is a wide variety of existing questions, tests or modules to measure such skills. Many
instruments have been designed to assess skills in lab conditions, and some standardized
instruments have been developed for inclusion in surveys in developed country settings.
Increasingly, economists are also trying to include various measures of abilities and personality
traits in household surveys conducted in developing countries. But little validation of such
instruments has occurred for such contexts.3 Many questions can be raised about the applicability
of some of the existing scales for poor rural populations, given the high level of abstraction of many
questions, low levels of education in the respondent population, difficulties of standardization for
enumerator-administered tests conducted in the field, and translation challenges.4
This study aims to test the reliability and validity of several commonly used scales and tests, and
highlights both random and systematic measurement error that needs to be accounted for when
measuring skills in developing-country field conditions. We do so by analyzing the test-retest
reliability and the Cronbach’s alpha to estimate internal consistency of various existing scales. We
subsequently use exploratory factor analysis, correction for acquiescence bias, and item response
theory (IRT) to reduce some of the observed measurement error, and analyze validity and reliability
of the improved constructs.5 We then study the predictive validity of both the original scales and
the improved constructs and analyze the extent to which the skills measured predict agricultural
productivity and economic decisions related to the adoption of advanced agricultural practices.6
This tests the potential role played by these skills in agricultural production, and shows that they
might be important omitted variables when not included in the analysis of agricultural decision-
making. More generally, understanding the role of skills in agricultural decision can be key to
inform policy interventions that directly aim to improve skills, or the success of which could be
conditional on the skills of the target population.
Almund et al. (2011) suggests that different skills and personality traits might help predict different
outcomes, with cognitive ability being more important for complex tasks, while personality is
3 Measures of risk aversion and time preferences, which have a longer history of use in developing country surveys, have
received more scrutiny.
4 While there is a literature in psychology regarding the validity of scales across cultures (Benet-Martinez and John,
1998; John, Naumann, and Soto, 2008), these studies typically focus on highly-educated populations in different
countries, and often are limited to high or middle income settings.
5 While explanatory factor analysis is used elsewhere in the economics literature on skills (Cunha and Heckman, 2010;
Heckman, Stixrud and Urzua, 2006), we also build on insights from the psychometrics literature, such as for the
corrections for acquiescence bias.
6 Following McKenzie (2012), in order to reduce the noise in the outcome variables, the measures of yield and practices
are obtained from the average over the four seasons that followed the collection of skills data.
4
shown to be more important for job performance. In this study, we focus on a specific population -
rural farmers in Western Kenya - and consider outcomes that are specific for their main occupation,
farming. Beyond the advantage of focusing on decision making in a specific domain, understanding
the importance of skills for agricultural decisions and productivity is important in its own right,
given that the majority of the world’s poor continue to live in rural areas, where agriculture remains
the most important source of employment (World Bank, 2008). Differences in the willingness to
exert effort are often considered key to understand heterogeneity in agricultural outcomes (de
Janvry, Sadoulet, and Suri, 2016). More generally, farmers face many different tasks and decision,
some of which may depend more on knowledge, others on problem solving ability, and yet others
on effort. In the predictive regressions, we consider a variety of outcomes to capture those potential
differences, and analyze to what extent different skills explain a meaningful part of the variation in
those outcomes.
Our first set of results show that cognitive skills, using both standardized scales and tests developed
for the specific context can be measured with high levels of reliability and validity, similar indeed
to those found in developed country settings. Cognitive skills also show good predictive validity,
even after controlling for educational levels. On the other hand, we find that standard application
of commonly used scales of noncognitive and technical skills suffer from large measurement error,
resulting in low reliability and validity. For technical skills, factor analysis and item response theory
results in a construct with higher predictive validity, even if large measurement error remains.
Repeated measurement further helps to improve predictive power, and overall most of the
measurement error in technical skills appears to be random measurement error. For noncognitive
skills, we find evidence of systematic measurement error related to acquiescence bias and show
that combining questions according to pre-existing scales leads to low internal consistency.
Related, the latent noncognitive construct resulting from the factor analysis does not map in the
personality domains typically found in developed countries. While the corrected noncognitive
constructs are predictive of agricultural productivity, the estimates do not allow drawing clear
conclusions about the relevance of specific noncognitive skills. Overall, the best predictions
obtained after corrections of different sources of measurement error show that the three types of
skills together explain up to 17 % of the variation in yield, with all three skill constructs being
significant and with similar point estimates. Technical and noncognitive skills also help predict
agricultural practices, though with varying degrees.
In the last part of the paper, we further analyze the different challenges related to measuring skills
in household surveys in developing countries, and discuss guidelines on how to address them. The
5
main challenges that we identify include the interaction with enumerators, the respondent’s ability
to understand the questions, effects related to the order of sections, response biases, anchoring,
different factor structures, and specific challenges related to the potential idiosyncrasy of
agricultural knowledge.7 We use this discussion to derive guidelines and also indicate areas for
future research.
The large amount of measurement error this study documents provides an important warning sign
for studies trying to use similar measures in poor rural settings. At the very least, the measurement
error, when it is classical, could lead to important attenuation bias and lack of statistical power.
This might well lead to an underestimation of the importance of skills for decision-making, or of
the impact of external interventions on cognitive, noncognitive or technical skill formation. If
anything this can have important implications for sample size calculations and might point to
usefulness of measuring individuals’ skills at several points in time to reduce such error. 8 Yet, the
evidence also suggests the measurement error in skills might well be non-classical, and could hence
more broadly lead to erroneous conclusions. Our results show that it may be particularly hard to
distinguish different aspects of noncognitive skills, suggesting that studies that only attempt to
measure a subset of noncognitive skills need to be careful regarding the interpretation of which
latent factor is being measured.
This paper relates to a relatively large literature on the importance of cognitive and noncognitive
functioning in household economic decision-making. Cognitive ability has been shown to be an
important predictor of socioeconomic success (Heckman, 1995, and Murnane, Willett, and Levy,
1995). Heckman, Stixrud and Urzua (2006) and Heckman and Kautz (2012) argue that
noncognitive abilities matter at least as much, despite the historically strong focus on cognitive
ability. In developed countries, noncognitive abilities and personality traits have been shown to be
directly related to a large set of socio-economic outcomes such as wages, schooling, crime, and
performance on achievement tests (Bowles, Gintis, and Osborne, 2001; Heckman, Stixrud, and
Urzua, 2006; Cunha and Heckman, 2010; Almund et al. 2011). In the psychology literature, there
is also substantial evidence on the predictive power of personality traits for socio-economic
outcomes. Development economists have recently taken these lessons to heart, and are including
7 Some of these concerns are similar to concerns raised about attitudinal, expectations or aspirations questions, as
analyzed by Bertrand and Mullainathan (2001), Krueger and Schkade (2009), Manski (2004), Delavalande, Gine and
McKenzie (2011), and Bernard and Taffese (2014).
8 The observation that measurement error might be substantially higher for noncognitive skills than for cognitive skills,
and the limitations of the use of Big Five personality questionnaires in large-scale data collection have also been pointed
to by Borghans et al, (2008) as potential reasons for underestimating the importance of noncognitive skills in developed
country settings.

6
measurements and analysis of personality traits in empirical studies (Dal Bo, Finan, and Rossi,
2013; Callen et al., 2015).
The insights from this paper are also relevant for various strands of the wider literature. In light of
the large debate about whether the worldwide increase in schooling is leading to measurable and
sustained gains in learning (Pritchett and Beatty, 2015), having widely comparable measures of
cognitive abilities, that can be measured for adults, outside of the classroom, and in a variety of
settings, is arguably key. Certain large data collection efforts covering wide and heterogeneous
populations, such as the Young Lives Surveys or the World Bank STEPS surveys (Pierre et al.,
2014), are now including measures for noncognitive abilities and personality traits. Increasingly
such measures are also included in targeted surveys for impact evaluation purposes, most directly
when interventions aim to change noncognitive traits (Bernard et al., 2014; Groh, McKenzie and
Vishwanath, 2015; Blattman, Jamison and Sheridan, 2016; Ghosal et al., 2016; Adhvaryu, Kala,
and Nyshadnam, 2016) but also when changes in noncognitive abilities are seen as potential
mechanisms to explain changes in final outcomes (Blattman and Dercon, 2016). Other recent work
focuses on the long-term impact of external factors during childhood on noncognitive outcomes of
adults (Leigh, Glewwe and Park, 2015; Krutikova and Lilleor, 2015). Finally, there is a renewed
interest and widening literature on learning, technology adoption and agricultural productivity in
developing countries (Jack, 2011; de Janvry, Sadoulet and Suri, 2016), for which having reliable
measures of agricultural knowledge and learning is key.
The paper is organized as follows: the next section provides more information about the context,
the instrument and the implementation of the survey experiment. Section 3 provides the description
of, and rational for, the calculation of the improved constructs, and discusses reliability and internal
consistency. It also shows predictive validity results, using agricultural yield and practices as
outcome variables, and comparing results with the naïve and the improved constructs. Section 4
presents additional analysis related to measurement error and derives lessons and practical
recommendations for skills measurement. Section 5 concludes and the appendix provides more
details on methodologies and data, as well as additional empirical results.
2. THE SETTING, THE SAMPLE, AND THE QUESTIONNAIRE DESIGN
2.1. Setting
The survey experiment was conducted in Siaya province in Western Kenya targeting 960 farmers,
spread across 96 villages and 16 sub-locations, of whom 937 were reached for the first

7
measurement, and 918 for the second measurement. Among the farmers in the sample, 50% were
selected from a random draw of households in the village, and another 50% were farmers nominated
in village meetings for participating in agricultural research trials. The village household list was
either pre-existing or drawn up by the village health worker. Given the individual nature of skills,
the sample is a sample of individuals who were identified as being the main farmer in the selected
households. Each farmer was surveyed twice (test and retest) with an interval of about three weeks
between the test and retest.
Among surveyed farmers, maize is the main staple crop, and is often intercropped or rotated with
beans. Many farmers also have root crops and bananas. Respondents have on average 6 years of
education (substantially below they Kenyan average), a bit more than half of the respondents are
female, 62% are head of household, and are on average 46 years old. Farms contain on average
about 3 plots, and 65% of households own at least some cattle.
2.2. Questionnaire design
The main instrument consists of 3 main sections (cognitive skills, noncognitive skills and technical
agronomical skills) that were asked in random order. This section summarizes the content of each
module and provides more information on the considerations taken into account in the choice of
questions and tests in the appendix. Appendix 1 provides a more comprehensive description of the
questionnaire.
Many instruments have been designed to assess cognitive and non-cognitive skills in lab conditions,
or among highly educated respondents in high-income settings. They have subsequently been
integrated in survey instruments that are applied in field conditions, often without prior testing of
their suitability. We therefore aim to test the validity of existing cognitive and non-cognitive scales
administered in rural field conditions. An extensive desk review of papers allowed making an initial
selection of questionnaire modules and questions that are similar to approaches used elsewhere in
the literature. For technical skills, rather than starting from specific questions, we focus on different
types of questions found in the literature.
Cognitive skills
With the objective of measuring different aspects of adult farmers’ cognitive ability, we selected
five different cognitive tests: i) The Raven Colored Progressive matrices, measuring visual
processing and analytical reasoning; ii) The digit span forwards and backwards, measuring short-

8
term memory and executive functioning; iii) A written and timed test of basic math skills; iv) An
oral 9-item test containing short math puzzles relevant for agriculture and increasing in level of
difficulty; and v) A reading comprehension test. Table A1.A provides a detailed description of each
of these tests.
Noncognitive skills
The noncognitive part focuses on testing instruments derived from commonly used scales in
noncognitive domains that the literature has emphasized as potentially predictive of success in life
and that are potentially relevant for smallholder farmers. We use a subset of items from the 44-item
BFI, a commonly used instrument for the Big Five personality traits. We also test commonly used
instruments for lower-order constructs such as scales for locus of control, self-esteem, perceptions
about the causes of poverty, attitudes towards change, organization, tenacity, meta-cognitive
ability, optimism, learning orientation, and self-control. The majority of these subscales are derived
from a set of questions asking the respondent the level at which he agrees or disagrees with general
statements about himself, with answers on a Likert scale from 1 to 5.9
In addition, we asked a set of locus-of control questions with visual aids in which people are asked
to attribute success to effort & good decisions, luck or endowments. We also included the CESD,
a commonly used depression scale, that has been used and validated in many developing countries,
and which relates to some of the noncognitive domains also captured in other scales (such as
neuroticism and optimism). A standard risk aversion game and time preference questions were also
added, mostly for comparison and completeness.
Table A1.B in the appendix presents all items, and the first column indicates the sub-scale each of
the items belongs to. As is the case in the original scales, some of these questions are positively-
coded, indicating that a higher likelihood to agree with the statement indicates a higher score on
the noncognitive trait of interest, while others are reverse-coded. The last column in Table A1.B
indicates which questions are reversed.10 While the pilot revealed that reverse-coded questions
were sometimes harder to understand (often because of negative phrasing), care was given to keep
approximately equal number of positively and reverse-coded items in the final instrument, as they
9 The causes-of-poverty subscale does not ask directly about the respondents themselves but uses a Likert scale to ask
about reasons for why poor people are poor.
10 For neuroticism and CESD, we use reverse coding to refer to higher levels of neuroticism and stress, as lower
neuroticism and stress should imply a higher noncognitive score.

9
are key to detect acquiescence bias. A few questions were formulated as a binary choice instead of
using a Likert scale.
Technical skills
There are no standardized scales that measure technical skills, reflecting the fact that agricultural
knowledge can be very specific to a geographical area, crop and type of inputs or practices. That
said, different types of questions can be found in the literature, reflecting different underlying ideas
about which knowledge could be the most relevant ones: probing for instance about theoretical
knowledge, versus knowing how or when to apply certain inputs, etc. Based on this categorization,
we then worked with local agronomists to develop a specific set of questions on agricultural
knowledge relevant for farmers in the survey population. Specifically, we designed a module that
covers the production of the main crops and the use of the most common practices and inputs in
Western Kenya, including question on the timing at which inputs should be used, how to apply the
inputs (quantity, location, etc.), knowledge of both basic and more complex practices (spacing,
rotation, composting, conservation…), and general knowledge (the active ingredients in certain
fertilizers). We use a mix of open questions and multiple-choice questions, some questions allow
multiple answers, and a subset of questions had visual aids (e.g. pictures of inputs). The set of
questions covered a relatively broad spectrum of practices, including a set of questions on maize,
banana, soya, soil fertility practices, composting and mineral fertilizer. Table A1.C in the appendix
presents all questions, and the first column indicates the sub-scale each of the questions was
grouped under.
Piloting and questionnaire preparation
We conducted extensive piloting of these modules and questions in the local context. Qualitative
piloting allowed testing the face validity of the questions, by asking qualitative follow-up questions
regarding the understanding of the questions and meaning/reasoning of the answers. After
qualitative piloting, an extended version of the skill questionnaire was piloted in November 2013
on 120 farmers from an area in Siaya, close to the study area, and on farmers that had been selected
in a similar way as those of the actual study population. A small subset of these farmers was also
retested in December 2013 with the same survey instrument, in order to obtain retest statistics of

10
the pilot. Based on this quantitative pilot, we eliminated questions with little variation. 11 We also
removed questions that showed negative correlations with other variables meant to capture the same
latent trait, and fine-tuned phrasing and translation of questions.12 The final survey instrument took
about 2.5 hours to complete.
The vast majority of farmers in the sample (97%) were native Luo speakers (the local language) –
the others were more comfortable in Swahili or English (Kenya’s two official languages). The
English-language survey therefore was translated in both Luo and Swahili. All versions were
homogenized after independent back translation.13
2.3. Alternative measures of skills
Prior to the set of questions in the three main modules described above, respondents were asked
their self-assessment for the same set of skills using a set of 14 questions, formulated to proxy the
different subdomains captured by the questions in the main modules. And after answering all
questions from the three main sections, each farmer was asked to assess the skill level of one of the
other farmers of his village in the sample using similar proxy questions. This provides an
independent (though clearly subjective and possibly mis-measured) assessment. A second proxy
measure comes from asking the same questions to another household member (typically the spouse)
also involved in farming. And a third independent measure was obtained prior to the survey from
the village health worker, who was asked to classify each farmer according to his cognitive,
noncognitive, and technical abilities, using a broad categorization (high, medium, low). The
predictive power of these three proxy measures can be compared with the predictive power of the
detailed skills measures, an issue we turn to in section 6.
11 For instance, experience with pesticides or irrigation is extremely limited in the population of study, so that any related
questions did not provide variation.
12 For the noncognitive module, a relatively large set of questions was identified with either very little variation (because
everybody agreed with a certain positive statement), or a bi-modal distribution, typically in the case of reverse-coded
questions. In extreme cases this led to negative correlations between variables that should capture the same latent trait.
13 Back-translation initially revealed a substantial number of questions with translation problems, in particular in the
noncognitive part. As questions in this section are more abstract and referring often to concepts that are not part of daily
vocabulary, finding the appropriate translation was often a challenge. For all sections, translations and back-translations
were compared, and we worked together with native Luo and Swahili speakers to finalize translations, to assure that the
original meanings of the questions was maintained (and hence to know which questions we are in fact testing). We suspect
that similar translation issues affect other surveys trying to obtain answers related to more abstract concepts, including
some of the questions that are commonly used in the literature, which would need to be taken into account for the use of
such measures.

11
2.4 Randomization of survey instrument and fieldwork
To understand the drivers of measurement error, an important focus of the study was the extent to
which the order of answers, of questions, and of modules, or any unobserved enumerator effects
might affect answers in an important way. The data collection was done using mini laptops, and a
program specifically designed to randomize the different components of the questionnaire. The
order of the three main sections (cognitive, noncognitive and technical) was randomized, which
allows to control and test for a potential survey fatigue and to assess whether some tests tend to
modify the responses of the following questions. The order of the questions within a section was
randomized to control for a potential learning caused by the preceding questions. And in all
multiple-choice questions, the order of the answers was also randomized. In order to test for
enumerator effects, we also randomly assigned respondents to enumerators. For the re-test 40% of
households was assigned to the same enumerator while the rest varied. Survey teams were allowed
to deviate from the random assignment for logistical reasons. Overall compliance with the
enumerator assignment was about 75%. Finally, we randomized the order in which the villages
were surveyed to evaluate effects related to enumerators learning or changing how they
administrate survey across time.
2.5. Training and data collection
Prior to survey implementation, all enumerators and field personnel participated in an intensive
two-week training, with both classroom and field training and extensive practice to guarantee fluent
and correct implementation of the different skill measurements. The first round of the survey started
January 20th 2014– and took approximately 3 weeks. The retest survey was conducted in the
following 3 weeks. A small household and farm survey was implemented in parallel and provides
the agricultural outcome variables. All survey activities, including tracking of harder to reach
respondents were finished by end of March. Almost all surveys were conducted before the start of
the main agricultural season. Additional surveys were implemented at the end of the following four
agricultural seasons with information on production outcomes and practices, and are used to
investigate which skills best predict these economic outcomes.
3. RELIABILITY AND VALIDITY OF DIFFERENT SKILL CONSTRUCTS
We aim to test the reliability and validity of the different skill measures. Reliability indicates the
share of informational content (rather than noise) of a measure of a given skill and validity indicates
12
whether it actually measures what it intends to measure. To do so we calculate for each measure
the test-retest correlation, a pure reliability measure, and Cronbach’s alpha, which is affected both
by the noise and the extent to which items are measuring the same underlying construct (construct
validity). We also test the predictive validity, by analyzing whether the skill measures predict
different agricultural outcomes that they are theoretically expected to be correlated to. The
appendix provides a detailed methodological explanation of these different tests.
For each domain (cognitive, noncognitive and technical skills), we construct different measures of
which we test the reliability and validity. A “naïve” score aggregates the different questions using
the existing sub-scales meant to measure certain abilities as they were included in the survey
instrument. We also construct alternative aggregate measures, using exploratory factor analysis,
item response theory, and corrections of response biases recommended in the psychometric
literature. By comparing the reliability and validity of the different constructs, we demonstrate the
importance of accounting for response patterns and latent factor structure.
3.1. Construction of the Indexes
The “naïve score” is calculated as the simple average of items (questions) that belong to pre-
determined sub-domains. This has the advantage of simplicity and transparency, and mimics what
is often done in practice. For the “improved” construct we apply different corrections to extract the
most relevant information from the available items: we use exploratory factor analysis to determine
the number of factors in each construct, item response theory to further improve the cognitive and
technical constructs, and correct for acquiescence bias in the noncognitive construct. This
subsection describes the methods and the insights gained from the different steps. The following
subsections compare results when using the different indexes.
Correcting noncognitive items for Acquiescence Bias
Acquiescence bias (also called “ya-saying”) refers to the respondent’s tendency to agree (more than
disagreeing), even when statements are contradictory. We correct for Acquiescence Bias in all
noncognitive questions answered on a Likert scale, following common practice in psychometrics
literature (Soto et al. 2008; Rammstedt, Kemper, and Borg, 2013; and references therein). To do so
we calculate the acquiescence score of each individual, averaging between the mean of the
positively-coded items and the mean of reverse-coded items (before reversing these items). For
each question, we then subtract this acquiescence score from the Likert score, hence correcting for

13
average acquiescence bias.14
Exploratory factor analysis to determine the number of factors in each construct
We conduct exploratory factor analysis (EFA) separately for cognitive, noncognitive and the
technical skills, and determine the number of factors that should be extracted from the data. To do
so, we pool all data for each domain (hence pooling for instance all noncognitive questions
together), instead of relying on pre-determined scales. Hence, we let the data indicate the potential
factor structure and related latent traits, following an approach also used by Ledesma and Valero-
Mora (2007), Cunha, Heckman and Schennach (2010), and Attanasio et al (2015).
For the cognitive skills, we use the score for each of the 5 tests as inputs in the EFA. For the
noncognitive and technical skills, we use each of the questions separately. We determine the
number of latent factors that can be extracted from all the measures, using four different criteria
commonly used in the psychometric literature (see appendix for details). The results of the
exploratory analysis indicates that the cognitive and technical skills can best be measured by one
factor each, while the underling latent factors for noncognitive skills corrected for Acquiescence
Bias are best captured by 6 factors (appendix Table A2).
More details on the factorial analysis of the noncognitive skills
The factorial analysis explicitly accounts for the fact that answers to items are imperfect proxies of
the true underlying latent traits. Latent factor models estimate the joint distribution of the latent
factors and help remove some of this measurement error. We estimate factor loadings, then rotate
the factor loadings using quartimin rotation to predict the resulting factors. 15 Table 1 presents the
resulting factor loads of the acquiescence bias corrected items, sorted by dominant factor.
Strikingly, with the exception of the first factor, most factors seem to have a mix of items from
14 Some studies use instead a joint correction for acquiescence bias and extreme response bias (adjusting for individual
variance in responses), referred to as ipsatizing. The value of correcting for extreme response patterns is debated in the
psychology literature (Hicks, 1970; Fischer and Milfont, 2010). Implementing this alternative correction in our data
significantly worsened the reliability and validity of the construct, and we therefore do not consider it further.
15 The aim of the quartimin rotation is to re-weight the factor loadings obtained from the EFA so that each variable mostly
loads on one factor. That said, some variables still load on multiple factors after rotation, and we do not impose further
restrictions.
14
different sub-constructs (in theory meant to be measuring different latent skills).16 CESD items are
a clear exception. They uniquely load on two factors, which do not include other items, and separate
negative from positive attitudes.17 On the other hand the Big Five personality trait division typically
found in the psychometrics literature is not confirmed by the factor structure, with the exception of
conscientiousness related items, which mostly load on the second factor.18 The fourth factor further
raises some doubts as it is uniquely composed of the reverse questions from the “causes of poverty”
sub-construct, while the positive ones load on other factors. This raises the concern that it is at least
partially driven by a response pattern rather than the actual belief about the causes of poverty that
the scale aims to capture. Overall these results raise concerns about whether the scales actually
measure what they intend to. Despite the mixing of items, it is possible to discern a dominant
interpretation for each factor, which we include in the last column of Table 1.
We use the factor loadings to aggregate the different noncognitive skills. To obtain the predicted
factors, and following Attanasio et al (2015), items are assigned to the factor for which they have
the highest factor loadings, with factor loads of other items set to 0. To analyze the test-retest, and
to guarantee we are comparing similar constructs, we apply the factor loading obtained from the
first survey round (the test) also to the variable values of the second survey round (the retest). When
redoing the exploratory factor analysis on the retest data, the factor structure is broadly similar,
justifying the use of the same factor loads for both test and retest data.
The use of Item Response Theory for Cognitive and Technical skills
Item Response Theory imposes further structure on a set of items to measure an underlying latent
ability or trait. It assumes that the probability of getting the correct answer to a question (or a higher
score on a given item) depends on the unobserved ability of the respondent and some parameters
of the question, all estimated simultaneously. The question’s parameter can include its difficulty,
its discriminant (how much the probability depends on the latent factor) and the possibility of
pseudo-guessing. IRT has become the standard tool for high stakes tests such as GRE or GMAT
and is believed to provide greater precision than classical test theory. We apply it to cognitive skills
16 This means for example that a question that is expected to measure agreeableness and a locus of control question can
better correlate together (and thus be assigned to the same underlying factor) than two locus of control questions.
17 The original scale development paper for the CESD (Radloff, 1977) similarly identifies a positive subscale/factor.
18 A similar result is found when restricting the EFA to items of the Big Five only. The items meant to measure separate
personality traits are mixed into various factors (Appendix Table A3). We return to this lack of congruence with findings
from other contexts in section 4.
15
and to technical skills to obtain the two “improved” constructs, in each case assuming uni-
dimensionality given the result of the EFA.19
For the Technical skills, we used IRT pooling all items together. Only 3 items were removed
because they had a discriminant opposed to the expected one (meaning that respondents were more
likely to have a correct answer if they had a lower predicted latent skill). Of the remaining 32 items,
28 had a significant discriminant parameter at the 5% level (and 24 items at the 1% level), indicating
that most items contributed to the assessment of the latent trait.
In the case of the cognitive skills, we applied a mixed method, given the format of the questions
and the requirements of the IRT. In particular, we use IRT to calculate the subconstruct of the
numeracy questions, the raven test and reading test. 20 We then used factorial analysis using these
three indexes and the scores of the digit span, the reverse digit span, and the timed math test to
obtain one latent factor.
3.2. Reliability and construct validity
Test-retest correlation
To test reliability we calculate the correlation between the same construct measured twice over a
period of three weeks, a time short enough that the underlying construct is not expected to change.
The test-retest correlation provides an estimate of the share of a measures’ variance that is driven
by the variance of the true ability it is intended to measure. This is equivalent to 1 minus the share
of variance explained by pure measurement error.21 Intuitively high measurement error means that
the true score is an imprecise measure and leads to a low test-retest correlation, hence a low
reliability. A threshold of minimum .7 test-retest correlation is often applied to define reliability.
All estimates are done using z-scores of the relevant constructs and subconstructs (i.e. after
subtracting the mean and dividing by the standardized deviation).
The first column of Table 2A provides the test-retest correlations of the “naïve” aggregate and of
19 We do not use IRT for the noncognitive skills, both because the “difficulty” of each question is less applicable to the
noncognitive questions, and because IRT can only be used on discrete measures, which the noncognitive scores, after
subtracting the acquiescence score, are not.
20 IRT cannot be used on digit span, reverse digit span, and the timed math test given that its subcomponents are not
independent from each other.
21 If measurement error is classical, the test-retest correlation gives a good indication of the signal to total variance ratio.
On the other hand, the test-retest correlation can under- or over-state the signal to total variance ratio in case of non-
classical measurement error. If the errors in measurement are positively correlated over time, for instance because both
measures suffer from persistent acquiescence bias, the test-retest correlation will overstate the reliability of the data.
16
the sub-constructs by predefined subdomains. The results vary widely. The cognitive naïve
construct reaches a test-retest correlation of 0.84 (with sub-constructs correlations between .52 and
.82) indicating a high degree of reliability, comparable to what is often obtained in lab or class-
room conditions. By contrast, the noncognitive and technical test-retest correlations are .53 and .30
respectively, which is strikingly low given the large set of items used to compute them. This
probably points to a large role for guessing and possibly general uncertainty about the answers.
Unsurprisingly given that the number of items reduces the noise, sub-constructs perform worse
than the aggregate constructs. Among the noncognitive ones, test-retest statistics are slightly higher
for locus of control, CESD and causes of poverty than for other sub constructs.22
The first column of Table 2B provides the test-retest correlations of the “improved” constructs and
sub-constructs, calculated as described in section 3.1. Compared to the naïve constructs, the test-
retest statistics are marginally higher for the cognitive skills, and substantially higher for the
noncognitive construct (increasing it from .53 to .70) and the technical construct (from .30 to .41).
Hence the use of IRT, factor analysis and correction for acquiescence bias substantially improves
the reliability of the constructs. That said test-retest statistics remain below standard thresholds for
the noncognitive sub-constructs and the noise in the data remains particularly high for the technical
skill construct.23
Cronbach’s Alpha
The Cronbach’s alpha is one of the most widely used measures of internal consistency of a test. For
a given number of items, it increases when the correlation between items increases. Hence it is
higher when the noise of each item is low (high reliability) and when they actually measure the
22 Note that for CESD, it is a priori not clear that answers should be stable over 3 weeks, as the reference period of the
questions is the last week, and as mental health presumably might be malleable on the short run. But in related work,
Krueger and Schkade (2009) find that the test-retest reliability of a general life satisfaction question was no better than
questions asking about affective experience on specific days, and attributed this to transient influences influencing the
former more.
23 It is important to consider that the fact of being surveyed during the test may affect the answers in the retest, and hence
potentially the test-retest statistic. Table A4 in the appendix shows that indeed scores are slightly higher in the retest for
all 3 skill constructs. To the extent that scores increase for all respondents this does not affect the test-retest statistics, as
scores are standardized within survey round. Moreover, the standard deviations in the test and the retest for cognitive and
noncognitive scores are very similar. They are however slightly lower for the technical scores in the retest than in the
test, potentially indicating a learning effect by either the respondents, the enumerators, or both. Results in section 4 further
suggest that at least part of this learning is enumerator related. Given the overall modest increase in the scores, learning
cannot explain the low test-retest statistics.

17
same underlying factor (indicator of high validity). For the purpose of statistical analysis, a
minimum threshold of .7 is often applied.
The second and third columns of Table 2A show the Cronbach’s alpha of the naïve constructs of
the test and retest, while Table 2B provides similar statistics for the improved constructs. The
conclusions for the aggregate constructs are similar to those obtained from the test-retest
correlations. The Cronbach’s alpha is above the bar for the cognitive skill construct, barely
acceptable in the case of the noncognitive, and substantially below the acceptable threshold in the
case of the technical skills.24 They do not differ much between the test and retest, which confirms
that the retest is broadly comparable to the test. Cognitive sub-constructs with large number of
items reach very high Cronbach’s alpha, as does the CESD. The alpha for the naïve causes of
poverty noncognitive sub-construct is also high, although the factorial analysis suggests this
correlation may be driven by common response patterns rather than common meaning.
The Cronbach’s alphas of the improved aggregate constructs are not higher than the ones of the
naïve constructs, but the ones of the 6 noncognitive factors generally show large improvements
compared to the naïve sub-constructs. These two observations are partly mechanical given that the
factorial analysis pools together items with higher correlations in the subconstructs, and the
correlation between factors is minimized through the quartimin rotation.25 The technical skills
construct reaches a Cronbach’s alpha of .54, which remains quite low given that it includes 32
items. This suggests that farmers’ knowledge might be idiosyncratic (with different farmers having
different pieces of knowledge), and therefore hard to aggregate in a knowledge score.
3.3. Predictive validity
To further investigate validity, we test to what extent the skills constructs predict real life outcomes.
In particular we analyze whether skills correlate with agricultural productivity and practices, and
how much predictive power the measurements have for such outcomes.
The estimates capture conditional correlations and clearly are not meant to reflect particular causal
relationships. Observed correlations may be driven by the fact that 1) the skills affect agricultural
24 The high Cronbach’s alpha of the cognitive is consistent with Table 3 showing that scores of the 5 sub-components are
highly correlated with each other. The correlations are highest among skills most clearly acquired in school (reading and
the two math tests) and a bit lower with the more general cognitive tests (Raven and digit span). Correlations are also
high with grades of education attained and self-assessed literacy.
25 When we don’t apply the new factors weights, but only correct scores for the acquiescence bias, neither the alpha’s
nor the test-retest systematically improve (Appendix Table A5).
18
decision and outcomes; 2) the agricultural outcomes are determinants of skills formation; or 3)
some other variables are correlated with both skills and agricultural outcomes, making skills a
potential confounder if not observed. Nonetheless, independent of which one of these factors drives
the correlation, a high predictive power indicates that improving skills measures can contribute to
a better understanding of agricultural productivity. It further helps shed light on the consequences
of omitting skills when analyzing questions regarding agricultural productivity and practices.
Correlations with other variables
Before turning to the regressions, Figure 1 shows unconditional correlations of the skill constructs
with commonly observed variables as a first form of validation. Figure 1 and Table 3 show a strong
relationship between measures of cognitive skills and grades of education attained or self-assessed
literacy. 26 Cognitive skills slightly increase with age until about 34 year old, and decline for older
ages (possibly capturing age or cohort effects).
The relationship between the number of years using mineral fertilizer and technical skills is also
relatively strong (middle panel of Figure 1B). This provides some validation, but is also a reminder
that the direction of causality is hard to infer. A respondent may know more about fertilizer because
he’s been using it for a while, or may have been using it exactly because he knew about it. The
right panel suggests that such interactions depend on the level of cognitive skills. Finally, the
figures also show a relatively strong positive correlation between cognitive, technical and
noncognitive skills. This points to the importance of studying the different types of skills together
rather than independently, to avoid wrongly attributing to a skill the effect of other correlated skills.
Yield predictions by construct
The key outcome variable we use to test predictive validity is maize yield. Maize is the main crop
in the region of study, and the only crop that households in the sample have in common. As yield
in rainfed agriculture is known to be a particularly noisy outcome variable we use the average rank
26 The cognitive construct is very highly correlated with the respondent’s reported education, with 59% of the variation
in the cognitive score explained by the respondent’s grades attained and self-declared literacy. Respondents education
also explains a relatively large share of the variation in the noncognitive (19%) and technical (11%) skills, though clearly
much less than for the cognitive skills.
19
of yield over the four seasons following the completion of the skills data collection, with ranks
rescaled from 1 to 100.27
We test how much of the variation in yield is explained by the measures of cognitive, noncognitive
and technical skills, by regressing yield on the different skill constructs. The first five columns in
Table 4 do not include controls and demonstrate the share of variation explained by the three skill
constructs (R-squared). Column 6 to 10 report results from a specification with controls and shows
whether the skill measures remain significant after controlling for observed farmer, household and
village characteristics.28 Significant coefficients on skills in the later regression point to the
potential of skill measures to capture otherwise unobserved characteristics.
The results are presented for four different types of constructs: the naïve constructs, improved
constructs, the naïve constructs averaged over test and retest, and the improved constructs averaged
over test and retest. The comparison of estimates with the naïve constructs versus the improved
constructs indicates how much gain in predictive power comes from efforts to aggregate the items
in a way that better accounts for measurement errors. And the comparison of the improved
constructs with the test-retest averages shows to what extent the improved construct yield similar
results as averaging over multiple waves, an alternative but costly method to reduce random
measurement error. Finally, the test-retest average of the improved constructs provides our best
estimate of the role of skills using all means available to get the most reliable constructs.
Results in Table 4 broadly show that the three types of skills matter, as all three coefficients are
significant and combined the measures explain a substantial share of the variation in yields. The
R-squared of the naïve constructs without any control is 12.1 percent (column 1), compared to 14.5
percent when using the improved constructs (column 2). Interestingly this last figure is practically
the same as the R-squared obtained when averaging the naïve scores of test and retest (column 3).
Hence using the information in the data to improve the aggregation of different questions leads to
as much improvement as the use of a second wave (a method that doubles the cost of data
collection). The combination of both the improved method and averaging test and retest further
raises the R-squared to 16.6 percent, providing our most reliable estimate of the contribution of the
different skills to explaining variation in yields. This is likely still an underestimate of the
27 We use the rank because it is less sensitive to extreme values (Athey and Imbens, 2016). The appendix shows similar
regressions using the average of the log of the yield for the same seasons. The results are qualitatively similar but less
precise.
28 Controls include education, literacy, gender, age and age squared of the farmer, land and cattle ownership, size and
quality of the house, household size, whether the farmer is the household head, and household head’s gender. We also
include village and enumerator-assignment fixed effects. We use the randomly assigned enumerator as opposed to the
actual enumerator, as only the former is exogenously determined.

20
explanatory power of skills, as we know from section 3.2 that the improved constructs contain a
fair amount of noise.
The estimations with controls (column 6 to 9) show that these conclusions stand even after
controlling for observables. Skills are jointly significant, and remarkably cognitive skills remain
significant even after controlling for education and literacy. Comparing across columns, the highest
improvement in significance and size of the coefficients from cleaning up measurement error is
seen in the technical construct. This is consistent with the fact that this was the noisiest construct
according to test-retest and Cronbach’s alpha. Column 4 further suggests that technical skills may
be more important than other skills once measurement error is addressed, though this conclusion
does not hold when adding controls (column 8). Hence more generally, the evidence shows that all
three skills matter for agricultural productivity, but properly capturing this effect requires
substantial effort, both in data collection and aggregation method.
Finally columns 5 and 10 use the most reliable constructs (improved average across test and retest)
but do not include technical skills. This could be important because cognitive and noncognitive
skills may have effects on yields that go through technical knowledge, possibly attenuating their
coefficients when technical skills are controlled for. Indeed both coefficients increase when the
technical skill construct is removed.29 This specification also assesses the relative importance of
cognitive versus noncognitive skills, and suggests that both are equally important for productivity,
a result that parallels results on the importance of skills in US labor markets in Heckman, Stixrud
and Urzua (2006) and Heckman and Kautz (2012). The point estimates suggest that a one standard
deviation increase in cognitive or non-cognitive skills increases the average rank of maize yield
with 4 to 5 percentage points.30
Yield predictions by sub-construct
The level of aggregation used in Table 4, with one aggregate construct to measure each of the
domains, is higher than what is often used in empirical work on skills. We hence also present
predictions using the subdomains of each of the skills, separating out the different cognitive tests,
the subscales for personality and lower order constructs, and subscales of technical skills by broad
topic. Table 5 first presents estimates using the naïve sub-constructs. All variables are measured as
z-scores. The regressions are estimated with the set of controls, but the adjusted R-squared in
29 Comparing column 1, 4 and 5 in Table 4, note that the cognitive skill construct loses explanatory power as the precision
of the technical skill construct increases, but gains significance when it is removed. This suggests that the effect of
cognitive skill on yield could be operating through its effect on technical knowledge.
30 This corresponds to about 21 percent of a standard deviation in the average rank of yield.

21
absence of any controls is added in the bottom of Table 5. Using sub-constructs increases the R-
squared for the predictive model for yields from 11.9 percent with naïve constructs to 13.9 with the
sub-constructs.
None of the cognitive tests on their own has a significant relationship with productivity or input
use, and the F-test for joint significance is also low. The same finding holds for the technical skills.
This is consistent with the earlier finding that test-retest and alphas are lower for the sub-constructs
than for the aggregate constructs, indicating high measurement error is introduced in the regressions
with the sub-constructs, making it difficult to assess their true relationship with yields.
In contrast, we find a few significant correlations with the noncognitive subscales. The 15
noncognitive sub-constructs are jointly significant. The few significant results suggest that causes
of poverty, tenacity, agreeableness and CESD might have some predictive power for yields, but
coefficients are only marginally significant from each other. To illustrate the risk of drawing
erroneous conclusions from this type of regression, column 2 to 6 present similar regressions where
we only keep one sub-construct at a time, using each component of the Big Five. In four out of five
cases the coefficient is significant. We only present the Big Five for conciseness, however 10 out
of the 15 coefficients are significant when they are the only noncognitive variable in the estimate.
The evidence hence indicates that noncognitive skills matter, but that it is difficult to distinguish
the effects of its different subcomponents.
Table 6 shows similar regressions, but now using the improved constructs and keeping the number
of factors suggested by the EFA. Column 1 shows the cognitive construct becomes significant, as
do the first and fourth noncognitive factor. The later mirrors the findings from Table 5, as the first
factor is basically the CESD while the fourth factor is dominated by the reverse questions of the
causes of poverty. Importantly for the interpretation, we find also here that the coefficients of the
noncognitive factors are not significantly different from each other, and column 2 to 7 further
illustrates that all but one are significant when they are included without the others. Hence even the
estimates with the improved constructs do not allow to clearly discriminate between noncognitive
skills. We hence conclude that while noncognitive skills matter for productivity, the data does not
allow us to infer which of the noncognitive skills matter.
Predictions of agricultural practices
We complement the analysis with a set of regressions on key agricultural practices also averaged
over the four seasons. In particular we analyze to what extent the different skill measures are

22
predictive for the use of mineral fertilizer, manure, hybrid seeds, multiple time weeding and hiring
labor.31
Focusing on the estimates with the improved constructs, Table 7 shows that the technical skill
construct is positively correlated with a number of advanced farming practices, an encouraging sign
for its validity. As for yield, the noncognitive construct is also strongly predictive. In contrast, the
cognitive construct is not (if anything, there is a negative relationship with weeding), suggesting
that the relationship between cognition and yield is not driven by decisions regarding these
practices. The overall predictive power of the skills varies widely between practices. Skills
basically explain none of the variation in the use of manure, while they explain up to 11% of the
use of hybrid seeds.
Table 8 presents results that separate out the different noncognitive constructs, and shows that for
four out of the five practices, as for yields, the data does not allow to discriminate between the
different noncognitive skills. The regression for weeding provides an interesting exception, as the
factor that is dominated by conscientiousness is positively correlated with weeding while many of
the other factors have small and negative coefficients. The F-statistic confirms the difference
between the factors. Given the intuitive relationship between conscientiousness and efforts for
weeding, this provides some validity to the improved noncognitive constructs.
4. FURTHER UNDERSTANDING MEASUREMENT CHALLENGES
Overall this set of results presents a mixed picture on the ability of the different tests and subscales
to meaningfully measure the intended skills in the population studied. This section presents further
evidence to understand the potential sources of measurement error and derives practical guidelines
for the measurement of related skills in empirical work. The main challenges that we identify
include the interaction with enumerators, the respondent’s ability to understand the questions,
effects related to the order of sections, response biases, anchoring, different factor structures, and
other challenges specific to technical skills.
4.1 Interaction with enumerators
31 We focus on these practices as they show meaningful variation between households and across time, and can reasonable
be expected to correlate to some of the domains we are trying to measure. We exclude other practices, such as row
planting, which virtually all farmers in this context use.
23
Most tests were initially designed to be self-administrated. Yet in a rural developing country setting,
because many respondents are unable to read, the questions are typically asked by an enumerator.
This may affect responses in multiple ways even after intensive efforts to harmonize practices
during enumerator training. Drawing on the random assignment of enumerators to respondents, we
therefore estimate to what extent answers are affected by enumerators. Table 9 shows the R-
squared of a regression of the improved constructs on enumerator fixed effects. Ideally one would
like these fixed effects to have no explanatory power. Yet five percent of the variance of the
cognitive skills can be explained by which enumerator was sent to ask the questions, and this is up
to seven percent for technical skills and nine percent for noncognitive skills.32 This suggests that a
large amount of noise is introduced by the enumerators, possibly due to the level of explanations
they provide or other unintended nudges.
We also compare the test-retest statistics when the same enumerator was assigned to a given
respondent for the test and the retest compared to when a different enumerator is sent each time.33
Standard practice for test-retest correlations is to have the test administrated in similar conditions.
However from a practical point of view, test-retest correlations that are high with the same
enumerator, but lower with different enumerators, could indicate the influence of the enumerator
rather than the consistency of the measure of the latent skill. We find that assigning a different
enumerator leads to a moderate drop of .07 in the test-retest correlation of the cognitive construct,
but a drop of .11 in the noncognitive one, and .13 in the case of the technical construct, which
represents a third of its initial test-retest correlation. Hence enumerator effects reduce the reliability
of the measures quite substantially, confirming the non-ignorable role of enumerator effects for
skill measurements.
This is further confirmed when analyzing whether being surveyed at a later stage during the survey
round, i.e. on days farther away from the training when standardization may be weakened. We use
the random order in which the villages were surveyed to analyze this question, account for the
imperfect compliance with the assignment through a 2SLS estimation, and find that technical scores
are significantly higher for farmers surveyed on later dates during the test (Table A6).
These results point, first of all, to the importance of intensive training for standardized application
of the different tests, and for the potential need of re-standardization during the survey rounds. This
32 As the regressions are based on the randomly assigned enumerator, and as there were deviations from this assignment
in 25% of interviews, these percentages provide lower bound estimates of the variation explained by enumerator effects.
33 We assigned the same enumerator to test and retest in 40% of cases. As before, one would expect that the observed
differences between same and different enumerator assigned would be greater if the compliance was 100%.

24
typically would require developing detailed scripts be followed literally, and avoiding idiosyncratic
interpretation or clarifications by enumerators. Overall, attempts to standardization alone are
probably not enough (as this study shows) and as much as possible random assignment of
enumerators to respondents should be build into data collection, in order to properly account for
any remaining enumerator effects. For impact evaluations with skills measures ensuring balance of
enumerators between control and treatment groups should also help to avoid bias due to enumerator
effects. Moreover, when possible, it is worth considering introducing self-administration in at least
part of the survey instrument.34
4.2 Respondent’s ability to understand the questions
Another difference between the population studied and the population for which most tests were
designed is the low educational level of the respondents, which can affect respondents’ ability to
understand the questions. To assess this, Table 9 presents test-retest correlations, Cronbach’s
alphas, and the share of the variation explained by enumerator fixed effects, comparing respondents
for whom the aggregate cognitive index is below versus above the median. Differences between
the two groups are small for the cognitive construct, while the differences for the noncognitive
construct do not point towards any clear direction. For the aggregate technical construct there are
relatively large differences in the indicators across the two groups, all pointing towards higher
reliability in the group with higher cognitive skills. Hence respondents’ difficulties in
understanding the technical knowledge questions can probably help explain the measurement error
for the technical skills construct.
These findings indicate the important role of extensive qualitative piloting that probes the
understanding by different types of respondents in detail, and that needs to be done each time skill
measures are used in a new context. They also suggest the need to adapt standardized questions
taken from international scales to make them understandable, even if it weakens some of the
international comparability. It is further important to carefully consider the trade-off between
easing understanding by the respondent and introducing enumerator effects, as questions requiring
more explanations and enumerator initiative, such as questions involving visual aids, are harder to
standardize. The challenges resulting from the need to translate concepts to languages that may not
34 Interestingly, Table 5 shows that once we reduce the number of noncognitive variables (and with that the multi-
collinearity in the model) the cognitive test that becomes significant is the self-administered math test, which is the test
with the least amount of enumerator interference (as respondents fill in the test on their own, after the basic explanation
by the enumerator). The test also showed good test-retest and alpha statistics.
25
have the relevant equivalents, and the complexity this introduces, should not be underestimated and
needs to be understood better.35
4.3 Order of the sections in the survey
Given the length of the survey, and indeed of many other surveys in developing countries, one can
hypothesize that the duration of the survey and the order of questions play a role in explaining
measurement error. We randomly assigned the order of the cognitive, noncognitive and technical
sections in both the test and the retest and use this to assess the effect of the order of the sections.
Table 10 shows that for the cognitive and noncognitive skills the order in which the section
appeared in the test and retest does indeed significantly affect their test-retest correlations. But
contrary to our prior, there is no clear evidence of survey fatigue, as there is no systematic
degradation of the reliability when a section comes later in the survey.36
Instead the test-retest correlation for noncognitive skills was highest, and indeed above the .7
threshold, when it comes last, and differences between different test-retest combinations are
significant. In contrast, the test-retest correlation for technical skills is highest when it comes first.
This matches well with our observations in the field that noncognitive questions, which are more
abstract, tend to raise eyebrows when the survey starts with them, whereas discussion about farming
practices allowed a smoother start of the survey. Overall these results suggest that careful attention
to the order of different sections when designing a survey instrument can reduce measurement error,
while survey duration and fatigue may not be that important. Good practice would be to start with
questions on topics that the respondent finds more natural to talk about, and ask the more abstract
noncognitive questions towards the end of the survey, so that the respondents are less on the
defensive for this section, and any potential annoyance generated by such questions does not affect
the other sections.
4.4 Response Biases
Acquiescence bias may be more likely in rural low-income settings, compared to the typical high-
income developed country environment for which Big Five questionnaires and lower-order
noncognitive subscales were originally designed. The bottom panel in Figure 1, which shows a
strong negative correlation between the acquiescence score and the cognitive index (left) or the
35 The noncognitive questions posed the largest challenges for translation during survey preparation, and understanding
concepts such as “active imagination”, or “generating enthusiasm” were difficult even for the (university level trained)
enumerator team. 36 Analysis of the random order of the questions within sections leads to a similar conclusion
26
educational level (middle), is suggestive in this regard. The gradients are steep, and the
acquiescence score is twice as large for somebody with no education compared to somebody with
10 years of education. This is consistent with qualitative observations during piloting: “ya-saying”
was more likely when respondents didn't fully understand a question, and this happened more often
for lower educated individuals. Cross-country evidence comparing acquiescence scores of the Big
Five across 18 countries similarly shows higher acquiescence scores in lower income settings, and
for lower educated populations (Rammstedt, Kemper, and Borg, 2013). The right panel in Figure
1 suggests that the relationship between acquiescence bias and age is less clear, though the u-shape
curve may suggest that controlling for a quadratic function of age can help control for some of the
acquiescence bias.
Strikingly, the acquiescence score shows a strong negative correlation with yields (coefficient is -
6.15 of the average rank of maize yield), significant at the 5%, indicating that respondents with a
higher propensity of agreeing with different statements have lower yields on average. The
importance of acquiescence bias in the sample and its high correlation with both cognitive skills
and outcomes of interest imply that the actual effects of the noncognitive skills may be confounded
with response patterns when the later are not properly dealt with. Because acquiescence bias leads
to observable contradictions in the responses of reversed and non-reversed items, it can be corrected
for as we have done in this paper. But this requires balancing reverse and non-reversed items in all
scales, a practice commonly used in psychology but often ignored by economists. As reverse items
can be somewhat harder to understand or translate, they may require more adaptation and
innovation (avoiding for instance double negations which can confuse the respondent). While it
may be tempting to instead drop reverse items, the benefits of being able to measure and correct
acquiescence bias seem to clearly outweigh the costs.
Of course, acquiescence bias is only one of the possible response biases. Other biases include
“extreme response bias” and “middle response bias”. In this study, correcting for extreme response
bias by standardizing the standard deviations of responses did not lead to improvements in validity
or reliability, as has been found also in other psychometric studies. That said, the distribution of
many of the positively-phrased noncognitive questions is highly skewed to the right, suggesting it
remains a potential concern.37 The use of anchoring vignettes may provide a possible promising
avenue to address different types of response patterns (Hopkins and King, 2010; Primi et al, 2016)
and more research is needed to test this approach in large rural household surveys.
37 This was the case even after eliminating variables showing the least variation after the piloting.
27
Finally, “social desirability bias” may lead a respondent to answer what he believes would give the
best impression, or what the enumerator may want to hear. In surveys related to impact evaluations,
respondents may also believe their answers could affect the probability to receive benefits and
attempt to answer strategically. Such biases are difficult to avoid when using self-reports rather
than observed outcomes and the extent to which they affect the measures and generate a non-
random noise remains difficult to assess. While this holds for many outcomes other than skills, in
the case of skills such response patterns provide an additional challenge for the interpretation of
the findings, as the way of answering questions may be related to personality itself. The use of
forced choice questions or situational judgment tests (Lipnevich, MacCann and Roberts, 2013;
Kyllonen, 2016) may provide a potential answer to these concerns, but the extent to which they
improve validity or reliability in large rural household surveys is an open question.
4.5 Anchoring and the use of other sources of information
The previous sub-section raises the possibility of different response biases affecting the answers.
Another important response pattern comes from the fact that each respondent may interpret the
Likert Scale differently and use thresholds to decide between answer categories. Anchoring
vignettes possibly can help to address this challenge too. Another way of breaking the relationship
between answer patterns and skills is to ask another person about the skills of the person of interest,
not unlike the use of recommendation letters to evaluate skills in other settings.
A priori, the random measurement of a person’s skills should be noisier when asking somebody
else, as the other person is likely to have asymmetric information about the true skill level. Yet if
it helps to address the systematic bias, or if the introduced random measurement error is limited,
this may constitute an alternative or complementary manner to measure skills. To test these trade-
offs, we collected proxy information from a number of different sources. First we asked the
community health worker (CHW), a person well informed about different village members, based
on her regular home-visits, to classify households according to their cognitive, noncognitive and
technical skills (3 questions). 38 In addition, we ask another household member, as well as two
other village members (one at test and one at retest) to give an assessment of 14 specific skills of
the respondent, each answered on a Likert scale. Each person in the sample informed about 2 other
people in the sample. For comparison, each person was also asked the same 14 questions about
38 Because the CHW’s responsibilities requires him or her to regularly visit villagers, they were expected to be among
the ones that should be best informed about the skills of others. Picking a random person in the village may not yield the
same results.

28
herself.
Table 11 shows the correlations of these different proxy measures with the relevant scales or
subscales. We note that correlations between observable and objective skills (language and math)
and proxy measures are good, but that all other correlations are very low. Strikingly, for 9 out of
15 measures, the correlation between proxy measures of skills of the same person by two different
people is smaller than the correlation between proxy measures of skills of two different people by
the same respondent. This again points to the importance of systematic answering patterns by
respondents, which appear more important than the actual skill differences between the two people
about whom the proxy reports. Possibly, the fact that information about another person may be less
salient than about oneself, accentuates the relative influence of the answering pattern.
Turning to the predictive power of the proxy report, Table 12 shows results for the answers of the
CHW. Asking the same person about the skills of multiple other persons presents the advantage of
ensuring that the person uses the same anchoring, making the resulting measure more comparable
within this group. As each CHW was asked about the 10 sample farmers of the village, we include
village fixed effects to take out any systematic CHW effect. Column 1 shows the variation
explained by only those fixed effects, column 2 show the additional variation explained by the three
skill proxies as obtained from the CHW, and column 3, shows the specification with the full set of
controls. The results show that using proxy reports by a village informant we obtain broadly similar
results as those obtained with direct reports, with all three proxies having predictive power for yield
when no other controls are included, and the CHWs report on farmers’ technical skills being
particularly robust.
These results are striking, as they suggest that some of the first order results can be obtained by
asking 3 simple questions to a well-informed key-informant, instead of asking 2.5 hours of targeted
skill questions and tests to the respondent. That said, clearly such proxy measures are not a good
solution when one aims to obtain comparable skill measures across villages. More generally, we
interpret these results as evidence of large remaining amount of measurement error in the self-
reported outcomes. Results with other proxy respondent are broadly similar but are less significant
and robust, possibly because the response bias cannot be cancelled out. Hence for proxy
information, there appears to be a benefit of asking one well-informed and connected person about
many people in the village, rather than using several proxy respondents.
4.6 Differences in the factor structure
The factorial analysis of the noncognitive skills in section 3 raised concerns because it often did
not pool items that were expected to belong to the same sub-constructs into the same factors. To

29
formalize this finding, a congruence test (explained in more details in the appendix) tests the degree
of correlation of the factor loads of similar items obtained in different contexts. We restrict the
analysis to the 23 items from the Big Five included in our study, as we want to compare constructs
based on the same set of items. Table 13 presents the congruence with respect to the same items
administrated in the United States where it has been validated multiple times. It shows an average
congruence across the five factors that is only .40. For comparison the congruence using the factor
loads of the same items administrated in Spain, Holland and Germany show congruence
coefficients ranging between .76 and .93.
This finding could indicate that the underlying factor structure is different for this population than
for populations on which it was previously validated. But it could also be that the lack of
understanding of some items or response patterns did not allow detecting the same factor structure
even if the true latent factors are similar. If the main problem was lack of understanding, we would
expect the congruence with the US to be higher among individuals that are above the median of
cognitive skills compared to the ones below the median, but this is not what we find. Further
investigation is needed to better understand the lack of congruence.
Our calculation of improved indexes used the factorial analysis of items corrected for acquiescence
bias. For comparison, the factor loads of the items non-corrected for acquiescence bias are
presented in Appendix Table A7. They generally show far less consistency in how the items are
sorted, making it very difficult to attribute a dominant interpretation to the factors. Instead, specific
factors appear to be pooling questions with the same answer types and phrasing. The first, fifth and
sixth factors are only pooling items that are not reversed, and second, third and fourth factor are
pooling reversed items together. Almost all factors that are not in a one to five Likert-scale sorted
themselves together in the sixth factor. In sum, without the correction of acquiescence bias, the
share of the variance in the responses driven by acquiescence bias and other response patterns
overwhelms variance in responses that is driven by the latent traits that are intended to be measured.
Clearly a factor analysis that is driven by phrasing rather than actual content is of little interest to
the researchers, hence the prior correction for the acquiescence bias is fundamental. Although far
from making it perfect, the correction improves the items ability to capture a somewhat coherent
factor structure.
The findings in this paper hence suggest it is advisable to first correct for acquiescence bias, and
systematically analyze the latent factor structure through exploratory factor analysis when using
noncognitive skills data. Naïve interpretation of item aggregation following pre-existing constructs
without such analysis is likely to lead to erroneous conclusions regarding noncognitive skills.
30
4.7 Explaining the noise in the measure of technical skill
As the technical skills questions attempt to measure knowledge, one would expect them to be less
affected by systematic response biases. They require respondents to choose between a series of
answers that don’t have a clear ranking, or to give open answers, and while respondents certainly
can (and do) guess, systematic bias of all questions in a certain direction is less likely. The results
in this paper indicate however that random measurement error is much more important for technical
than for cognitive skills. This can be inferred from the low test-retest statistics, low Cronbach’s
alpha, and the gains in precision and predictive power when using means of test and retest, or the
gains in precision from using factor analysis.
As discussed above, respondents’ difficulties in understanding the technical knowledge questions
may partly explain the measurement error. Insights from the qualitative field work provide some
additional insights for why the technical measure is noisy. To effectively assess a skill a question
needs to have only one correct answer and have enough variation in the responses to be informative
of the respondents’ knowledge. However, after working with agronomists to identify the most
fundamental knowledge that can affect the farmer’s productivity and piloting the questions, we
found that most of them fell into one of the two following categories. Questions with unambiguous
correct answers were answered correctly by the vast majority of farmers.39 In contrast, questions
that had sufficient variance in the responses often were questions for which the right answer may
depend on the context.40 Informative questions with one correct answer were difficult to find,
precisely because the difficulty to make the right decisions in farming often comes from the
difficulty to adapt to each context rather than applying a “one size fits all” solution. Obtaining better
measures of technical skills may require the development of new techniques that assess whether
the numerous micro-decision taken by a farmer fit his environment.
5. CONCLUSIONS
Cognitive, noncognitive and technical skills are thought to play a key role for many economic
decisions and outcomes in developing countries and are increasingly incorporated in empirical
analyses. Little is known, however, about the validity or reliability of commonly used skill
39 This may be different when farmers have recently been exposed to new information (for instance through an extension
intervention) as differences in exposure and internalization of the new messages may create more empirical variation in
knowledge of this new information.
40 For instance, the optimal number of seeds in a hole at planting can depend on the quality of the seeds and the spacing
between seeds, and when farmers answer this question, their benchmark quality and spacing might be different than those
of the agronomist. And their answers may change over time if answers reflect their most recent experiences.

31
measures in surveys conducted in developing countries. This study is the first to investigate the
reliability, validity, and the predictive power of a large range of skill measures on a poor rural adult
population in a developing country setting. We do so using data from a survey experiment,
specifically designed for this purpose, and a variety of statistical tools and methodologies. The
results show the cognitive skills measures are reliable and internally consistent, while technical
skills are difficult to capture and very noisy. The evidence further suggests that measurement error
in noncognitive skills is non-classical, as correlation between questions are driven in part by
answering patterns of respondents and the phrasing of the questions.
These results first of all suggest that collecting comparable information on cognitive skills in large
household surveys in field conditions is feasible. Further validation of such measures in other
contexts will be important to establish whether these conclusions hold in different settings –
including possibly when cognitive measures are less correlated to educational achievement – and
the extent to which such measures allows to compare cognitive outcomes across countries, or across
regions/groups within a country.
The study further shows how specifically accounting for measurement error through factor analysis
and item response theory can help increase the validity, reliability and predictive power of the
technical skill measures. It also highlights that obtaining a good aggregate and stable measure of
agricultural knowledge is challenging, as the “right” answer to many agricultural questions is
context-specific, so that it can differ both between respondents, and even for the same respondent
over time. Nevertheless, once the measurement error is reduced, the technical skills seem to lead
to coherent predictions.
The results in this paper also show the weaknesses of instruments designed to capture noncognitive
outcomes in other settings, when applied in poor rural settings. It highlights the importance of using
factor analysis and corrections for response patterns to obtain more reliable and valid measures,
and warns against naïve interpretation of existing scales.
The study further establishes that the skill measures can contribute to explaining meaningful
variation in agricultural productivity and practices. When using our best estimates to address
measurement errors, we find that the three skills contribute about equally to explaining yield. That
said it raises a number of questions to be investigated moving forward. Indeed, while the methods
applied in this paper helped reduce some of the measurement error, a large amount of measurement
error remained after such corrections in both the noncognitive and the technical constructs. The
evidence further suggests that having a relatively large set of items, and repeated measures, was
important to correct for the measurement error.

32
While the purpose of this study was to explicitly test for measurement error with existing scales,
these sobering results arguably suggests the need for noncognitive and technical skill measurement
instruments that are more adapted to a poor rural study population, and subsequently validated. Our
results also flag the relatively large variation in answers due to variation across enumerators,
pointing to the importance of carefully accounting for such enumerator effects in the data collection
design.
Obtaining good measures of adult skills is a prerequisite for empirical work on the importance of
skills for economic decision-making in developing countries and can be key to fully analyze the
optimal design and potential benefits of a number of policies. For the rural sector, a better
understanding of adult skills is particularly pertinent, given the often-hypothesized selection of
higher skilled individuals into the non-agricultural occupations. The results in our paper suggest
that if indeed this leads to low skills levels of the population engaged in farming, this may have
important implications for the low productivity in agriculture and the lack of adoption of potentially
profitable farming practices. Policies aiming to improve productivity might then need to go beyond
training in technical skills and more broadly target the factors underlying low cognitive and
noncognitive skills in developing countries. Further improvement in skill measures for these
populations are hence needed to better understand the importance of these factors.
Finally, while this paper focuses on measures during adulthood, we fully recognize that skills start
to develop much earlier in life. Indeed, it is now widely recognized that poverty during early
childhood can lead to very serious cognitive delays and affect socio-emotional development
(Grantham McGregor et al., 2008). Growing evidence furthermore suggest a strong link between
early childhood and adult outcomes. As such, a better measurement of adult skills can contribute
to better understand the long-term returns to social policies targeting early childhood.

33
REFERENCES
Adhvaryu, A., N. Kala and A. Nyshadnam, 2016. “Soft Skills to Pay the Bills: Evidence from
Female Garment Workers”, mimeo, University of Michigan
Almund, M. A. Duckworth, J. Heckman, and T. Kautz, 2011. “Personality Psychology and
Economics,” (with). In E. Hanushek, S. Machin, and L. Woessman, eds., Handbook of the
Economics of Education , Amsterdam: Elsevier. pp. 1-181.
Athey, S., and G.W. Imbens, 2016. “The Econometrics of Randomized Experiments”, Banerjee,
A. and E. Duflo, (eds.), Handbook of Economic Field Experiments. Volume 1. Elsevier.
Attanasio, O., S. Cattan, E Fitzsimons, C. Meghir, and M. Rubio-Codina, 2015. “Estimating the
Production Function for Human Capital: Results from a Randomized Control Trial in
Colombia”, NBER Working Paper No. 20965
Benet-Martinez, V. and O.P. John, 1998. “Los Cinco Grandes across cultures and ethnic groups:
Multitrait multimethod analysis of the Big Five in Spanish and English”, Journal of
Personality and Social Psychology (75): 729-250.
Bernard, T. and A. Taffese, 2014. “Aspirations: An Approach to Measurement with Validation
Using Ethiopian Data” Journal of African Economies (2014) 23 (2): 189-224
Bernard, T., S. Dercon, K. Orkin, and A. Taffese, 2014. “The Future in Mind: Aspirations and
Forward-Looking Behaviour in Rural Ethiopia”, CEPR Discussion Papers 10244.
Bertrand, M. and S. Mullainathan, 2001. “Do People Mean What They Say? Implications for
Subjective Survey Data”, American Economic Review, 91 (2): 67–72.
Blattman, C., J. Jamison and M. Sheridan, 2016. “Reducing crime and violence: Experimental
evidence on adult noncognitive investments in Liberia“, American Economic Review,
forthcoming.
Blattman, C., and S. Dercon, 2016. “Occupational Choice in Early Industrializing Societies:
Experimental Evidence on the Income and Health Effects of Industrial and Entrepreneurial
Work”, IZA discussion Paper 10255.
Borghans, L., A. L. Duckworth, J.J. Heckman, and B. ter Weel, 2008. "The Economics and
Psychology of Personality Traits," Journal of Human Resources, 43(4): 972-1059.
Bowles, S., H. Gintis, and M. Osborne 2001. “The determinants of earnings: a behavioral
approach.” Journal of Economic Literature, 39(4), 1137–76.

34
Callen, M., S. Gulzar, A. Hasanain, Y. Khan, and A. Rezaee, 2015. "Personalities and Public Sector
Performance: Evidence from a Health Experiment in Pakistan." NBER working
paper 21180
Cunha, F. and J. Heckman, 2010. “Investing in our Young People.” NBER Working Paper No.
16201.
Cunha, F., Heckman, J., and Schennach, S., 2010. Estimating the technology of cognitive and non-
cognitive skill formation. Econometrica 78(3):883-931.
Dal Bo, E., F. Finan & M.A. Rossi, 2013. "Strengthening State Capabilities: The Role of Financial
Incentives in the Call to Public Service," The Quarterly Journal of Economics, vol. 128(3),
pages 1169-1218
de Janvry, A., E. Sadoulet and T. Suri, 2016. “Field Experiments in Developing Country
Agriculture”, Banerjee, A. and E. Duflo, (eds.), Handbook of Economic Field Experiments.
Volume 1. Elsevier.
Delavalande, A., X. Gine´ and D. Mckenzie, 2011. “Measuring Subjective Expectations in
Developing Countries: A Critical Review and New Evidence”, Journal of Development
Economics, 94 (2): 151–63.
Fischer R., and T. L. Milfont, 2010. “Standardization in psychological research.” International
Journal of Psychological Research. 3, 88–96.
Gertler, P., J. Heckman, R. Pinto, A. Zanolini, C.Vermeersch, S. Walker, S. M. Chang, S.
Grantham-McGregor, 2014. “Labor market returns to an early childhood stimulation
intervention in Jamaica”, Science 30: (344): 6187 pp. 998-1001.
Ghosal, S., S. Jana, A. Mani, S. Mitra and S. Roy, 2016. “Sex Workers, Stigma and Self-Belief:
Evidence from Kolkata brothels”, Working Paper 302 Department of Economics, Warwick
University.
Gollin, D., D. Lagakos, and M. E Waugh, 2014. “The Agricultural Productivity Gap," Quarterly
Journal of Economics, 129 (2), 939-993.
Grantham-McGregor, S., YB. Cheung, S. Cueto, P. Glewwe, L. Richter, and B. Strupp, 2007.
Developmental Potential in the First 5 Years for Children in Developing Countries. The
Lancet 369(9555): 60–70.
35
Groh, M., D. McKenzie, and T. Vishwanath, 2015. “Reducing Information Asymmetries in the
Youth Labor Market of Jordan with Psychometrics and Skill Based Tests”, World Bank
Economic Review 29(suppl 1): S106-S117.
Heckman J.J. and T. Kautz, 2012 “Hard Evidence on Soft Skills”, Labour Economics, 19(4):451–
464.
Heckman, J. J. 2007. “The Economics, Technology and Neuroscience of Human Capital
Formation.” Proceedings of the National Academy of Sciences 104(33): 13250–255.
Heckman, J. J., 1995. “Lessons from The Bell Curve”. Journal of Political Economy, 103 (5), 1091-
1120.
Heckman, J. J., J. Stixrud, and S. Urzua, 2006. “The effects of cognitive and noncognitive abilities
on labor market outcomes and social behavior.” Journal of Labor Economics, 24 (3), 411-
482.
Hicks, Loue E., 1970. “Some properties of ipsative, normative and forced-choice normative
measures.” Psychological Bulletin, 74, 167-184.
Hopkins, D., and G. King, 2010. Improving Anchoring Vignettes: Designing Surveys to Correct
Interpersonal Incomparability. Public Opinion Quarterly: 1-22.
Jack, B.K., 2011. “Market inefficiencies and the adoption of agricultural technologies in developing
countries” White paper prepared for the Agricultural Technology Adoption Initiative,
JPAL (MIT) / CEGA (Berkeley)
John, O.P; L.P. Naumann, and C.J. Soto, 2008. “Paradigm Shift to the Integrative Big-Five Trait
Taxonomy: History, Measurement, and Conceptual Issues. In O.P. John, R.W.robins &
L.A. Pervin (Eds.), Handbook of personality: Theory and research, pp114-158. New York,
NY: Guilford Press.
Krueger, A.B, and D.A Schkade, 2008. The Reliability of Subjective Wellbeing Measures. Journal
of Public Economics 92(89):1833-1845.
Krutikova, S. and H.B. Lilleor, 2015. “Fetal Origins of Personality: Effects of early life
circumstances on adult personality traits”, CSAE working paper 2015-03.
Kyllonen, P., 2016. “Designing Tests to Measure Personal Attributes and Noncognitive Skills”, in
Lane, Suzanne; Raymond, Mark R.; Haladyna, Thomas M. (eds.) Handbook of Test
Development, Second Edition. New York: Routledge, p190-211”

36
Lagakos, D. and M. Waught, 2013. “Selection, Agriculture, and Cross-Country Productivity
Differences”, American Economic Review. 103 (2): p. 948-980
Ledesma, R.D., and P. Valero-Mora, 2007. "Determining the number of factors to retain in EFA:
An easy-to-use computer program for carrying out parallel analysis." Practical assessment,
research & evaluation 12.2: 1-11.
Leight, J., P. Glewwe, and A. Park, 2015. “The Impact of Early Childhood Shocks on the Evolution
of Cognitive and Non-Cognitive skills”, Gansu Survey of Children and Families Papers.
Paper 51
Lipnevich, A. A., C. MacCann, and R.D. Roberts, 2013. “Assessing noncognitive constructs in
education: A review of traditional and innovative approaches. In D. Sklofske and V.
Schwean (eds.), Oxford Handbook of Psychological Assessment of Children and
Adolescents. Cambridge, MA: Oxford University Press.
Manski, C. F., 2004. “Measuring Expectations”, Econometrica, 72 (5): 1329–76.
McKenzie, D., 2012. “Beyond baseline and follow-up: The case for more T in experiments”,
Journal of Development Economics, 99(2): 210-221.
Murnane, R. J., J. B. Willett, and F. Levy, 1995. “The growing importance of cognitive skills in
wage determination.” Review of Economics and Statistics, 77 (2), 251-266.
Pierre, G., ML. Sanchez Puerta, A. Valerio, and T. Rajadel, 2014. “STEP Skills Measurement
Surveys - Innovative Tools for Assessing Skills." Social protection and labor discussion
paper 1421. World Bank Group, Washington, DC.
Primi, R., C. Zanon, D. Santos, F. De Fruyt, and O. P. John, 2016. “Anchoring Vignettes Can They
Make Adolescent Self-Reports of Social- Emotional Skills More Reliable, Discriminant,
and Criterion-Valid?” European Journal of Psychological Assessment, 32: 39-51
Pritchett, L. and A. Beatty, 2015 “Slow down, you’re going too fast: Matching curricula to student
skill levels” International Journal of Educational Development: 40C : 276-288.
Radloff, L.S., 1977. “The CES-D Scale: A Self-Report Depression Scale for Research in the
General Population”, Applied Psychological Measurement 1(3): 385-401.
Rammstedt, B., C.J. Kemper and I. Borg, 2013. “ Correcting Big Five Personality Measurements
for Acquiescence: An 18-Country Cross-Cultural Study”, European Journal of
Personality, 27(1): 71-81.
37
Soto, C. J., John, O. P., Gosling, S. D., & Potter, J., 2008. The developmental psychometrics of Big
Five self-reports: Acquiescence, factor structure, coherence, and differentiation from ages
10 to 20. Journal of Personality and Social Psychology, 94, 718-737.
World Bank, 2008. Agriculture for Development. World Development Report. World Bank.
Washington DC.
Young, A., 2013. “Inequality, the Urban-Rural Gap and Migration,” Quarterly Journal of
Economics, 128(4), 1727–1785.

38
Figure 1A. Correlates of improved Cognitive construct
Figure 1B. Correlates of improved technical construct

39
Figure 1C. Correlates of improved noncognitive construct
Figure 1D. Correlates of Acquiescence score
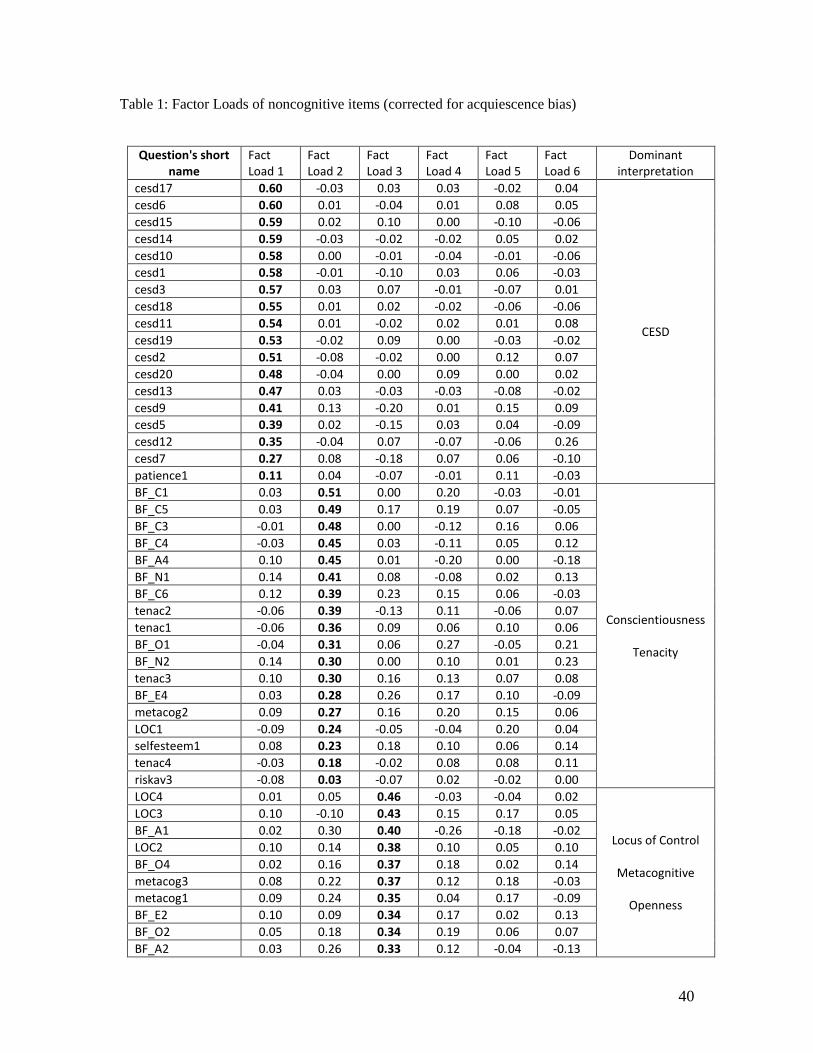
40
Table 1: Factor Loads of noncognitive items (corrected for acquiescence bias)
Question's short name
Fact Load 1
Fact Load 2
Fact Load 3
Fact Load 4
Fact Load 5
Fact Load 6
Dominant interpretation
cesd17 0.60 -0.03 0.03 0.03 -0.02 0.04
CESD
cesd6 0.60 0.01 -0.04 0.01 0.08 0.05
cesd15 0.59 0.02 0.10 0.00 -0.10 -0.06
cesd14 0.59 -0.03 -0.02 -0.02 0.05 0.02
cesd10 0.58 0.00 -0.01 -0.04 -0.01 -0.06
cesd1 0.58 -0.01 -0.10 0.03 0.06 -0.03
cesd3 0.57 0.03 0.07 -0.01 -0.07 0.01
cesd18 0.55 0.01 0.02 -0.02 -0.06 -0.06
cesd11 0.54 0.01 -0.02 0.02 0.01 0.08
cesd19 0.53 -0.02 0.09 0.00 -0.03 -0.02
cesd2 0.51 -0.08 -0.02 0.00 0.12 0.07
cesd20 0.48 -0.04 0.00 0.09 0.00 0.02
cesd13 0.47 0.03 -0.03 -0.03 -0.08 -0.02
cesd9 0.41 0.13 -0.20 0.01 0.15 0.09
cesd5 0.39 0.02 -0.15 0.03 0.04 -0.09
cesd12 0.35 -0.04 0.07 -0.07 -0.06 0.26
cesd7 0.27 0.08 -0.18 0.07 0.06 -0.10
patience1 0.11 0.04 -0.07 -0.01 0.11 -0.03
BF_C1 0.03 0.51 0.00 0.20 -0.03 -0.01
Conscientiousness
Tenacity
BF_C5 0.03 0.49 0.17 0.19 0.07 -0.05
BF_C3 -0.01 0.48 0.00 -0.12 0.16 0.06
BF_C4 -0.03 0.45 0.03 -0.11 0.05 0.12
BF_A4 0.10 0.45 0.01 -0.20 0.00 -0.18
BF_N1 0.14 0.41 0.08 -0.08 0.02 0.13
BF_C6 0.12 0.39 0.23 0.15 0.06 -0.03
tenac2 -0.06 0.39 -0.13 0.11 -0.06 0.07
tenac1 -0.06 0.36 0.09 0.06 0.10 0.06
BF_O1 -0.04 0.31 0.06 0.27 -0.05 0.21
BF_N2 0.14 0.30 0.00 0.10 0.01 0.23
tenac3 0.10 0.30 0.16 0.13 0.07 0.08
BF_E4 0.03 0.28 0.26 0.17 0.10 -0.09
metacog2 0.09 0.27 0.16 0.20 0.15 0.06
LOC1 -0.09 0.24 -0.05 -0.04 0.20 0.04
selfesteem1 0.08 0.23 0.18 0.10 0.06 0.14
tenac4 -0.03 0.18 -0.02 0.08 0.08 0.11
riskav3 -0.08 0.03 -0.07 0.02 -0.02 0.00
LOC4 0.01 0.05 0.46 -0.03 -0.04 0.02
Locus of Control
Metacognitive
Openness
LOC3 0.10 -0.10 0.43 0.15 0.17 0.05
BF_A1 0.02 0.30 0.40 -0.26 -0.18 -0.02
LOC2 0.10 0.14 0.38 0.10 0.05 0.10
BF_O4 0.02 0.16 0.37 0.18 0.02 0.14
metacog3 0.08 0.22 0.37 0.12 0.18 -0.03
metacog1 0.09 0.24 0.35 0.04 0.17 -0.09
BF_E2 0.10 0.09 0.34 0.17 0.02 0.13
BF_O2 0.05 0.18 0.34 0.19 0.06 0.07
BF_A2 0.03 0.26 0.33 0.12 -0.04 -0.13
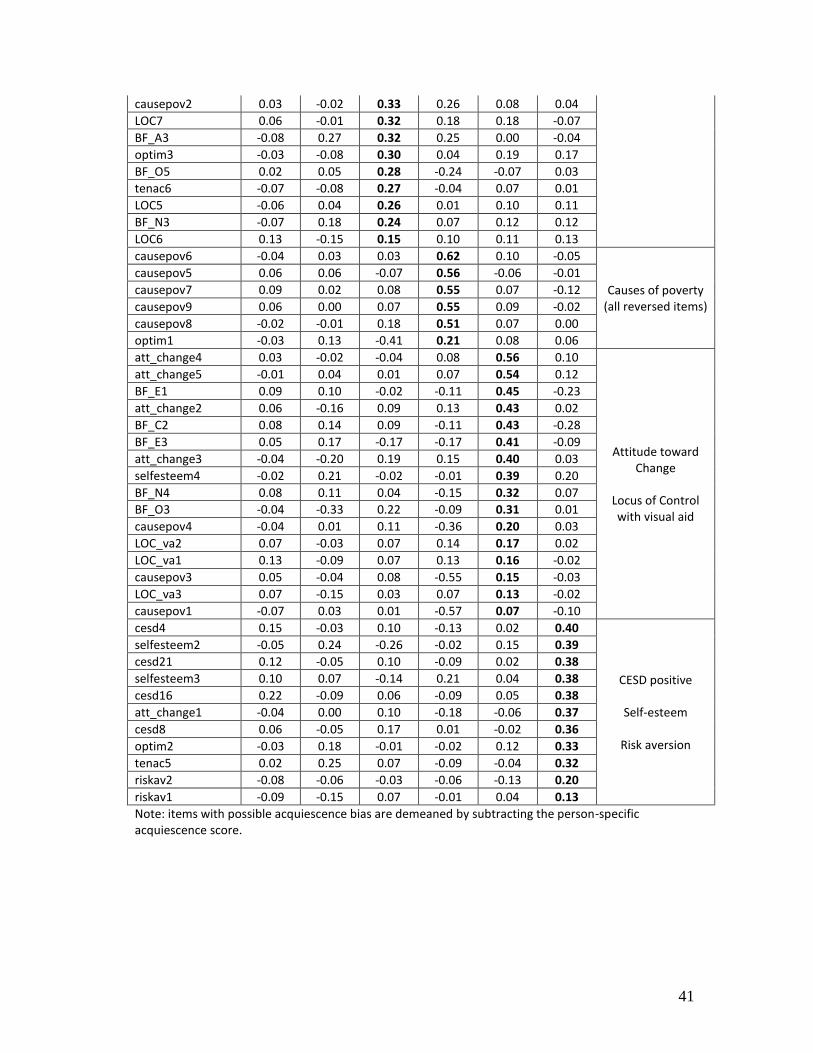
41
causepov2 0.03 -0.02 0.33 0.26 0.08 0.04
LOC7 0.06 -0.01 0.32 0.18 0.18 -0.07
BF_A3 -0.08 0.27 0.32 0.25 0.00 -0.04
optim3 -0.03 -0.08 0.30 0.04 0.19 0.17
BF_O5 0.02 0.05 0.28 -0.24 -0.07 0.03
tenac6 -0.07 -0.08 0.27 -0.04 0.07 0.01
LOC5 -0.06 0.04 0.26 0.01 0.10 0.11
BF_N3 -0.07 0.18 0.24 0.07 0.12 0.12
LOC6 0.13 -0.15 0.15 0.10 0.11 0.13
causepov6 -0.04 0.03 0.03 0.62 0.10 -0.05
Causes of poverty (all reversed items)
causepov5 0.06 0.06 -0.07 0.56 -0.06 -0.01
causepov7 0.09 0.02 0.08 0.55 0.07 -0.12
causepov9 0.06 0.00 0.07 0.55 0.09 -0.02
causepov8 -0.02 -0.01 0.18 0.51 0.07 0.00
optim1 -0.03 0.13 -0.41 0.21 0.08 0.06
att_change4 0.03 -0.02 -0.04 0.08 0.56 0.10
Attitude toward Change
Locus of Control with visual aid
att_change5 -0.01 0.04 0.01 0.07 0.54 0.12
BF_E1 0.09 0.10 -0.02 -0.11 0.45 -0.23
att_change2 0.06 -0.16 0.09 0.13 0.43 0.02
BF_C2 0.08 0.14 0.09 -0.11 0.43 -0.28
BF_E3 0.05 0.17 -0.17 -0.17 0.41 -0.09
att_change3 -0.04 -0.20 0.19 0.15 0.40 0.03
selfesteem4 -0.02 0.21 -0.02 -0.01 0.39 0.20
BF_N4 0.08 0.11 0.04 -0.15 0.32 0.07
BF_O3 -0.04 -0.33 0.22 -0.09 0.31 0.01
causepov4 -0.04 0.01 0.11 -0.36 0.20 0.03
LOC_va2 0.07 -0.03 0.07 0.14 0.17 0.02
LOC_va1 0.13 -0.09 0.07 0.13 0.16 -0.02
causepov3 0.05 -0.04 0.08 -0.55 0.15 -0.03
LOC_va3 0.07 -0.15 0.03 0.07 0.13 -0.02
causepov1 -0.07 0.03 0.01 -0.57 0.07 -0.10
cesd4 0.15 -0.03 0.10 -0.13 0.02 0.40
CESD positive
Self-esteem
Risk aversion
selfesteem2 -0.05 0.24 -0.26 -0.02 0.15 0.39
cesd21 0.12 -0.05 0.10 -0.09 0.02 0.38
selfesteem3 0.10 0.07 -0.14 0.21 0.04 0.38
cesd16 0.22 -0.09 0.06 -0.09 0.05 0.38
att_change1 -0.04 0.00 0.10 -0.18 -0.06 0.37
cesd8 0.06 -0.05 0.17 0.01 -0.02 0.36
optim2 -0.03 0.18 -0.01 -0.02 0.12 0.33
tenac5 0.02 0.25 0.07 -0.09 -0.04 0.32
riskav2 -0.08 -0.06 -0.03 -0.06 -0.13 0.20
riskav1 -0.09 -0.15 0.07 -0.01 0.04 0.13
Note: items with possible acquiescence bias are demeaned by subtracting the person-specific acquiescence score.

42
Table 2: Measures of reliability and Internal Consistency
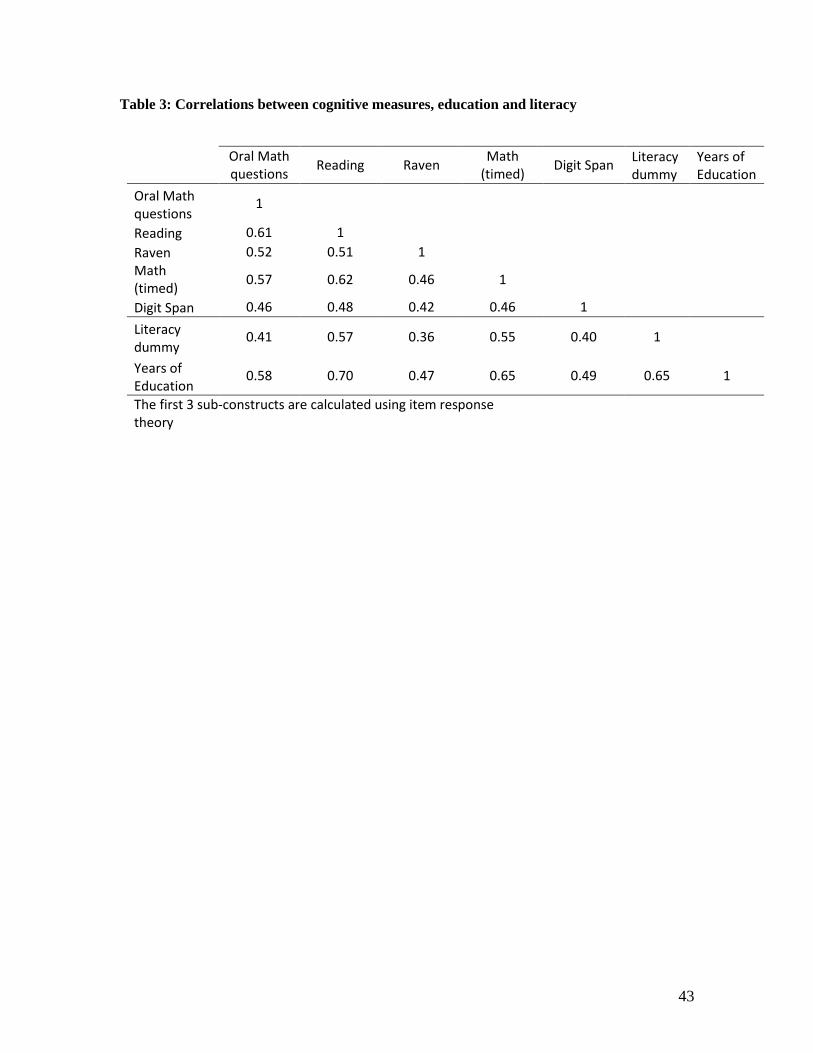
43
Table 3: Correlations between cognitive measures, education and literacy
Oral Math questions
Reading Raven Math
(timed) Digit Span
Literacy dummy
Years of Education
Oral Math questions
1
Reading 0.61 1
Raven 0.52 0.51 1
Math (timed)
0.57 0.62 0.46 1
Digit Span 0.46 0.48 0.42 0.46 1
Literacy dummy
0.41 0.57 0.36 0.55 0.40 1
Years of Education
0.58 0.70 0.47 0.65 0.49 0.65 1
The first 3 sub-constructs are calculated using item response theory
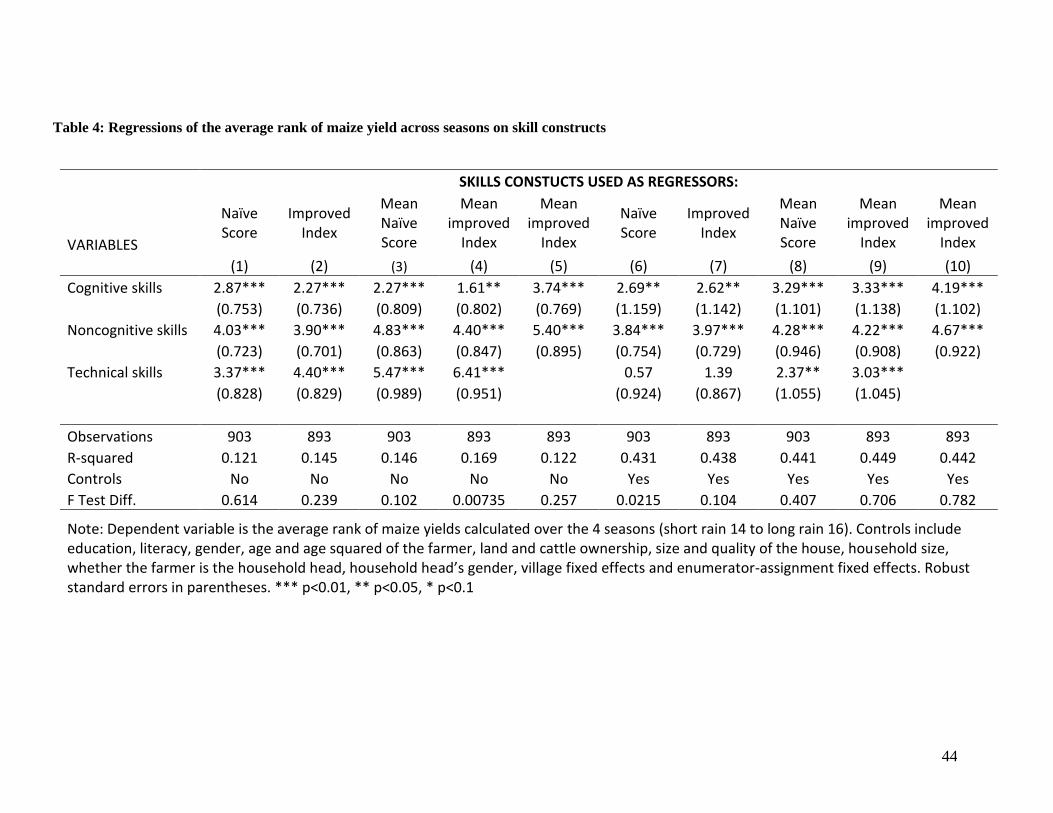
44
Table 4: Regressions of the average rank of maize yield across seasons on skill constructs
SKILLS CONSTUCTS USED AS REGRESSORS:
VARIABLES
Naïve Score
Improved Index
Mean Naïve Score
Mean improved
Index
Mean improved
Index
Naïve Score
Improved Index
Mean Naïve Score
Mean improved
Index
Mean improved
Index
(1) (2) (3) (4) (5) (6) (7) (8) (9) (10)
Cognitive skills 2.87*** 2.27*** 2.27*** 1.61** 3.74*** 2.69** 2.62** 3.29*** 3.33*** 4.19***
(0.753) (0.736) (0.809) (0.802) (0.769) (1.159) (1.142) (1.101) (1.138) (1.102)
Noncognitive skills 4.03*** 3.90*** 4.83*** 4.40*** 5.40*** 3.84*** 3.97*** 4.28*** 4.22*** 4.67***
(0.723) (0.701) (0.863) (0.847) (0.895) (0.754) (0.729) (0.946) (0.908) (0.922)
Technical skills 3.37*** 4.40*** 5.47*** 6.41*** 0.57 1.39 2.37** 3.03***
(0.828) (0.829) (0.989) (0.951) (0.924) (0.867) (1.055) (1.045)
Observations 903 893 903 893 893 903 893 903 893 893
R-squared 0.121 0.145 0.146 0.169 0.122 0.431 0.438 0.441 0.449 0.442
Controls No No No No No Yes Yes Yes Yes Yes
F Test Diff. 0.614 0.239 0.102 0.00735 0.257 0.0215 0.104 0.407 0.706 0.782
Note: Dependent variable is the average rank of maize yields calculated over the 4 seasons (short rain 14 to long rain 16). Controls include education, literacy, gender, age and age squared of the farmer, land and cattle ownership, size and quality of the house, household size, whether the farmer is the household head, household head’s gender, village fixed effects and enumerator-assignment fixed effects. Robust standard errors in parentheses. *** p<0.01, ** p<0.05, * p<0.1

45
Table 5: Regressions of the average rank of maize yield on naïve skill sub-constructs
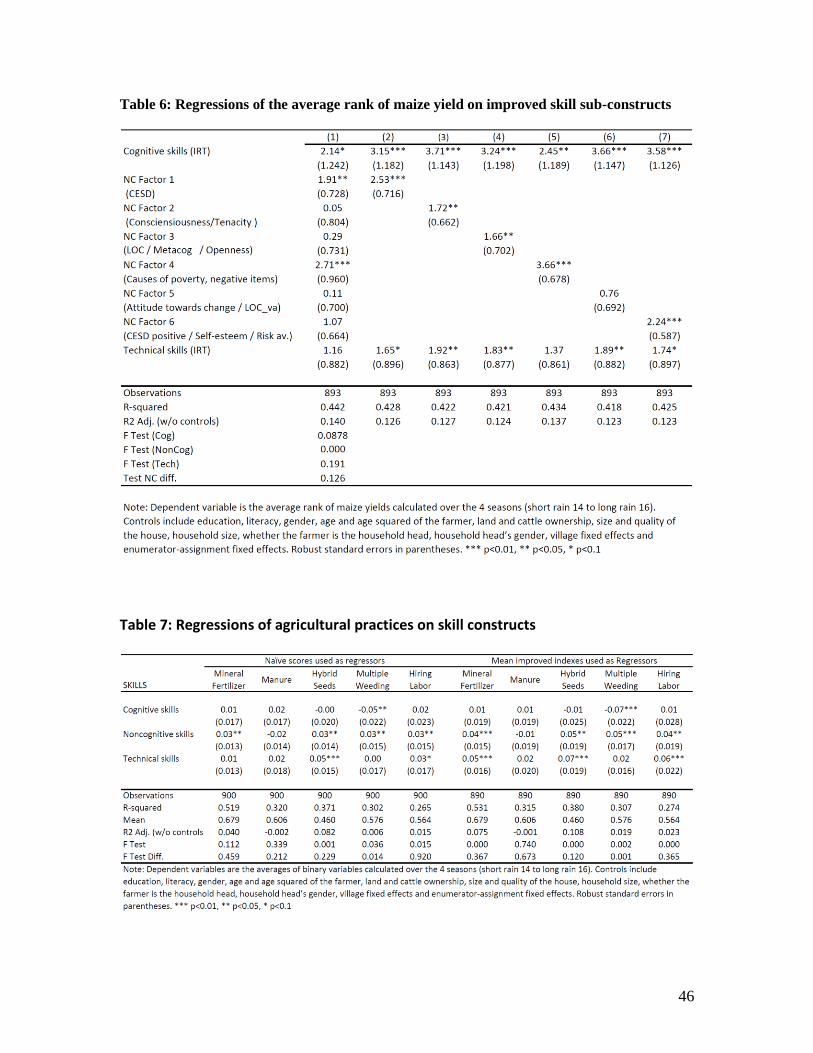
46
Table 6: Regressions of the average rank of maize yield on improved skill sub-constructs
Table 7: Regressions of agricultural practices on skill constructs

47
Table 8: Regressions of agricultural practices on improved skill sub-constructs

48
Table 9: Test-retest correlations, Cronbach’s alpha and influence of enumerators by
subgroups
Table 10: Test-retest correlations as a function of order of the section in the survey
instrument
Cognitive Order in Retest p-val all
coef equal 1 2 3
Order
in
Test
1 0.87 0.90 0.87
0.049 2 0.80 0.91 0.83
3 0.84 0.87 0.83
Noncognitive Order in Retest p-val all
coef equal 1 2 3
Order
in
Test
1 0.60 0.49 0.32
0.008 2 0.57 0.62 0.57
3 0.50 0.54 0.73
Technical Order in Retest p-val all
coef equal 1 2 3
Order
in
Test
1 0.52 0.37 0.36
0.505 2 0.51 0.30 0.47
3 0.37 0.42 0.38

49
Table 11: Correlation of different skill proxy measures with subscales measuring same domain

50
Table 12: Skills asked to a village informant: correlation with skills index and prediction of
average rank of maize yield
Table 13: Congruence of Big 5 factors compared to United States, comparisons with other
countries
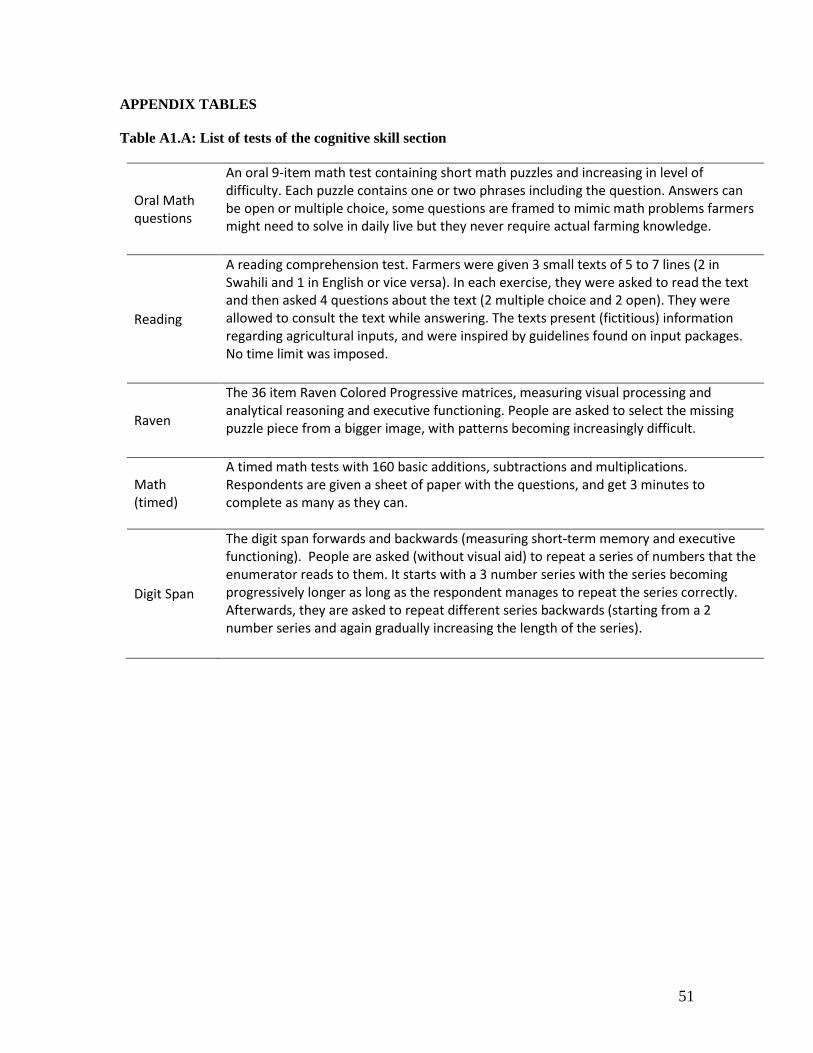
51
APPENDIX TABLES
Table A1.A: List of tests of the cognitive skill section
Oral Math questions
An oral 9-item math test containing short math puzzles and increasing in level of difficulty. Each puzzle contains one or two phrases including the question. Answers can be open or multiple choice, some questions are framed to mimic math problems farmers might need to solve in daily live but they never require actual farming knowledge.
Reading
A reading comprehension test. Farmers were given 3 small texts of 5 to 7 lines (2 in Swahili and 1 in English or vice versa). In each exercise, they were asked to read the text and then asked 4 questions about the text (2 multiple choice and 2 open). They were allowed to consult the text while answering. The texts present (fictitious) information regarding agricultural inputs, and were inspired by guidelines found on input packages. No time limit was imposed.
Raven
The 36 item Raven Colored Progressive matrices, measuring visual processing and analytical reasoning and executive functioning. People are asked to select the missing puzzle piece from a bigger image, with patterns becoming increasingly difficult.
Math (timed)
A timed math tests with 160 basic additions, subtractions and multiplications. Respondents are given a sheet of paper with the questions, and get 3 minutes to complete as many as they can.
Digit Span
The digit span forwards and backwards (measuring short-term memory and executive functioning). People are asked (without visual aid) to repeat a series of numbers that the enumerator reads to them. It starts with a 3 number series with the series becoming progressively longer as long as the respondent manages to repeat the series correctly. Afterwards, they are asked to repeat different series backwards (starting from a 2 number series and again gradually increasing the length of the series).
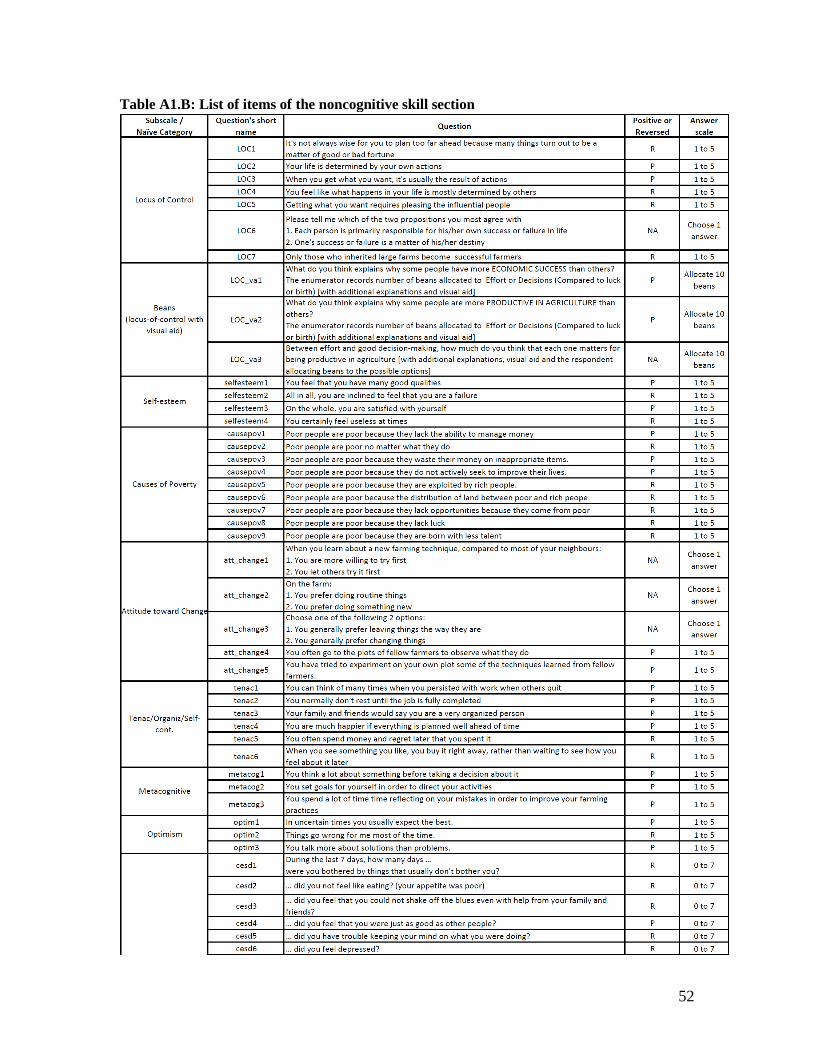
52
Table A1.B: List of items of the noncognitive skill section
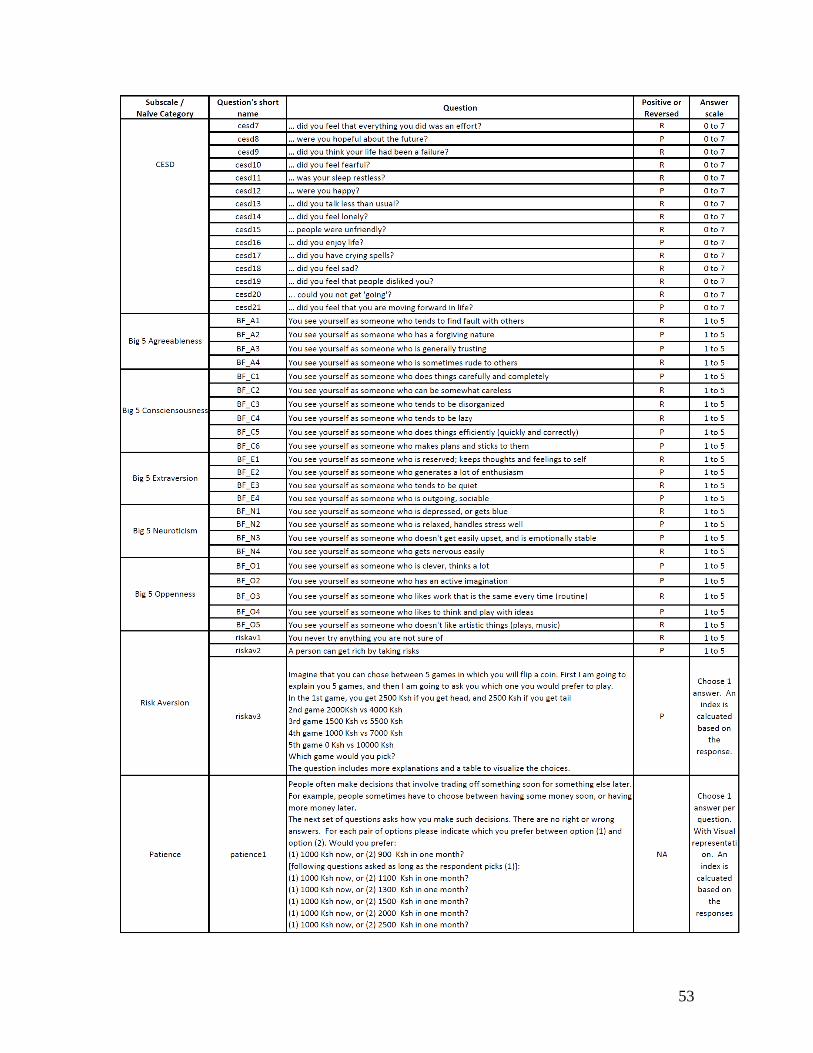
53

54
Table A1.C: List of items of the technical skill section
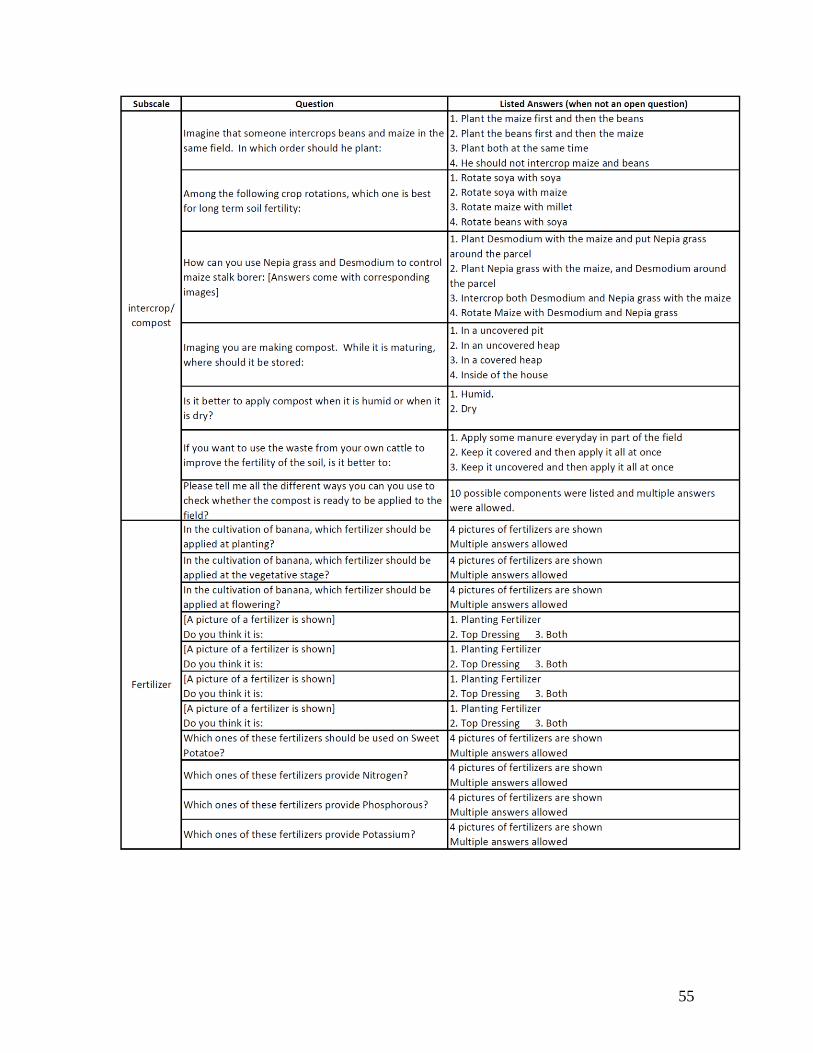
55
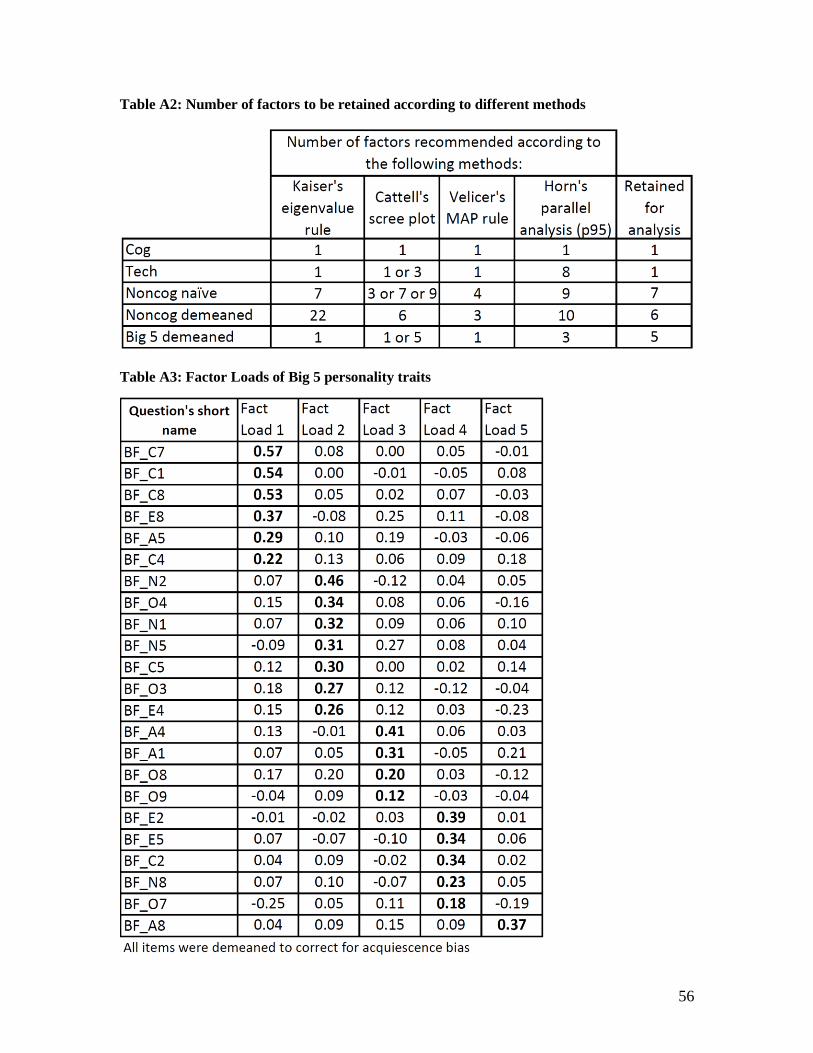
56
Table A2: Number of factors to be retained according to different methods
Table A3: Factor Loads of Big 5 personality traits

57
Table A4: Comparison of naïve scores in test and retest
Table A5: Measures of reliability and validity for noncognitive measures corrected for
acquiescence bias

58
Table A6: The effect of time (instrumented date of survey) on scores

59
Table A7: Factor Loads of noncognitive items
(items taken as they are, without correction for acquiescence bias)

60

61
Table A8: Regressions of the average of log maize yield across seasons on skill constructs
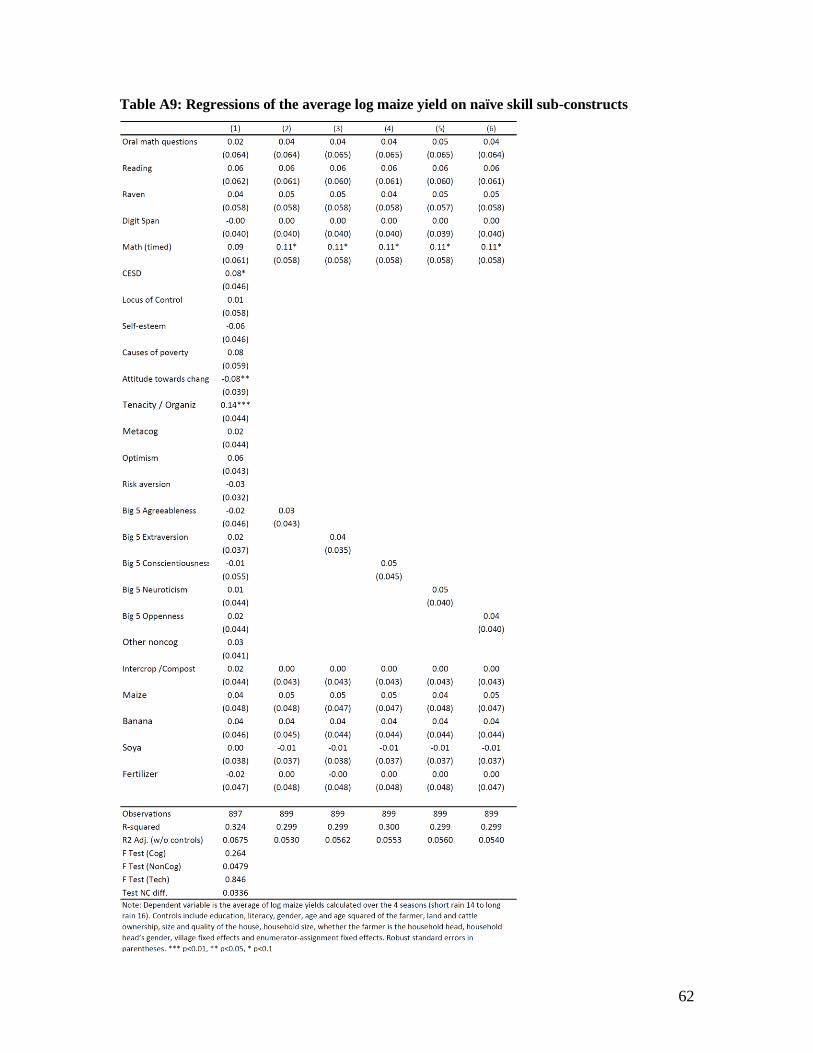
62
Table A9: Regressions of the average log maize yield on naïve skill sub-constructs

63
Table A10: Regressions of the average log of maize yield on improved skill sub-constructs
Table A11: Skills asked to a village informant: prediction of average log of maize yield

64
Appendix 1: questionnaire design and sources
A review of studies and questionnaires using different approaches to measure cognitive,
noncognitive and technical skills of adults preceded the initial questionnaire design. 41 This
appendix discusses the choices made to design the final instruments, including methods used to
reduce the number of questions and hence the overall duration of the questionnaire. It also, provides
information about the source of the different scales and tests used, and references other papers that
use them.
Cognitive module
In most empirical work in development economics, a household’s skill level is proxied by the
education level of the household head, the maximum number of years of education in the
household, or an individual’s self-assessment of his literacy level. However, education is not
always a strong correlate of productivity differences in agriculture. Existing literature reviews
(Lockheed, Jamison and Lau, 1980; Phillips, 1994) indicate that the production increase resulting
41 We do not consider the literature on measuring skills for children and teenagers, as most instruments would not
necessarily be relevant for adults See, for instance, Cueto and Leon (2012) for psychometric analysis of the skills
measures in the Young Lives surveys.

65
from four years of additional schooling is typically 7% to 8%. While the correlation is most often
positive, in many papers it is not statistically significant. It may well be that grades attained or self-
assessed literacy are not good measures of the farmers’ active knowledge of reading or math.
Farmers reading skills might matter e.g. for the processing of information regarding input use, and
his math skills might be crucial to make optimal cost-benefit analysis. A priori it is also quite
possible that it is a farmer’s broader cognitive skills (such as memory, processing ability, or
analytical thinking) rather than his classroom knowledge (such as reading or math) that help him
adapt to the varying conditions of climate or soil. 42
There are many tests that are designed specifically to measure cognitive skills but many are hard
to apply as part of a large household survey. Not only do these tests typically require a level of
standardization and quality control that goes beyond the usual training and supervision of
household survey enumerators, they can also be very time-consuming, might require a standardized
test-taking environment and/or specialized professional test administrators (such as licensed
psychologists), might have content that is inappropriate for developing country settings, or require
the use of test material that is unpractical in field circumstances. Moreover, any language-based
tests are likely to suffer from lack of comparability across countries – and often also within
countries - and lack of standardization upon translation. Existing short and non-language based
tests (often based on visual aids) that do not suffer from these limitations are sometimes used as
alternative for inclusion in household surveys.
With the objective of measuring different aspects of adult farmers’ cognitive ability, we selected
five different cognitive tests: i) The 36 item Raven Colored Progressive matrices; ii) The digit span
forwards and backwards; iii) A timed math test with 160 basic additions, subtractions and
multiplications; iv) An oral 9-item math questions tests containing short math puzzles and
increasing in level of difficulty; and v) A reading comprehension test. Table A1A provides a
detailed description for each of these tests.
Versions of the Raven and the digit span are very frequently used in surveys in developing countries
(de Mel, Mckenzie and Woodruff, 2009a, 2010; Beaman and Magruder, 2012; Dupas and
Robinson, 2013; Giné and Mansuri, 2014; Djankov et al., 2015); and the timed math tests has also
been used before (Barham, Macours, Maluccio, 2013). Jamison and Moock (1984) used numeracy
questions, literacy tests and raven tests. The specific math puzzles and the reading comprehension
42 A useful distinction can be between fluid intelligence (the ability to solve novel problems) and crystallized intelligence
(knowledge and developed skills) – Cattell (1987).

66
tests used in this paper were designed for the purpose of this experiment. The outcomes of these
test gives us an observed outcome of the farmers’ cognitive skills.
Noncognitive module
The choice of subscales was based on comparisons with the seminal papers in the literature on
noncognitive skills, complemented with scales used in the literature on small business development
in developing countries. 43 We also added measures used in the small but growing empirical
literature on aspirations and locus of control in developing countries.
For each of the scales, we selected a subset of items to be included in the final survey instrument
after piloting. We followed standard practices in psychology and broader insights from the
psychometric literature, regarding selection of questions, question type and mode of analysis. In
particular, questions of the different subscales as well as all 44 questions of the BFI were
incorporated in the pilot version of the questionnaire. During piloting, a relatively large set of
questions was identified with either very little variation (because everybody agreed with a certain
positive statement), or a bi-modal distribution, typically in the case of reverse-coded questions. In
extreme cases this led to negative correlations between variables that should capture the same latent
trait. Qualitative field observations allowed to interpret the underlying answering pattern, with
people either understanding the reverse question, in which case they often disagreed, or not
understanding the reverse question, in which case they reverted to agreeing, as a fallback. Hence
these distributions of the individual variables suggested a relatively high level of acquiescence bias
or “ya-saying” in the study population. Variables were eliminated if they showed very little
correlations with other variables belonging to the same construct, or showed very little variation.
For the Big Five personality traits, we use a version of the Big Five Inventory (BFI) written for a
population with 5 years of education. The BFI is a commonly used instrument for the Big Five
factor model, a higher module assumed to encompass the most generally important personality
traits (John, Donahue, and Kentle, 1991; John, Naumann and Soto, 2008). The BFI has been used
in the development economics literature by Dal Bo, Finan, and Rossi (2013); Callen et al. (2015).
The BFI instrument has 44 items, and all 44 items were included in the pilot version of the
instrument. After piloting, the number of BFI items was reduced to 23, keeping at least 3 questions
43 While most of these scales were originally designed for self-administration (i.e. respondents directly filling in answers),
in Kenya they were asked by the enumerators to the respondent, reflecting how they are typically used in large household
or individual surveys.

67
for each personality trait, and a balance between the positive and reverse-coded items. The 23 items
include the 10 items of the shorter BFI-10 scale (Rammstedt and John, 2007).
For Locus-of-Control we use a subset of the Levenson’s (1981) “Internality, Powerful Others and
Chance scales”. This scale is used, for instance, by Acharya et al. (2007) and Bernard et al (2014).
We also use a subset of items from the Attributions for Poverty scale (Feagin, 1972, 1975), similarly
used in Bernard et al (2014).
We also added a series of locus-of-control questions with visual aids. The respondent was asked to
allocate 10 beans between different answer options for three locus of control questions. The
questions followed the general concepts of standardized locus-of-control instruments, and the
visual aid aimed at increasing engagement and understanding of the respondents. For example a
question asked the respondent to allocate 10 beans to three possible reasons for why some
individuals have more economic success than others from: 1) Efforts and Decisions, 2) Luck, and
3) Birth.
The literature on the formation and predictive power of noncognitive skills in the US often uses
measures of both locus-of-control and self-esteem (Heckman, Stixrud and Urzua, 2006; Heckman
and Kautz, 2012; among many others). Following this literature, the questions of self-esteem used
come from the Rosenberg (1965) scale. In development economics, similar measures are used in
Blattman, Jamison and Sheridan (2016); Blattman and Dercon (2016); Adhvaryu, Kala and
Nyshadham (2016).
A number of additional subscales were included because of their frequent use in the literature on
small business development in developing countries. While this literature typically focuses on non-
agricultural businesses, it seems plausible that some of the same characteristics may affect success
in farming business. In particular, we followed studies analyzing what distinguishes entrepreneurs
from others in developing contexts that have used measures of optimism, attitudes towards change,
tenacity&organization, self-control, meta-cognitive activity, risk aversion and patience, similar to
the ones we test, in addition to the BFI, internal locus of control, and self-esteem (Krauss et al.
2005; De Mel et al. 2009b, 2010; Giné and Mansuri, 2014; Djankov et al., 2015). Some of these
subscales are conceptually closely related to one of the Big Five personality traits (with
tenacity&organization, for instance, related to conscientiousness).
Most items were asked using a Likert scale, following the original scales. A few items were
however changed to a binary scale, and some others we adapted to fit the agricultural context (see
details of items in Table A1.B).

68
Finally, the CESD was added as it is often used in studies in developing countries, including in
national representative panel surveys such as the Indonesian Family Life Survey and the Mexican
Family Life Survey. It is arguably related to the Neuroticism personality trait. It consists of a set of
20 questions asking about the respondents’ emotions in the last 7 days. As such it is more direct
and arguably less abstract than the Likert scale questions. One additional question was added to
capture perceptions of upward mobility using the same 7 day format.
Technical module
Technical skills and agricultural knowledge required for farming are likely to differ a lot from
context to context. For this reason rather than replicating specific questions from prior survey
instruments, we reviewed the literature to categorize existing approaches, and then designed a
questionnaire that uses similar categories, but with specific questions adapted to the study
population.
The majority of studies measuring technical knowledge do it with the intention of evaluating
learning from a training provided to farmers, for instance through Farmer Field Schools (Godtland
et al. 2004; Feder et al 2004; Maureci et al. 2007; David 2007; Buck and Alwang 2011).
Consequently, they tend to provide an assessment of the practices that are taught by the intervention
in order to track progresses in related knowledge. A few studies apply a broader technical
knowledge assessment, including Goldstein and Udry (1999), Hanna, Mullainathan, and
Schwartzstein (2014), Kondylis, Mueller and Zhu (2015) and the Ethiopia Rural Household
Surveys (ERHS) of 1999.
Based on a review of questionnaires used in those studies, one can classify questions based on form,
(i.e. how they evaluate technical skills), the technology or practices referred to when assessing
skills, and the type of knowledge asked about when assessing skills.
With regard to the form, knowledge tests with a series of multiple-choice or open-ended questions
are used in a number of studies, and the skill measures used in this paper are constructed from such
questions.44
When assessing skills, the technology or practices referred to have to be a function of the crops in
the region of study. Hence for a general knowledge tests, initial fieldwork and local knowledge is
44 A relatively large number of questionnaires also ask farmers to self-assess their level of knowledge. Alternatively,
farmers are sometimes asked what they actually do rather than what they know. The former is likely prone to subjectivity,
while the later measures the combination of many other constraints (budget, time, etc.) in addition to differences in
technical skills. Given these concerns, this study focuses agricultural knowledge tests.
69
important to first identify which crops, technologies and practices are most common in the region
and can best help distinguish farmers with best practices from less knowledgeable ones. The
particular crops, technologies and practices referred to in our survey instrument were based on
qualitative fieldwork prior to questionnaire design and knowledge of local agronomists.
The review of the literature further revealed a relatively large commonality regarding the types of
knowledge that is being assessed (even if it were applied to different crops and practices). For
example, questions often ask for mode of application, quantity and timing of inputs, all common
practical issues faced by farmers with important consequences for yield. The ability to recognize
deficiencies, pests etc. are also common. A potential challenge for such questions is that the optimal
practice may depend on a number of other factors, making it hard to evaluate whether the answer
provided by a farmer is “correct” or not. A different type of question asks for theoretical knowledge
such as, for instance, the type of nutrients included in certain fertilizers. These have the advantage
of having unambiguous correct answers, but one can wonder whether they capture the type of
practical knowledge that matters for productivity (in case farmers, for instance, know which
fertilizer to use and when, but do not know its composition). Whether such theoretical questions
are good predictors of practices and productivity is part of the questions of interest for this study.
Based on the categorizing of existing questions in the literature, we designed an instrument that
covered the different types of knowledge for the practices and technologies relevant in the region
of study. Extensive fieldwork in cooperation with local agronomists was required to design, test
and adapt the questions. As for the noncognitive module, only questions showing sufficient
variation in answers during piloting were kept. This led to exclusion of certain practices (such as
pest management or irrigation) as knowledge about them was extremely limited in the region.
Figure: Classification technical skills questions

70
Form of Evaluation
Test: Multiple choice or open
questions about best practices,
assessing whether the
respondent finds the right
answer.
Self-assessment: subjective
assessment or "do you know…"
What the farmer does: use of
practices or technology
Sources of information: training
received, extension, etc.
Technology or Practices
Seeds
Fertilizer (mineral / biofertilizer)
Herbicide, Pesticide or Integrated
Pest Management
Irrigation
Soil management practices:
- Manure, compost, use of stalk
- Rotation, intercropping
- Tillage
Planting practices (number of
seeds, spacing, gapping, etc.)
Storage / usage /
commercialization
Type of knowledge
How to apply an input:
- Where to apply it
- What quantity
- Timing of application
- Other decisions (spacing…)
Recognizing: pests, plant
deficiencies, better seeds… to
decide what inputs or practices to
apply.
How to use a complex practice
(composting, fertilizer mix...)
Theoretical knowledge (e.g. name
of nutrients in mineral fertilizer)
71
Appendix 2: Brief introduction to psychometrics concepts and methods used
Reliability
Reliability is the overall consistency of a measure. A measure is said to have a high reliability if it
produces similar results under similar conditions. A measure that is very noisy is a measure with
low reliability.
In classical theory, it is assumed that a person's observed or obtained score on a test is the sum of
a true score (T) and a Measurement Error (E):
𝑋 = 𝑇 + 𝐸
Hence the variance of X is given by:
𝜎𝑋2 = 𝜎𝑇
2 + 𝜎𝐸2
In this setting, reliability is the ratio of variability in item X due to variation of the true score T:
𝑅𝑒𝑙𝑖𝑎𝑏𝑖𝑙𝑖𝑡𝑦 =𝜎𝑇
2
𝜎𝑋2
It can thus be interpreted as the ratio of the variance of a given measure that is driven by the true
variance of the score across the population, or equivalently 1 minus the share of variance explained
by pure measurement error.
An estimation of the reliability can be obtained with the test-retest correlation (consistency across
time).
If measurement error is classical, the test-retest correlation gives a good indication of the signal to
total variance ratio. On the other hand, the test-retest correlation can under or over-state the signal
to total variance ratio in case of non-classical measurement error. If the errors in measurement are
positively correlated over time, for instance because both measures suffer from persistent
acquiescence bias, the test-retest correlation will overstate the reliability of the data.
The Cronbach’s alpha is also an indicator of reliability, and provides a measure of consistency
across items expected to measure the same latent construct. As such the Cronbach’s alpha is,
however, also an indicator of validity.
Validity
Test validity is the extent to which a test measures what it is supposed to measure.

72
Validity refers to the degree to which evidence and theory support the interpretations of test scores
entailed by proposed uses of tests.
Among the key indicators of validity are the following ones:
- Face validity assesses the extent to which a test is subjectively viewed as covering the
concept it purports to measure. For example a question about self-confidence should seem
to ask about self-confidence (hence a question with high correlation with related measures
but seemingly asking something very different cannot be considered valid)
- Content validity refers to the extent to which a measure represents all facets of a given
construct.
- Piloting experience and use of psychometric scales validated in other contexts
- Construct validity: Correlation with other measures intending to measure the same
construct
- Predictive validity: it should predict well related behaviors that are theoretically expected
to be correlated with the measure
A more detailed explanation of reliability and validity can be found in American Educational
Research Association et al. (1999).
Test-retest correlation
Test-retest correlation is the correlation between measures using the same instrument, measured
twice, on the same person, in similar conditions within a relatively short period of time. Temporal
stability provides an assessment of the reliability of a measure. Typically a similar test is applied
twice to the same population within a period short enough that that the traits that the researcher
intends to measure should not have changed, but long enough that respondents do not remember
their original responses. A standard period between test and retest goes from two weeks to one
month.
Under classical theory assumptions, the correlation between the test and the retest can be interpreted
as a direct measure of reliability as defined above (𝜎𝑇
2
𝜎𝑋2 ) hence the correlation can directly be
interpreted as the share of variance of the measure explained by the variance of the true score.

73
Crocker and Algina (2006) and Nunally, and Bernstein (1994) provide a broader explanation of
classical test theory and test-retest correlation.
Cronbach’s alpha
The Cronbach’s alpha (Chronbach 1951) is one of the most widely used measures of internal
consistency of a test.
Cronbach's alpha is mathematically equivalent to the expected value of the split-half reliability.
Split-half reliability is obtained by 1) randomly splitting the items into two sets of items of equal
size, 2) calculating the average of each set of items, and 3) calculating the correlations between
these two sets of items. Although not calculated this way, the Cronbach's alpha is equal to the
average of the correlations obtained through all the possible combinations of split-half reliability.
It provides an indicator of how well the items correlate among them (although it also increases with
the number of items).
Assume that we have a measure 𝑋 made of 𝑘 items: 𝑋 = 𝑌1 + 𝑌2 + ⋯ + 𝑌𝑘
Its Cronbach’s alpha is given by:
𝛼 =𝐾
𝐾 − 1(1 −
∑ 𝜎𝑌𝑖
2𝐾𝑖=1
𝜎𝑋2 )
Where 𝜎𝑌𝑖
2 is the variance of item 𝑖 and 𝜎𝑋2 is the variance of the measure 𝑋.
The Cronbach’s alpha provides an assessment of both the construct’s validity and its reliability. It
is said to provide a lower bound on the reliability of a test, because for the case where all items are
measuring exactly the same construct, the Cronbach’s alpha would only be affected by the
measurement error of each item and is a pure measure of reliability. When it is not the case, then
the Cronbach’s alpha is also affected by the extent to which items are measuring the same latent
construct. Hence a low Cronbach’s alpha indicates that either the items are measuring very different
latent constructs (the validity is poor since the items are usually pooled with the intention to
measure one latent construct) or they are measuring the same latent construct but with a lot of noise,
hence the reliability is low.
A Cronbach’s alpha of 0.9 tends to be required when individual decisions will be made based on a
specific test (for example student’s admissions, Nunnally and Bernstein, 1994; Kline, 2013), but
an alpha of .7 is often considered acceptable for the purpose of statistical analysis.
74
Exploratory Factor Analysis and deciding the number of factors
Here we provide a very brief description of four methods that we used and that are commonly used
to determine the number of factors to be retained. Valero-Mora (2007) provides a more detailed
explanation of the methods and their advantages and caveats.
1) Kaiser (1958)’s criterion only keeps factors with an eigenvalue higher than one;
2) Visual inspection of the Catell (1966) scree plot. Cattell's rule is such that the number of factors
should be equal to the number of eigenvalues before which the smooth decrease of eigenvalues
appears to level off on to the right of the plot;
3) Velicer (1976)’s Minimum Average Partial minimizes the unexplained partial correlation;
4) Horn(1965)’s Parallel Analysis keeps the factors as long as they explain more than the 95th
percentile of eigenvalues from randomly generated data (Cota, Longman, Holden, Fekken, &
Xinaris, 1993; Glorfeld, 1995).
Valero-Mora (2007) argues that the methods of Velicer and Horn are more reliable. Given that
different methods do not always lead to the same conclusions, we opted for the number of factors
most commonly suggested by the methods, putting more emphasis on the last two.
Item Response Theory
Item Response Theory offers a structural way of using a set of items to measure a latent ability or
trait. It is based on the idea that the probability of a correct/keyed response to an item is a
mathematical function of person and item parameters. For example, in the case of binary items, it
considers that the probability of getting the correct answer to each item is a logarithmic function of
the difficulty of the item and the latent ability of the respondent. IRT simultaneously estimates the
difficulty of each item and the ability of each respondent, such that it maximizes the likelihood of
the responses observed in the data.
IRT has become the standard tool for high stakes tests such as GRE or GMAT because it is believed
to provide a greater precision than Classical Test Theory.
IRT requires the following assumptions:
1) Uni-dimensionality; assessed through factor analysis;

75
2) Local independence (which is violated for timed tests, or for tests for which one question
affects answers to the following one(s);
3) Monotonicity (item characteristic curve well behaved – see below).
The graphs below represents the Item Characteristic Curve (ICC) which is the probability of getting
a correct answer to a given item, conditional on the respondent’s underlying ability. In the one
parameter model, also called Rasch Model, the difficulty of each item is the parameter estimated
(where b-value is 0 in the graph). The two-parameter model also estimates the discriminant, which
is the slope (a-value) at difficulty and can be interpreted as the effect of the underlying ability on
the respondent’s probability to answer the question correctly. The three-parameter model adds a
pseudo guessing parameter (c-value), which estimates the probability of a respondent with lowest
level of ability to obtain a correct answer.
Using these three parameters, the conditional probability of getting a correct answer to item 𝑖 for
an individual with underlying ability 𝜃is given by:
𝑃𝑖(𝜃) = 𝑐𝑖 + (1 − 𝑐𝑖) 𝑒𝐷𝑎𝑖(𝜃−𝑏𝑖)
1 + 𝑒𝐷𝑎𝑖(𝜃−𝑏𝑖)
The Graded Response Model applies a similar logic, with multiple difficulty parameters in order to
deal with ordered polytomous variables. More about GRM can be found in Van der Linden and
Hambleton (2013).

76
IRT also allows hybrid models that combine the different types of model.
For the technical skills we combine the Graded Response Model with the Two-Parameter Model.
We do so, because we have two types of questions. The vast majority of questions are multiple
choice questions where the respondent can choose only one possible answer. Based on this answer,
we created a binary variable for whether the answer was correct or not. In some questions, however,
it was possible to select multiple answers, in which case we created a count variable indicating the
number of correct answers, but penalizing for wrong answers selected.
In the cognitive sub-constructs, we used a hybrid of Three-Parameter Model and Two-Parameter
Model, because for some questions the guessing parameter was found to be zero (in which case
there is no gain from the three parameter model).
For a general introduction to IRT, see Hambleton and Swaminathan (2013).
Tucker's Congruence Coefficient
The Tucker’s congruence coefficient (or simply congruence coefficient) is an index that assesses
the similarity between factor structures of the same set of items applied to two different populations.
One first applies a factorial analysis to the two populations. In order to assess the similarity between
a factor 𝑥 and a factor 𝑦 , after applying factorial analysis to two different population, one
calculates the correlation coefficient (by item) of the two vectors of factor loadings.
𝜑(𝑥, 𝑦) = ∑ 𝑥𝑖𝑦𝑖𝑖,
√(∑ 𝑥𝑖2
𝑖 )(∑ 𝑦𝑖2
𝑖 )
Where 𝑥𝑖,𝑗 and 𝑦𝑖,𝑗 are the loadings of item 𝑖 on factor 𝑥 and 𝑦, respectively (each one extracted
from applying the factor analysis of the same items to a different population).
𝜑(𝑥, 𝑦) can be interpreted as a standardized measure of proportionality of elements in both vectors.
A coefficient that is equal to 1 corresponds to a perfectly identical factor structure between the two
population, while a coefficient equal to 0 corresponds to a factorial that is completely orthogonal.
For an order of magnitude, Lorenzo-Seva and Ten Berge (2006) indicate that a congruence
coefficient over .95 implies a good similarity, and a range of [.85 - .94] shows fair similarity.
More about Tucker’s congruence coefficient can be found in Abdi (2007).
Additional References from the appendices

77
Abdi, H., 2007. RV coefficient and congruence coefficient. Encyclopedia of measurement and
statistics, pp.849-853.
Acharya, V., A. Rajan, and A. Schoar, 2007. “What determines entrepreneurial success? A
psychometric study of rural entrepreneurs in India.” mimeo, London Business School,
IFMR, MIT.
American Educational Research Association, American Psychological Association, National
Council on Measurement in Education, Joint Committee on Standards for Educational and
Psychological Testing (US), 1999. Standards for educational and psychological testing.
Amer Educational Research Assn.
Barham, T., K. Macours, and J. A. Maluccio, 2013. “More schooling and More Learning? Effects
of a three-year conditional cash transfer program in Nicaragua after 10 years.” IDB
Working Paper Series No.IDB-WP-432.
Beaman, L. and J. Magruder, 2012. "Who Gets the Job Referral? Evidence from a Social Networks
Experiment." American Economic Review, 102(7): 3574-93.
Buck, S. and J. Alwang, 2011. “Agricultural extension, trust, and learning: results from economic
experiments in Ecuador.” Agricultural Economics, 42(6): 685-699.
Cattell, R.B., 1966. “The scree test for the number of factors.” Multivariate Behavioral Research
1: 629-637.
Cattell, R.B., 1987. Intelligence: Its Structure, Growth and Action. Amsterdam: North-Holland.
Cota, A.A., Longman, R.S., Holden, R.R., Fekken, G.C., & Xinaris, S., 1993. “Interpolating 95th
percentile eigenvalues from random data: An empirical example.” Educational &
Psychological Measurement, 53: 585-596.
Crocker, L. and Algina, J., 1986. Introduction to classical and modern test theory. Holt, Rinehart
and Winston, 6277 Sea Harbor Drive, Orlando, FL 32887.
Cronbach, L.J., 1951. Coefficient alpha and the internal structure of tests. Psychometrika, 16(3),
pp.297-334.
Cueto, S and J. Leon, 2012. “Psychometric Characteristics of Cognitive Development and
Achievement Instruments in Round 3 of Young Lives”, Young Lives technical note 25.
David, Soniia, 2007. "Learning to Think for Ourselves: Knowledge Improvement and Social
Benefits among Farmer Field School Participants in Cameroon", Journal of International
Agricultural and Extension Education, 14(2): 35-49

78
de Mel, S. D. McKenzie, C. Woodruff, 2010. "Who are the Microenterprise Owners? Evidence
from Sri Lanka on Tokman versus De Soto", in: Josh Lerner and Antoinette Schoar (eds.):
International Differences in Entrepreneurship, University of Chicago Press. Chicago.
de Mel, S., D. McKenzie and C. Woodruff, 2009a. "Are Women More Credit Constrained?
Experimental Evidence on Gender and Microenterprise Returns." American Economic
Journal: Applied Economics,1(3): 1-32.
De Mel, S., D. McKenzie, and C. Woodruff, 2009b. “Innovative firms or innovative owners?
Determinants of innovation in micro, small, and medium enterprises.” IZA Discussion
Paper No. 3962
Djankov, S., E. Miguel, Y. Qian, T. Roland, and E. Zhuravskaya, 2005. “Who are Russia's
entrepreneurs?” Journal of the European Economic Association, 3(2‐3): 587-597.
Dupas, P. and J. Robinson, 2013. “Savings Constraints and Microenterprise Development:
Evidence from a Field Experiment in Kenya” American Economic Journal: Applied
Economics 2013, 5(1): 163–192
Feagin, J. R., 1972. “Poverty: We Still Believe That God Helps Those Who Help Themselves.”
Psychology Today 1, 101–29.
Feagin, J. R., 1975. Subordinating the Poor: Welfare and American Beliefs. Englewood Cliffs, NJ:
Prentice Hall
Feder, G., R. Murgai, and J.B. Quizon, 2004. “The acquisition and diffusion of knowledge: The
case of pest management training in farmer field schools, Indonesia.” Journal of
agricultural economics, 55(2): 221-243.
Giné, X. and G. Mansuri, 2014. “Money or ideas? A field experiment on constraints to
entrepreneurship in rural Pakistan.” World Bank Policy Research Working Paper 6959,
World Bank, Washington DC.
Glorfeld, L.W., 1995. “An improvement on Horn’s parallel analysis methodology for selecting the
correct number of factors to retain.” Educational and Psychological Measurement, 55:
377-393.
Godtland, E.M., Sadoulet, E., De Janvry, A., Murgai, R. and Ortiz, O., 2004. “The impact of farmer
field schools on knowledge and productivity: A study of potato farmers in the Peruvian
Andes.” Economic Development and Cultural Change, 53(1): 63-92.
79
Goldstein, M. and C. Udry, 1999. “Agricultural innovation and resource management in Ghana.”
Final Report to IFPRI under MP17, Mimeo. Yale University.
Hambleton, R.K. and Swaminathan, H., 2013. Item response theory: Principles and applications.
Springer Science & Business Media.
Hanna, R., S. Mullainathan, and J. Schwartzstein, 2014. “Learning through noticing: theory and
experimental evidence in farming”, Quarterly Journal of Economics, 1311–1353.
Horn, J. L., 1965. “A rationale and test for the number of factors in factor analysis.” Psychometrika,
30: 179-185.
Jamison, D.T. and P.R. Moock, 1984. “Farmer education and farm efficiency in Nepal: The role of
schooling, extension services, and cognitive skills.” World Development, 12(1): 67-86.
John, O.P., E.M. Donahue, R.L. Kentle, 1991. The Big Five Inventory – Versions 4a and 54.
Berkeley CA: University of California, Berkeley, Institute of Personality and Social
Research.
Kaiser, H., 1960. “The application of electronic computers to factor analysis.” Educational and
Psychological Measurement 20: 141-151.
Kaiser, H.F., 1958. The varimax criterion for analytic rotation in factor analysis. Psychometrika,
23(3), pp.187-200.
Kline, P., 2013. Handbook of psychological testing. Routledge.
Kondylis, F., V. Mueller, and S. Zhu, 2015. “Measuring agricultural knowledge and
adoption.” Agricultural Economics, 46(3): 449-462.
Krauss, S.I., M. Frese, C. Friedrich, and J.M. Unger, 2005. “Entrepreneurial orientation: A
psychological model of success among southern African small business owners.: European
Journal of Work and Organizational Psychology, 14(3): 315-344.
Levenson, H., 1981. “Differentiating among Internality, Powerful Others, and Chance.” In H. M.
Lefcourt (Ed.), Research with the Locus of Control Construct, pp. 15–63. New York:
Academic Press.
Lockheed, M. E., T. Jamison, and L.J. Lau, 1980. “Farmer Education and Farm Efficiency: A
Survey.” Economic Development and Cultural Change, 29 (1): 37-76.
Lorenzo-Seva, U. and Ten Berge, J.M., 2006. Tucker's congruence coefficient as a meaningful
index of factor similarity. Methodology, 2(2), pp.57-64.

80
Mauceri, M., J. Alwang, G. Norton, and V. Barrera, 2007. “Effectiveness of integrated pest
management dissemination techniques: a case study of potato farmers in Carchi, Ecuador.”
Journal of Agricultural and Applied Economics, 39(03): 765-780.
Nunnally, J.C. and Bernstein, I.H., 1994. Psychometric theory (3rd ed) New York: McGraw-Hill.
Phillips, J.M., 1994. “Farmer Education and Farmer Efficiency.” Economic Development and
Cultural Change, Vol. 43(1): 149-166.
Rammsted, B. and O.P. John, 2007. “Measuring personality in one minute or less: A 10-item short
version of the Big Five Inventory in English and German.” Journal of Research in
Personality, 41: 203– 212
Rauch, A. and M. Frese, 2000. “Psychological approaches to entrepreneurial success: A general
model and an overview of findings.” International review of industrial and organizational
psychology, 15: 101-142.
Rosenberg, M., 1965. Society and the Adolescent Self-Image. Princeton, NJ: Princeton University
Press.
Van der Linden, W.J. and Hambleton, R.K. eds., 2013. Handbook of modern item response theory.
Springer Science & Business Media.