measuring principals’ effectiveness: results from new ... · jersey’s principal evaluation...
TRANSCRIPT

U . S . D e p a r t m e n t o f E d u c a t i o n
August 2016
Making Connections
Measuring principals’ effectiveness: Results from New Jersey’s first year
of statewide principal evaluation
Mariesa Herrmann Christine Ross
Mathematica Policy Research
Overview
This report describes the component measures used to evaluate principals during the first year of statewide implementation of New Jersey’s principal evaluation system. It examines four statistical properties of the system’s component measures, which are intended to fairly and accurately differentiate between effective and ineffective principals: the variation in overall and component measure ratings across principals, the year-to-year stability of overall and component measure ratings, the correlations between component measure ratings and characteristics of students in the schools, and the correlations among component measure ratings. Information about these properties of the measures can inform efforts to improve the principal evaluation system and revise the guidance districts receive.
At ICF International
U.S. Department of Education John B. King, Jr., Secretary
Institute of Education Sciences Ruth Neild, Deputy Director for Policy and Research Delegated Duties of the Director
National Center for Education Evaluation and Regional Assistance Joy Lesnick, Acting Commissioner Amy Johnson, Action Editor Felicia Sanders, Project Officer
REL 2016–156
The National Center for Education Evaluation and Regional Assistance (NCEE) conducts unbiased large-scale evaluations of education programs and practices supported by federal funds; provides research-based technical assistance to educators and policymakers; and supports the synthesis and the widespread dissemination of the results of research and evaluation throughout the United States.
August 2016
This report was prepared for the Institute of Education Sciences (IES) under Contract ED-IES-12-C-0006 by Regional Educational Laboratory Mid-Atlantic administered by ICF International. The content of the publication does not necessarily reflect the views or policies of IES or the U.S. Department of Education, nor does mention of trade names, commercial products, or organizations imply endorsement by the U.S. Government.
This REL report is in the public domain. While permission to reprint this publication is not necessary, it should be cited as:
Herrmann, M., & Ross, C. (2016). Measuring principals’ effectiveness: Results from New Jersey’s first year of statewide principal evaluation (REL 2016–156). Washington, DC: U.S. Department of Education, Institute of Education Sciences, National Center for Education Evaluation and Regional Assistance, Regional Educational Laboratory Mid-Atlantic. Retrieved from http://ies.ed.gov/ncee/edlabs.
This report is available on the Regional Educational Laboratory website at http://ies.ed.gov/ ncee/edlabs.

Summary
States and districts across the country are implementing new principal evaluation systems that include measures of the quality of principals’ school leadership practices and measures of student achievement growth. Because these evaluation systems will be used for high-stakes decisions, it is important that the component measures of the evaluation systems fairly and accurately differentiate between effective and ineffective principals. This requires the measures to be reliable (consistent across raters and observations) and valid (accurately measuring true principal performance).
New Jersey has implemented a new principal evaluation system to improve principal effectiveness, beginning with a pilot in 2012/13 in 14 school districts and statewide implementation in 2013/14. In 2013/14 half of a principal’s overall rating was composed of two measures of practice—a principal practice instrument selected or developed by each school district and an evaluation leadership instrument developed by the New Jersey Department of Education—and half was composed of measures of student achievement. One measure of student achievement—a rating based on the school’s median student growth percentile, a measure of student achievement growth on state assessments in math and English language arts—is available only for schools with grades 4–8. Two other measures of student achievement—a rating based on attainment of principal goals for student achievement and the average of teachers’ student growth objective ratings (measuring teachers’ success in achieving their student growth objectives)—are available for all principals.
This study examined data from 2013/14, the first year of statewide implementation. It examined four statistical properties of the system’s component measures: the variation in overall and component measure ratings across principals, the year-to-year stability of overall and component measure ratings, the correlations between component measure ratings and characteristics of students in the schools, and the correlations among component measure ratings. Information about these properties of the measures can inform efforts to improve the principal evaluation system and revise the guidance districts receive.
Key findings: • Nearly all principals received effective or highly effective overall ratings. Variation in
the overall ratings was limited, with 99 percent of principals rated as effective or highly effective.
• The percentage of principals who received highly effective overall ratings was lower for principals who were evaluated on school median student growth percentiles than for principals who were not evaluated on this measure. When school median student growth percentiles were not available, principal goals factored more heavily into the overall rating, and most principals received higher ratings on principal goals than on school median student growth percentiles.
• Principal practice instrument ratings and school median student growth percentiles had moderate to high year-to-year stability. But school median student growth percentiles changed more across years in smaller schools than in larger ones.
• Several component measure ratings—school median student growth percentile ratings, teachers’ student growth objective ratings, and principal practice instrument ratings—as well as the overall rating, had low, negative correlations with student socioeconomic disadvantage. This suggests that these ratings are biased against principals of schools
i

with more disadvantaged students or that less effective principals are serving schools with more disadvantaged students.
• Principals’ ratings on component measures had low to moderate positive correlations with each other. This suggests that the components measure distinct dimensions of overall principal performance.
ii

Contents
Summary i
Why this study? 1
What the study examined 2
What the study found 6 Variation in ratings on the component measures and in overall ratings 6 Changes in principal practice instrument ratings and school median student growth
percentiles across years 10 Correlations between ratings and student characteristics 16 Correlations among ratings 17
Implications of the study findings 18 Additional guidance or alternate measures could help principals and teachers set more
challenging goals 18 Overall ratings that include school median student growth percentiles could account for
Negative correlations between school median student growth percentiles and percentage of differences in school size in several ways 19
economically disadvantaged students warrant future research 19
Limitations of the study 20
Appendix A. Description of districts participating in the 2012/13 pilot A-1
Appendix B. Design of principal evaluation system B-1
Appendix C. Data used in the study C-1
Appendix D. Variation in ratings on the component measures D-1
Appendix E. Changes in the principal practice instrument and school median student growth percentiles and their associated ratings across years E-1
Appendix F. Correlations of component measure ratings with student background characteristics for assistant principals F-1
Appendix G. Correlations among component measure ratings for assistant principals G-1
Notes Notes-1
References Ref-1
Boxes 1 Component measures of New Jersey’s principal evaluation system in 2013/14 3 2 Data and methods 5 B1 New Jersey Department of Education criteria for principal practice instruments B-1 B2 Example of guidance for setting principal goals for student achievement B-3
iii

Figures 1 Few principals were rated highly effective on school median student growth percentiles,
and most were rated highly effective on teachers’ student growth objectives, 2013/14 7 2 Fewer principals evaluated on school median student growth percentiles received highly
effective overall ratings than principals not evaluated on this component, 2013/14 10 3 Simulated overall ratings that replaced ratings for school median student growth
percentiles with those for principal goals for student achievement gave principals more highly effective and ineffective or partially effective ratings and fewer effective ratings, 2013/14 11
4 Large changes in school median student growth percentiles between the first and second year did not completely persist in the third year, 2011/12–2013/14 14
5 School median student growth percentiles were less stable for smaller schools than for larger schools between 2012/13 and 2013/14 15
B1 Principal practice instruments selected by districts statewide for use in 2013/14 were similar to those selected by pilot districts for use in 2012/13 B-2
B2 The formula that transforms school median student growth percentiles into school median student growth percentile ratings distinguishes educators above and below the middle range more than those in the middle B-5
D1 Among the full sample of principals who received ratings, at least 88 percent were rated effective or highly effective on each component, 2013/14 D-1
D2 Principal practice instrument ratings differed across instruments, 2013/14 D-2 D3 More assistant principals were rated highly effective on principal goals for student
achievement and teachers’ student growth objectives than on the principal practice or evaluation leadership instruments, 2013/14 D-3
D4 Assistant principals received overall ratings similar to those of principals, 2013/14 D-4 E1 Principal practice instrument ratings were moderately to highly stable, 2012/13–2013/14 E-1 E2 School median student growth percentiles were moderately stable, 2012/13–2013/14 E-2 E3 Mean reversion in school median student growth percentiles was greater for smaller
schools than for larger schools, 2011/12–2013/14 E-3
Tables 1 Principal practice instrument ratings, 2012/13 and 2013/14 (percent) 12 2 School median student growth percentile ratings, 2012/13 and 2013/14 (percent) 13 3 Principals leading schools with larger proportions of economically disadvantaged
students tended to receive lower ratings than other principals in 2013/14 16 4 Correlations among principal evaluation component measure ratings, 2013/14 17 A1 Student background characteristics of New Jersey districts that participated in the
principal evaluation pilot, 2013/14 A-1 B1 Evaluation leadership instrument components B-3 C1 Number of school leaders with evaluation component measure ratings, 2013/14 C-2 C2 Student background characteristics of schools where leaders had evaluation
ratings, 2013/14 C-3 C3 Number of principals who remained in the same school and had evaluation ratings
both years, 2012/13 and 2013/14 C-4 C4 Student background characteristics of schools with principals with various evaluation
component measure ratings, 2013/14 C-4 F1 Correlations of assistant principals’ component measure ratings with the schoolwide
percentages of economically disadvantaged and English learner students, 2013/14 F-1 G1 Correlations of component measures for assistant principals, 2013/14 G-1
iv

Why this study?
States and districts across the country are implementing new principal evaluation systems that include measures of the quality of principals’ school leadership practices and measures of student achievement growth. These evaluation systems will be used to inform career decisions such as tenure, hiring, and compensation and to direct professional development. Since 2012, 43 states and the District of Columbia have committed to implementing such principal evaluation systems as part of the U.S. Department of Education’s grant of flexibility related to provisions of the Elementary and Secondary Education Act. Federal grant programs, such as Race to the Top, School Improvement Grants, and the Teacher Incentive Fund, also support the development of new principal evaluation systems.
States and districts implementing new principal evaluation systems must select or develop the component measures of their system. Because the systems will be used for high-stakes decisions, it is important that the measures fairly and accurately differentiate between effective and ineffective principals. This requires that the measures be reliable (consistent across raters and observations) and valid (accurately measuring true principal performance). But the research base on the reliability and validity of principal evaluation measures is thin compared with research on teacher evaluation measures. A review of principal practice instruments found that only 2 of 65 instruments documented reliability or validity (Goldring et al., 2009), whereas recent studies documented the reliability and validity of 4 widely used teacher practice instruments (Kane & Staiger, 2012; Kane, McCaffrey, Miller, & Staiger, 2013).
As part of efforts to improve the effectiveness of educators statewide, New Jersey has implemented a new principal evaluation system, beginning with a pilot in 2012/13 in 14 school districts (see appendix A for a description of the participating districts). The new evaluation system combined measures of principal practice and measures of student achievement. One measure of student achievement is a rating based on the school’s median student growth percentile, a measure of student achievement growth based on state assessments in math and English language arts that is available only for schools with grades 4–8. In its request for grant proposals from districts to pilot the new principal evaluation system, New Jersey cited four goals: help districts systematically and accurately gauge the effectiveness of principals, improve principals’ effectiveness by clarifying performance expectations, support districts in creating schoolwide and systemwide collaborative cultures, and enable districts to improve personnel decisions concerning school leadership (New Jersey Department of Education, 2012b).
The pilot produced information about implementation challenges that was used to modify the system’s design and revise its guidance before the statewide rollout in 2013/14. In addition, the New Jersey Department of Education, as a member of Regional Educational Laboratory (REL) Mid-Atlantic’s Principal Evaluation Research Alliance, partnered with REL Mid-Atlantic to develop the study’s research questions and examine evaluation data from the pilot and statewide implementation. Findings from the pilot year (Ross, Herrmann, & Angus, 2015) included:
• The developers of the principal practice instruments that the pilot districts used provided partial information about the instruments’ reliability and validity.
• Principals differed in their practice ratings and school median student growth percentile ratings, with at least two-thirds rated as effective or highly effective on each measure.
As part of efforts to improve the effectiveness of educators statewide, New Jersey has implemented a new principal evaluation system that combines measures of principal practice and measures of student achievement
1
• School median student growth percentiles were less stable from year to year and may be less reliable for smaller schools than larger schools.
• School median student growth percentiles exhibited year-to-year stability even when the school changed principals and correlated with student disadvantage, suggesting a need to investigate whether other measures could more closely gauge principals’ contributions to student achievement growth.
This study seeks to re-examine and expand on these findings using data from 2013/14, the first year of statewide implementation.
What the study examined
This study examined four statistical properties of the component measures used for principal evaluation in the first statewide year of implementation: the variation in overall and component measure ratings across principals, the year-to-year stability of overall and component measure ratings, the correlations between component measure ratings and characteristics of students in the schools, and the correlations among component measure ratings.
In the 2013/14 evaluations all New Jersey principals were rated on four component measures: two measures of principal practice (a principal practice instrument and an evaluation leadership instrument) and two measures of student achievement (principal goals for school achievement and teachers’ student growth objective average; box 1). Principals of schools with grades 4–8 were also measured on a third student achievement measure— school median student growth percentiles.
Information about the properties of the measures can inform efforts to improve the principal evaluation system and revise the guidance districts receive.
The study examined four research questions, one descriptive and three correlational:
1. To what extent did overall and component measure ratings vary across principals?
2. How stable were overall and component measure ratings for principals in the same school from one year to the next?
3. What were the correlations between ratings and the schoolwide proportion of students from disadvantaged backgrounds?
4. What were the correlations among component measure ratings?
Data sources and methods are described in box 2. The study focused on principals rather than assistant principals because principals and assistant principals have different job responsibilities (see appendix B for a discussion of the components used to evaluate assistant principals, appendix C for data sources, and appendixes D, F, and G for findings for assistant principals).
The variation in ratings across principals indicates whether the measures have the potential to differentiate between highly effective and ineffective principals. Principals vary
This study examined four statistical properties of the component measures used for principal evaluation in the first statewide year of implementation: the variation in overall and component measure ratings across principals, the year-to-year stability of overall and component measure ratings, the correlations between component measure ratings and characteristics of students in the schools, and the correlations among component measure ratings
2

’
in their effectiveness at increasing student achievement (Branch, Hanushek, & Rivkin, 2012; Chiang, Lipscomb, & Gill, 2016; Coelli & Green, 2012; Dhuey & Smith, 2012, 2014). Thus, if these component measures of the principal evaluation system are expected to gauge principals’ effectiveness at raising student achievement, their ratings would also be expected to differ across principals.
A good measure of principal performance should be reliable—that is, it should not show large random variation. The year-to-year stability of principal practice instrument ratings, school median student growth percentiles, and school median student growth percentile ratings is one way to shed light on the reliability of these components as measures of principal performance.1 Although principal ratings may change across years due to real changes in principal performance, substantial improvements and declines could indicate large random variation. Two other analyses provide information about the reliability of school median student growth percentiles: the relationship between school size and yearto-year changes in school median student growth percentiles and the pattern of changes in school median student growth percentiles over three years. Random variation could cause substantially more year-to-year variation in smaller schools than in larger ones and could lead improvements in one year to be reversed in the next.
Box 1. Component measures of New Jersey’s principal evaluation system in 2013/14
Districts used two component measures of principal practice and three component measures
of student achievement during 2013/14. Each measure yielded a rating on a 1–4 scale. The
component measures were combined into an overall rating on a 1–4 scale (corresponding to
performance categories of ineffective, partially effective, effective, or highly effective). Weights
on the component measures in the overall rating varied based on the number of grades in the
school with data on student growth percentiles.
Weights on component measures in the overall rating (percentages of the overall rating)
The year-toyear stability of principal practice instrument ratings, school median student growth percentiles, and school median student growth percentile ratings is one way to shed light on the reliability of these components as measures of principal performance
Type of school
Principal practice
instrument Evaluation leadership
Teachers student growth
objectives
Principal goals for student
achievement
School median student growth
percentiles
Multiple grades had student growth percentiles 30 20 10 10 30
Single grade had student growth percentiles 30 20 10 20 20
No grades had student growth percentiles 30 20 10 40 0
Source: New Jersey Department of Education, 2014a.
Measures of principal practice
Principal practice instrument (30 percent of the overall rating). Districts were asked to select
or develop a research-based or evidence-supported principal practice instrument that mea
sures domains of practice aligned to the principal practice standards developed by the Inter
state School Leadership Licensure Consortium (Council of Chief State School Officers, 2008).
(continued)
3
’
Box 1. Component measures of New Jersey’s principal evaluation system in 2013/14 (continued)
Evaluation leadership instrument (20 percent of the overall rating). Districts used a state-de
veloped instrument to rate principals’ effectiveness in evaluating teaching staff.
Measures of student achievement
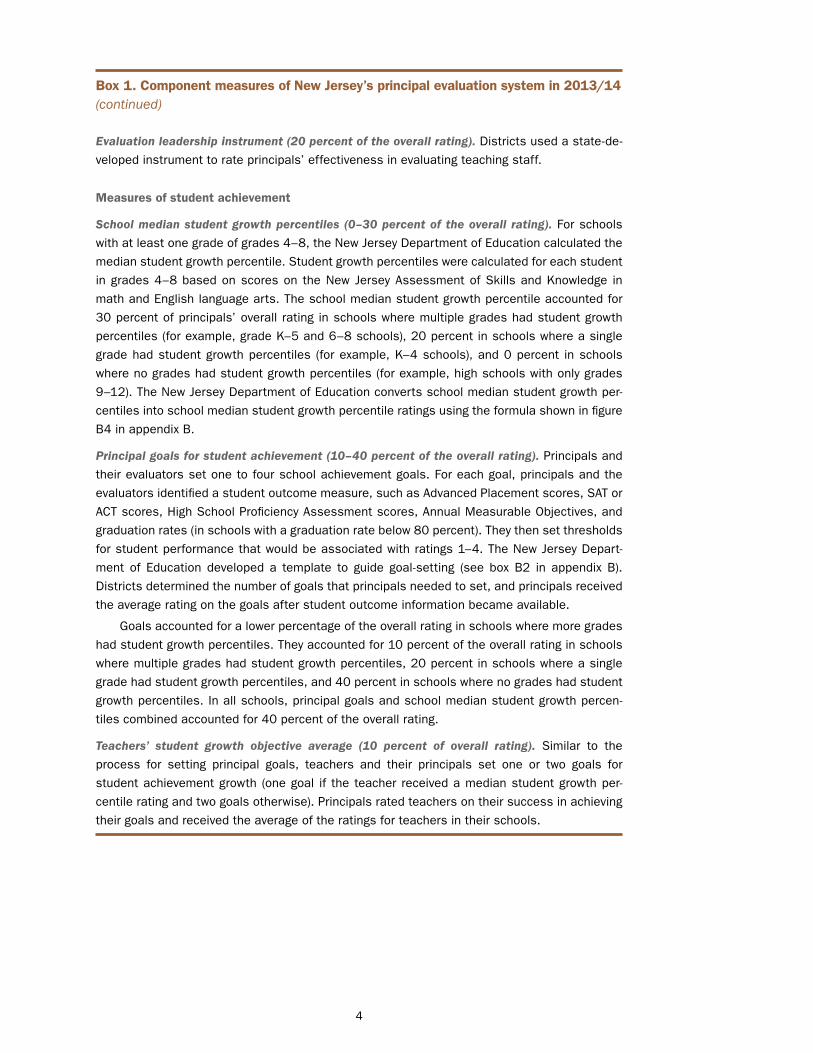
School median student growth percentiles (0–30 percent of the overall rating). For schools
with at least one grade of grades 4–8, the New Jersey Department of Education calculated the
median student growth percentile. Student growth percentiles were calculated for each student
in grades 4–8 based on scores on the New Jersey Assessment of Skills and Knowledge in
math and English language arts. The school median student growth percentile accounted for
30 percent of principals’ overall rating in schools where multiple grades had student growth
percentiles (for example, grade K–5 and 6–8 schools), 20 percent in schools where a single
grade had student growth percentiles (for example, K–4 schools), and 0 percent in schools
where no grades had student growth percentiles (for example, high schools with only grades
9–12). The New Jersey Department of Education converts school median student growth per
centiles into school median student growth percentile ratings using the formula shown in figure
B4 in appendix B.
Principal goals for student achievement (10–40 percent of the overall rating). Principals and
their evaluators set one to four school achievement goals. For each goal, principals and the
evaluators identified a student outcome measure, such as Advanced Placement scores, SAT or
ACT scores, High School Proficiency Assessment scores, Annual Measurable Objectives, and
graduation rates (in schools with a graduation rate below 80 percent). They then set thresholds
for student performance that would be associated with ratings 1–4. The New Jersey Depart
ment of Education developed a template to guide goal-setting (see box B2 in appendix B).
Districts determined the number of goals that principals needed to set, and principals received
the average rating on the goals after student outcome information became available.
Goals accounted for a lower percentage of the overall rating in schools where more grades
had student growth percentiles. They accounted for 10 percent of the overall rating in schools
where multiple grades had student growth percentiles, 20 percent in schools where a single
grade had student growth percentiles, and 40 percent in schools where no grades had student
growth percentiles. In all schools, principal goals and school median student growth percen
tiles combined accounted for 40 percent of the overall rating.
Teachers’ student growth objective average (10 percent of overall rating). Similar to the
process for setting principal goals, teachers and their principals set one or two goals for
student achievement growth (one goal if the teacher received a median student growth per
centile rating and two goals otherwise). Principals rated teachers on their success in achieving
their goals and received the average of the ratings for teachers in their schools.
4
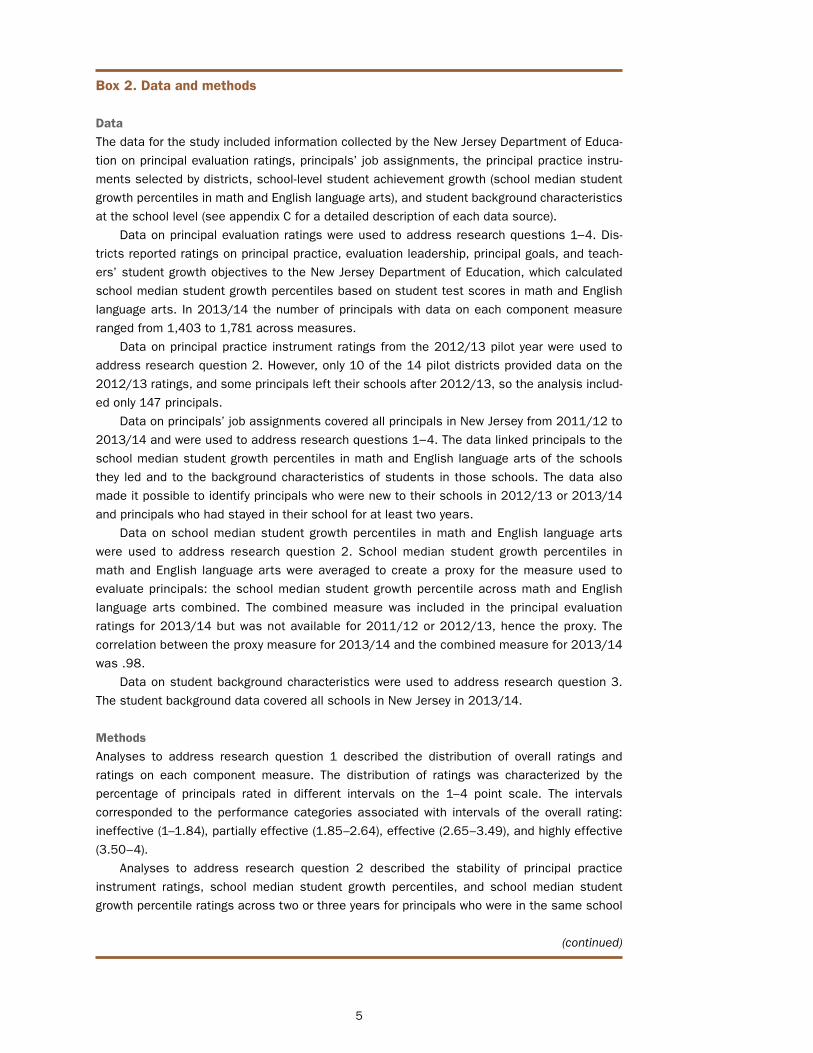
Box 2. Data and methods
Data The data for the study included information collected by the New Jersey Department of Educa
tion on principal evaluation ratings, principals’ job assignments, the principal practice instru
ments selected by districts, school-level student achievement growth (school median student
growth percentiles in math and English language arts), and student background characteristics
at the school level (see appendix C for a detailed description of each data source).
Data on principal evaluation ratings were used to address research questions 1−4. Dis
tricts reported ratings on principal practice, evaluation leadership, principal goals, and teach
ers’ student growth objectives to the New Jersey Department of Education, which calculated
school median student growth percentiles based on student test scores in math and English
language arts. In 2013/14 the number of principals with data on each component measure
ranged from 1,403 to 1,781 across measures.
Data on principal practice instrument ratings from the 2012/13 pilot year were used to
address research question 2. However, only 10 of the 14 pilot districts provided data on the
2012/13 ratings, and some principals left their schools after 2012/13, so the analysis includ
ed only 147 principals.
Data on principals’ job assignments covered all principals in New Jersey from 2011/12 to
2013/14 and were used to address research questions 1−4. The data linked principals to the
school median student growth percentiles in math and English language arts of the schools
they led and to the background characteristics of students in those schools. The data also
made it possible to identify principals who were new to their schools in 2012/13 or 2013/14
and principals who had stayed in their school for at least two years.
Data on school median student growth percentiles in math and English language arts
were used to address research question 2. School median student growth percentiles in
math and English language arts were averaged to create a proxy for the measure used to
evaluate principals: the school median student growth percentile across math and English
language arts combined. The combined measure was included in the principal evaluation
ratings for 2013/14 but was not available for 2011/12 or 2012/13, hence the proxy. The
correlation between the proxy measure for 2013/14 and the combined measure for 2013/14
was .98.
Data on student background characteristics were used to address research question 3.
The student background data covered all schools in New Jersey in 2013/14.
Methods Analyses to address research question 1 described the distribution of overall ratings and
ratings on each component measure. The distribution of ratings was characterized by the
percentage of principals rated in different intervals on the 1–4 point scale. The intervals
corresponded to the performance categories associated with intervals of the overall rating:
ineffective (1–1.84), partially effective (1.85–2.64), effective (2.65–3.49), and highly effective
(3.50–4).
Analyses to address research question 2 described the stability of principal practice
instrument ratings, school median student growth percentiles, and school median student
growth percentile ratings across two or three years for principals who were in the same school
(continued)
5
Box 2. Data and methods (continued)
for those years and for whom the measures were available. Stability was measured using a
Pearson correlation coefficient.
Analyses to address research question 3 examined the relationship between principal
evaluation ratings and two measures of student disadvantage: the percentages of economi
cally disadvantaged students and English learner students in the school. These relationships
were measured using a Pearson correlation coefficient.
Analyses to address research question 4 examined the relationships among the com
ponent measure ratings. These relationships were measured using a Pearson correlation
coefficient.
A good measure of principal performance should also be valid—that is, it should be an accurate measure of the performance of the principal, distinguishing principal-specific factors from the factors of school performance that are outside the principal’s control, such as characteristics of the student population. The correlations between the principal ratings on the component measures and school measures of student disadvantage are of interest because they could provide information about bias in the component measures or the distribution of effective principals among schools in New Jersey. Negative correlations between principal ratings and measures of student disadvantage might suggest that the ratings are biased against principals of schools with more disadvantaged students. This could occur if, for example, evaluators’ judgments about the principal were influenced by student achievement levels, which in turn are related to levels of student disadvantage. But negative correlations between component measure ratings and measures of student disadvantage do not necessarily imply bias; less effective principals might actually be serving schools with more disadvantaged students. Although neither of these explanations can be confirmed without more data, the existence of such correlations would highlight the need for further research.
The principal evaluation system produces a summary measure that assumes there is a meaningful underlying construct of principal performance. If this is true, the component measures of the principal evaluation system should be related to one another (though not perfectly related). The correlations among the principal evaluation ratings provide information about whether the components measure different aspects of a common underlying construct. Principals who are truly high performing should be more likely to receive high ratings on all components. Thus, low correlations among the component measure ratings might imply that one or more components do not accurately measure principal performance, either because their measures are weak or because the evaluation system is poorly implemented.
What the study found
This section details the findings related to the study’s four research questions.
Variation in ratings on the component measures and in overall ratings
Variation in the principal evaluation component measures and overall ratings can shed light on whether these measures can differentiate between highly effective and ineffective
The correlations among the principal evaluation ratings provide information about whether the components measure different aspects of a common underlying construct. Principals who are truly high performing should be more likely to receive high ratings on all components
6
principals. Since the overall rating is built up from the ratings on each component measure, the distribution of ratings for each component measure was examined. Because the overall ratings are used to classify principals into performance categories—ineffective, partially effective, effective, and highly effective—the study team also used these categories for each component measure. If nearly all principals are classified at the same effectiveness level, a component measure may be unable to distinguish among principals with true differences in effectiveness. While the study team used the performance categories to describe the distribution of component measure ratings, the New Jersey Department of Education classifies principals into performance categories based solely on their overall ratings, not on the component measure ratings.
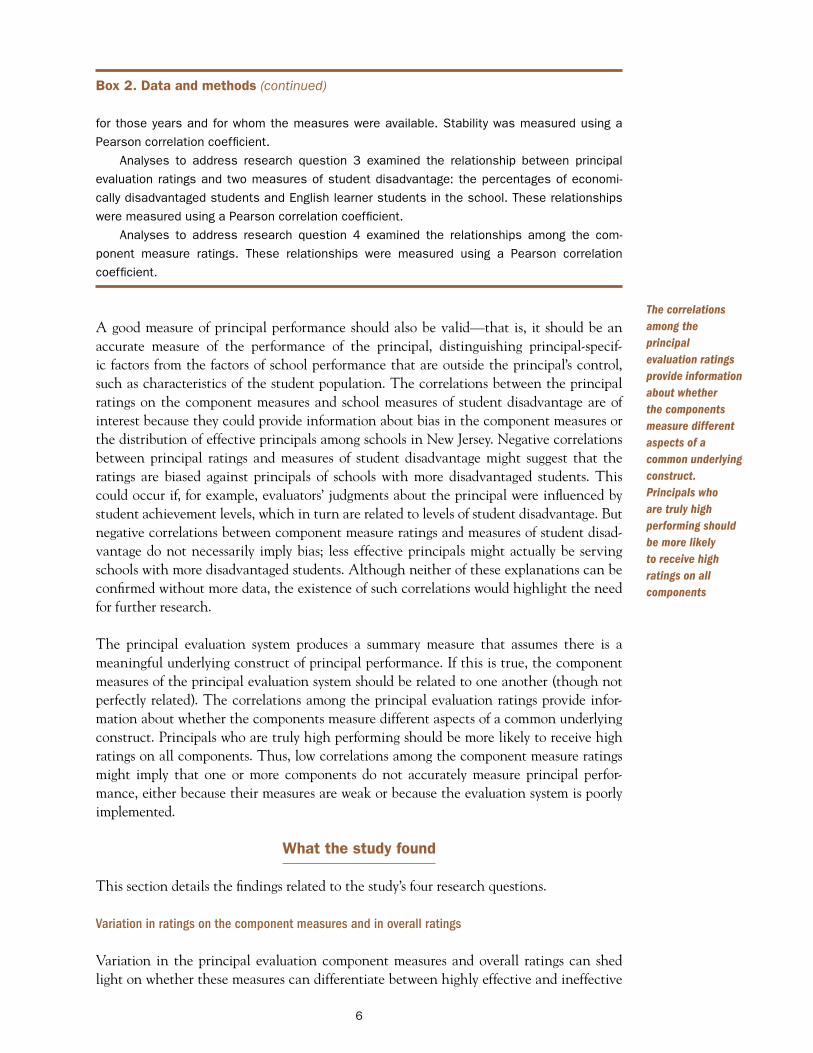
Variation in ratings on the component measures was limited, with nearly all principals receiving ratings of effective or highly effective. Among principals with ratings on all five component measures, more than 92 percent were rated effective or highly effective on each component, and for three components, more than 95 percent of principals were rated effective or highly effective (figure 1). No more than 1 percent of principals were rated ineffective on any component. (The ineffective and partially effective ratings were combined because for some components the number of principals with an ineffective rating was suppressed to protect confidentiality.) The analysis focused on principals with ratings on all components to facilitate comparisons across components, but findings were
Figure 1. Few principals were rated highly effective on school median student growth percentiles, and most were rated highly effective on teachers’ student growth objectives, 2013/14
Ineffective (1–1.84) or partially effective (1.85–2.64) Effective (2.65–3.49)
Percent of principals Highly effective (3.50–4)
100
75
50
25
0 School median student growth
Principal practice
Evaluation leadership
Principal goals
Teachers’ student growth
percentile instrument objectives
Components
Note: There are 1,183 principals in 1,177 schools statewide with all five ratings. Ineffective and partially effective ratings are combined because for some components the number of principals with an ineffective rating is suppressed to protect confidentiality. Differences in the percentage of principals who were rated highly effective across all pairs of components were statistically significant based on a two-tailed test with a significance level of .05. Differences in the percentage of principals who were rated ineffective or partially effective across all pairs of components were statistically significant.
Source: Authors’ calculations based on data from the New Jersey Department of Education, as described in appendix C.
Among principals with ratings on all five component measures, more than 92 percent were rated effective or highly effective on each component, and for three components, more than 95 percent of principals were rated effective or highly effective
7

similar for the full sample of principals and assistant principals (see appendix B for more information about the component measures and appendix D for more information on variation in component measures, including for the full sample of principals and for assistant principals).
The percentage of principals rated highly effective differed substantially across components, with highly effective ratings least common on the school median student growth percentile measure and most common on the teachers’ student growth objectives measure. The differences across components in the percentages of principals rated highly effective were large and statistically significant (see figure 1). Among principals with ratings on all component measures, only 8 percent were rated highly effective on school median student growth percentiles, but ratings were much higher on the two component measures that allowed educators to set their own goals: 69 percent of principals were rated highly effective on principal goals for student achievement and 82 percent were rated highly effective on teachers’ student growth objectives. For the two components related to principal practice, ratings were also skewed toward the high end, but less so: on the principal practice instrument 39 percent were rated highly effective, and on the evaluation leadership instrument 51 percent were rated highly effective.
The percentage of principals rated ineffective or partially effective also differed across component measures, but to a lesser extent. The highest percentage of principals rated ineffective or partially effective (10 percent) occurred on the school median student growth percentiles component, which also had the lowest percentage of highly effective ratings. The component measure with the second highest percentage of principals rated ineffective or partially effective (5 percent) was principal goals for student achievement, which also had the second highest percentage of principals rated highly effective (after teachers’ student growth objectives). Few principals were rated ineffective or partially effective on the principal practice instrument (3 percent), evaluation leadership instrument (1 percent), or teachers’ student growth objectives (1 percent).
There are several possible explanations for why ratings tended to be lower on some components and higher on others. Principals were most likely to be rated highly effective on the two component measures for which they had a role in setting the goals (principal goals for student achievement and teachers’ student growth objectives). This may suggest that many, though not all, principals and teachers are setting goals that are achievable but not challenging. Ratings were particularly high on teachers’ student growth objectives, for which teachers set goals in collaboration with their principals, principals rate teachers on the attainment of these goals, and principals receive the average goal rating of their teachers. Because the teachers’ student growth objective ratings factor into the principal ratings as well as teachers’ own evaluation ratings, principals have an incentive to collaborate with teachers to set goals that are achievable but not challenging. However, principal goals was the component with the second highest percentage of principals rated partially effective or ineffective, suggesting that some principals did set challenging goals.
Principals received the lowest ratings on school median student growth percentiles, the only component that is determined strictly by formula, without any role for judgment by the principal or the superintendent. School median student growth percentile ratings may have more variation than other components because they are constructed from measures that are explicitly designed to compare student test score growth using a scale that
Among principals with ratings on all component measures, only 8 percent were rated highly effective on school median student growth percentiles, but ratings were much higher on the two component measures that allowed educators to set their own goals: 69 percent of principals were rated highly effective on principal goals for student achievement and 82 percent were rated highly effective on teachers’ student growth objectives
8

distributes student performance along a bell curve. In contrast, the other components are criterion-referenced measures of principal performance that are not explicitly comparative.
Although ratings based on school median student growth percentiles were lower on average than ratings based on other component measures, the vast majority of principals received effective ratings on this component for two reasons. First, the formula that converts the school median student growth percentile into a rating assigns most of the percentile distribution to ratings in the effective range. Although school median student growth percentiles could be 0–100, most of them are close to 50. For percentiles 39–64, the formula assigns ratings of 2.7 to 3.4, which fall in the effective range (see figure B2 in appendix B). Percentiles 45–55 (45 percent of principals) are assigned a rating of 3. The formula was intended to distinguish more between percentiles in the highest and lowest parts of the distribution than between those in the middle. Second, the formula was developed for teachers and adopted for principals, and school median student growth percentiles are based on more students than teacher median student growth percentiles are, so school median student growth percentiles are typically less variable than teacher median student growth percentiles. Thus, median student growth percentiles are less likely to be very low or very high for schools than for teachers. Using the same conversion formula for principals and teachers means that even smaller percentages of principals than teachers will have a median student growth percentile that results in either a very low or very high rating.
Principals tended to receive higher ratings on principal goals for student achievement than on school median student growth percentiles. The principal goals component replaces part or all of the school median student growth percentile component in schools where one or no grades have student growth percentiles. Therefore, principals of schools where one or no grades have student growth percentiles might be expected to receive higher overall ratings than principals of schools where more grades have this measure.
Variation on the overall rating was limited, with 99 percent of principals rated effective or highly effective. Overall, 36 percent of principals were rated highly effective, 63 percent were rated effective, and 1 percent were rated ineffective or partially effective (figure 2).
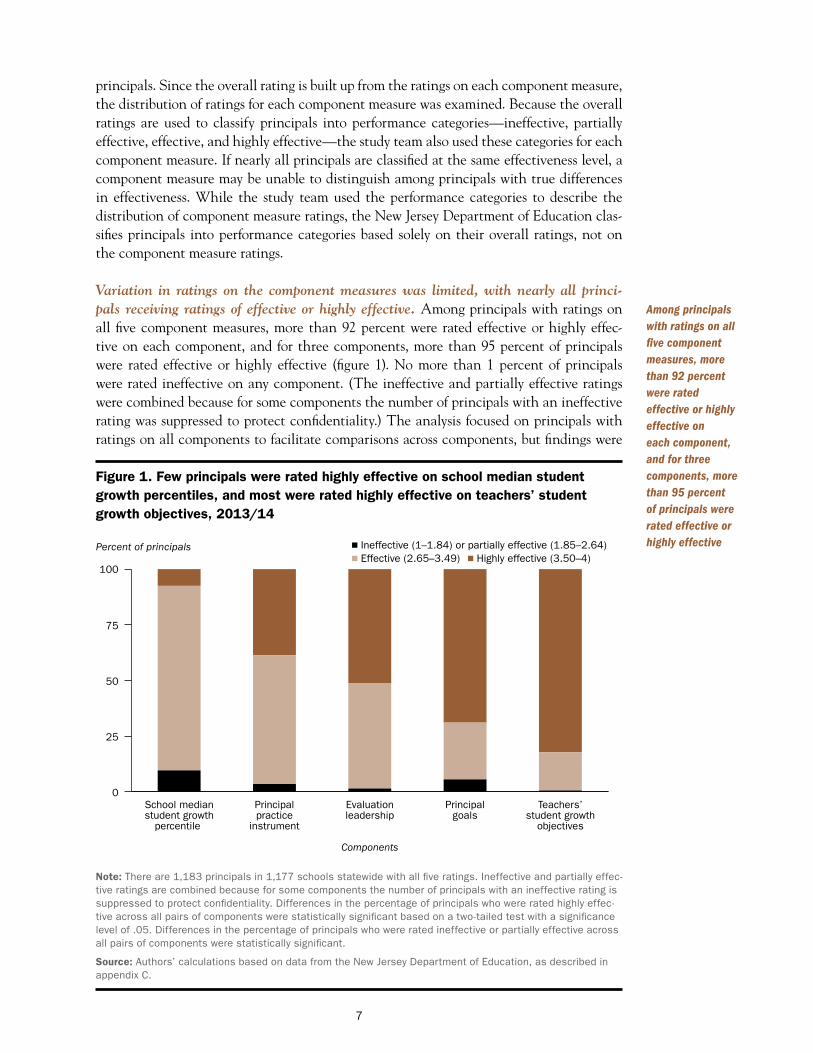
Principals whose evaluations included school median student growth percentiles were less likely to receive overall ratings of highly effective than were principals whose evaluations did not include this measure. The percentage of principals rated highly effective differed by a statistically significant margin depending on whether student growth percentiles were included in their evaluations. The percentage of principals rated highly effective was 27 percent in schools where multiple grades had student growth percentiles, 39 percent in schools where a single grade had student growth percentiles, and 53 percent in schools where no grades had student growth percentiles (see figure 2).
Differences between the overall ratings of principals at schools with and without student growth percentiles could be due either to the inclusion of the student growth percentiles or to differences in principals’ ratings on other components. The study team investigated these explanations by calculating the overall ratings that principals in schools with student growth percentiles would have received if their overall ratings did not include student growth percentiles. (These ratings were calculated the same way as the overall ratings of principals in schools without student growth percentiles). In these simulated ratings, the
Overall, 36 percent of principals were rated highly effective, 63 percent were rated effective, and 1 percent were rated ineffective or partially effective
9
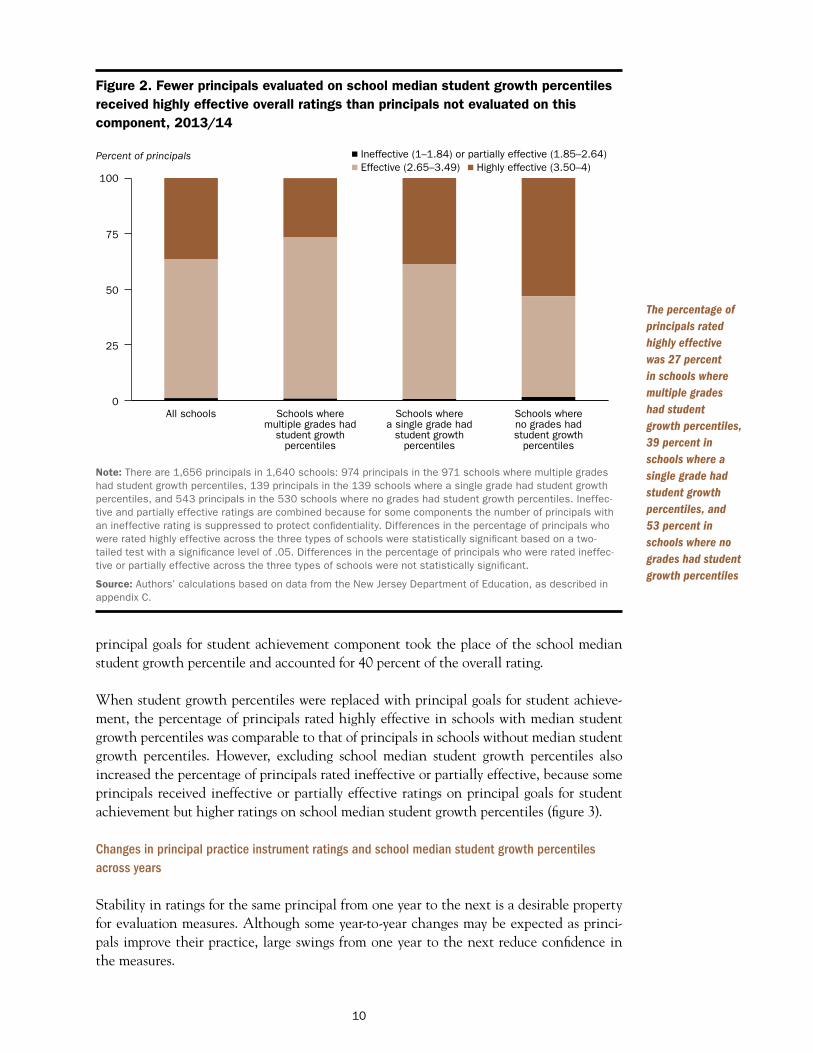
Figure 2. Fewer principals evaluated on school median student growth percentiles received highly effective overall ratings than principals not evaluated on this component, 2013/14
Ineffective (1–1.84) or partially effective (1.85–2.64) Effective (2.65–3.49)
Percent of principals Highly effective (3.50–4)
100
75
50
25
0 All schools Schools where Schools where Schools where
multiple grades had a single grade had no grades had student growth student growth student growth
percentiles percentiles percentiles
Note: There are 1,656 principals in 1,640 schools: 974 principals in the 971 schools where multiple grades had student growth percentiles, 139 principals in the 139 schools where a single grade had student growth percentiles, and 543 principals in the 530 schools where no grades had student growth percentiles. Ineffective and partially effective ratings are combined because for some components the number of principals with an ineffective rating is suppressed to protect confidentiality. Differences in the percentage of principals who were rated highly effective across the three types of schools were statistically significant based on a two-tailed test with a significance level of .05. Differences in the percentage of principals who were rated ineffective or partially effective across the three types of schools were not statistically significant.
Source: Authors’ calculations based on data from the New Jersey Department of Education, as described in appendix C.
The percentage of principals rated highly effective was 27 percent in schools where multiple grades had student growth percentiles, 39 percent in schools where a single grade had student growth percentiles, and 53 percent in schools where no grades had student growth percentiles
principal goals for student achievement component took the place of the school median student growth percentile and accounted for 40 percent of the overall rating.
When student growth percentiles were replaced with principal goals for student achievement, the percentage of principals rated highly effective in schools with median student growth percentiles was comparable to that of principals in schools without median student growth percentiles. However, excluding school median student growth percentiles also increased the percentage of principals rated ineffective or partially effective, because some principals received ineffective or partially effective ratings on principal goals for student achievement but higher ratings on school median student growth percentiles (figure 3).
Changes in principal practice instrument ratings and school median student growth percentiles across years
Stability in ratings for the same principal from one year to the next is a desirable property for evaluation measures. Although some year-to-year changes may be expected as principals improve their practice, large swings from one year to the next reduce confidence in the measures.
10

Figure 3. Simulated overall ratings that replaced ratings for school median student growth percentiles with those for principal goals for student achievement gave principals more highly effective and ineffective or partially effective ratings and fewer effective ratings, 2013/14
Ineffective (1–1.84) or partially effective (1.85–2.64) Percent of principals Effective (2.65–3.49) Highly effective (3.50–4) 100
75
50
25
0 All schools Schools where Schools where Schools where
multiple grades had a single grade had no grades had student growth student growth student growth
percentiles percentiles percentiles
Note: There are 1,656 principals in 1,640 schools: 974 principals in the 971 schools where multiple grades had student growth percentiles, 139 principals in the 139 schools where a single grade had student growth percentiles, and 543 principals in the 530 schools where no grades had student growth percentiles. Ineffective and partially effective ratings are combined because for some components the number of principals with an ineffective rating is suppressed to protect confidentiality.
Source: Authors’ calculations based on data from the New Jersey Department of Education, as described in appendix C.
When student growth percentiles were replaced with principal goals for student achievement, the percentage of principals rated highly effective in schools with median student growth percentiles was comparable to that of principals in schools without median student growth percentiles
Analyses comparing evaluation ratings across years focused on principals who were in the same school in both years because these principals might be expected to have relatively stable year-to-year performance, whereas principals who are new to a school might be expected to have different performance from their predecessors. In contrast to this expectation, Ross et al. (2015) found that school median student growth percentiles statewide are similarly stable across years in schools where the principal remained the same and in schools that changed principals. This suggests that school median student growth percentiles may contain persistent, school-specific factors that are difficult for new principals to change. Nevertheless, these analyses used principals who remained in the same school to eliminate any differences in ratings that could have been caused by changes in principals.
Principal practice instrument ratings were available for two years for the districts that participated in the principal evaluation pilot in 2012/13 and reported these ratings to the department. The pilot districts volunteered to implement the evaluation system early but did not use the 2012/13 ratings for employment decisions. Thus, findings for the principal practice instrument ratings may not generalize to the statewide sample or to future years of the principal evaluation system.
Three years of school median student growth percentiles in math and English language arts were available statewide. The school median student growth percentile measure used in principal evaluations was calculated using student academic growth on combined math
11

–
–
– –
and English language arts assessments. The combined measure was available only for 2013/14, but school median student growth percentiles in math and English language arts separately were available for all schools with grades 4–8 statewide for 2011/12–2013/14. To ensure a consistent measure across the three years, the study team used the average of the school median student growth percentiles in math and English language arts. The average is very similar to the combined measure used for principal evaluation (the correlation between these measures in 2013/14 was .98).
Principal practice instrument ratings were moderately stable across years for principals in pilot districts who remained in the same school. Among principals who remained in the same school and had principal practice instrument ratings in both 2012/13 and 2013/14, 52 percent were rated in the same performance category in both years, 42 percent were rated in a better performance category in 2013/14, and 7 percent were rated in a worse performance category (table 1).2 The correlation between the principal practice instrument ratings in 2012/13 and 2013/14 was .53, a moderate level of stability. Changes in the ratings of principals in each category for 2012/13 and 2013/14 are detailed in table 1.
Of the 30 percent of principals who were rated ineffective or partially effective in 2012/13, 66 percent improved their ratings to effective or highly effective in 2013/14 (see table 1). Overall, 14 percent of principals in districts that participated in the pilot were rated ineffective or partially effective in 2013/14, higher than the percentage who were rated in those categories statewide. This suggests that the performance of principals in pilot districts varied more than the performance of principals statewide or that superintendents of districts who participated in the pilot were more willing than superintendents statewide to differentiate principal practice instrument ratings.
Improvements in the principal practice instrument ratings across years can occur because principals improve their practice or because the circumstances in which the ratings are made change. The 2012/13 pilot ratings were not used for any employment-related consequences, whereas the 2013/14 ratings could have been. Because the 2013/14 ratings were consequential, superintendents may have been more lenient in assigning ratings than they were in 2012/13, or principals may have had stronger incentives to improve their performance.
Table 1. Principal practice instrument ratings, 2012/13 and 2013/14 (percent)
Rating in 2012/13
Rating in 2013/14
Total
Ineffective (1 1.84) or
partially effective (1.85 2.64)a
Effective (2.65 3.49)
Highly effective (3.50 4)
Ineffective (1–1.84) or partially effective (1.85–2.64)a 10.2 14.3 5.4 29.9
Effective (2.65–3.49) 2.0 24.5 21.8 48.3
Highly effective (3.50–4) 1.4 3.4 17.0 21.8
Total 13.6 42.2 44.2 100.0
Note: There are 147 principals in 147 schools who remained in the same school in both 2012/13 and 2013/14 and had principal practice instrument ratings in both years.
a. Categories are combined because the number of principals with an ineffective rating is suppressed to protect confidentiality.
Source: Authors’ calculations based on data from the New Jersey Department of Education, as described in appendix C.
Among principals who remained in the same school and had principal practice instrument ratings in 2012/13 and 2013/14, 52 percent were rated in the same performance category in both years, 42 percent were rated in a better performance category in 2013/14, and 7 percent were rated in a worse performance category
12
–
– – –

–
–
– –
To examine these possible explanations, the study team compared the change in principal practice instrument ratings from 2012/13 to 2013/14 with the change in school median student growth percentile ratings. Among principals who remained in the same school and had both ratings across years, principal practice instrument ratings improved significantly more than school median student growth percentile ratings. The percentage of principals rated highly effective on the principal practice instrument increased 19 percentage points, and the percentage rated ineffective or partially effective declined 17 percentage points. In contrast, the percentage of principals rated highly effective on school median student growth percentiles did not change, and the percentage of principals rated ineffective or partially effective declined 5 percentage points.
School median student growth percentile ratings were moderately to highly stable across years for principals who remained in the same school. Among principals who remained in the same school and had school median student growth percentiles in both 2012/13 and 2013/14, 82 percent were rated in the same performance category in both years, 9 percent were rated in a better performance category in 2013/14, and 9 percent were rated in a worse performance category (table 2).3 Of the 11 percent of principals who were rated ineffective or partially effective in 2012/13, 58 percent improved their ratings to effective or highly effective in 2013/14 (see table 2). The correlation between the school median student growth percentile ratings in 2012/13 and 2013/14 was .68, a moderate to high level of stability.
Large changes in school median student growth percentiles between the first and second years did not completely persist in the third year, suggesting some measurement error and some persistent change. To determine whether the changes in ratings across years were temporary or permanent, the study team also looked at the stability of school median student growth percentiles over three years. Measurement error would be expected to produce temporary increases or decreases from one year to the next, followed by changes in the opposite direction in the next year (mean reversion).4 Conversely, true increases or declines in performance would be expected to be sustained across years.
Table 2. School median student growth percentile ratings, 2012/13 and 2013/14 (percent)
Rating in 2012/13
Rating in 2013/14
Total
Ineffective (1 1.84) or
partially effective (1.85 2.64)a
Effective (2.65 3.49)
Highly effective (3.50 4)
Ineffective or partially effective (1.85–2.64)a 4.4 6.0 0.1 10.5
Effective (2.65–3.49) 5.0 74.3 3.1 82.4
Highly effective (3.50–4) 0.0 3.9 3.3 7.2
Total 9.4 84.2 6.5 100.0
Note: There are 1,267 principals in 1,257 schools who remained in the same school in both 2012/13 and 2013/14 and had school median student growth percentile ratings in both years. Percentages may not sum to 100 because of rounding.
a. Categories are combined because the number of principals with an ineffective rating is suppressed to protect confidentiality.
Source: Authors’ calculations based on data from the New Jersey Department of Education, as described in appendix C.
Among principals who remained in the same school and had school median student growth percentiles in both 2012/13 and 2013/14, 82 percent were rated in the same performance category in both years, 9 percent were rated in a better performance category, and 9 percent were rated in a worse performance category
13
–
– – –
The study team analyzed changes in school median student growth percentiles across three years separately for groups of principals with large increases, large decreases, and smaller changes from 2011/12 to 2012/13 to see whether they were sustained from 2012/13 to 2013/14. Large increases or decreases were defined as a change of more than 5 percentile points.
This analysis was also restricted to principals in the same school for all three years (2011/12–2013/14) to eliminate any changes in performance that might be due to principals changing schools. Among these principals, 23 percent had large increases in school median student growth percentiles, and 16 percent had large decreases.5
Principals who had large increases in school median student growth percentiles from 2011/12 to 2012/13 had lower school median student growth percentiles on average in 2013/14 than in 2012/13, and principals who had large decreases had higher school median student growth percentiles on average in 2013/14 than in 2012/13 (figure 4). These findings illustrate the presence of some mean reversion, which is consistent with the existence of measurement error. However, the large gains and declines over the first two years were not completely erased in the third year. Among principals with large increases in school median student growth percentiles from 2011/12 to 2012/13, the average school median student growth percentile was 7 percentile points higher in 2013/14 than in 2011/12. Likewise, among principals with large decreases in school median student growth percentiles, the average school median student growth percentile was 6 percentile points lower in 2013/14 than in 2011/12. This suggests that the year-to-year changes in school median student growth percentiles include both persistent change and measurement error. Persistent change is demonstrated by groups with large increases in the first year having school median student growth percentiles two
Figure 4. Large changes in school median student growth percentiles between the first and second year did not completely persist in the third year, 2011/12–2013/14
Change in school median student growth percentiles relative to 2011/12 (percentile points)
12 School median student growth percentiles increased more than 5 percentile points from 2011/12 to 2012/13
6
School median student growth percentiles changed between –5 and 5 percentile points from 2011/12 to 2012/13
0
–6
School median student growth percentiles decreased more than 5 percentile points from 2011/12 to 2012/13
–12 2011/12 2012/13 2013/14
Among principals with large increases in school median student growth percentiles from 2011/12 to 2012/13, the average school median student growth percentile was 7 percentile points higher in 2013/14 than in 2011/12
Note: There are 808 principals in 806 schools who remained in the same school over 2011/12–2013/14 and had school median student growth percentile ratings in all three years.
Source: Authors’ calculations based on data from the New Jersey Department of Education, as described in appendix C.
14

years later (in 2013/14) that remained higher than in the initial year (2011/12), and the same persistency was true of the group with large decreases in the measure. Measurement error is demonstrated by large initial increases (and decreases) in school median student growth percentiles on average from 2011/12 to 2012/13 having been partly eliminated by changes in the opposite direction the following year.
School median student growth percentiles were less stable across years for smaller schools than for larger schools. Changes in school median student growth percentiles were bigger across years for smaller schools than for larger schools (figure 5). For schools with fewer than 500 tested students in grades 4–8 (about 80 percent of New Jersey schools), changes in school median student growth percentiles ranged from –24 to 31 percentile points. The changes were much smaller — from –10 to 12 percentile points — for schools with more than 500 tested students in grades 4–8. The bigger changes in smaller schools could reflect differences in measurement error or differences in true performance between large and small schools. Based on three years of data the study team found that smaller schools exhibit greater mean reversion (that is, the measure moves in one direction during the first year and in the opposite direction during the following year) in school median student growth percentiles than do larger schools. Greater mean reversion is consistent with more measurement error in the school median student growth percentiles in smaller schools (see appendix E for a description of the three-year results).
The greater measurement error in school median student growth percentiles for smaller schools supports the New Jersey Department of Education’s 2013/14 policy of giving lower weight to the school median student growth percentile rating in the overall rating in schools where only one grade has students with student growth percentiles (20 percent)
Figure 5. School median student growth percentiles were less stable for smaller schools than for larger schools between 2012/13 and 2013/14
Change in school median growth percentiles, 2012/13–2013/14 (percentile points)
40
30
20
10
0
–10
–20
–30 0 500 1,000 1,500 2,000
Number of tested students in grades 4–8
Note: There are 1,267 principals in 1,257 schools who remained in the same school in both 2012/13 and 2013/14 and had school median student growth percentile ratings in both years.
Source: Authors’ calculations based on data from the New Jersey Department of Education, as described in appendix C.
Changes in school median student growth percentiles ranged from –24 to 31 percentile points for schools with fewer than 500 tested students in grades 4–8 and from –10 to 12 percentile points for schools with more than 500 tested students in grades 4–8
15

than in schools where multiple grades do (30 percent). However, the number of grades is only a rough proxy for the number of students, which is what matters for measurement error. Although on average, schools with student growth percentiles for multiple grades have more students in those grades (306) than do schools with student growth percentiles for a single grade (109), the range of the number of tested students overlaps for both groups.
Correlations between ratings and student characteristics
The correlations between the principal ratings on the component measures and school-wide measures of student disadvantage are of interest because negative correlations might suggest that the ratings are biased against principals of schools with more disadvantaged students or that less effective principals might actually be serving schools with more disadvantaged students. Although it is not yet possible to confirm either explanation, the existence of such correlations would highlight the need for further research.
Correlations were estimated between principal ratings on the component measures and two measures of student disadvantage: the schoolwide percentage of students economically disadvantaged and the schoolwide percentage of English learner students. All principals with a particular component measure were included in the analyses.
The overall rating and all component measure ratings had modest significant negative correlations with the schoolwide percentage of economically disadvantaged students, and small but statistically significant negative correlations with the schoolwide percentage of English learner students (table 3). Findings were similar for assistant principals (see appendix F).
These findings are consistent with another study on student growth percentiles, which found that, for all content areas and grade levels, students who were eligible for the federal school lunch program, a proxy for economic disadvantage, had lower student growth
Table 3. Principals leading schools with larger proportions of economically disadvantaged students tended to receive lower ratings than other principals in 2013/14
Component measure
Correlation with
Schoolwide percentage of economically
disadvantaged students Schoolwide percentage of English learner students
School median student growth percentile rating –.33* –.05*
Principal practice instrument rating –.20* –.14*
Evaluation leadership instrument rating –.14* –.11*
Principal goals for student achievement rating –.15* –.10*
Teachers’ student growth objectives rating –.29* –.05*
Overall rating –.24* –.12*
* Statistically significant at p < .05, two-tailed test.
Note: The number of principals with any rating and data on either category of disadvantaged students ranges from 1,450 principals in 1,429 schools to 1,781 principals in 1,762 schools. The correlations between school median student growth percentiles and the percentage of disadvantaged students are similar to the correlations between school median student growth percentile ratings and the percentage of disadvantaged students.
Source: Authors’ calculations based on data from the New Jersey Department of Education, as described in appendix C.
The overall rating and all component measure ratings had modest significant negative correlations with the schoolwide percentage of economically disadvantaged students, and small but statistically significant negative correlations with the schoolwide percentage of English learner students
16

percentiles than students who were not eligible (Colorado Department of Education, Accountability and Data Analysis Unit, 2013). Neither that study nor this one could determine whether the findings are the result of bias or an inequitable distribution of principals in the state.
Determining whether these findings represent bias or an inequitable distribution of principals in the state requires further research. The ideal way to determine whether the findings represent bias would be to obtain an unbiased measure of principal effectiveness that could validate the current component measures. Several studies have attempted to separate principals’ contributions to student achievement growth from those of the school by controlling for student achievement growth under the principals’ predecessor (Grissom, Kalogrides, & Loeb, 2015; Teh, Chiang, Lipscomb, & Gill, 2014). This method might reduce bias from persistent, school-specific factors that affect student achievement. Because of data limitations this method is outside the scope of this study; it may be a suitable topic for further research.
Correlations among ratings
If the components of the principal evaluation are measuring different aspects of a coherent overall characteristic of principal effectiveness, they should be positively (but not perfectly) correlated. Low or negative correlations might imply that one or more components are not accurately measuring principal performance. This analysis cannot verify the validity of the components because the study does not have a validated measure of principals’ true performance to use as a standard. Two studies have attempted to validate principal performance measures by correlating them with measures of principals’ effects on student achievement (Grissom et al., 2015; Teh et al., 2014), but this study lacks the student-level data needed to estimate principals’ effects on student achievement.
The correlations among the component measure ratings are consistently statistically significant and positive, varying in size (table 4). These analyses include the full sample of principals for each correlation. The highest correlation was between the two components that measure principal practice. The principal practice and evaluation leadership instruments ratings had a moderate to high correlation of .61 for the sample of principals with ratings for all five component measures. This result might reflect the fact that both instruments
Table 4. Correlations among principal evaluation component measure ratings, 2013/14
Component measure rating
Correlation with
School median student growth
percentiles rating
Principal practice
instrument rating
Evaluation leadership instrument
rating Principal
goals rating
Principal practice instrument rating .16*
Evaluation leadership instrument rating .08* .61*
Principal goals rating .10* .32* .32*
Teachers’ student growth objectives rating .27* .23* .25* .27*
The correlations among the component measure ratings are consistently statistically significant and positive, varying in size
* Statistically significant at p < .05, two-tailed test.
Note: The number of principals with any two ratings ranges from 1,183 principals in 1,177 schools to 1,752 principals in 1,733 schools.
Source: Authors’ calculations based on data from the New Jersey Department of Education, as described in appendix C.
17

are intended to measure aspects of practice and are often completed by the same rater (typically, the superintendent or assistant superintendent).
The school median student growth percentile rating had small correlations with the other components, ranging from .08 with the evaluation leadership instrument rating to .27 with the teachers’ student growth objectives rating. This finding is consistent with other studies that found low correlations between measures of school-level student achievement growth and measures of principal practice (Grissom et al., 2015; Milanowski & Kimball, 2012).
Correlations among the other three components’ ratings (principal goals for student achievement, teachers’ student growth objectives, and evaluation leadership) were positive but modest (.23–.32). This finding is consistent with idea that the components measure different dimensions of principal performance. Findings were similar for assistant principals (see appendix G).
Implications of the study findings
The study’s findings have three main implications.
Additional guidance or alternate measures could help principals and teachers set more challenging goals
Research suggests that principals vary in their effectiveness at increasing student achievement (Branch et al., 2012; Chiang et al., 2016; Coelli & Green, 2012; Dhuey & Smith, 2012, 2014). However, nearly all principals in the study received an overall rating of effective or highly effective in 2013/14. Ratings were particularly high on the two component measures for which principals were involved in setting goals, with 69 percent of principals rated highly effective on principal goals for student achievement and 82 percent rated highly effective on teachers’ student growth objectives. These ratings indicate that principals and teachers might be setting goals that are achievable but not challenging. Additional guidance based on data on year-to-year changes in student outcome measures could help principals and teachers set more challenging goals.
However, even with additional guidance, principals have an incentive to make their own goals and their teachers’ goals readily attainable because they are highly consequential. Campbell (1976) suggests that when measures are consequential and can be manipulated, additional measures and a system for checking possible manipulation might improve the outcome.
Principals are evaluated on teachers’ student growth objectives because the New Jersey Department of Education wanted to measure the extent to which principals are supporting teachers in meeting their student achievement goals. Other measures could improve principals’ incentives to set challenging but attainable teacher goals and to support teachers in achieving their goals. For example, one subdomain of the evaluation leadership instrument measures the extent to which principals help teachers set high-quality student growth objectives. Based on analyses of student outcomes, the department could suggest challenging targets for student growth objectives and ask superintendents to rate principals on the extent to which their teachers set challenging goals. Superintendents could then provide a check against manipulation. The department could also add a subdomain to
Particularly high ratings on principal goals for student achievement and teachers’ student growth objectives indicate that principals and teachers might be setting goals that are achievable but not challenging. Additional guidance based on data on year-toyear changes in student outcome measures could help principals and teachers set more challenging goals
18

the evaluation leadership instrument that measures the extent to which principals support teachers in meeting their student growth objectives. Evidence for this subdomain could be based on observations of meetings between principals and teachers or on evidence principals provide (for example, a portfolio) about how they addressed it. A teacher survey could ask about the extent to which principals support teachers in meeting their goals. Many school districts in New Jersey are using the Stronge Leader Effectiveness Performance Evaluation System, which includes an optional teacher survey, although its validity and reliability have not been established. A teacher survey that has empirical evidence documenting its validity and reliability is included in the Vanderbilt Assessment of Leadership in Education (Porter et al., 2010).
Overall ratings that include school median student growth percentiles could account for differences in school size in several ways
Schools with fewer students in grades with student growth percentiles had higher yearto-year variability in school median student growth percentile than schools with more students in grades with student growth percentiles. The higher variability for smaller schools likely reflects measurement error because the school median student growth percentile in smaller schools could be more influenced by a few students having a bad or good test day. This finding supports the New Jersey Department of Education policy of using a lower weight in 2013/14 for school median student growth percentile ratings for principals at schools with student growth percentiles for only one grade, but the correspondence between the number of students with student growth percentiles and the number of grades with student growth percentiles is not exact. Using the number of students with student growth percentiles as the measure of school size would reduce the likelihood that overall principal evaluation ratings are unfairly skewed by highly variable school median student growth percentile ratings. For smaller schools, using multiple years of student growth percentiles or reducing the weight on a single year of student growth percentiles could decrease measurement error.
However, reducing the weight of the school median student growth percentile rating in the overall rating of principals of smaller schools would increase the weight of the principal goals for student achievement rating, for which the majority of principals received high scores. Simulations show that most principals whose overall ratings include the school median student growth percentile rating would have had higher overall ratings if the school median student growth percentile rating were not included. These issues with the school median student growth percentile and principal goals for student achievement ratings suggest that more study is needed to identify measures of the principal’s contribution to student achievement growth that have greater stability, reliability, and validity for principal evaluation.
Negative correlations between school median student growth percentiles and percentage of economically disadvantaged students warrant future research
The negative correlation between school median student growth percentiles and the percentage of economically disadvantaged students creates a possible disincentive for effective principals to work in schools serving economically disadvantaged students. Previous research finds that schools with disadvantaged students have high rates of principal turnover, suggesting that these schools already face challenges in attracting and
For smaller schools, using multiple years of student growth percentiles or reducing the weight on a single year of student growth percentiles could decrease measurement error
19
retaining principals (Béteille, Kalogrides, & Loeb, 2012; Loeb, Kalogrides, & Horng, 2010). Correlations between principal ratings and the percentage of economically disadvantaged students could further discourage effective principals from accepting positions in high-poverty schools. This is a topic for further study as principal evaluation systems are implemented more widely. Alternative measures of student achievement growth that can isolate the principal’s contribution could reduce this disincentive, but proposed measures require more study.
Limitations of the study
Limitations of the study include missing data, lack of item-level and rater-level data, lack of a known unbiased measure of principal effectiveness, and lack of data on the quality of districts’ implementation of principal evaluation systems.
The study used principal evaluation data reported by districts to the New Jersey Department of Education. The data were not reported by all districts in the state in 2013/14, and there are possible errors in district reports of job status and school affiliation for a small proportion of the sample for this study (see appendix C for a discussion of identifying principals and a comparison of principals with and without evaluation data). In addition, data were not reported for 4 of the 14 districts that participated in the principal evaluation pilot in 2012/13, and the pilot districts were not representative of districts statewide. These issues limit the generalizability of results.
To reduce the reporting burden, the New Jersey Department of Education did not ask districts to report principal practice or evaluation leadership instrument data at the item or domain (or subscale) level; thus, the internal consistency of these instruments could not be examined. Information on the internal consistency of the principal practice instruments could demonstrate the extent to which items and subscales of each instrument capture an underlying construct of principal quality. Districts did not report rater-level data for these instruments, so the inter-rater reliability of these instruments could not be examined. Information on inter-rater reliability and the training necessary to attain high levels of inter-rater reliability would help in understanding the accuracy of the ratings. In addition, there are no data on the student outcome measures that principals or teachers used to set goals or on what goals they set based on those measures, so the reliability of the principal goals and teachers’ student growth objectives measures could not be examined.
The study found significant, albeit generally low, correlations among the principal evaluation ratings. However, these correlations are not evidence that the measures are valid (that is, that they accurately assess principals’ effectiveness at improving student outcomes). To demonstrate validity, the study team would ideally have a measure of principals’ effectiveness that could be used as a standard. A measure of a principal’s contribution (rather than the school’s contribution) to student achievement growth would be a measure of the principal’s effectiveness. Constructing such a measure would require student-level achievement data and information linking principals with schools over multiple years, which the study team did not have.
Finally, the study team did not have access to data on the quality of districts’ implementation of the principal evaluation system, which would help in interpreting the findings. For example, if high-quality implementation were positively correlated with levels of school
The study team did not have access to data on the quality of districts’ implementation of the principal evaluation system, which would help in interpreting the findings
20

disadvantage, showing that districts with more disadvantaged students were more discerning about principal effectiveness and that districts with less-disadvantaged students were not making such distinctions, implementation quality could partly explain the negative relationships between school disadvantage and ratings on the principal practice instruments and teachers’ student growth objectives. Differences in the quality of implementation across components could also partly explain differences in the variation of ratings across components and the low correlations across components. Because information about implementation was not available, the study team could not examine this possibility.
21

Appendix A. Description of districts participating in the 2012/13 pilot
This appendix presents information for 2013/14 about the districts that piloted the principal evaluation system in 2012/13 and school districts statewide. The study team used evaluation component measures from principals in pilot districts to examine year-to-year changes in 2012/13–2013/14.
The New Jersey Department of Education selected the 14 districts that participated in the principal evaluation pilot in 2012/13 through a competitive grant process. Twenty-one districts applied, and the 14 selected had the highest scores on their grant applications.6
These districts received a combined total of $400,000 to implement the principal evaluation system during the pilot period.
Characteristics of the districts and schools that participated in the principal evaluation pilot aid in understanding the extent to which the findings might be generalized to other settings. Pilot districts included 10 percent of the schools in New Jersey; the smallest pilot district had 2 schools and fewer than 2,000 students, and the largest had 71 schools and 34,976 students (table A1). The characteristics of pilot districts were similar to the state average. The percentage of economically disadvantaged students in the pilot districts did not differ from the statewide averages by a statistically significant amount. However, the average number of students and the percentage of English learner students were higher in the pilot districts than in all districts statewide, both by statistically significant amounts.
Table A1. Student background characteristics of New Jersey districts that participated in the principal evaluation pilot, 2013/14
District County
Percentage of economically
disadvantaged students
Percentage of English learner
students
Average number of students per district
Number of schools
Alexandria Township and North Hunterdon-Voorhees Regional Hunterdon 4.4 0.0 500 2
Bergenfield Bergen 37.8 4.1 3,505
Edison Township Middlesex 22.1 2.2 14,504 19
Elizabeth Union 85.0 15.8 24,875 34
Lawrence Township Mercer 23.3 3.4 4,011
Monmouth County Vocational Monmouth 14.6 0.1 2,173 10
Morris Morris 33.2 7.9 5,098 10
Newark Essex 84.3 8.9 34,976 71
North Brunswick Township Middlesex 36.7 3.6 6,165
Paterson Passaic 90.1 19.4 24,797 47
Pemberton Township Burlington 44.0 1.1 5,037 10
Rockaway Township Morris 14.2 1.6 2,379
Spotswood Middlesex 16.2 0.6 1,780
Stafford Ocean 29.1 0.2 2,255
Average across all pilot districts 38.2 4.9* 9,432* 238
Average across all districts in New Jersey 38.0 4.7 5,746 2,502
* Statistically significant from the average across all districts in New Jersey at p < .05, two-tailed test.
Note: The principal evaluation pilot was conducted in 2012/13.
Source: Authors’ calculations based on data from the New Jersey Department of Education, as described in appendix C.
A-1
7
7
6
6
4
5

Appendix B. Design of principal evaluation system
This appendix describes the design of the principal evaluation system and provides additional details about its component measures. The component measures include: principal practice instrument, evaluation leadership instrument, principal goals for student achievement, teachers’ student growth objectives, and school median student growth percentiles. The final section describes how the overall evaluation rating is calculated from the components and how the evaluation ratings are assigned.
Principal practice instruments were selected or developed by districts and approved by the New Jersey Department of Education
The New Jersey Department of Education required districts to select or develop principal practice instruments that included several features (box B1) and demonstrated their rigor, reliability, and validity. Instruments that the department had reviewed and approved were placed on a list of approved instruments. School districts as well as community organizations, charter management organizations, private companies, and others could submit principal practice instruments for review through a “request for qualifications” process. Submission materials included the instrument and an explanation of evidence to support the instrument’s alignment with the approval criteria.
During the 2012/13 pilot year the New Jersey Department of Education approved 20 principal practice instruments, including 6 developed by school districts (New Jersey Department of Education, 2012a). The 14 pilot districts selected seven principal practice instruments from this approved list. Additional principal practice instruments were approved for 2013/14, but most districts selected the same principal practice instruments that the pilot districts selected in 2012/13 (New Jersey Department of Education, 2014b; figure B1). The pilot districts selected the Focal Point Principal Evaluation Instrument, the Marshall Principal Evaluation Rubric, the Marzano School Leader Evaluation Model,
Box B1. New Jersey Department of Education criteria for principal practice instruments
• Align with the 2008 Interstate School Leadership Licensure Consortium professional stan
dards for school leaders.
• Distinguish a minimum of four levels of performance.
• Use information from multiple sources of evidence collected throughout the year.
• Use information from at least two school-based observations of practice for tenured princi
pals and three school-based observations of practice for nontenured principals.
• Assess progress on at least one individual, school, or district performance goal related to
professional practice.
• Incorporate feedback from teachers regarding principal performance and from other stake
holder groups, as appropriate, regarding individual, school, or district performance goals.
• Assess the principal’s leadership in implementing a rigorous curriculum and assessments
aligned with the New Jersey Core Curriculum content standards.
• Assess the principal’s leadership for high-quality instruction.
• Assess the principal’s performance in evaluating teachers.
• Assess the principal’s support for teachers’ professional growth.
Source: New Jersey Department of Education, 2012b.
B-1

Figure B1. Principal practice instruments selected by districts statewide for use in 2013/14 were similar to those selected by pilot districts for use in 2012/13
Statewide districts Pilot districts
Marshall Principal Evaluation Rubric
Stronge Leader Effectiveness Performance System
Multidimensional Principal Performance Rubric
Marzano School Leader Evaluation Model
McREL International: Principal Evaluation System
District developed
Focal Point Principal Evaluation Instrument
Four other instrumentsa
0 10 20 30 40
Percent of districts
a. Four other instruments are the New Jersey LoTi Principal Evaluation Instrument, the Rhode Island Model: Building Administrator Evaluation and Support Model, the Principal Evaluation and Improvement Instrument, and the Thoughtful Classroom Principal Effectiveness Framework.
Source: New Jersey Department of Education survey of school districts, February 2013 and October 2014; reported in Ross et al. (2015).
McREL International: Principal Evaluation System, the Multidimensional Principal Performance Rubric, and the Stronge Leader Effectiveness Performance Evaluation System.
Additional information about the principal practice instruments selected by pilot districts —such as information about their reliability and validity, as reported by their developers; their domains; their required number of observations; and required training—can be found in Ross et al. (2015).
The evaluation leadership instrument was developed by the New Jersey Department of Education
The New Jersey Department of Education developed an evaluation leadership instrument that assesses principals’ effectiveness on two domains: building teachers’ knowledge and collaboration and successfully executing the evaluation system. This instrument is used to assess assistant principals’ effectiveness on the second domain (table B1). That domain includes items measuring adherence to teacher evaluation requirements, coaching and providing feedback, ensuring reliable and valid observation results, and ensuring that teachers construct rigorous student growth objectives.
Principals selected student outcome measures and targets for their goals
The New Jersey Department of Education asked principals and their evaluators (typically, superintendents or assistant superintendents) to set one to four goals for school achievement growth. Districts selected the number of goals principals needed to set, evaluators rated principals on these goals, and principals received an average rating on these goals.
B-2

Table B1. Evaluation leadership instrument components
Domain 1: Building knowledge and collaboration
Domain 2: Executing the evaluation system successfully
Component 1a: Building knowledge Component 2a: Fulfilling requirements of the evaluation system and collaboration
Component 1b: Building collaboration Component 2b: Providing feedback, coaching, and planning for growth
Component 2c: Ensuring reliable, valid observation results
Component 2d: Ensuring high-quality student growth objectives
Note: Assistant principals are evaluated only on domain 2.
Source: New Jersey Department of Education, 2013.
The department developed a template as a guide for establishing principal goals with associated ratings and disseminated it to administrators throughout the state. The template required administrators to select a measure of student outcomes, state a rationale for the measure, and specify the targets corresponding to each rating (see an example in box B2). The department provided guidance that contained examples of measures of student outcomes, such as annual measurable objective categories (which measure whether the school met annual state-established thresholds for student proficiency rates on state assessments), Advanced Placement scores, SAT or ACT scores, graduation rates (in schools with rates less than 80 percent), college acceptance rates, New Jersey Assessment of Skills and Knowledge scores, High School Proficiency Assessment scores, and scores on national norm-referenced tests. Although principals were not required to use the template in setting goals, the software that many districts purchased to record practice ratings during the year
Box B2. Example of guidance for setting principal goals for student achievement
Rationale High school students’ experience with college-level curricula can be a predictor of success in
higher education. An analysis has found that this high school’s students are taking Advanced
Placement courses less frequently than their peers in comparable schools. Of 2,000 students,
300 successfully completed at least one Advanced Placement course last year.
Administrator goal During this school year 340 students (40 more than in the previous year) will successfully
complete an Advanced Placement course as measured by achieving both:
• A score of 3, 4, or 5 on the Advanced Placement test.
• A course grade of C or better.
Students included in goal 2,000 students in high school.
Target score
Rating based on number of students achieving target
Exceptional (4)
Full (3)
Partial (2)
Insufficient (1)
Score of 3, 4, or 5 on the Advanced Placement More than 335–345 310–334 Fewer than test and course grade of C or better 345 students students students 310 students
Source: New Jersey Department of Education, 2013.
B-3

included the templates and guidance. Thus, principals and superintendents may have at least reviewed this information, even if they did not use the template to establish their goals.
No statewide data were available on the measures that principals selected for their goals or the targets that they set. The only available data came from a survey the department had conducted in the pilot year, in which 11 districts said they planned to set principal goals based on more than one student achievement measure; 8 districts planned to set goals based on the New Jersey Assessment of Skills and Knowledge, and 4 districts planned to use the High School Proficiency Assessment. Districts also planned to set goals based on short-cycle assessments, graduation rates, Advanced Placement course participation or test scores, college-going rates, benchmark assessments, and districtwide assessments. No data were available from the pilot year on the targets principals set.
Principals received the average rating of teachers on student growth objectives
Teachers’ student growth objectives were set in a similar manner as principals’ goals. The department asked teachers, in collaboration with their evaluators (typically, principals or assistant principals), to set one or two goals for achievement growth in their classrooms. Teachers identified an outcome measure and targets for student achievement that would yield ratings on a scale of 1–4. Principals evaluated teachers on attainment of these goals; teachers received the average rating on these goals; and principals received the average rating of their teachers.
The teachers’ student growth objectives were set using the same template used to develop and evaluate principal goals (see an example in box B2). Teachers used a wide variety of assessments to set student growth objectives, with most math and English language arts teachers using commercially available assessments such as the Measures of Academic Progress and other teachers using teacher-developed or districtwide assessments. Many teachers found the process of setting student growth objectives goals challenging and tended to set goals that were attainable in the first year (New Jersey Department of Education, 2014d).
School median student growth percentiles are converted into school median student growth percentile ratings by means of a formula
For schools with grades 4–8, school student achievement growth is measured using school median student growth percentiles in math and English language arts. Student growth percentiles are first calculated at the student level. The student growth percentile indicates the percentile ranking of a student’s test scores relative to scores of students with similar test score histories (Betebenner, 2007). Thus, the student growth percentile accounts for students’ prior test scores but not for student background characteristics such as economic disadvantage or English learner status (New Jersey Department of Education, 2014c).
Student growth percentiles are aggregated to the school level by taking the median student growth percentile among the student growth percentiles for both math and English language arts. The school median student growth percentile is transformed into a school median student growth percentile rating using a formula developed by the New Jersey Department of Education in consultation with the developer of the student growth percentile methodology for teacher evaluation (Damian Betebenner of the National Center
B-4

for the Improvement of Educational Assessment). The rationale for this formula is that educators with median student growth percentiles in the middle of the distribution—the 45th to 55th percentiles—are effective and should receive a rating of 3.0. Above and below that range, ratings change quickly, so that the formula distinguishes educators outside that middle range more than those in the middle range (45–55). School median student growth percentile ratings increase from 1.1 to 2.9 when school median student growth percentiles range from 21 to 44, equal 3 when school median student growth percentiles range from 45 to 55, and increase from 3.1 to 3.9 when school median student growth percentiles range from 56 to 79. School median student growth percentile ratings equal 1 when school median student growth percentiles are 20 or less and equal 4 when school median student growth percentiles are 80 or above. The New Jersey Department of Education adopted this formula for both the teacher and principal evaluation systems (figure B2).
School median student growth percentile ratings for the 2013/14 year were released in January 2015. This is because, as with many states and districts, New Jersey does not receive student achievement growth measures from its test vendor until late fall of the following school year. The lag in receiving the school median student growth percentiles means that evaluations that require these measures are not complete until the following school year, which also delays any decisions based on these evaluations.
The overall rating is the weighted average of component measure ratings and yields the performance category
The overall rating is a weighted average of the component measure ratings. Measures of principal practice contribute 50 percent to the overall rating (30 percent from the principal practice instrument and 20 percent from the evaluation leadership instrument). Measures
Figure B2. The formula that transforms school median student growth percentiles into school median student growth percentile ratings distinguishes educators above and below the middle range more than those in the middle
School median student growth percentile rating
4
3
2
1
School median student growth percentile
0 20 40 60 80 100
Source: Authors’ calculations based on median student growth percentile scores and associated evaluation ratings shown in slide 38 of New Jersey Department of Education (2014a).
B-5

of student achievement contribute 50 percent to the overall rating (up to 30 percent from the school median student growth percentile rating, 10–40 percent from the principal goals for student achievement rating, and 10 percent from the teachers’ student growth percentile rating). Weights on the school median student growth percentile rating and principal goals for student achievement vary based on the number of grades in schools that have student growth percentiles.
The overall rating is converted into one of four performance categories: ineffective, partially effective, effective, and highly effective. The New Jersey Department of Education, working in collaboration with a consultant and team of practitioners, developed the threshold scores for the four performance categories based on qualitative evidence about teacher (not principal) practice and associated rating scores. The New Jersey Department of Education adopted the threshold scores developed for overall teacher evaluation ratings for use with all educators, including principals.
B-6

Appendix C. Data used in the study
The study used data collected from districts by the New Jersey Department of Education. The data include principal evaluation ratings, principals’ job assignments, school median student growth percentiles, school-level background characteristics, and survey data containing information on which principal practice instruments districts selected. This appendix provides details on the data sources.
Identifying principals and assistant principals for the study
Evaluation data from the New Jersey Department of Education included data reported by districts for principals, assistant principals, directors, supervisors, and other nonteaching staff. The data identified principals and assistant principals with evaluation data consistently for approximately 80 percent of the sample, but the remaining sample required additional steps to classify individuals as principals, assistant principals, or other staff. Three data files contained information on educators’ job titles: the original evaluation data based on district reports in July 2014, updated evaluation data corrected by districts in March 2015, and a staff file. Two issues emerged for the remaining sample: the data sources did not agree on the individual’s job status; and approximately 20 percent of the schools had two or more people identified as the principal, which exceeds expectations for midyear retirements and coprincipal situations.
The study team used a set of rules to identify principals and assistant principals and to identify one principal per school where possible. In cases for which the data files disagreed about the individual’s position, the study team used a variable called “jobtype” in the revised evaluation data file. If “jobtype” was missing or ambiguous, other data in the file were used to determine whether the individual was a principal. For example, if the record included teacher evaluation ratings rather than principal evaluation ratings, the individual was coded as a teacher. If more than one principal was identified for a school, the study team used another data source—the school directory data from the New Jersey Department of Education website from fall 2013—to match principal names with names in the evaluation data file. The record with a matching name was designated as the principal and the other records were designated as an assistant principal. In the few remaining cases (approximately 30) for which neither name matched the school directory data, the study team assumed they were all principals.
Evaluation ratings
The primary data source for this study consists of the evaluation ratings that districts reported to the New Jersey Department of Education in March 2015. Districts had submitted preliminary evaluation ratings to the department in July 2014, and after reviewing the department’s evaluation data for accuracy in February 2015, submitted modified ratings in March 2015 as needed.
The 2013/14 principal evaluation system called for districts to rate principals and assistant principals on four component measures: a principal practice instrument, an evaluation leadership instrument, principal goals for student achievement, and teachers’ student growth objectives. These ratings were then combined (along with the school median student growth percentile rating for principals who received it) into an overall rating.
C-1

The availability of evaluation rating data varied across component measures and by type of school leader (table C1). The number of principals with evaluation ratings ranged from 1,450 for those with school median student growth percentiles to 1,796 for those with principal practice instrument ratings. The number of assistant principals with evaluation ratings ranged from 1,119 for those with school median student growth percentiles to 1,727 for those with teachers’ student growth objectives ratings.
Characteristics of the schools of leaders who received evaluation ratings aid in understanding the extent to which the findings might be generalized to other settings. For most ratings, the percentage of economically disadvantaged students and average number of schools in the district were lower for school leaders who received ratings than for those who did not, both by a statistically significant amount (table C2). For school leaders with ratings on the school median student growth percentile, the average school size was lower by a statistically significant amount, reflecting that elementary and middle schools, which typically have student growth percentiles, are generally smaller than high schools, which typically do not.
Table C1. Number of school leaders with evaluation component measure ratings, 2013/14
Evaluation component
Principals Assistant principals
Percent of principals
in the state Number of principals
Number of schools
Number of districts
Percent of assistant principals
in the state
Number of assistant
principalsa Number of
schools Number of districts
Principal practice instrument 70 1,796 1,774 440 74 1,693 985 358
Evaluation leadership instrument 67 1,705 1,686 435 68 1,552 917 353
Principal goals for student achievement 65 1,669 1,651 429 67 1,525 900 349
Teachers’ student growth objectives 69 1,763 1,744 435 75 1,727 969 355
School median student growth percentile 57 1,450 1,429 439 49 1,119 762 329
All five components 47 1,183 1,177 372 35 801 585 285
Overall 65 1,656 1,638 427 66 1,507 889 348
All school leaders in the state 100 2,558 2,513 674 100 2,288 1,196 422
a. Exceeds the number of schools because multiple assistant principals may be in the same schools.
Source: Authors’ calculations based on data from the New Jersey Department of Education.
C-2

Table C2. Student background characteristics of schools where leaders had evaluation ratings, 2013/14
Type of school leader and evaluation component
Percent of economically
Percent
disadvantaged students in school
of English learner
students in school
Number of students in school
Average number of schools in
district Number of
school leaders Number of schools
Principals
Principal practice instrument 35 5 599 10.6 1,781 1,762
Evaluation leadership instrument 33* 4 600 8.9* 1,692 1,676
Principal goals for student achievement 33* 4 602 8.9* 1,656 1,641
Teachers’ student growth objectives 35* 4 600 10.6 1,750 1,734
School median student growth percentile
All five components
38
34*
5
4
526*
514*
11.1
9.4*
1,450
1,183
1,429
1,177
Overall 33* 4 601 8.9* 1,644 1,629
Principal practice instrument 41* 4 996 13.3* 1,684 982
Evaluation leadership instrument 38* 4* 1,017 9.9 1,543 914
All principals in the state 37 5 600 10.5 2,543 2,501
Assistant principals
Principal goals for student achievement 38* 4* 1,021 9.9 1,516 897
Teachers’ student growth objectives 42* 4 997 15.2* 1,718 966
School median student growth percentile 50* 6* 725* 17.1* 1,119 762
All five components 42 5 733* 11.0* 801 585
Overall 38* 4* 1,016 9.9* 1,498 886
All assistant principals in the state 45 5 993 15.2 2,288 1,196
* Difference between this estimate and the estimate for all school leaders in the state is statistically significant at p < .05, two-tailed test.
Note: Some schools were missing information on student characteristics, so sample sizes for this table are smaller than those in table C1.
Source: Authors’ calculations based on data from the New Jersey Department of Education.
Analyses of changes in evaluation ratings across years used information on ratings in both 2012/13 and 2013/14. Data on principal practice instrument ratings in 2012/13 were available for principals in districts that participated in the principal evaluation pilot. Ten of the 14 pilot districts submitted their principal practice instrument ratings to the department in July 2013; the other four districts did not submit these ratings (table C3). Data on school median student growth percentile ratings in both 2012/13 and 2013/14 for math and English language arts were available for all schools in the state with grades 4–8. The analyses of changes in evaluation ratings focused on the sample of principals who had ratings in both years and remained in the same schools.
Characteristics of the students and the size of the school and district for principals included in the analyses of changes across years aid in understanding the extent to which the findings might be generalized. The percentages of economically disadvantaged students, English learner students, and average number of schools in the district were higher for principals with practice instrument ratings and who remained in the same school in both years, by statistically significant amounts (table C4); the average school size was smaller for principals with school median student growth percentiles and who remained in the same school in both years, by statistically significant amounts.
C-3

Table C3. Number of principals who remained in the same school and had evaluation ratings both years, 2012/13 and 2013/14
Evaluation ratings and sample of principals Number of principals
Number of schools
Number of districts
Principals with principal practice instrument ratings in both 2012/13 and 2013/14 who remained in the same school in both years 147 147 10
Principals with school median student growth percentile ratings in both 2012/13 and 2013/14 who remained in the same school in both years 1,267 1,257 392
All principals who remained in the same school in both 2012/13 and 2013/14 1,804 1,788 469
All principals in the state 2,588 2,513 674
Source: Authors’ calculations based on data from the New Jersey Department of Education.
Table C4. Student background characteristics of schools with principals with various evaluation component measure ratings, 2013/14
Evaluation ratings and sample of principals
Percent of economically
disadvantaged students in school
Percent of English
learner students in school
Number of students in school
Average number of schools in
district
Number of school leaders
Number of schools
Principals with principal practice instrument ratings in both 2012/13 and 2013/14 who remained in the same school in both years 65* 11* 609 38.8* 146 146a
Principals with school median student growth percentile ratings in both 2012/13 and 2013/14 who remained in the same school in both years 37 5 525* 11.3 1,267 1,257
All principals who remained in the same school in both 2012/13 and 2013/14 36 5 592 10.5 1,804 1,788
All principals in the state 37 5 600 10.5 2,558 2,513
* Statistically significant at p < .05, two-tailed test.
a. One school in which the principal had principal practice instrument ratings in both 2012/13 and 2013/14 and remained in the same school in both years did not have student characteristics.
Source: Authors’ calculations based on data from the New Jersey Department of Education.
Principals’ job assignments
Data on principals’ job assignments in 2011/12–2013/14 were used to link principals and assistant principals to the schools they led. They were also used to identify principals who remained in the same school across years and those who were new to their schools. These data came from the New Jersey Department of Education.
School median student growth percentiles in math and English language arts
Data on school median student growth percentiles in math and English language arts were used to analyze the stability of the school median student growth percentiles and ratings across years. These data are from publicly available databases on the New Jersey Department of Education website.
C-4

These data included school median student growth percentiles in math and English language arts for schools with students in grades 4–8 in 2011/12–2013/14. Student growth percentiles were calculated for students in grades 4–8 based on scores on the New Jersey Assessment of Skills and Knowledge, which was administered to students in grades 3–8. Student growth percentiles are calculated only for students with test scores in the prior year, so they are not available for students in grade 3. For principal evaluations in 2013/14, the department calculated school median student growth percentiles by taking the median student growth percentile across students in both math and English language arts. However, the department did not provide a measure that combines math and English language arts scores for 2011/12 or 2012/13. Thus, this study used the average of the school median student growth percentiles in math and English language arts as a proxy for the school median student growth percentiles in analyses that examine changes in this measure across years.
School-level student background characteristics
Data on school-level student background characteristics were necessary to analyze the relationship between principal evaluation ratings and measures of student disadvantage. These data are from publicly available databases on the New Jersey Department of Education website and contained the percentages of students of each race/ethnicity, the percentage of economically disadvantaged students, and the percentage of English learner students.
Survey data on principal practice instruments
The department collected information from districts in an October 2013 online survey on the principal practice instruments they had selected or developed. Superintendents or their designees responded to this survey.
C-5

Appendix D. Variation in ratings on the component measures
This appendix contains supplemental information on the variation of evaluation ratings. It includes analyses of the variation of ratings among the full sample of principals who received a rating, more detailed analyses of the variation in ratings on each component, analyses of the variation of principal practice instrument ratings across instruments, and analyses of the variation of ratings for assistant principals.
The full sample of principals had similar principal evaluation ratings to the sample of principals who received ratings on all five components
The analyses in the report focus on principals who received ratings on all five components, in order to facilitate comparisons of the variation across components. However, findings for the full sample of principals and those who received a rating on each component were similar (figure D1). In both samples, high percentages of principals were rated effective or highly effective on each component. In the full sample, at least 88 percent of principals were rated effective or highly effective on each component, compared with more than 90 percent in the sample with ratings on all five components. In both samples, principals received the highest ratings on teachers’ student growth objectives and the lowest ratings on school median student growth percentiles.
The full sample includes principals who received ratings on all five components as well as principals who received ratings on fewer than five components. Most of the principals
Figure D1. Among the full sample of principals who received ratings, at least 88 percent were rated effective or highly effective on each component, 2013/14
Percent of principals
0
25
50
75
100 Effective (2.65–3.49) Highly effective (3.50–4) Ineffective (1–1.84) or partially effective (1.85–2.64)
School median student growth
Principal practice
Evaluation leadership
Principal goals for student
Teachers’ student growth
percentile instrument achievement objectives
Note: The number of principals with ratings on each component ranges from 1,450 principals in 1,429 schools to 1,796 principals in 1,744 schools. Ineffective and partially effective ratings are combined because for some components the number of principals with an ineffective rating is suppressed to protect confidentiality.
Source: Authors’ calculations based on data from the New Jersey Department of Education, as described in appendix C.
D-1

(70 percent) who received ratings on fewer than five components did not have school median student growth percentiles, for example, because they led high schools.
Principal practice instrument ratings differed across the instruments
The analyses in the report pool ratings from the different principal practice instruments that districts selected or developed (see appendix B for more information about the principal practice instruments). However, the principal practice instrument ratings differed across the instruments (figure D2). Significantly fewer principals were rated highly effective
Figure D2. Principal practice instrument ratings differed across instruments, 2013/14
Ineffective (1–1.84) or partially effective (1.85–2.64) Percent of principals Effective (2.65–3.49) Highly effective (3.50–4)
0
25
50
75
100
Marshall Principal
Marzano School Leader
McREL International:
Multidimensional Principal
Stronge Leader Effectiveness
Evaluation Evaluation Principal Performance Performance Rubric Model Evaluation System Rubric Evaluation System
Principal practice instrument
Note: A total of 367 principals in 361 schools used the Marshall Principal Evaluation Rubric; 212 principals in 209 schools used the Marzano School Leader Evaluation Model; 193 principals in 192 schools used the McREL International: Principal Evaluation System; 349 principals in 344 schools used the Multidimensional Principal Performance Rubric; and 371 principals in 370 schools used the Stronge Leader Effectiveness Performance Evaluation System. Ineffective and partially effective ratings are combined because for some components, the number of principals with an ineffective rating is suppressed to protect confidentiality. Differences in the percentage of principals who were rated highly effective across the following pairs of instruments were statistically significant based on a two-tailed test with a significance level of .05: Marshall Principal Evaluation Rubric versus both McREL International: Principal Evaluation System and Stronge Leader Effectiveness Performance Evaluation System, Marzano School Leader Evaluation Model versus Multidimensional Principal Performance Rubric, McREL International: Principal Evaluation System versus both Marshall Principal Evaluation Rubric and Multidimensional Principal Performance Rubric, Multidimensional Principal Performance Rubric versus every instrument except Marshall Principal Evaluation Rubric, and Stronge Leader Effectiveness Performance Evaluation System versus both Marshall Principal Evaluation Rubric and Multidimensional Principal Performance Rubric. Differences in the percentage of principals who were rated ineffective or partially effective across the following pairs of instruments were statistically significant: Marshall Principal Evaluation Rubric versus both Marzano School Leader Evaluation Model and Stronge Leader Effectiveness Performance Evaluation System, Marzano School Leader Evaluation Model versus every instrument except Stronge Leader Effectiveness Performance Evaluation System, McREL International: Principal Evaluation System versus Marzano School Leader Evaluation Model, Multidimensional Principal Performance Rubric versus both Marzano School Leader Evaluation Model and Stronge Leader Effectiveness Performance Evaluation System, and Stronge Leader Effectiveness Performance Evaluation System versus both Marshall Principal Evaluation Rubric and Multidimensional Principal Performance Rubric.
Source: Authors’ calculations based on data from the New Jersey Department of Education, as described in appendix C.
D-2
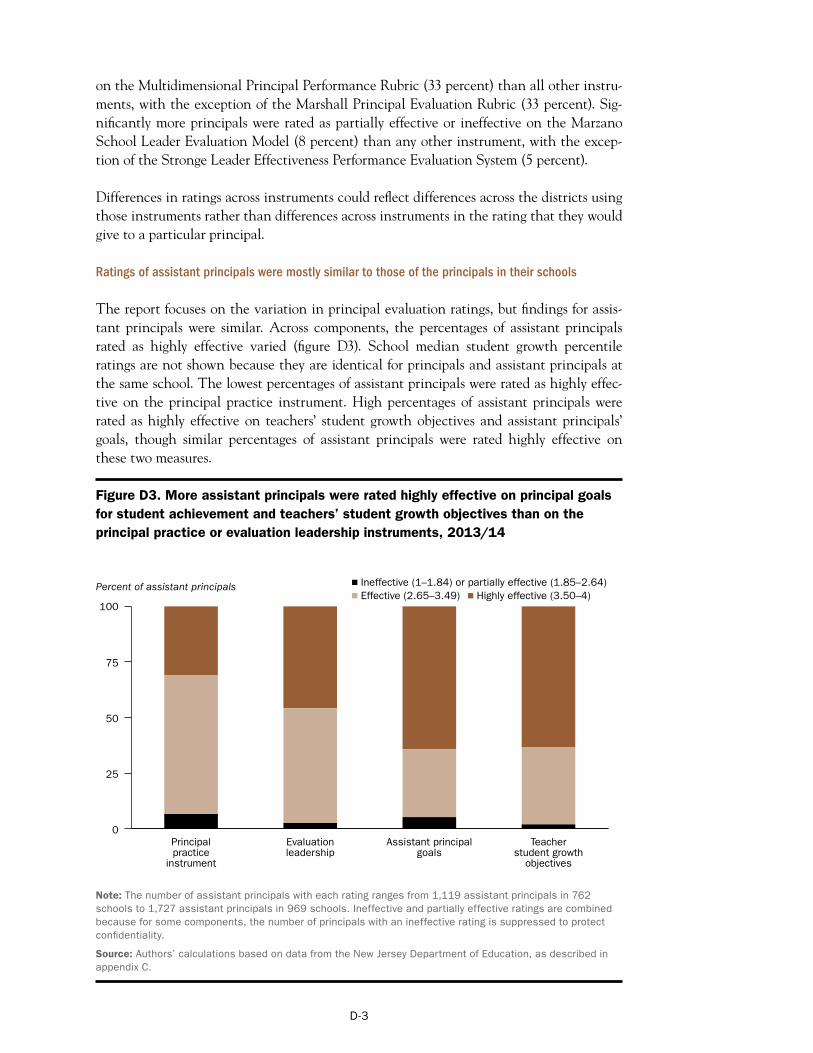
on the Multidimensional Principal Performance Rubric (33 percent) than all other instruments, with the exception of the Marshall Principal Evaluation Rubric (33 percent). Significantly more principals were rated as partially effective or ineffective on the Marzano School Leader Evaluation Model (8 percent) than any other instrument, with the exception of the Stronge Leader Effectiveness Performance Evaluation System (5 percent).
Differences in ratings across instruments could reflect differences across the districts using those instruments rather than differences across instruments in the rating that they would give to a particular principal.
Ratings of assistant principals were mostly similar to those of the principals in their schools
The report focuses on the variation in principal evaluation ratings, but findings for assistant principals were similar. Across components, the percentages of assistant principals rated as highly effective varied (figure D3). School median student growth percentile ratings are not shown because they are identical for principals and assistant principals at the same school. The lowest percentages of assistant principals were rated as highly effective on the principal practice instrument. High percentages of assistant principals were rated as highly effective on teachers’ student growth objectives and assistant principals’ goals, though similar percentages of assistant principals were rated highly effective on these two measures.
Figure D3. More assistant principals were rated highly effective on principal goals for student achievement and teachers’ student growth objectives than on the principal practice or evaluation leadership instruments, 2013/14
Ineffective (1–1.84) or partially effective (1.85–2.64) Percent of assistant principals Effective (2.65–3.49) Highly effective (3.50–4)
Principal Evaluation Assistant principal Teacher practice leadership goals student growth
instrument objectives
Note: The number of assistant principals with each rating ranges from 1,119 assistant principals in 762 schools to 1,727 assistant principals in 969 schools. Ineffective and partially effective ratings are combined because for some components, the number of principals with an ineffective rating is suppressed to protect confidentiality.
Source: Authors’ calculations based on data from the New Jersey Department of Education, as described in appendix C.
0
25
50
75
100
D-3

More than 98 percent of assistant principals received overall ratings of effective or highly effective, with 35 percent of assistant principals rated highly effective and 62 percent rated effective (figure D4). In comparison, 36 percent of principals were rated highly effective and 63 percent were rated effective.
0
25
50
75
100
Figure D4. Assistant principals received overall ratings similar to those of principals, 2013/14
Ineffective (1–1.84) or partially effective (1.85–2.64) Percent of assistant principals or principals Effective (2.65–3.49) Highly effective (3.50–4)
Assistant principals Principals
Note: There are 1,507 assistant principals in 889 schools and 1,656 principals in 1,638 schools with overall ratings. Ineffective and partially effective ratings are combined because for some components, the number of principals with an ineffective rating was suppressed to protect confidentiality.
Source: Authors’ calculations based on data from the New Jersey Department of Education, as described in appendix C.
D-4

Appendix E. Changes in the principal practice instrument and school median student growth percentiles and their associated ratings across years
This appendix contains supplemental information on changes in principal practice instrument ratings and school median student growth percentiles and their associated ratings across years.
Principal practice instrument ratings were moderately stable across years
For principals who remained in the same school in both 2012/13 and 2013/14 and had principal practice instrument ratings in both years, the correlation between ratings across years was .53 (figure E1).
School median student growth percentiles had moderate to high levels of stability across years
For principals who remained in the same school in both 2012/13 and 2013/14 and had student growth percentiles in both years, the correlation between student growth percentiles across years was .68 (figure E2).
Smaller schools had greater mean reversion in school median student growth percentiles than larger schools
This report and the previous report on the pilot showed that changes in school median student growth percentiles across a two-year period were larger for smaller schools than for larger schools (Ross et al., 2015). This finding is consistent with the presence of
Figure E1. Principal practice instrument ratings were moderately to highly stable, 2012/13–2013/14
Principal practice instrument rating in 2013/14
4
3
2
1
Principal practice instrument rating in 2012/13
Note: There are 147 principals in 147 schools who remained in the same school in both 2012/13 and 2013/14 and had principal practice instrument ratings in both years. Principal practice instrument ratings were available in 2012/13 from districts that participated in the principal evaluation pilot.
Source: Authors’ calculations based on data from the New Jersey Department of Education, as described in appendix C.
1 2 3 4
E-1

Figure E2. School median student growth percentiles were moderately stable, 2012/13–2013/14
School median student growth percentile in 2013/14
100
75
50
25
0 0 25 50 75 100
School median student growth percentile in 2012/13
Note: There are 1,267 principals in 1,257 schools who remained in the same school in both 2012/13 and 2013/14 and had school median student growth percentiles in both years.
Source: Authors’ calculations based on data from the New Jersey Department of Education, as described in appendix C.
measurement error, but it raises the possibility that other differences between smaller and larger schools contribute to changes in school student growth percentiles. For example, it is possible that smaller schools can begin more quickly on a trajectory of true improvement (or declines) in performance across years.
With the benefit of three years of data on school median student growth percentiles, the study can test this hypothesis by examining changes across three years for smaller schools and larger schools. Measurement error would be expected to cause improvements or declines across years for smaller schools, relative to larger schools, and these would be expected to be followed by changes in the opposite direction in the following year. Following the three-year analysis discussed in the report text, principals were separated into groups based on whether the changes in school median student growth percentiles across years exceeded 5 percentile points in either direction. Smaller schools were expected to have more variation than larger schools across years because of measurement error. Consistent with this expectation, 43 percent of principals in smaller schools had increases or decreases in school median student growth percentiles of more than 5 percentile points from 2011/12 to 2012/13, compared with 19 percent of principals in larger schools.
Mean reversion in school median student growth percentiles was greater for smaller schools than larger schools over a three-year period. Among principals who experienced improvements of at least 5 percentile points from 2011/12 to 2012/13, principals in smaller schools had larger improvements from 2011/12 to 2012/13 than principals in larger schools (figure E3). But these changes were followed by larger declines from 2012/13 to 2013/14 for principals in smaller schools relative to principals in larger schools. Findings were similar for smaller versus larger schools when school median student growth percentiles decreased by more than 5 percentile points from 2011/12 to 2012/13.
E-2

Figure E3. Mean reversion in school median student growth percentiles was greater for smaller schools than for larger schools, 2011/12–2013/14
Change in school median student growth percentiles relative to 2011/12 (percentile points)
Schools with fewer than 500 students Schools with at least 500 students tested in grades 4–8 tested in grades 4–8
12
6
0
–6
–12 2011/12 2012/13 2013/14 2011/12 2012/13 2013/14
School median student growth percentiles increased by more than 5 percentile points between 2011/12 and 2012/13 School median student growth percentiles changed between –5 and 5 percentile points between 2011/12 and 2012/13 School median student growth percentiles decreased by more than 5 percentile points between 2011/12 and 2012/13
Note: There are 808 principals in 806 schools who remained in the same school in both 2012/13 and 2013/14 and had school median student growth percentiles in both years.
Source: Authors’ calculations based on data from the New Jersey Department of Education, as described in appendix C.
E-3
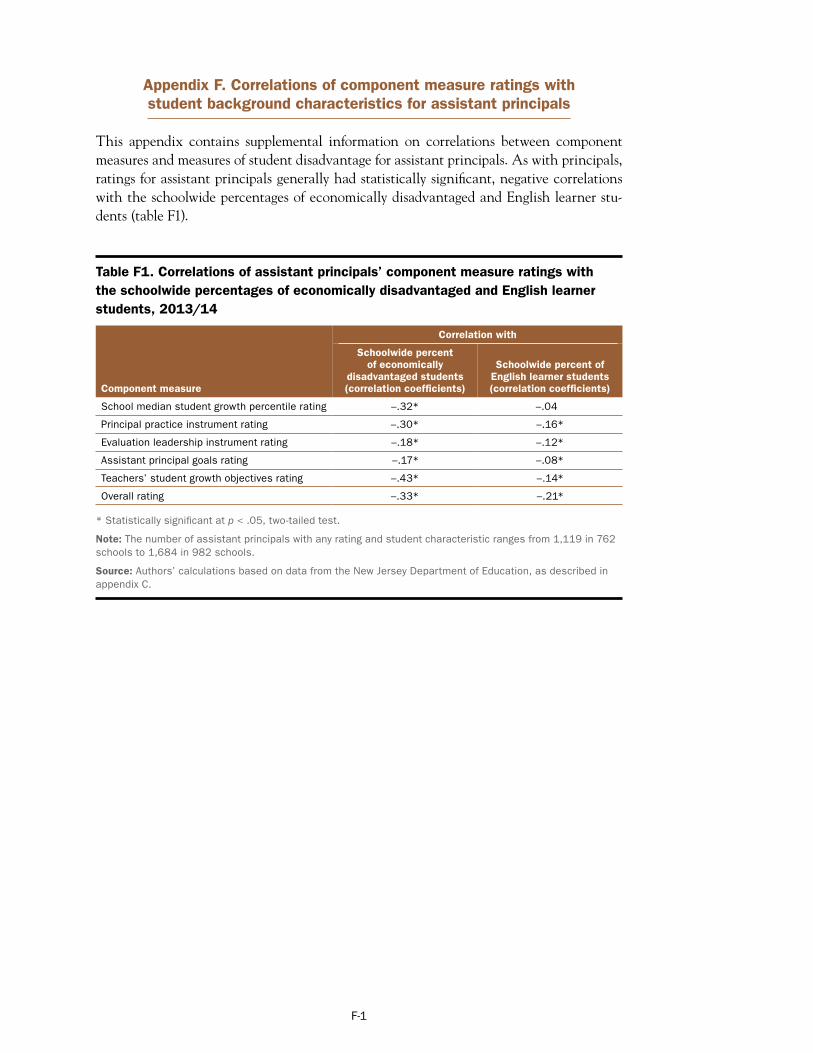
Appendix F. Correlations of component measure ratings with student background characteristics for assistant principals
This appendix contains supplemental information on correlations between component measures and measures of student disadvantage for assistant principals. As with principals, ratings for assistant principals generally had statistically significant, negative correlations with the schoolwide percentages of economically disadvantaged and English learner students (table F1).
Table F1. Correlations of assistant principals’ component measure ratings with the schoolwide percentages of economically disadvantaged and English learner students, 2013/14
Component measure
Correlation with
Schoolwide percent of economically
disadvantaged students (correlation coefficients)
Schoolwide percent of English learner students (correlation coefficients)
School median student growth percentile rating –.32* –.04
Principal practice instrument rating –.30* –.16*
Evaluation leadership instrument rating –.18* –.12*
Assistant principal goals rating –.17* –.08*
Teachers’ student growth objectives rating –.43* –.14*
Overall rating –.33* –.21*
* Statistically significant at p < .05, two-tailed test.
Note: The number of assistant principals with any rating and student characteristic ranges from 1,119 in 762 schools to 1,684 in 982 schools.
Source: Authors’ calculations based on data from the New Jersey Department of Education, as described in appendix C.
F-1

Appendix G. Correlations among component measure ratings for assistant principals
This appendix contains supplemental information on correlations among measures for assistant principals, which were similar to the findings for principals. Correlations for assistant principals show mostly statistically significant, positive relationships among the ratings, though magnitudes varied (table G1). The principal practice and evaluation leadership instrument ratings had the highest correlation of any two components; the school median student growth percentile rating had the lowest correlations with the other components.
Table G1. Correlations of component measures for assistant principals, 2013/14
Component measure
Correlation with
School median student growth
percentile rating
Principal practice
instrument rating
Evaluation leadership instrument
rating
Assistant principal
goals rating
Principal practice instrument rating .15*
Evaluation leadership instrument rating .07* .56*
Assistant principal goals rating .07 .26* .27*
Teachers’ student growth objectives rating .29* .36* .27* .29*
* Statistically significant at p < .05, two-tailed test.
Note: The number of assistant principals with any two ratings ranges from 808 assistant principals in 589 schools to 1,643 assistant principals in 953 schools.
Source: Authors’ calculations based on data from the New Jersey Department of Education, as described in appendix C.
G-1

Notes
1. The study team did not examine year-to-year changes in ratings on the evaluation leadership instrument or teachers’ student growth objectives because these measures were new in 2013/14. Likewise, data on principal goals ratings were reported by only four pilot districts, covering 27 principals in 2012/13, too few to analyze.
2. When movements between the partially effective category and the effective category are considered separately, the percentage of principals rated in the same performance category in both years is slightly lower, and the percentage of principals rated in a worse performance category in 2013/14 is slightly higher.
3. When movements between the partially effective category and the effective category are considered separately, the percentage of principals rated in the same performance category in both years is slightly lower, and the percentage of principals rated in a better performance category in 2013/14 is slightly higher.
4. Measurement error is the difference between a measured value (for example, test score) and the actual value (for example, true achievement). Measurement error can occur for nearly all measures and for a variety of reasons. For school median student growth percentiles, measurement error that causes temporary increases and decreases in the measure can occur if students have a good or bad test day.
5. The standard deviation of school median student growth percentiles was 7.5 in this sample.
6. Application scores were based on ratings of the project description; goals, objectives, and indicators; project activity plan; organizational commitment and capacity; and budget. Application scores were used to rank applicants within their geographic region (Northern, Central, and Southern), and awards were granted based on applicants’ rank within their region subject to applicants attaining a minimum score of 65 points (of a possible 100). The districts that were not selected for the pilot did not attain the minimum score.
Notes-1

References
Betebenner, D. W. (2007). Estimation of student growth percentiles for the Colorado Student Assessment Program. Dover, NH: National Center for the Improvement of Educational Assessment.
Béteille, T., Kalogrides, D., & Loeb, S. (2012). Stepping stones: Principal career paths and school outcomes. Social Science Research, 41(4), 904–919.
Branch, G., Hanushek, E., & Rivkin, S. (2012). Estimating the effect of leaders on public sector productivity: The case of school principals. NBER working paper. Cambridge, MA: National Bureau of Economic Research. http://eric.ed.gov/?id=ED529199
Campbell, D. T. (1976). Assessing the impact of planned social change (Occasional paper no. 8). Hanover, NH: Dartmouth College Public Affairs Center.
Chiang, H., Lipscomb, S., & Gill, B. (in press). Is school value-added indicative of principal quality? Journal of Education Finance and Policy 11(3), 283–309.
Coelli, M., & Green, D. (2012). Leadership effects: School principals and student outcomes. Economics of Education Review, 31(1), 92–109. http://eric.ed.gov/?id=EJ953968
Colorado Department of Education, Accountability and Data Analysis Unit. (2013). Colorado growth model—Brief report: Student growth percentiles and FRL status. Denver, CO: Colorado Department of Education. Retrieved August 7, 2014, from http://www.cde. state.co.us/sites/default/files/CGM_SGP_FRL_Brief.pdf.
Council of Chief State School Officers. (2008). Educational leadership policy standards: ISLLC 2008. Washington, DC: Author. Retrieved August 7, 2014, from http:// www.ccsso.org/Resources/Publications/Educational_Leadership_Policy_Standards _ISLLC_2008_as_Adopted_by_the_National_Policy_Board_for_Educational_ Administration.html.
Dhuey, E., & Smith, J. (2012). How school principals influence student learning. Working paper. Toronto, Canada: University of Toronto. http://eric.ed.gov/?id=ED535648
Dhuey, E., & Smith, J. (2014). How important are school principals in the production of student achievement? Canadian Journal of Economics, 47(2), 634–663.
Goldring, E., Cravens, X. C., Murphy, J., Porter, A. C., Elliott, S. N., & Carson, B. (2009). The evaluation of principals: What and how do states and urban districts assess leadership? Elementary School Journal, 110(1), 19–39. http://eric.ed.gov/?id=EJ851761
Grissom, J. A., Kalogrides, D., & Loeb, S. (2015). Using student test scores to measure principal performance. Educational Evaluation and Policy Analysis, 37(1), 3–28.
Kane, T. J., McCaffrey, D. F., Miller, T., & Staiger, D. O. (2013). Have we identified effective teachers? Validating measures of effective teaching using random assignment. Seattle, WA: Bill & Melinda Gates Foundation.
Ref-1

Kane, T. J., & Staiger, D. O. (2012). Gathering feedback for teaching: Combining high-quality observations with student surveys and achievement gains. Seattle, WA: Bill & Melinda Gates Foundation.
Loeb, S., Kalogrides, D., & Horng, E. (2010). Principal preferences and the unequal distribution of principals across schools. Education Evaluation and Policy Analysis, 32(2), 205–229.
Milanowski, A. T., & Kimball, S. M. (2012). The relationship between standards-based principal performance evaluation ratings and school value-added: Evidence from two districts. Rockville, MD: Westat.
New Jersey Department of Education. (2012a). New Jersey Department of Education approved principal practice evaluation instruments as of December 21, 2012. Trenton, NJ: Author. Retrieved August 7, 2014, from http://www.state.nj.us/education/archive/EE4NJ/ providers/approvedprincipallist.doc.
New Jersey Department of Education. (2012b). Notice of grant opportunity. Trenton, NJ: Author. Retrieved August 7, 2014, from http://www.state.nj.us/education/archive/EE4NJ/ ngo.
New Jersey Department of Education. (2013). Sample administrator template and goals. Trenton, NJ: Author. Retrieved August 7, 2014, from http://www.nj.gov/education/ AchieveNJ/principal/SampleAdministratorGoals.pdf.
New Jersey Department of Education. (2014a). AchieveNJ: Increasing student achievement through educator effectiveness. Trenton, NJ: Author. Retrieved August 7, 2014, from http://www.state.nj.us/education/AchieveNJ/intro/OverviewPPT.pdf.
New Jersey Department of Education. (2014b). New Jersey Department of Education approved principal practice evaluation instruments as of April 15, 2014. Trenton, NJ: Author. Retrieved August 7, 2014, from http://www.state.nj.us/education/AchieveNJ/teacher/ approvedprincipallist.doc.
New Jersey Department of Education. (2014c). User guide for the teacher median student growth percentile report. Trenton, NJ: Author. Retrieved August 7, 2014, from http:// www.state.nj.us/education/AchieveNJ/teacher/percentile/mSGPuserguide.pdf.
New Jersey Department of Education (2014d). 2013–14 Preliminary implementation report on teacher evaluation. Trenton, NJ: Author. Retrieved May 17, 2015, from http://www. nj.gov/education/AchieveNJ/resources/13–14preliminaryteacherevalreport.pdf.
Porter, A. C., Polikoff, M. S., Goldring, E. B., Murphy, J., Elliott, S. N., & May, H. (2010). Investigating the validity and reliability of the Vanderbilt Assessment of Leadership in Education. The Elementary School Journal, 111(2), 282–313. http://eric.ed.gov/ ?id=EJ913211
Ross, C., Herrmann, M., & Angus, M. H. (2015). Measuring principals’ effectiveness: Results from New Jersey’s principal evaluation pilot (Making Connections Report, REL
Ref-2

2015–089). Washington, DC: U.S. Department of Education, Institute of Education Sciences, National Center for Education Evaluation and Regional Assistance, Regional Educational Laboratory Mid-Atlantic. http://eric.ed.gov/?id=ED556130
Teh, B., Chiang, H., Lipscomb, S., & Gill, B. (2014). Measuring school leaders’ effectiveness: An interim report from a multiyear pilot of Pennsylvania’s Framework for Leadership (REL 2015–058). Washington, DC: U.S. Department of Education, Institute of Education Sciences, National Center for Education Evaluation and Regional Assistance, Regional Education Laboratory Mid-Atlantic. http://eric.ed.gov/?id=ED550494
Ref-3

The Regional Educational Laboratory Program produces 7 types of reports
Making Connections Studies of correlational relationships
Making an Impact Studies of cause and effect
What’s Happening Descriptions of policies, programs, implementation status, or data trends
What’s Known Summaries of previous research
Stated Briefly Summaries of research findings for specific audiences
Applied Research Methods Research methods for educational settings
Tools Help for planning, gathering, analyzing, or reporting data or research