measuring financial soundness of indian telecom …theijm.com/april13/217.pdf · rekha pai dealt...
TRANSCRIPT
Vol: 2/Issue :2 (April, 2013) www.theijm.com 1
THE INTERNATIONAL JOURNAL OF MANAGEMENT
Measuring Financial Soundness of Indian Telecom Companies –
A Comparative Analysis
The Indian telecom industry underwent a high pace of market liberalization and growth
since 1990s and now has become the world's most competitive and one of the fastest
growing telecom markets. The Industry has grown over twenty times in just ten years, from
under 37 million subscribers in the year 2001 to over 846 million subscribers in the year
2011. India has the world's second-largest mobile phone user base with over 929.37 million
users as of May 2012. It has the world's third-largest Internet user-base with over 137
million as of June 2012. In relation to the growth and prosperity of telecom sector the study
being conducted to analyze the financial soundness of the companies. A general belief is
that a firm’s operating performance depends on certain key financial factors viz., turnover,
profit, asset utilization etc and the variables which are found in profit and loss account and
balance sheet of a firm have a direct or indirect relation with each other. By establishing a
close relationship between the variables, a firm can analyze its financial performance in
terms of liquidity, profitability, viability and sustainability. In order to measure the
performance, ratios, the indicators, are normally used to identify the financial health of the
firm. So the study concentrates on empirical approach towards measuring financial
soundness of the companies operating under one of the most dynamic sector in Indian
economy to identify key financial attributes of telecom companies and their respective
impact.
Keywords - Efficiency, F-test, Leverage, Liquidity, Profitability, Solvency and Z-score.
Abstract
Dr. Sanjay Pandey
Head-MBA,
Chouksey College of Engineering and Technology,
Bilaspur, CG, India.
Vijay Verma
Assistant Professor – Management, ITM University,
Gwalior, MP, India.
Vikas Jain
Assistant Professor- Management, ITM University,
Gwalior, MP, India.
ISSN 2277-5846
ISSN 2277 – 5846I
ISSN 2277 - 5846
2277 - 5846

THE INTERNATIONAL JOURNAL OF MANAGEMENT
Vol: 2/ Issue : 2 (April, 2013) www.theijm.com 2
1. Introduction:
The India's telecommunication network is the second largest in the world based on the total number
of telephone users (both fixed and mobile phone). It has one of the lowest call tariffs in the world
enabled by the mega telephone networks and hyper-competition among them. It has the world's
third-largest Internet user-base with over 137 million as of June 2012. Major sectors of the Indian
telecommunication industry are telephony, internet and television broadcasting.
Telephone Industry in the country which is in an ongoing process of transforming into next
generation network, employs an extensive system of modern network elements such as
digital telephone exchanges, mobile switching centers, gateways and signaling gateways at the core,
interconnected by a wide variety of transmission systems using optical fibre or Microwave radio
relay networks. The access network, which connects the subscriber to the core, is highly diversified
with different copper-pair, optic-fibre and wireless technologies. DTH, a relatively new broadcasting
technology has attained significant popularity in the Television segment. The introduction of private
FM has given a fillip to the radio broadcasting in India . Telecommunication in India has greatly
been supported by the INSAT system of the country, one of the largest domestic satellite systems in
the world. India possesses a diversified communications system, which links all parts of the country
by telephone, Internet, radio, television and satellite.
The total revenue of the Indian telecom sector grew by 7% to 283,207 crore (US$51.54 billion) for
2010–11 financial year, while revenues from telecom equipment segment stood at
117,039 crore (US$21.3 billion).
Telecommunication has supported the socioeconomic development of India and has played a
significant role to narrow down the rural-urban digital divide to some extent. It also has helped to
increase the transparency of governance with the introduction of e-governance in India. The
government has pragmatically used modern telecommunication facilities to deliver mass education
programmes for the rural folk of India.
In India both public sector and private sector shares substantial stake in telecom sector, generally the
new private player requires a high degree of asset allocation and heavy working capital and existing
ones allocates heavy funds for sustaining and improving their market share. As the industry calls for
huge fund allocation which makes necessary for the companies to manage all financial affairs in well
structured and organized manner to activate the dormant financial allocations, financing the deficit or
disposal of surplus. The major factors have been identified as reason for affecting financial
performance of telecom companies are –

THE INTERNATIONAL JOURNAL OF MANAGEMENT
Vol: 2/ Issue : 2 (April, 2013) www.theijm.com 3
Heavy capital investment.
High collection period.
Frequent policies from the side of government which fails forecasting and
estimations.
Substantial investment in after sales services.
The above are the some key variables along with them high research and development expenditures,
continuous innovation expenditures, modification expenditures, etc thrashes the solvency and
profitability the companies. Therefore application of adequate financial management is must manage
and control the flow of funds efficiently which helps the organizations to improve their solvency,
profitability and performance.
2. Statement Of The Problem:
Generally in a lot of sectors it is visible that private sectors utilizes funds in better manner as
compare to public sector, the study is an effort to draw appropriate conclusion. In India telecom
industry represents an integral part of Indian economy. Since the industry faces ups and downs over
the period of time, the companies in the industry have reported reduction in profit and in some rare
cases even loss. As and when the industry is caught in a vicious down cycle, the firms have rendered
operations unviable and they face threats to their viability and sustainability which directly impacts
their financial health and if the problem didn‟t get checked with in the given timeframe by applying
adequate financial management tool so it definitely affects the organization from its depth.
3. Literature Review:
A non-systematic literature review was undertaken to identify the financial ratios included in articles
in peer-reviewed journals, industry publications, and articles in magazines and newspaper.
To identify ratios in peer-reviewed articles, searches of academic databases using keywords such as
“financial management”, “Solvency”, “profitability and liquidity” and “ratio analysis” were
undertaken. Articles published prior to 1995 were excluded from the searches in order to ensure that
only the most recent studies were included. This exclusion was important because of the many
changes in telecom since 1995 and the likely lower relevance of articles prior to these changes.
Ratios were selected from the articles if results showed that they were statistically significant in
explaining a dimension of Telecom Company‟s financial performance, such as profitability or

THE INTERNATIONAL JOURNAL OF MANAGEMENT
Vol: 2/ Issue : 2 (April, 2013) www.theijm.com 4
financial distress. To identify ratios in industry publication, the websites of various organizations
were reviewed. Some of the major literature reviewed is –
Lazaridis and Tryfonidis (2006) conducted a cross sectional study by using a sample of 131firms
listed on the Athens Stock Exchange for the period of 2001-2004 and found statistically significant
relationship between profitability, measured through gross operating profit and cash conversion cycle
and its components. Based on the results analysis of annual data by using correlation and regression
tests, they suggest that managers can create profits for their companies by correctly handling the cash
conversion cycle and by keeping each component of the conversion cycle at an optimum level.
Garcia-Terual et al (2007) collected a panel of 8872 small to medium-sized enterprises from Spain
covering the period 1996-2002. They tested the effects of working capital management on SME
profitability using the panel data methodology. The results, which are robust to the presence of
endogeneity, demonstrated that managers could create value by reducing their inventories and the
number of days for which their accounts are outstanding. Moreover, shortening the cash conversion
cycle also improves the firm‟s profitability.
Mathuva (2009) examined the influence of working capital management components on corporate
profitability by using a sample of 30 firms listed on Nairobi Stock Exchange for the periods 1993-
2008. He used Pearson and Spearman‟s correlations, the pooled ordinary least squares and the fixed
effects regression models to conduct data analysis. The key findings of his study were that there
exists a highly significant negative relationship between the time it takes for firms to collect cash
from their customers and profitability, there exists a highly significant positive relationship between
the period taken to convert inventories to sales and profitability and there exists a highly significant
positive relationship between the time it takes for firms to pay its creditors and profitability.
Praveen kataria in his study attempted to predict corporate sickness of the companies. Financial
information about all the sick companies was collected for five years before sickness. Healthy
companies were matched with the sick companies on the basis of industry composition size. 54
financial ratios and 8 macro economic variables were taken to study their effect along with financial
ratios. Two group linear discriminate analyses were applied in two parts. In the first part, only
financial ratio was taken in discriminate analysis, while the macroeconomic variable was included
along with the financial ratios in the second part. The result showed that macroeconomic variable
had very little impact on discriminate function.
THE INTERNATIONAL JOURNAL OF MANAGEMENT
Vol: 2/ Issue : 2 (April, 2013) www.theijm.com 5
Rekha Pai dealt with the prediction of industrial sickness using multiple discriminate analyses.
The data set constitutes 21 financial ratios of 34 Indian sick companies in 200001 and 38
contemporary non sick companies, both selected irrespective of size and industry category 3 years
prior to sickness. The multiple discriminate analyses (MDS) showed greater accuracy in predicting
industrial sickness up to three years in advance. The model was validated further using a test model,
while exhibited very high predictive accuracy of the proposed model.
Berryman, (1983) indicated that „poor‟ or „careless‟ financial management is a major cause of small
business failure. In addition, a major survey by the Insolvency Practitioner Society, (CIMA 1994)
indicated that 20% of UK corporate failures (the vast majority of which are small firms) were due to
bad debts or poor credit management. According to Peel and Wilson (1994), “if the
financial/working capital management practices in the small firm sector could be improved
significantly, then fewer firms would fail and economic welfare would be increased substantially”.
4. Objectives Of The Study:
The main object of the present study is to examine the overall financial efficiency of the selected
telecom companies. More specifically it seeks to dwells upon mainly the following issues:
To assess the liquidity management efficiency;
To know the deviation in private and public sector telecom companies, if any.
To observe the financial performance position and areas of weakness, if any;
To investigate the relationships between liquidity and solvency.
5. Hypotheses Of The Study:
The study has pursued to test the following hypothesis with reference to steel industry in India:
Hypothesis –
H0: Current asset to current liability ratio is uniform in the sample units
H0: Fixed Asset to total turnover ratio is uniform in the sample units
H0: Debt to equity ratio is uniform in the sample units
H0: Return on equity is uniform in the sample units.

THE INTERNATIONAL JOURNAL OF MANAGEMENT
Vol: 2/ Issue : 2 (April, 2013) www.theijm.com 6
6. Methodology Of The Study:
6.1. Data Set:
The data used in the present study was acquired from CMIE database. The analysis is based on
financial statements of the four telecom companies (both private and public) of our economy.
6.2. Variables :
The present study carries out the issue of recognizing key variables that influence financial
performance. All the variables stated below have been used to test the hypotheses of study.
6.3. Tool Used For Analysis:
6.3.1. F-TEST:
In analysis of variance, an F-test is used to test group variance against a null hypothesis, and is often
used to determine whether any group of trials differs significantly from an expected value.
Test of Hypotheses - I
YEAR BSNL RELIANCE AIRTEL MTNL
2008 1.13 0.404746 0.1356531 0.090330054
2009 2.24 0.806192 0.1575183 0.153128066
2010 2.37 0.363039 0.1685043 0.05724431
2011 2.38 0.393135 0.199938 0.180019476
2012 1.89 0.206129 0.2446844 0.219203697
MEAN 2.002 0.434648 0.18126 0.139985
Table 1: Current Ratio
Above table depicts that over the course of five financial periods of study the mean of Current
Ratio in BSNL is higher (2.002 times) than others. This shows that BSNL have sufficient current
assets to meet short term operating needs, but even though we can‟t claim it as an good position
as current ratio of 2.02 times is much more than the standardized degree and leads to increase in
the volume of dormant or non performing funds.
Now we apply f-test, so;
Grand mean X = 2.002+0.434648+0.18126+0.139985 = 0.68947325

THE INTERNATIONAL JOURNAL OF MANAGEMENT
Vol: 2/ Issue : 2 (April, 2013) www.theijm.com 7
(Mean-
grandmean)2
(Mean-
grandmean)2
(Mean-
grandmean)2
(Mean-
grandmean)2
1. 1.722726 0.06493590 0.258281 0.301937
2. 1.722726 0.06493590 0.258281 0.301937
3. 1.722726 0.06493590 0.258281 0.301937
4. 1.722726 0.06493590 0.258281 0.301937
5. 1.722726 0.06493590 0.258281 0.301937
total 8.61363230 0.324679540 1.291404 1.509687
Table 2: Variance between samples
Sum of squares between samples = 11.73940287
1 0.760384 0.000894142 0.002079955 0.002465626
2 0.056644 0.138044795 0.00056365 0.000172737
3 0.135424 0.005127878 0.000162698 0.006846042
4 0.142884 0.001723346 0.000348882 0.00160275
5 0.012544 0.052221025 0.004022703 0.006275583
total 1.10788 0.198011185 0.007177888 0.017362737
Table 3: Variance within samples
Sum of variance within samples= 1.33043181
Source of variation Sum of squares Degree of freedom Mean square
Between 11.73940287 3 3.913134289
Within 1.33043181 16 0.083151988
Table 4: Analysis of variance
F = Mean square between the sample
Mean square within the sample
F = 47.0600208
Interpretation: calculated value is more than the table value (3.23) at 5 % significance level. So
Hypothesis is rejected.
THE INTERNATIONAL JOURNAL OF MANAGEMENT
Vol: 2/ Issue : 2 (April, 2013) www.theijm.com 8
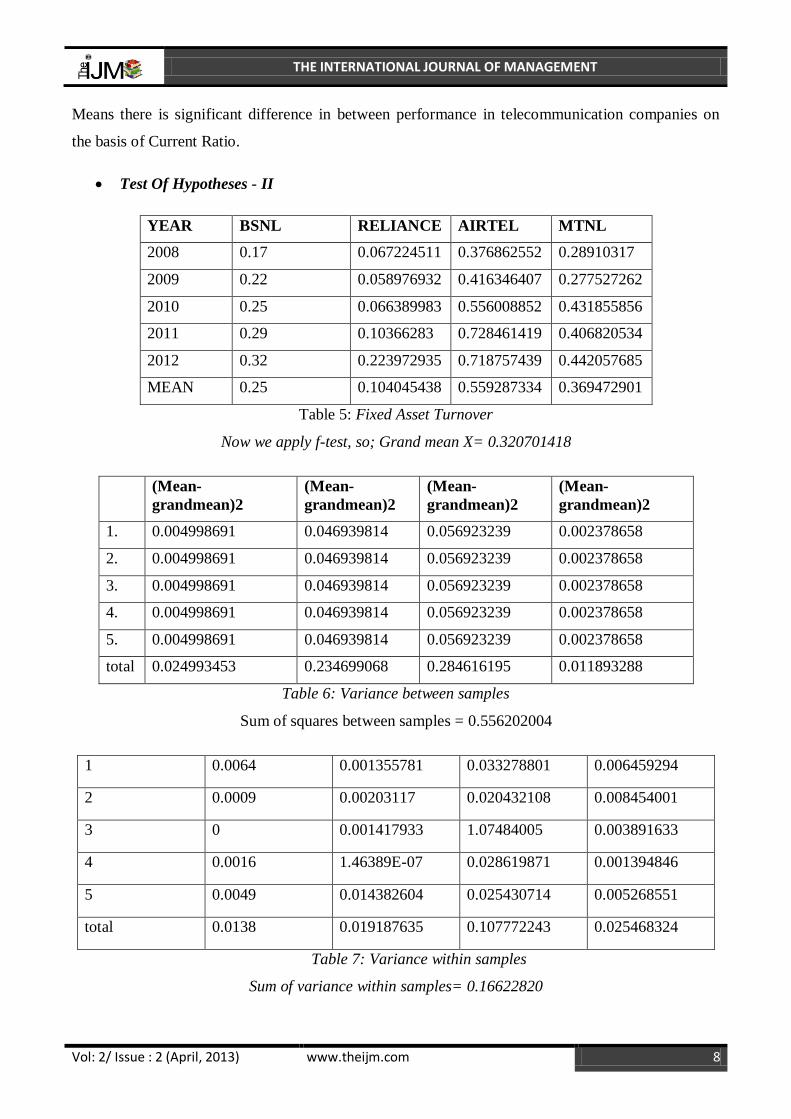
Means there is significant difference in between performance in telecommunication companies on
the basis of Current Ratio.
Test Of Hypotheses - II
YEAR BSNL RELIANCE AIRTEL MTNL
2008 0.17 0.067224511 0.376862552 0.28910317
2009 0.22 0.058976932 0.416346407 0.277527262
2010 0.25 0.066389983 0.556008852 0.431855856
2011 0.29 0.10366283 0.728461419 0.406820534
2012 0.32 0.223972935 0.718757439 0.442057685
MEAN 0.25 0.104045438 0.559287334 0.369472901
Table 5: Fixed Asset Turnover
Now we apply f-test, so; Grand mean X= 0.320701418
(Mean-
grandmean)2
(Mean-
grandmean)2
(Mean-
grandmean)2
(Mean-
grandmean)2
1. 0.004998691 0.046939814 0.056923239 0.002378658
2. 0.004998691 0.046939814 0.056923239 0.002378658
3. 0.004998691 0.046939814 0.056923239 0.002378658
4. 0.004998691 0.046939814 0.056923239 0.002378658
5. 0.004998691 0.046939814 0.056923239 0.002378658
total 0.024993453 0.234699068 0.284616195 0.011893288
Table 6: Variance between samples
Sum of squares between samples = 0.556202004
1 0.0064 0.001355781 0.033278801 0.006459294
2 0.0009 0.00203117 0.020432108 0.008454001
3 0 0.001417933 1.07484005 0.003891633
4 0.0016 1.46389E-07 0.028619871 0.001394846
5 0.0049 0.014382604 0.025430714 0.005268551
total 0.0138 0.019187635 0.107772243 0.025468324
Table 7: Variance within samples
Sum of variance within samples= 0.16622820

THE INTERNATIONAL JOURNAL OF MANAGEMENT
Vol: 2/ Issue : 2 (April, 2013) www.theijm.com 9
Source of variation Sum of squares Degree of freedom Mean square
Between 0.556202004 3 0.185400668
Within 0.166228202 16 0.010389263
Table 8: Analysis of variance
F = Mean square between the sample
Mean square within the sample
F = 17.8454116
Interpretation: calculated value is more than the table value (3.23) at 5 % significance level.
Than Hypothesis is rejected so, there is significant difference in between performance in
telecommunication companies on the basis of Fixed Asset Turnover.
Test Of Hypotheses – III
YEAR BSNL RELIANCE AIRTEL MTNL
2008 0.11 27.00678295 7.441226037 15.31347619
2009 0.13 30.47716592 6.265799452 11.8344127
2010 0.13 23.71903373 2.653781132 0
2011 0.16 29.94506836 4.063579948 0
2012 0.2 19.65720293 3.461881754 0
MEAN 0.146 26.16105078 4.777253665 5.429577778
Table 9: Debt to Equity ratio
Now we apply f-test, so; Grand mean X= 9.128470555
(Mean-
grandmean)2
(Mean-
grandmean)2
(Mean-
grandmean)2
(Mean-
grandmean)2
1. 80.68477727 290.1087891 18.93308843 13.68180778
2. 80.68477727 290.1087891 18.93308843 13.68180778
3. 80.68477727 290.1087891 18.93308843 13.68180778
4. 80.68477727 290.1087891 18.93308843 13.68180778
5. 80.68477727 290.1087891 18.93308843 13.68180778
total 403.4238864 1450.543945 94.66544214 68.40903889
Table 10: Variance between samples
Sum of squares between samples = 0.29707783

THE INTERNATIONAL JOURNAL OF MANAGEMENT
Vol: 2/ Issue : 2 (April, 2013) www.theijm.com 10
1 0.001296 0.715262899 7.096748803 97.69144783
2 0.000256 18.62884991 2.215768562 41.02191036
3 0.000256 5.963447262 4.509135597 29.48031484
4 0.000196 14.31878907 0.509330174 29.48031484
5 0.002916 42.30003678 1.730203263 29.48031484
total 0.00492 81.92638592 16.0611864 227.1543027
Table 11: Variance within samples
Sum of variance within samples= 325.146795
Source of variation Sum of squares Degree of freedom Mean square
Between 2017.042313 3 672.3474376
Within 325.146795 16 20.32167469
Table 12: Analysis of variance
F = Mean square between the sample
Mean square within the sample
F = 33.0852377
Interpretation: calculated value is more than the table value (3.23) at 5 % significance level.
Than Hypothesis is rejected, as there is significant difference in between performance in
telecommunication companies on the basis of Debt to Equity ratio.
Test Of Hypotheses – IV
YEAR BSNL RELIANCE AIRTEL MTNL
2008 -0.36453 0.151162791 3.017695387 -6.523460317
2009 0.11497 -0.734479317 4.064093111 -4.447492063
2010 0.601878 0.464074961 4.964345339 -4.86315873
2011 1.561174 4.653704906 4.079484154 0.267190476
2012 1.787938 2.506225715 3.290034828 0.645746032
MEAN 0.740286 1.408137811 3.883130564 -2.984234921
Table 13: Return on Equity
Now we apply f-test, so; Grand mean X= 0.761829864

THE INTERNATIONAL JOURNAL OF MANAGEMENT
Vol: 2/ Issue : 2 (April, 2013) www.theijm.com 11
(Mean-
grandmean)2
(Mean-
grandmean)2
(Mean-
grandmean)2
(Mean-
grandmean)2
1. 0.000464138 0.417713963 9.742518061 14.03300137
2. 0.000464138 0.417713963 9.742518061 14.03300137
3. 0.000464138 0.417713963 9.742518061 14.03300137
4. 0.000464138 0.417713963 9.742518061 14.03300137
5. 0.000464138 0.417713963 9.742518061 14.03300137
total 0.00232069 2.088569815 48.71259031 70.16500684
Table 14: Variance between samples
Sum of squares between samples = 120.9684876
1 1.220618394 1.579986202 0.748978046 12.52611641
2 0.3910201 4.590808157 0.032747444 2.141121466
3 0.019156774 0.891254666 1.169025391 3.530354682
4 0.673857109 10.53370577 0.038554732 10.57176711
5 1.097574713 1.205797045 0.351762552 13.17676171
total 3.40222709 18.80155184 2.341068165 41.94612138
Table 16: Variance within samples
Sum of variance within samples= 66.4909
Source of variation Sum of squares Degree of freedom Mean square
Between 120.9684876 3 40.32282922
Within 66.49096848 16 4.15568553
Table 17: Analysis of variance
F = Mean square between the sample
Mean square within the sample
F = 9.70305114
Interpretation: calculated value is more than the table value (3.23) at 5 % significance level.
Than Hypothesis is rejected, as there is significant difference in between performance in
telecommunication companies on the basis of RETURN ON EQUITY.
7. Conclusion:
Financial management is of crucial importance in management decision making. The optimal of
financial soundness is could be achieve by company that manage the tradeoff between liquidity and

THE INTERNATIONAL JOURNAL OF MANAGEMENT
Vol: 2/ Issue : 2 (April, 2013) www.theijm.com 12
solvency management. The purpose of this study is to investigate the effective liquidity management
to support companies while meeting its short term operational or working requirements where as
analysis of solvency, fixed assets and return on equity concentrates on long term performance. A
descriptive statistics discloses that liquidity and solvency position in both long and short term is very
dissatisfactory and companies soon have to opt for its correction. F-tests confirm a lower degree of
association between and within financial variables. Thus, company manger should concern on
financial management, especially unexplained variables in purpose of creation shareholder wealth.

THE INTERNATIONAL JOURNAL OF MANAGEMENT
Vol: 2/ Issue : 2 (April, 2013) www.theijm.com 13
References
1. Abhulimen, R.A. and Chibuike U.U.(2002). Research design and implementation in accounting
and finance, university of Benin Press.
2. Pandey,I.M.(1995), Financial Management-eight edition.
3. Nimi, W. 1995. Financial statement Analysis spectrum Books. Lbadan.
4. Altman,(1968). “Financial ratio discriminate analysis and prediction of corporate bankruptcy”,
Journal of finance.
5. Abdul Aziz, (1984). “Bankruptcy prediction and investigation of cash flow based models”, PhD.
Thesis at Dallas, 3 – 9.
6. Beaver, W.H., (1966). “Financial ratios and predictions of failure: Empirical research in according
selected studies”, Journal of accounting research.
7. Ben Kwame Agyei-Mensah, (2010). “Financial management practices of small firms in Ghana:
An empirical study”, African Journal of Business Management Vol.5 (10)