measures of level of customer satisfaction in local ... 18th folder/11joan.pdfcustomer satisfaction...
TRANSCRIPT

95
MEASURES OF SERVICE QUALITY BETWEEN LOCAL GOVERNMENT
UNITS OF ANGELES AND SAN FERNANDO IN THE PROVINCE OF
PAMPANGA, PHILIPPINES:
ITS IMPLICATIONS TO CONSTITUENTS’ SATISFACTION
JOAN C. REYES
Ph.D. in Business Student, Decision Sciences and Innovation Department
College of Business, De La Salle University, Taft, Manila, Philippines
Email address: [email protected]
Abstract
This research aims to measure the service quality of local government units of Angeles
and San Fernando in the Province of Pampanga to determine their constituents’ level of
satisfaction. There were a total of 102 renewal-respondents of the Business Permit and
Licensing Department who participated in the survey of service quality. The statistical
methods used were mean rating, correlational and t-test which were able test the null
hypotheses; to wit: there is no positive relationship between dimensions of service
quality and constituents’ satisfaction and there is no significant difference on the
perception of service quality between local government units of Angeles and San
Fernando. Both local government units found reliability, assurance and empathy having
very strong linear relationship with constituents’ satisfaction while responsiveness and
tangibles established strong linear relationship with constituents’ satisfaction. Since the
dimension assurance established the highest degree of correlation among the local
government units’ service quality, it has found the said dimension plays the best predictor
of constituents’ satisfaction for both local government units. The perceptions of
respondents of both local government units do not have significant difference on service
quality being rendered. The ratings given by respondents on service quality being
rendered by local government units of Angeles and San Fernando are ranging from
satisfactory to very satisfactory, hence, the said ratings shall serve as eye opener for
Angeles and San Fernando local government units to improve their services and must not
be complacent with the evaluations they have now. It is the duty of the government to
serve their taxpayers and they, therefore, deserve excellent performance.
Keywords: Service quality, reliability, responsiveness, assurance, empathy, tangibles,
and constituents’ satisfaction.
Service quality is a vital strategy for success and
survival in today’s aggressive environment. It is
very important for the employees to be reliable
and dependable in order to gain the trust of the
public. They should render quality service and
have a commitment to be accountable to
customers and compete for their satisfaction and
loyalty. It can identify some issues like meriting

96
attention, understanding the concept and also
analyzing how to measure service quality.
Employees must offer delivery services
beneficial to their clienteles and the actions of
the service being provided, and then use that
knowledge for planning purposes. The
application of service quality concepts
encourages service improvements and reduces
costs. Also, employees must have interest to
those clients who give information about their
perceptions regarding the service they receive so
that the employees can establish personal contact
with them and make a long-term commitment or
relationship to the clients. Clients should
provide feedbacks to the organizations and be
reacted as opportunities for improvements and to
raise overall customers satisfaction
(Parasuraman, et al., 1990).
Customer satisfaction in market-
oriented business organizations is considered as
an important factor in continuance of business. It
serves as a lifeline for their survival, helps to
stay in the competition as well as improve and
built market share. In contrast with public sector;
profit is not a motive, but this does not mean that
customer satisfaction will be treated unimportant
and be ignored. According to literatures,
engaging in activities to increase the user
satisfaction can build public trust or confidence;
promote integrity and accountability in local
government. These activities clearly take in
consideration the desire to get better value for
taxpayer’s money or better allocation of
resources in public sectors. For this reason, the
government needs to deliver high quality
services to its constituents. There is a need to
exert an effort to evaluate the consistency in
satisfaction at any levels of service in order to
identify deficiency or failing points in the
process of service they are delivering at.
Generally, it is evident that the job and
the responsibility of the government are to
decide the kind and levels of service that must be
rendered to citizens to fit in the systems. It would
be beneficial for businesses if the government
have systematic process that is strongly
committed in providing service quality as
government primary objective is to lessen the
cost impact of compliance in government
policies prior to the operations or existence of
any business. Directing business to appropriate
channels and the integration of necessary
instruments to complete the process put
businesses in an easy start-up. Also, these
improvements can alter the negative attitude
business community is holding in any public
services (Vincent & Zhu, 2004). This
justification has led the government to become
more customer-focused. In order to respond to
this need, the authority may need to adapt
business attitude towards customers, to view
citizens differently, this time as clients and
customers (Brilliantes, 2003).
Angeles City and City of San Fernando
in the Province of Pampanga is the focus of this
study which both have visible and active
trading. There are multi-national industries,
technology and services industries like BPOs,
shopping malls and other industries. Both cities
provide an attractive environment that businesses
seeing as a good business venture, thus, adds
vitality to the growing economy of the province.
One program they have is the Business Permit
and Licensing division (BPLD) - Business One
Stop Shop (BOSS). In order to attract investors
in the city, the local government should address
and systematize the requirements needed to start
the business. BPLD-BOSS aims to streamline
this business permit process with systematic
implementation. The Local Government Units of
Angeles and San Fernando are one of the
pioneers of this business process in Region
3.This program is a flagship project of Central

97
Luzon Growth Corridor Foundation Incorporated
(CLGCFI), in cooperation with the Department
of Trade and Industry (DTI) and the Department
of Interior and Local Government (DILG).
Business Permit and Licensing involve tax
computations, processing the applications with
usual filling-up of forms that end up having
voluminous records. Its objective is to streamline
procedures on the issuance of mayor’s permit;
through monitoring the turn-around time or what
we see as filling- up the forms, pass it in the
counter and forward it to the next required
process, monitor the quality through collecting
client feedback and opinions, internal monitoring
system and organizational development. There is
more simplified registration, reduced numbers of
steps and procedures and less process time and
cost. The fundamental of the quality of this
process is based from ISO 9001:2008 or the
International Organization for Standardization
which is used by the LGUs’ Quality
Management Systems (QMS) Office.
Satisfaction requires moment of truth or
experience the service before evaluating how
satisfied the recipient of service is. According to
Lovelock and Wirtz (2008), satisfaction is a
positive disconfirmed expectation while Palmer
(2011) stated that it is a post –consumption
experience that compares perceived quality with
expected quality. Moreover, Baran, Galka and
Strunk (2008) argued that satisfaction can be
broadly characterized as a post-purchased
evaluation of product quality given pre-purchase
expectations. And the customer satisfaction will
depends on the confidence in quality of service.
Along with, Like, Taiwo, Salim and
Downe (2011) described conceptualization of
customer satisfaction can be either transaction-
specific satisfaction or cumulative satisfaction.
That customer evaluates the service and
determines their satisfaction the first time they
encounter it. However, for repeated customers
evaluate their satisfaction from the first time they
have tried the service to date.
In government perspectives, engaging
in customer satisfaction survey will help to get
the best available information by knowing their
opinions and perceptions, understand the impact
of alternative options whether this would or
would not meet their needs and to reduce the risk
if not risk-free of unforeseen consequences
(Bourgogne, 2007). Furthermore, public
agencies asked questions directly about how the
service was delivered during actual encounters
(MORI Review, 2002). On the contrary, EUPAN
or the European Public Administration Network
(2008) emphasized that citizen survey
satisfaction assessed the appropriation of certain
activities or its irrelevance in achieving the
bottom line. With regards to users of Business
Process and Licensing, they are not only
customers of the public service but also citizens
experiencing and judging the service.
Manzin, Zurga and Mrak (2012) cited
the different relations between the State and
customers of administration (Shand and Amberg,
1996) are taxpayers and regulated subjects.
Customers recognized that they have clear
obligations towards the tax administrations but
by large, they expect a certain level of service or
help that would aid them in carrying out their
duties. Customers legally defined obligations,
they are aware that businesses are subject to
inspection but customers expect suitable and
prompt activities by regulators or government.
With these, government then needs to guide and
inform customers how they will carry and
perform their obligation in the process of service.

98
As a response, the government must
seek ways to improve the services they provide
in order to meet the expectations of their
constituents. It adapts and updates its processes
in administering public service in order to build
trust towards its consumer. Bal, et al. (2011)
cited that people with low levels of trust will be
more easily triggered by negative events.
Cheema and Popovski (2010) expressed that it
would be gradual and troublesome to recover the
trust in public policy and institutions. It will
negatively affect or influence their credibility
and may somehow escalate and view as a whole
for public service. There is a need for the
government to revitalize local services, increase
administrative performance, and to develop
competitive, knowledgeable local officials and
personnel. Changes and development in the
commercial sector, advancement of technology
has also created pressure to public sector as
constituents are more interested into a fast
reliable performance when availing type of
service process the government is performing.
Customer perceived service as an
experience and service quality holds good for the
experience and evaluation of quality. Palmer
(2011) mentioned five identified principal
dimensions that customers use to judge service
quality and these are reliability, responsiveness,
assurance, empathy, and tangibles. According to
him it is applicable across a broad range of
service industries to better understand the
expectations and perceptions of their customers
in the service quality. This will help service
provider to figure out whether the current service
meets their customer expectation and satisfies
them. Below is the theoretical framework of
service quality management with respect to the
present study:
Figure 1. Dimensions of Quality Service
According to Sullivan (2007) reliability
is consistency of the system or component to
perform what has been stated and promised
under specified situations and time. While David
and Heinelle (2003) argued that reliability relates
to the ability to perform the promise service
dependably and accurately. It refers to the public
confidence that the administration and staff will
fulfill their promises. The two local government
units have to keenly monitor that the system they
currently using is performing well. In an article
published by International Finance Corporation
Reliability
Assurance
Tangibles
Empathy
Responsiveness
Quality
of
Service

99
(2011), it is stated that in business process
streamlining, procedures will be consolidated
into a single access point. It promised desirable
results for clients not just saving time and money
but also increase transparency as clients see all
the procedures being implemented. Reduced
minimum capitals bring convenience to
entrepreneurs and investors who want to start a
business and need access from the local
government. Government also used technology
to boost the process efficiency and accountability
which is also time and documented. The process
for Business Permit and Licensing Procedure is
shown below.
Figure 2. Local Government Units BPLD Procedure
Responsiveness is about timely delivery
of service. It refers to the readiness or
preparedness of the employees to provide service
in a timely manner (Srinivasan, 2009) and the
helpfulness of employees. According to Kheng,
Mahamad, Ramya and Mosahab (2010) waiting
time affects the customer’s satisfaction which
the staff would tell customers when services
would be performed so they wouldn’t spend too
much time waiting without knowing what to do
next. Delaying or receiving the service at a later
time would create dissatisfaction to clients even
though they still received the service. Grönroos
(2007) mentioned that employees must be
cautious in service encounter. He emphasized
how dissatisfaction can cause negative effects on
service delivery which customers would not
appreciate the quality of service to be rendered
by the local government units.
According to Pizam (2010) assurance is
the employees’ knowledge, skills, courtesy and
the ability of the firm and employees to inspire
trust and confidence. Although, automated
processes can make an impact, services are still
labor intensive, thus, subjective to human – error
and discrepancy. Manzin, Zurga and Mrak
(2012) stated that procedures and employees
exert greatest influence on the general
assessment of service quality. Lovelock and
100
Wirtz (2008) suggested that highly motivated
people are at the core of service excellence.
Local Government Units of Angeles and San
Fernando should employ activities for staff to be
well- trained and informed with their role
technically and functionally so that they will
build trust and confidence serving their
customers. If they feel uncertain with them,
perceived risk would be high and may affect the
customer satisfaction towards the service. It may
also bring hesitation whether to avail the service
again or to postpone it.
Similarly, in a survey conducted by the
State of Queensland, Australia (2010), people
who were more educated and who reported a
recent positive experience with local government
employees were more likely to have favorable
perceptions of local government than people who
were less educated or who reported a recent
negative experience. Beatson, Ling and
Gudergan (2008) stated that perceived employee
satisfaction, perceived employee loyalty and
perceived employee commitment had a sizable
impact on perceived service quality. And
because service delivery occurs during
interactions of customers and employees or what
service quality gurus called the moment of truth,
employees can influence customer’s perceptions
of service quality. So doing things right the first
time really matters.
Empathy is the ability to show caring,
individualized attention to customers (David, &
Heinelle, 2003). Loke, Taiwo, Salim and Downe
(2011) suggested that customer service agents’
need training and performance for efficient
service. Also, building rapport or customer
relationship and other form of relational
elements allowing them to realize and articulate
client needs. This means that frontline staff of
Business Permit and Licensing Department of
Local Government Units should put into
consideration in making customers feel that their
cooperation matters in the completion of service
delivery. Although the service is an obligatory
task-consumption type of service, the willingness
of employees to provide assistance,
individualized treatment of customers while
performing their task professionally may
encourage the customers shaping a positive
perception to customer’s mind, attract them to
continually do their obligation to the
government. On the other hand, the lack of
continuity in relationship with customers in
performing the service may cause dissatisfaction
on their part as they might feel that employees
are unhelpful.
Tangibles are very important to
customers of public organizations (Ilhaamie,
2010). Because service is intangible, users rate
the service by its tangible elements. Kheng,
Mahamad, Ramaya, and Mosahab (2010)
mentioned that it is the physical facilities,
equipment and appearance of personnel. Wright,
Hines and Hyde (2011) cited that it also refers to
the communication materials services are using.
Government entities find it necessary to
modernize their administrative process (Saha,
2008) and this is clearly visible with the physical
elements for Business Licensing and Permit
Department. The use of technologies, computer-
based inputs and computations along with other
processes such as downloadable forms for
applying Mayor’s permit for business operations.
Despite these changes, customer satisfaction
does not end with all these characteristics
mentioned. Uncomfortable waiting area and
unclean place is a no for every customer and may
interrupt them from participating in the delivery
of service. Unpleasant smell, cluttered artifacts
or posters which are unnecessary yet can be seen
in every corner may perceive by customers as
mess.
101
In the same way, communication
materials should also be clear and can easily be
understood, hence, will not create dilemma to
users. The Local Government Unit used flow
charts or diagram representation of the individual
process that explicitly informs the applicants on
the necessary documents needed to avail the
service. In one study of Center for the Study of
Social Policy for consumer satisfaction, quoted
Mary Malone (p15, 2007) that “behavioral
change requires standards not suggestions”. An
organization can develop consistency by “clearly
communicating what is expected and, based
upon those expectations, reinforce positive
behaviors and hold employees accountable for
sub-standard service delivery.” Providing this
information in written format, the do’s and
don’ts would help avoiding psychological shock
that may lead to dissatisfaction. This may also
help eradicate unnecessary demands or wants of
customers in availing the service as they are
provided with standards.
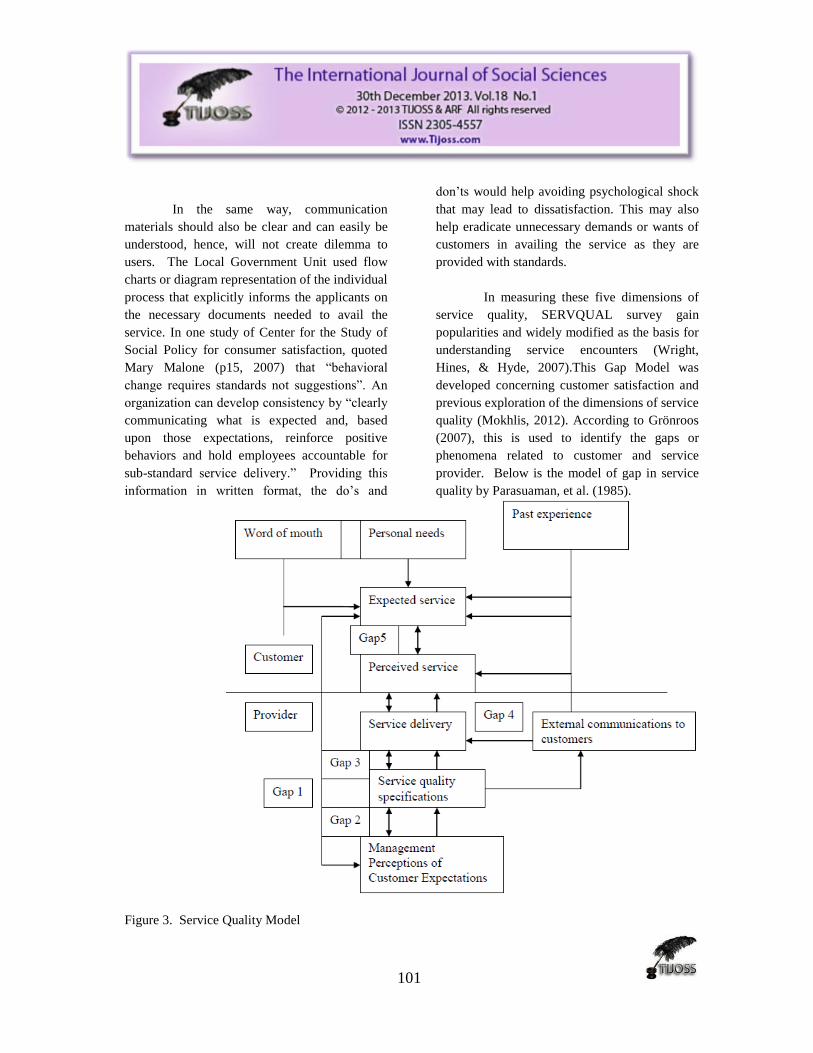
In measuring these five dimensions of
service quality, SERVQUAL survey gain
popularities and widely modified as the basis for
understanding service encounters (Wright,
Hines, & Hyde, 2007).This Gap Model was
developed concerning customer satisfaction and
previous exploration of the dimensions of service
quality (Mokhlis, 2012). According to Grönroos
(2007), this is used to identify the gaps or
phenomena related to customer and service
provider. Below is the model of gap in service
quality by Parasuaman, et al. (1985).
Figure 3. Service Quality Model

101
The authors of SERVQUAL originally
formulated by Parasuraman, Zeithamal and
Berryin (1988), Manzin, Zurga, & Mrak (2012),
Grönroos (2007), Lovelock, & Wirtz (2008),
Palmer (2011), Fitzsimmons, & Fitzsimmons
(2008).The SERVQUAL questionnaire consists
of 22 items of specific statements that will cover
the five dimensions of service quality and rated
with 7 –points expectations and performance
scale. The results were determined by subtracting
expectation scores from performance scores and
the average weighted mean score was divided
into 5 which represented the five dimensions
(Palmer, 2011).The developer of SERVQUAL
stated that this model can fit to any service
organizations which has been argued and
counter-attacked by other studies. Despite
criticisms, SERVQUAL is widely used in
assessing customer satisfaction in government
services. In a document retrieved from the
website of The Scottish Housing Regulator in
August, 2012, the SERVQUAL Model is best
suited in assessing customer satisfaction with the
processes supporting the service provision.
Horri, Nouri, Ehsanifar, and Hadavand
(2012) investigated and surveyed the client
satisfaction of the Markazi Province Agricultural
Jihad Organization (MPAJO) services through
the SERVQUAL method for service quality
assessment. The researchers found that
dimensions such as tangibles and responsiveness
do satisfy customers but reliability, assurance
and empathy did not meet their satisfaction.
They suggested that the organization should
improve assurance via employee knowledge in
responding to clients’ complaints resolution,
established trust, accuracy and rapidity increase
in doing their works.
Fonseca, Pinto and Brito (2012) explore
the relationship of service quality and customer
satisfaction in public transport service using
SERVQUAL survey taking into account both
internal and external perspectives. They found
out that people under study do not make any
distinction between the two concepts mentioned:
service quality and customer satisfaction. In
addition, they suggested that the determinants of
dissatisfaction were the opposite of satisfaction
in relation with service quality dimension. In
reliability, failure to commit in prompt service
and schedule dissatisfied customers, discomfort
and dirt in tangibles, or question of punctuality.
Furthermore, their study shows that if
dimensions of service quality are assured then
satisfaction will be achieved or will be
dissatisfied if their needs were not met.
According to Dennett, et al (2000), the
nature of a service means that a customer is
present in the delivery process. Both the service
outcome, as well as the service process
influences the perception of quality. This
implies that expectations are compared with
actual service quality and the service outcome
and it is the comparison that leads to perceive
quality. One potential application of service
quality is to determine the relative importance
taken as a whole eminence of perception.
Fawcett (2006) discussed that
companies face a special challenge in meeting
customer needs while remaining inexpensively
competitive. Automated processes can make an
impact, but services are still labor concentrated.
There can be no substitute for high-quality
personal interaction between service employees
and customers, understand and improve
operational processes, identify problems quickly
and systematically and establish valid and
dependable service performance measures.

102
Service quality understands the
customers’ wants in order to have an idea of how
can one perform and deliver service to meet their
expectations. The Local government needs to
use a systematic process like variables to know
the dos and don’ts in serving customers. To
meet the needs and wants of
customers/constituents, employees should know
their perceptions regarding the service. In doing
so, they have to make a commitment with the
clients by maintaining an open communication
with them.
Rust and Chung (2006) said that
consumers are often forward-looking with
respect to their decision to keep or switch from a
service relationship. Any marketing activity that
affects current or expected future usage can help
to solidify a service relationship. Customer
perception of service quality is critical
determinant of company performance and
ultimate survival. Service quality as perceived
by consumers is a competitive weapon being
used by managers to enhance their competitive
advantage in domestic and international market.
Interest in service quality is not limited to the
private industry; there is also the public interest
in the critical role played by this contract. Below
is the continuum model for continuum of
perceived service quality by Parasuraman, et al.
(1990) which can also be applied to public
service.
Figure 4. Continuum of perceived service quality
In measuring service quality, Kotler
and Keller (2008), identified essential variables
such as reliability, responsiveness, assurance,
empathy and tangibles. Reliability is the ability
to perform promised service dependably and
accurately. Responsiveness is the willingness of
the service provider to help customers to provide
prompt services and have the knowledge to
answer questions and handle complaints.
Assurance provides security to customers with
their transactions and employees which are
consistently courteous. Empathy is how the
employees give individual attention to their
customers and who deal with them in a caring
fashion. Tangibles are the appearance of
physical facilities, employees who have a neat
and professional look, equipment, printed and
visual materials associated with the service.
According to Farley (2007) managers
are returning to the dictum of the “marketing
concept” on the call for customer orientation and
innovation as the focus for all business planning.
Management should know their responsibility
like giving advice to their employees on how to
deliver quality service to their customers, taking
care of their customers and many more.

103
In view thereof, this study on the
measures of the level of service quality of Local
Government Units of Angeles and San Fernando
in Pampanga to determine their constituents’
satisfaction is undertaken. Specifically, it seeks
answers to the following questions:
1. How may the respondents perceive the
service quality of Local Government
Units of Angeles and San Fernando in
terms of?
1.1. Reliability
1.2. Responsiveness
1.3. Assurance
1.4. Empathy
1.5. Tangibles
2. What is the overall level of
constituents’ satisfaction on the service
quality of Local Government Units of
Angeles and San Fernando?
3. Is there significant relationship between
the dimensions of service quality and
constituents’ satisfaction?
4. Are there significant differences on the
responses between Local Government
Units of Angeles and San Fernando?
5. Which among the dimensions of service
quality predict constituents’
satisfaction?
6. How may the results of this study be
used to improve the service quality of
Local Government Units of Angeles
and San Fernando?
The hypotheses below are used in the study;
to wit:
Ho1. There is no significant relationship between
dimensions of quality service and constituents’
satisfaction.
Ho2. There is no significant difference on the
responses between the local government units of
Angeles and San Fernando.
The conceptual framework presents the
whole gamut of the study which adopts the
independent-dependent-outcome model. The
independent variables consist of dimensions of
service quality such as assurance, empathy,
reliability, responsiveness and tangibles. For
dependent variable states the level of
constituents’ satisfaction on the service quality
of Local Government Units of Angeles and San
Fernando. Finally, the outcome is the
improvement of quality of service to be rendered
after measuring the present service quality of the
said two city government using service quality
dimensions.
Dimensions of Service Quality
Assurance
Empathy
Reliability
Responsiveness
Tangibles
Constituents’ Satisfaction
Quality of Service
Applicants/
Renewals of Local Government Units

104
Figure 5. Conceptual framework
This study will be undertaken for the benefit of
Local Government Units which the results of this
study can be used as a source of information on
how to further improve its current service so that
its constituents will be satisfied with the services
rendered.
This research is undertaken in Local
Government Units of Angeles and San Fernando
to measure the level of customer’s satisfaction in
the Business Permit & Licensing - Business One
Stop Shop (BOSS) office using the service
quality dimensions survey of reliability,
responsiveness, assurance, empathy and
tangibles.
Method
Research Design
Descriptive research is used in the study
since it focused on describing the dimensions of
service quality which are reliability,
responsiveness, assurance, empathy and
tangibles. Descriptive research used description
as a tool to organize data into patterns that
materialize during analysis. This often used
visual aids such as graphs and charts to support
the reader. Descriptive research may be used to
explore relationships between two or more
variables. It involves gathering data that describe
events and then organizes, tabulates, illustrates,
and describes the data (McNabb, 2007).
Exploratory research is also used to test the
difference on the responses between two local
government units in relation to the service
quality dimensions. The exploration of new
phenomena in this way may help the researchers
for better understanding, may test the feasibility
of a more extensive study, or determine the best
methods to be used in a subsequent study. For
these reasons, exploratory research is broad in
focus and rarely provides definite answers to
specific research issues. The objective of
exploratory research is to identify key issues and
key variables (Jupp, 2006).
Participants
The respondents of this study are those
constituents who have been renewing their
permits and licenses from Business Permit &
Licensing - Business One Stop Shop (BOSS)
office in the Local Government Units of
Angeles and San Fernando for five (5) years and
above.
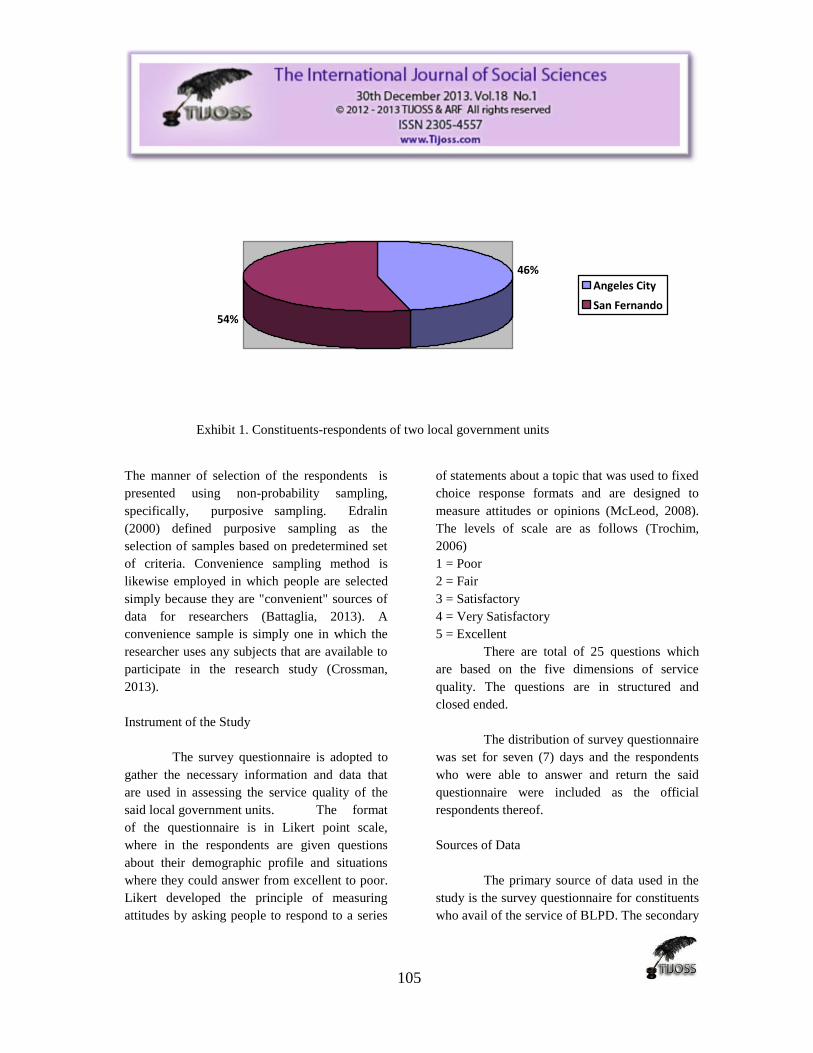
Exhibit 1 shows the constituents-
respondents who participated in the survey.
Fifty-five (55) or 54.00% came from Angeles
City while forty-seven (47) or 46% belong to
City of San Fernando.
105
46%
54%
Angeles City
San Fernando
Exhibit 1. Constituents-respondents of two local government units
The manner of selection of the respondents is
presented using non-probability sampling,
specifically, purposive sampling. Edralin
(2000) defined purposive sampling as the
selection of samples based on predetermined set
of criteria. Convenience sampling method is
likewise employed in which people are selected
simply because they are "convenient" sources of
data for researchers (Battaglia, 2013). A
convenience sample is simply one in which the
researcher uses any subjects that are available to
participate in the research study (Crossman,
2013).
Instrument of the Study
The survey questionnaire is adopted to
gather the necessary information and data that
are used in assessing the service quality of the
said local government units. The format
of the questionnaire is in Likert point scale,
where in the respondents are given questions
about their demographic profile and situations
where they could answer from excellent to poor.
Likert developed the principle of measuring
attitudes by asking people to respond to a series
of statements about a topic that was used to fixed
choice response formats and are designed to
measure attitudes or opinions (McLeod, 2008).
The levels of scale are as follows (Trochim,
2006)
1 = Poor
2 = Fair
3 = Satisfactory
4 = Very Satisfactory
5 = Excellent
There are total of 25 questions which
are based on the five dimensions of service
quality. The questions are in structured and
closed ended.
The distribution of survey questionnaire
was set for seven (7) days and the respondents
who were able to answer and return the said
questionnaire were included as the official
respondents thereof.
Sources of Data
The primary source of data used in the
study is the survey questionnaire for constituents
who avail of the service of BLPD. The secondary

106
sources used in the study are all the related
literatures coming from books, previous studies
and online research journals.
Procedure
The statistical tools used are mean
rating, t-test and correlation. The mean rating is
used to measure the areas of the service quality
dimensions which are reliability, responsiveness,
assurance, empathy and tangibles. T-test is used
to determine if there is a significant difference on
the responses between Local Government Units
of Angeles and San Fernando. The t-test assessed
whether the means of two groups were
statistically different from each other. This
analysis is appropriate whenever you want to
compare the means of two groups. T-test was
applicable to know the differences between the
mean value for the item for the top and bottom
quarter judges. Higher t-values mean that there is
a greater difference between the highest and
lowest judges (Trochim, 2006). The correlation
is also used to determine the relationship
between dimensions of service quality and
constituents’ satisfaction.
In addition, the translations of level
ranking are analyzed following the criteria of
customers satisfaction designed by Trochim
(2006).
Scale Numerical Ranking Descriptive Rating
1 1.00 – 1.49 Poor
2 1.50 – 2.49 Fair
3 2.50 – 3.49 Satisfactory
4 3.50 – 4.49 Very Satisfactory
5 4.50 – 5.00 Excellent
Results and Discussion
The aim of my research is to measure
the level of service quality of Local Government
Units of Angeles and San Fernando in Pampanga
to determine their constituents’ satisfaction.
There are 102 clients which 55 came from
Angeles and 47 belong to San Fernando.
I. Perceptions of Constituents on the
Service Quality Dimensions
Table 1 shows the mean ratings of
reliability dimension which all respondents rated
all items under reliability very satisfactory.
There is a need for both local government units
to improve their quality of service which
according to Sullivan (2007), there must a
consistency of the system or component to
perform what has been stated and promised
under specified situations and time to achieve a
reliable service.
Table 1. Mean Ratings of Reliability
Questions
Angeles San Fernando
MR DR MR DR
Performing the service right for the first time 3.69 VS 361 VS
Customer expectation is strictly followed 3.71 VS 3.61 VS
Efficiently carries out the service 3.69 VS 3.61 VS
Accuracy of the information received 3.69 VS 3.61 VS

107
Note: MR=mean rating, DR=descriptive rating, VS=very satisfactory
Table 2 shows the mean ratings of
responsiveness dimension which all respondents
rated all items under the said dimension very
satisfactory. Both local government units shall
improve their service quality to further rate them
excellent. Responsiveness is about timely
delivery of service. The employees should
always be ready to provide service in a timely
manner (Srinivasan, 2009) which supported by
Kheng, Mahamad, Ramya and Mosahab (2010)
that waiting time affects the customer’s
satisfaction which the staff would tell customers
when services would be performed so they
wouldn’t spend too much time waiting without
knowing what to do next. Delaying or receiving
the service at a later time would create
dissatisfaction to clients even though they still
received the service.
Table 2. Mean Ratings of Responsiveness
Questions
Angeles San Fernando
MR DR MR DR
Readiness to respond to customers’ request 3.78 VS 3.70 VS
Keeping the customers informed 3.76 VS 3.70 VS
Entertain/Greet customers upon serving 3.78 VS 3.70 VS
The Office as convenient operating hours 3.85 VS 3.76 VS
Willingness to attend to customers’ needs 3.76 VS 3.70 VS
Over-all 3.79 VS 3.71 VS
Note: MR=mean rating, DR=descriptive rating, VS=very satisfactory
Table 3 shows the mean ratings of
assurance dimension which all respondents rated
all items under the said dimension very
satisfactory. Both local government units must
keep on improving their service to be excellently
appreciated by their constituents. Beatson, Ling
and Gudergan (2008) stated that perceived
employee satisfaction, perceived employee
loyalty and perceived employee commitment had
a sizable impact on perceived service quality.
And because service delivery occurs during
interactions of customers and employees or what
service quality gurus called the moment of truth,
employees can influence customer’s perceptions
of service quality. So doing things right the first
time really matters.
Table 3. Mean Ratings of Assurance
Questions
Angeles San Fernando
MR DR MR DR
Making customers feel secure about
transactions
3.67 VS 3.61 VS
Completeness of information received 3.67 VS 3.61 VS
Staff are knowledgeable about customers’
concerns
3.67 VS 3.61 VS
Relevance of the information received 3.69 VS 3.61 VS
Over-all 3.69 VS 3.61 VS

108
Staff assures the customers’ safety 3.82 VS 3.78 VS
Staff are courteous with you 3.60 VS 3.57 VS
Over-all 3.69 VS 3.64 VS
Note: MR=mean rating, DR=descriptive rating, VS=very satisfactory
Table 4 shows the mean ratings of
empathy dimension which all respondents of
Angeles rated all items under empathy very
satisfactory while respondents of San Fernando
rated very satisfactory the items “staff pays
customers personal attention”; “staff are polite
and ready to entertain questions”; “staff always
listens to the customers”; and “staff understands
the needs of the customers” while “staff have a
pleasant demeanor” was rated satisfactory only.
Both local government units need to
enhance its staff interpersonal relationship to
improve the constituents’ evaluation into
excellent. The ratings should serve as room for
improvement for all the staff. Moreover, the
local government of San Fernando must pay
attention to improving the pleasant demeanor of
its staff. The rating shall serve as wake up call
for the Human Resource Management Office to
establish strategies on improving said item.
Empathy is the ability to show caring,
individualized attention to customers (David, &
Heinelle, 2003). Loke, Taiwo, Salim and Downe
(2011) suggested that customer service agent
needs training and performance for efficient
service. Also, building rapport or customer
relationship and other form of relational
elements allowing them to realize and articulate
client needs.
Table 4. Mean Ratings of Empathy
Questions
Angeles San Fernando
MR DR MR DR
Staff have a pleasant demeanor 3.62 VS 3.48 S
Staff pays customers personal attention 3.62 VS 3.54 VS
Staff are polite and ready to entertain
questions
3.62 VS 3.54 VS
Staff always listens to the customers 3.62 VS 3.54 VS
Staff understands the needs of the customers 3.62 VS 3.54 VS
Over-all 3.62 VS 3.53 VS
Note: MR=mean rating, DR=descriptive rating, S=satisfactory, VS=very satisfactory
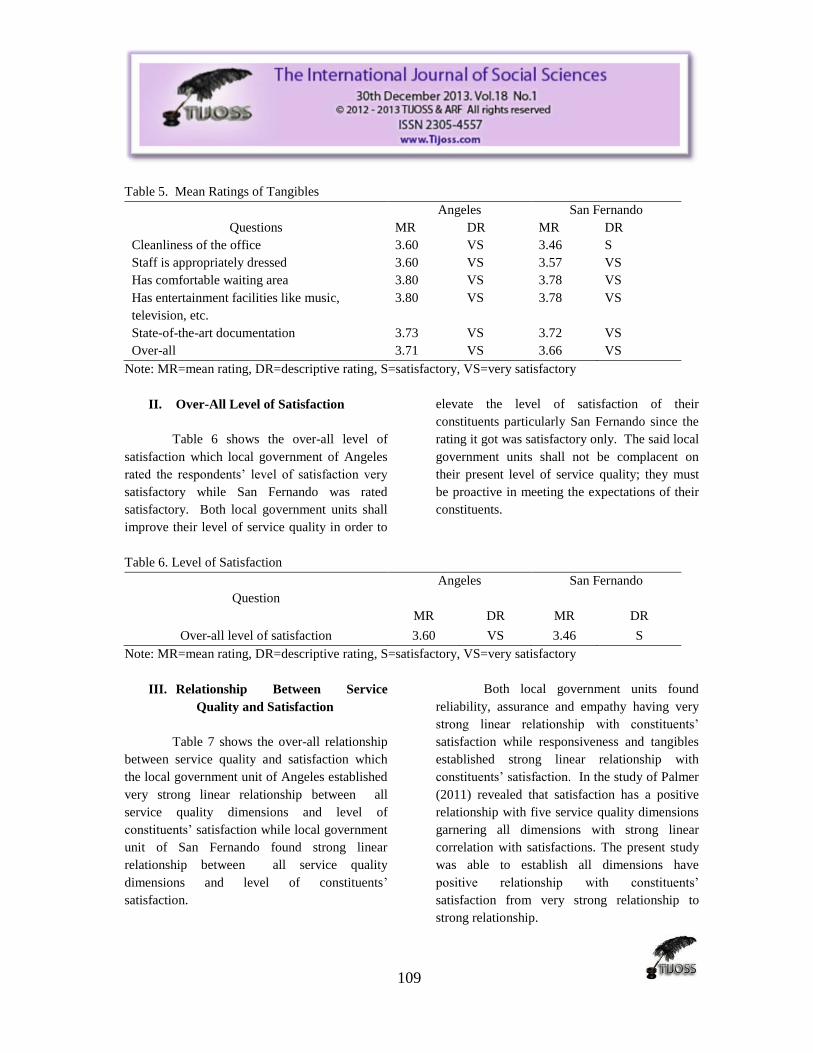
Table 5 shows the mean ratings of tangibles
dimension which all respondents rated all items
very satisfactory, except the item cleanliness of
the office in the local government unit of San
Fernando was rated satisfactory by its
respondents. Tangibles are very important to
customers of public organizations (Ilhaamie,
2010). Because service is intangible, users rate
the service by its tangible elements. Kheng,
Mahamad, Ramaya, and Mosahab (2010)
mentioned that it is the physical facilities,
equipment and appearance of personnel.
109
Table 5. Mean Ratings of Tangibles
Questions
Angeles San Fernando
MR DR MR DR
Cleanliness of the office 3.60 VS 3.46 S
Staff is appropriately dressed 3.60 VS 3.57 VS
Has comfortable waiting area 3.80 VS 3.78 VS
Has entertainment facilities like music,
television, etc.
3.80 VS 3.78 VS
State-of-the-art documentation 3.73 VS 3.72 VS
Over-all 3.71 VS 3.66 VS
Note: MR=mean rating, DR=descriptive rating, S=satisfactory, VS=very satisfactory
II. Over-All Level of Satisfaction
Table 6 shows the over-all level of
satisfaction which local government of Angeles
rated the respondents’ level of satisfaction very
satisfactory while San Fernando was rated
satisfactory. Both local government units shall
improve their level of service quality in order to
elevate the level of satisfaction of their
constituents particularly San Fernando since the
rating it got was satisfactory only. The said local
government units shall not be complacent on
their present level of service quality; they must
be proactive in meeting the expectations of their
constituents.
Table 6. Level of Satisfaction
Question
Angeles San Fernando
MR
DR
MR
DR
Over-all level of satisfaction 3.60 VS 3.46 S
Note: MR=mean rating, DR=descriptive rating, S=satisfactory, VS=very satisfactory
III. Relationship Between Service
Quality and Satisfaction
Table 7 shows the over-all relationship
between service quality and satisfaction which
the local government unit of Angeles established
very strong linear relationship between all
service quality dimensions and level of
constituents’ satisfaction while local government
unit of San Fernando found strong linear
relationship between all service quality
dimensions and level of constituents’
satisfaction.
Both local government units found
reliability, assurance and empathy having very
strong linear relationship with constituents’
satisfaction while responsiveness and tangibles
established strong linear relationship with
constituents’ satisfaction. In the study of Palmer
(2011) revealed that satisfaction has a positive
relationship with five service quality dimensions
garnering all dimensions with strong linear
correlation with satisfactions. The present study
was able to establish all dimensions have
positive relationship with constituents’
satisfaction from very strong relationship to
strong relationship.

110
Table 7. Degree of Relationship
Dimensions
Degree of
Relationship
Interpretation Degree of
Relationship
Interpretation Degree of
Relationship
Interpretation
Angeles San Fernando Over-all
Reliability 0.881 Very Strong
Linear
Correlation
0.788 Strong Linear
Correlation
0.843 Very Strong
Linear
Correlation
Responsivenes
s
0.844 Very Strong
Linear
Correlation
0.734 Strong Linear
Correlation
0.799 Strong Linear
Correlation
Assurance 0.944 Very Strong
Linear
Correlation
0.802 Strong Linear
Correlation
0.884 Very Strong
Linear
Correlation
Empathy 0.895 Very Strong
Linear
Correlation
0.743 Strong Linear
Correlation
0.833 Very Strong
Linear
Correlation
Tangibles 0.857 Very Strong
Linear
Correlation
0.730 Strong Linear
Correlation
0.804 Strong Linear
Correlation
IV. Test of Difference Between Two
Local Government Units
Table 8 shows the difference on the
perception of service quality between local
government units of Angeles and San Fernando.
It further shows that there is no significant
difference on the perceptions between the local
government units of Angeles and San Fernando
because the p-value is more than 0.05, therefore,
the null hypothesis should not be rejected.
It reveals that constituents of local
government units of Angeles and San Fernando
have similar perceptions on each unit’s service
quality. This finding is in line with what Loke,
Taiwo, Salim and Downe (2011) had stated in
their research. The respondents who have
cumulative experience in the permit renewal
have formed perceptions already of how the
service will be delivered, therefore, their
expectations increases and looking for
improvement the next time they will encounter
the service. Another factor is as encounter
multiplies; the users became familiar and
eventually decrease their satisfaction.

111
Table 8. Test of Difference on Service Quality and Satisfaction
Dimensions P-value Hypothesis
Reliability 0.582 Do not reject the null
hypothesis
Responsiveness 0.595 Do not reject the null
hypothesis
Assurance 0.722 Do not reject the null
hypothesis
Empathy 0.564 Do not reject the null
hypothesis
Tangibles 0.778 Do not reject the null
hypothesis
Satisfaction 0.336 Do not reject the null
hypothesis
Since the dimension assurance
established the highest degree of correlation
among the local government units’ service
quality, it has found the said dimension plays the
best predictor of constituents’ satisfaction for
both local government units. The findings
support the efforts made by both local
government units in improving their systems and
procedures attune with international standards
(ISO) in keeping their constituents satisfied with
the given services.
For the test of difference, the p-value is
more than 0.05 which signifies to accept the null
hypothesis “there is no significant difference on
the perception on service quality between local
government units of Angeles and San Fernando”.
The perceptions of respondents of both
local government units do not have significant
difference on service quality rendered. This
could be associated to being both ISO certified
and the business permit and licensing procedures
and strategies being used are almost the same.
The ratings given by respondents on
service quality being rendered by local
government units of Angeles and San Fernando
are ranging from satisfactory to very satisfactory,
hence, the said ratings shall serve as eye opener
for Angeles and San Fernando local government
units to improve their services and must not be
complacent with the evaluations they have now.
It is the duty of the government to serve their
taxpayers and they, therefore, deserve excellent
performance.
All local government units, in general,
and Angeles & San Fernando, in particular, shall
continuously keep their operations in the
Business Permit and Licensing Department
(BPLD) accustom with international standard to
make them more proactive in making their
constituents satisfied at all times.

112
1. References
2. Armstrong, G., & Kotler, P. (2011).
Marketing: An introduction . Building
customer relationships, 10th
, 41-48,
Singapore: Pearson.
3. Bal, P., de Lange, A., F., Jansen, P.,
Van der Velde, M. E.G. & Ybema, J.
(2011). Age and trust as moderator in
the relation between procedural justice
and turnover: A large scale longitudinal
study. Applied Psychology: An
International Review, 60 (1), 66-86.
doi: 10.1111/j. 1464-0597.2010.0047.x
4. Beatson, A., Ling,. I. & Gudergan S.
(2008). Employee behavior and
relationship quality: input on customers:
The Service Industries Journal, 28 (2),
211-223.
5. Bhiwajee, S. L., Munhurrun, P. R., &
Naidoo, P. (2010). Service quality in the
public service: University of
Technology, .International Journal of
Marketing Research, 3 (1). Retrieved
on November 1, 2013 from
http://www.bibliotheque.gouv.qc.ca/app
/DocRepository/1/trouve_pour_vous_ad
ministration/service_quality_in_the_pu
blic_service.pdf
6. Baran, R,.ProfGalka,R.J.,ProfStrunk D.
(2008). Marketing strategy and CRM.
Principles of customer relationship
management.,.317-323, USA:
Thomson South-Western.
7. Battaglia, M. (2013). Encyclopedia of
Survey Research Methods. Retrieved on
September 28, 2013 from
http://srmo.sagepub.com/view/encyclop
edia-of-survey-research-
methods/n105.xml
8. Brilliantes, A., Jr. (2003). Innovations
& Understanding Local Governments in
the Philippines, Polystar Graphics &
Multi Print Paranaque City, Philippines.
9. Bourgon (2007). Citizens management:
Why should governments engage
citizens in service and policy making?
Retrieved on November 1, 2013 from
http://www.oecd.org/gov/42240216.pdf
10. Carron, D. J. & David, G. (2006).
Civil servant identify at the crossroads:
New challenges for public
administration, International Journal of
Public Sector Management, .19 (6),
543-555.
11. Cheema, S. & Popovski, V. (2010).
Building trust in government:
Innovations in Governance Reform in
Asia. United Nations University Press.
N. Y. Retrieved on November 2, 2013
from
http://isp.unu.edu/publications/books/20
10/building-trust-in-government.html
12. David, M & Heinelle, J. (2003).
Managing services: Using technology to
create value, McGraw-Hill/Irwin.
13. Edralin, D. (2000). Research method.
Business Research. De La Salle
University, Manila.
14. European Public Administration Union
(2008).European Primer on Customer
Satisfaction Management. Retrieved on
October 29, 2013 from http://
www.eipa.eu/customer.
15. Fitzsimmons, J. A., & Fitzsimmons, M.
J. (2008). Service Management , 6th
,
NY: McGraw Hill.
16. Fonseca, F., Pinto, S., & Brito, C.
(2012) Service quality and customer
satisfaction in public transports, 4 (2),
UDK- 656.025.2:658.56. Retrieved on
November 1, 2013 from
http://www.ijqr.net/journal/v4-n2/4.pdf

113
17. Giventer, L. (2008). Statistical Analysis
for Public Administration: Multiple
Regression Analysis, 328, Canada:
Malloy Inc.
18. Gronross, C. (2007). Service
Management and Marketing Customer
Management in Service Competition,
3rd
, England: John Wiley & Sons, Ltd.
19. Groebner, D.F., Shannon, P.W., Fry,
P.C., & Smith, K.D. (2011) Business
Statistics: A Decision-Making
Approach, 8th
, NJ: Pearson.
20. Gupta, N. & Valamarthi, G. (2009).
Total Quality Management, 2nd
, New
Delhi: McGraw Hill.
21. Illaamie A. (2010). IAENG
International Journal of Trade,
Economics and Finance, 1 (1).
Retrieved on November 1, 2013 from
http://www.ijtef.org/papers/8-C145.pdf
22. Innovations in governance reform in
Asia (n.d.). Trends and Innovations in
Governance. Retrieved on November
1, 2013, from http://www.
unu.edu/media/publication/000/002/158
/ buildingtrustingovt.pdf.
23. International Finance Corporation
(2011). Doing business 2011: Making a
difference for entrepreneurs. Retrieved
on November 1, 2013 from
http://www.doingbusiness.org
24. Ipsos, M. (2010). Public sector service
satisfaction index: A report for
consumer focus. Retrieved on
November 1, 2013 from
http://www.consumerfocus.org.uk/files/
2011/10/Public-sector-service-
satisfaction-index.pdf
25. Ipsos, M. (2002). Public service reform:
Measuring and understanding customer
satisfaction. Retrieved on November 1,
2013 from
http://www.mori.com/sri/public-
service-reform
26. Jupp, V. (2006).The SAGE dictionary
of social research methods. Retrieved
on March 20, 2013 from
http://srmo.sagepu
27. Kheng, L., Mahamad, O., Ramayah, T.,
& Mosahab, R. (2010). Impact of
service quality on customer loyalty: A
study of banks in Penang, Malaysia.
International Journal of Marketing
Studies, 2 (2). Retrieved on November
1, 2013 from
http://www.ccsenet.org/ijms
28. Kotler, P., & Armstrong, G.
(2008).Principles of marketing, 12th
,
Upper Saddle River, Pearson, N.J.
29. Loke, S.P., Taiwo, A., Salim, H.M., &
Downe, A. G. (2011).Service quality in
a telecommunication service provider.
IPEDR 11, Singapore: IACSIT Press.
Retrieved on November 1, 2013 from
http://www.ipedr.com/vol11/5-
R00009.pdf
30. Lovelock D. L., & Writz, J. (2007).
Services Marketing, 6th
, Pearson, NJ.
31. Mahloane, L. (2009). An approach to
service delivery in the government
sector. CPUT Theses & Dissertations.
Retrieved on November 1, 2013 from
http://dk.cput.ac.za/td_cput/99
32. Manzin, M., Mrak, B. & .Žurga, G.
(2012). Quality of public services
dimensions model as a basis for better
customer satisfaction management.
African Journal of Business
Management. 6 (26), 7833-7841, doi:
10.5897/AJBM11.2528.
33. McLeod, S. (2008).Likert
scale.Retrieved on March 14, 2013 from
http://www.simplypsychology.org/likert
-scale.html
114
34. McNabb, C. (2007). Descriptive
research methodologies. Retrieved on
March 19, 2013 from
http://pangea.tec.selu.edu/~cmcnabb/phi
losop/power.ppt
35. Palmer, A. (2011). Principles of
Services Marketing, London: McGraw
Hill.
36. Pizam, A. (2010). International
Encyclopedia of Hospitality
Management, 2nd, Retrieved on
November 1, 2013 from
http://books.google.com/books?
Id=VyBjQQ al TxwCa print sec=
frontcover#v=onepage&q&f=false
37. Public sector service satisfaction index:
A report for consumer focus (2010).
Retrieved on November 1, 2013 from
http://www.philstar.com/Article.aspx?ar
ticleId=600685&SubCategoryId=66
38. Srinivasan, R. (2009). Services
Marketing: The Maiau Context, 2nd
,
125. New Delhi: PHI Learning Limited.
39. Sullivan (2007). Authenticity, accuracy
and reliability in the public sector:
annotated bibliography. Retrieved on
November 1, 2013 from
http://www.interpares.org/display
a. _file.cfm?doc=ip2_biblio_aar_
public_sector_annotated.pdf
40. State of Queensland (2010). Public
perceptions of local government:
Findings from the 2010 public attitudes
survey. Retrieved on October 29,
2013from http://www.
www.cmc.qld.gov.au/public-sector-
service-satisfaction-index.pdf
41. The Scottish housing regulator. (n.d).
Retrieved on October 29, 2013 from
a. http://www.communitiesscotla
nd.gov.uk/stellent/groups/publi
c/documents/webpages/shr_ho
wtogather-servqual.hcsp
42. Trochim, W. (2006).Research methods
knowledge base. Retrieved on March
19, 2013 from
http://www.socialresearchmethods.net/k
b/scallik.php
43. Vincent, C., & Zhu, P. (2004). Taking
care of business. Retrieved from:
http://www.iccs-
isac.org/en/pubs/tcob/CGE_TCOB.pdf
44. Wang, V. (2009). Do demographic
characteristics patient satisfaction?.
Retrieved on October 27, 2013 from
Customer satisfaction: What the
research tell us (2007).Center for the
Study of Social Policy. Retrieved from:
http://www.cssp.org/publications/consti
tuents-co-invested-in-change/customer-
satisfaction/customer-satisfaction-what-
research-tells-us.pdf
45. Wright, G., & Hyde-Hines, M. (2011).
Measuring quality in public services.
Retrieved on October 30, 2013 from
http://www.ribm.mmu.ac.uk/symposiu
m2011/fullpapers/MargaretHyde.pdf