measurement of peak discharge at dams by indirect … · 2004-09-20 · measurement of peak...
TRANSCRIPT

Techniques of Water-Resources Investigations
of the United States Geological Survey
\
Chapter A5
MEASUREMENT OF PEAK DISCHARGE AT DAMS BY INDIRECT METHOD
By Harry Hulsing
Book 3 -
APPLICATIONS OF HYDRAULICS

UNITED STATES DEPARTMENT OF THE INTERIOR
STEWART L. UDALL, Secretary
GEOLOGICAL SURVEY
William T. Pecora, Director
First printing 1967
Second printing 1968
UNITED STATES GOVERNMENT PRINTING OFFICE, WASHINGTON : 1968
For sale by the Superintendent of Documents, U.S. Government Printing Office
Washington, D.C. 20402 - Price 30 cents (paper cover)

PREFACE The series of manuals on techniques describes procedures for planning and
executing specialized work in water-resources investigations. The material is grouped under major subject headings called books and further subdivided into sections and chapters; Section A of Book 3 is on surface water.
The unit of publication, the chapter, is limited to a narrow field of subject matter. This format permits flexibility in revision and.publication as the need arises.
Provisional drafts of chapters are distributed to field o&es of the U.S. Geological Survey for their use. These drafts are subject to revision because of experience in use or because of advancement in knowledge, techniques, or equipment. After the technique described in a chapter is sufficiently developed, the chapter is published and is for sale by the Superintendent of Documents, U.S. Government Printing Office, Washington, D.C. 20402.
III
CONTENTS
Preface------------------------------------ Symbols and units _____ ______ _____ _ __ ___ _ __ _ Abstract----------------------------------- Introduction- _ _ _ _ _ _ _ _ _ _ _ _ _ _ _ _ _ _ _ _ _ _ _ _ _ _ _ _ _ _ Selection of site ______ __ __ _ ___ __ _ __ _ __ _ _ _ _ _ _ _ Field procedures----------------------------
High-water profiles--- _ __ _ __ __ _ __ _ __ __ _ _ _ Cross sections- __ _ __ _ __ ___ _ __ __ _ _ _ _ __ _ __ Dam details----------------------------
Crestshspe-------------------------- Piers and abutments- _________________ Gatea and flashboards-- _ _ _ __ _ __ _ _ _ _ __ _ Debris--- _-_ __ ______ _ __ ___ __ __ ____ __ _ Water bypassing the crest of the dam- _ _
Pictures------------------------------- Office procedures---------------------------
Piers and abutments- _- _________________ Weirs not level- _ __ __ _ __ ___ __ _ __ _ __ ___ _ _ Weirs with curved or angled crest in plan-- Determination of weir height-- _ _ _ _ _ _ _ _ _ - _
‘Rectangular sharp-crested weirs- _ _ _ _ __ __ _ _ _ _ _ Basic equation- _ _ _ _ _ _ _ __ ___ _ __ ___ __ _ _ _ _ Discharge coefficients--- _ __ __ ___ __ _ __ _ __- Submerged sharp-crested weirs- _ _ __ __ _ _ __
Page III VII
1 1 1 2 2 2 2 2 2 2 3 3 3 3 3 3 4 4 4 4 4 5
Broad-crested weirs- _ __ _ _ _ _ __ _ _ __ _ _ _ _ _ _ _ _ _ _ _ Definitions-- _ _ _ _ _ _ _ _ _ _ _ _ _ _ _ _ _ _ _ _ _ _ _ _ _ _ _ Basic equation ________________________ _- Discharge coeflicients _-___________ _ ______ Submerged broad-crested weirs- _ _ _ _ _ _ _ - - _
Round-crested weirs- _ _ _ _____ ______ ____ __-__ Basicequation----_--__________________ Discharge coefficients--- _ _ _ _ _ _ _ _ _ _ _ _ _ _ _ _ _
Nappe-fitting method- _ _ __ __- ____ __ ___ Definitions for reference weir-- _ _-_ __ _ Procedure for determining design head- Head-discharge coefficient relations&p- Example- _ _ _ _ _ _ _ _ _ _ _ _ _ _ _ _ _ _ _ _ _ _ _ _ _ _
Index-measurement method-- _ _ _ _ _ _ _ _ _ _ Effect of abutments and piers-- __________ Submerged round-crested weirs ____ _ ___ __ _
Highway embankments ________ ___ __ _ __ _ _ _ _ _ _ Definitions ______________________ --_---- Basic equation------ ___________________
Lengthof 5ow section _____ -___- ______ - Discharge coe5cients __________ _____ _ __ _ _ Submerged highway embankments--- ___ __
Weirs of unusual shape-- _ _____ _ ___ ___ ___ ____ Selected references---- _______ _ __ _ __ _ ___ _ __ _ _
FIGURES
1. Definition sketch of a sharp-crest&d weir- _ _ __ ________________________________________------- 2. Discharge coe5cients for full width, vertical, and inclined sharp-crested rectangular weirs- _ _ _ _ _ _ _ _ 3. Definition of adjustment factor, k,, for contracted sharp-crested weirs ___________________________ 4. Definition of adjustment factor, /cl, for submerged sharp-crested rectangular weirs- _ _ __ _ _ _ _ _ _ _ _ _ _ _ 5. Definition sketches of broad-crested weirs with vertical faces and horizontal crest---- _ _ _ _ _ _ _ _ _ _ _ _ _ 6. Minimum h/L ratio for which the lower nappe will clear the downstream corner of a broad-crested weir- 7. Coefficients of discharge for full width broad-crested weirs with downstream slope% 1 : 1 and various
upstream slopes__-______--____-------____1_______-------------------------------------- 8. Definition sketches of a nappe-fitting design-head dam with free flow and with submerged flow ____ _ 9. Definition sketch of reference weir used in the nappe-fitting method- _ _ -_ __ ______________ _______
10-13. Lower nappe profiles, sharp-crested weir: 10. With upstream. face vertical ____ _ _ _ _ _ _ _ __ _ _ _ _ _ _ _ _ _ _ _ _ _ _ _ __ _ _ _ _ _ __ __ _ _ _ _ _ __ _ _ _ _ _ __ _ _ _ _ _ _ _ 11. With upstream face eloped 1:3 ____ _ _ _ __ _ _ __ _ _ _ _ _ _ _ _ _ _ __ _ __ _ __ _ _ _ _ __ _ _ __ _ __ _ _ __ _ __ _ _ _ _ _ _ _ 12. With upstream face sloped 2:3 _____ _ _ ______ __-___ __________________ _____________________ 13. With upstream face sloped 3:3 ________________________________________----------------- _
14. Illustrations of how nappe-fitting profiles are fitted to actual dam crest profiles ____ _______ _____ ___ 15. Discharge coe5cidnts corresponding to the design head ho, for full width ogee dams for various values of
ho/(P+E)_____-___-__-___________________--------------------------------------------- 16. Discharge coefiicients for heads other than the design head, nappe-fitting weira ______________ __ _ _ _ 17. Profile of North Highlands spillway model ______ __ _ _ _ _ _ _ __ _ _ __ _ __ _ _ _ __ __ _ _ _ __ _ _ _ _ _ _ - - - - - -- - - - 18. Determination of nappe-fitting head, North Highlands Dam ____ _______________________________
V
Page 7 7 8 9
10 10 12 12 13 13 13 23 23 23 25 25 26 26 26 26 26 27 27 29
Page 5 6 6 7 8 9
10 11 13
14 15 16 17 18
22 23 23 24

VI CONTENTS
19. Discharge coefficients for head other than the index head, round-crested weirs ________ ___ _ _ _ _ _____ ___ 20. Definition of adjustment factor, k,, for submerged og& dams- _ _ ____ ___ ___ ___ ____________ _ __- ___ __ 21. Definition sketch of flow over a highway embankment- _ _ __ ___ __-___ ___ _ __ ____ _-_____ _ ___ - ___ - -_ _ 22. Discharge coefficients for highway embankments for h/L ratios >0.15- _ _ _ _ _ _ _ _ _ _ _ _ _ _ _ _ _ _ _ _ _ _ _ _ _ _ _ _ 23. Discharge coefficients for highway embankments for h/L ratios <0.15 _____ __ _ __ _ __- ____ - _________ - 24. Definition of adjustment factor, kg, for submerged highway embankments- _ ________________________ 25. Odd-shaped weir forms for which the value of C has been determined by laboratory experiment _ _ _ _ _ _ _
TABLES
Page 24 25 26 27 27 27 28
1. Coordinatesoflowernappeforselectedvaluesof h,/P ___________________________________ --------- 2. Valuesof Cfor weir form l______________-___-~------~-------------~--------------------------- 3. Values of C for weir forma 2-6- _________ - ________________________________________------ -------- 4. Values of C for weir forms 7-14- _ _ _ _ _ _ _ _ _ - _ _ _ _ _ _ _ _ _ _ _ _ _ _ _ _ _ _ _ _ _ _ _ _ _ _ _ _ _ _ _ _ _ _ _ _ _ _ _ _ _ _ _ _ _ - _ _ - - - - -
Page
19 29 29 29

SYMBOLS AND UNITS
Sumbol
B b
c Cd, co,
EI, Ez,
E
f Q
H
Hi
HO
h
4,
hb
$
Definition
Width of channel. Width of weir crest normal to
flow. Coefficient of discharge. Coefficient of discharge for a weir
for the cases H= Hi, and for flow affected by tail-water sub- mergence.
Slope of upstream and down- stream weir face, horizontal distance/vertical distance.
Rise in lower nappe from spring point to its highest elevation.
Function of. Gravitational constant (accel-
eration) . Total head on a weir measured
from high point on crest; H=h+h..
Index head, a value of H for which the coefficient of dis- charge is known.
Total head corresponding to the design head, ho, on nappe- shaped weirs; Ho= ho+ h,.
Static or piezometric head above an arbit,rary datum.
Static head referred to high end of weir.
Static head referred to low end of weir.
Nappe-fitting piezometric head referred to the high point on crest of dam = h.- E.
mu ft ft
ft
ft/sec2
ft
ft
ft
ft
ft
ft
ft
Symbol
h.
ht
h.
k
Piezometric head measured from crest of sharpcrested weir used as reference weir for computing discharge coefficient for nappe- fitting weirs.
unit ft
Vertical distance from the dam crest to the downstream water surface for flow affected by tail-water submergence.
Velocity head at a section. Adjustment factor; subscripts
refer to specific items as: c for side contraction, j for piers and piles, R for radius, s for slope of downstream face of weir, t for submergence.
Length of broad-crested weir in direction of flow.
Height of weir above channel bed. Radius of rounding, upstream
edge, broad-crested weir. Radius of side abutment round-
ing.
ft
ft
ft
ft ft
ft
Mean velocity of flow in a section. ft/sec Horizontal coordinate of a point ft
on the lower nappe surface of flow over a sharpcrested wier.
Vertical coordinate of a point on the lower nappe surface of flow
over a sharpcrested weir. Less than. Equal to or less than. Greater than. Equal to or greater than.
ft
VII

MEASUREMENT OF PEAK DISCHARGE AT DAfk BY INDIRECT METHODS
By Harry Hulsing
Abstract This chapter describes procedures for measuring peak
discharges using dams, weirs, and embankments. Field and office procedures limited to this method are described. Discharge coefficients and formulas are given for three general classes of weirs-sharp-crested, broad-crested, and round-crested-and for highway embankments and weirs of unusual shape. The effects of submergence are defined for most forms.
Introduction
A weir, dam, or embankment generally forms a control section at which the discharge is re- lated to the upstream water-surface elevation. The peak discharge at the control section can usually be determined on the basis of a field survey of high-water marks and the geometry of the particular structure. These methods are derived from investigations of the discharge characteristics of weirs, dams, and embank- ments, as reported in the literature, and from laboratory studies made by the U.S. Geological Survey.
There are three fairly distinct general classes of weirs-sharp-crested, broad-crested, and round-crested. This immediately suggests the organization for this part of the report. How- ever, many weirs do not neatly fit, into these three classes, because of shape, physical con- dition of the channel, or the hydraulic condi- tions under which the weirs are operating. For example, a sharp-crested weir may act like a broad-crested weir because of fill in the approach channel, or a broad-crested weir may act like a sharp-crested weir because the head is suffi- cient to make the nappe spring clear. It is thus necessary to consider many different aspects of the situation-shape of weir, channel geometry, ratio of head to crest length-before classifying the weir as to the appropriate dis- charge equation and coefficient.
Because weir flow involves free curvilinear flow and the combined influence of several fluid properties, it is not subject to complete mathe- matical description. The most direct solution for the discharge function thus involves a com- bination of dimensional analysis and experi- ment. This approach was used to determine the equations for the different types of weirs.
The reliability of the computed discharge over a weir depends primarily upon selection of the proper discharge coefficient. For some dams this coefficient must be estimated by com- parison with calibrated weirs of similar shape, for others it must be computed ,from curves of general relations based on laboratory studies. Information available at present provides co- efficients for (1) sharp-crested weirs, either dis- charging freely or submerged, (2) broad-crested weirs not submerged, (3) ogee or design-head dams, submerged or not submerged, and (4) many irregular shapes described in Water- Supply Paper 200.
Selection of Site
The two most important elements of a com- putation of flow over a weir, dam, or embank- ment are the head, h, and the discharge coeffi- cient, C. However, if high velocity of ap- proach makes the velocity head a substantial part of the total head, then the reliability of the entire measurement is subject to some question. This is true because at present there is no reliable method of determining a, the energy head coefficient. Even if (Y could be deter- mined, by itself it may not be so important as the velocity distribution in the channel approaching the dam.
For some types of dams the discharge co- efficient can be determined quite reliably. These dams are described in detail in other

2 TECHNIQUES OF WATER-RESOURCES INVESTIGATIONS
parts of this manual. If the dam under study fits within the verified range of parameters, the discharge coefbcient, C, can be selected with considerable confidence.
Thus, if the total head on the dam can be accurately determined and if the discharge co- efficient is within the range for which adequate definition is available, then a reliable discharge can be computed for the dam.
Field Procedures
Make a transit survey of floodmarks and accurate measurement of all pertinent features of the dam geometry as soon after the flood as possible. Do not use construction drawings without a thorough check of all important dimensions. Follow the methods of surveying described in chapter Al by Benson and Dal- rymple (1967). Record elevations of high- water marks, hubs, reference marks, and the crest of the weir to hundredths of a foot; record ground elevations to tenths of a foot.
High-water profiles
Get high-water marks on both banks to define the headwater and the tail-water elevations. The head, h, on the dam is measured at a dis- tance three to four times h upstream from the crest. Hence, it is most important that high- water marks be obtained in this area. Also, if the approach section is run at this same point, it is not necessary to correct for friction loss between the approach section and the dam.
Obtain elevation of the tail water for every computation of flow over a weir. It may be obvious in the field that the tail water was well below the crest of the dam, but always record the tail-water elevations in the field notes. If the tail-water is higher than the crest of the dam, determine tail-water profiles accurately because they may be used in the computation of discharge. Obtain tail-water elevations downstream from the energy recovery zone.
Cross sections
Survey a cross section in the approach reach to define the approach velocity and the height of the weir or dam above the stream bed. Make the distance from the weir crest to the
cross section equivalent to three to four times the head, h. If preliminary observations indi- cate that the ratio of weir height to head is greater than 10, it is not necessary to define the cross section in detail.
If high-water marks cannot be found at the prescribed location, it may be necessary to obtain the cross section farther upstream. However, always obtain the section as close to the prescribed location as possible to avoid adjustments for friction loss.
Dam details Cresf shape
Define the shape of the dam crest in the direction of flow to hundredths of a foot and in considerable detail. The slope of the upstream face, the rounding of the upstream edge, the width of the crest, the roughness of the crest, and the slope of the downstream face are impor- tant in determining the discharge coefficient. The upstream edge of a dam as often found in the field has been battered by rocks and logs until it has a semirounded edge which is difficult to describe. The field engineer should realize that he may be the only man to see the dam and his description and measurements will form the basis for selecting a discharge coefficient. Hence, make every effort to describe completely the crest shape. If the shape of the crest varies along its length, detail every change in the shape. The shape of the dam normal to flow should, of course, be very accurately measured in both the horizontal and the vertical planes.
Piers and abutments
Measure adequately the pier and abutment details and document them so that they can be exactly reproduced in plan view in the office. The radius of rounding of the upstream corner of the abutments is particularly important in the derivation of the discharge coefficient.
Gates and flashboards
If the dam is equipped with control gates or flashboards, it is very important that the opening of the gates or the condition of the flashboards at the time of the peak discharge be ascertained. If the gates (tainter, drum, lift, roll, or other) in any way affected the flow,

MEASUREMENT OF PEAK DISCHARGE AT DAMS BY INDIRECT METHODS 3
obtain detail drawings of the gates. Get this information as soon as possible after the peak. If records of gate operation are not kept by the agency in charge of the dam, question the dam tender for this information. If a record of operations has been maintained, make a copy of this record, along with any pertinent com- ments, as part of the field notes.
Debris
Debris lodging on piers, abutments, or the dam crest itself may have an appreciable effect on the head-discharge relationship. Here again, the quicker the dam can be inspected after the peak, the better. If at all possible, photograph conditions of the dam crest and piers as they were at the time of the peak. Lacking such a photograph, obtain a detailed description by the dam tender or maintenance crews.
Water bypajsing the crest of the dam
Determine the quantity of water bypassing the spillway crest at the time of the peak. This might be through a powerhouse, an irrigation canal, a public water supply, a fish ladder, or some other diversion. If the agency in charge of the dam has a record of its opera- tions during the flood, obtain a copy of this record.
Pictures
Pictures of the conditions of the dam crest, or flow conditions at the time of the peak are very desirable. If the engineer himself cannot obtain these, he should question the dam tender or maintenance people to see whether they have taken any pictures at the time of the peak or shortly thereafter. At the time of the survey, obtain detailed stereophoto- graphs of every pertinent feature of the dam. Closeup pictures of the dam crest (particu- larly t,he upstream edge), piers, abutments, gates, flashboards, and debris conditions are particularly important. Include a scale refer- ence in each picture, such as a ruler or level rod.
Office Procedures
Plot the plan, elevation, and cross-sectional views which show the geometry of the channel
and dam. Follow the computation procedures outlined in this report for the particular dam in question. Dams will be classified differently for different heads or shape parameters. For example, a broad-crested weir or a round- crested weir may act as a sharp-crested weir at certain heads. Some computations of flow over a dam are a cut-and-try process. That is, a discharge is assumed so that the velocity head in the approach section can be computed. Velocity head, plus the piezometric head, gives the total head used to compute the flow over the dam. This’ process is repeated until the assumed discharge checks the computed dis- charge within one percent. Other compu- tations make use of the static head, with the effect of velocity of approach being taken into account in the discharge coefficient. Hence, the user of this report is cautioned to make certain which head, static (h) or total (H), is applicable for the dam being studied.
Piers and abutments
Compute the effective length of the crest by deducting the width of piers from the total length. Neglect other minor effects of piers on the discharge coefficient in the computation of discharge. These minor effects, which in- clude contraction of the flow and changes in pressure in the lower nappe, may slightly in- crease or decrease the discharge coefficient at a given head. However, data to define ade- quately the effect of piers on the discharge coefficient are not available.
Abutments which contract the flow section have an appreciable effect on the discharge coefficient. The adjustment factor used to account for this effect is a function of the degree of contraction and the radius of round- ing of the upstream corner. ’
Weirs not level
If the crest of the dam or embankment is not truly horizontal, but is a little indmed (h,S 1.5ha), the discharge may be closely approximated by the use of the average crest elevation to obtain h in the ordinary weir formula. But more precisely, the correct dis- charge should be computed by the formula below. This formula is applicable to any dam

4 TECHNIQUES OF WATER-RESOURCES INVESTIGATIONS
that has a uniformly sloping crest, if the value of Cremains constant from one end of the dam to the other. The equation is given in terms of the static head, h. The total head, H, should be substituted for h if the discharge coefficient for a particular dam is referred to that head.
Q=5(h,-h.) 2Cb (fp.49, (1)
where Q= discharge, C= discharge coefficient, b=length of dam normal to flow,
h,=static head referred to high end of weir, and
hb=static head referred to low end of weir.
Weirs with curved or angled crest in plan
If the length of the crest greatly exceeds the width of the channel, the effective length of the crest is uncertain. For high dams with low-approach velocity the entire length should be considered effective. The correct procedure to use for low dams with high-approach velocity has not been defined.
Determination of weir height
The height of the weir, P, is an essential element in the selection of the discharge co- efficient. It is computed as the height of the weir above the average streambed elevation in a b width of the approach section taken 3- 4 h upstream from the weir. The b width represents a projection of the length of the spillway normal to the flow.
Rectangular Sharp-Crested Weirs
Truly sharp-crested weirs are very seldom used in field installations on natural channels where floodflows occur. Yet many types of dam crests in the field are for the most part sharp crested or act as such.
Flashboards which form the effective crest may usually be treated as sharp-edged weirs if they are high enough or are placed so that the upstream edge of the dam does not mate- rially influence the flow pattern. A dam with
a sharp upstream corner and level crest may act as a sharp-crested weir if the lower nappe springs clear of the downstream edge. With no appreciable velocity of approach and with complete aeration downstream, the lower nappe will clear if the head is greater than about 1.5 times the length of crest in direction of flow. Many round-crested dams are designed to fit the lower nappe profile of a sharp-crested weir at a given discharge, and the analysis of their discharge characteristics is based on data for sharp-crested weirs. For these reasons infor- mation on sharp-crested weirs is presented in detail in this report.
Basic equation
Flow over a rectangular sharp-crested weir is illustrated on figure 1. The discharge equation for this type of weir as used in this report is:
Q = Cbh312, (2)
where Q=discharge, C= discharge coefficient, b=width of weir crest normal to flow,
excluding width of piers, and h=static or piezometric head on a weir,
referred to the weir crest.
Discharge coefficients
Information on discharge coefficients for rectangular sharp-crested weirs is available from the investigations of the Bureau of Rec- lamation (1948)) Kindsvater and Carter (1959), and many others. These investigations show that the coefficient for free discharge is a func- tion of certain dimensionless ratios which de- scribe the geometry of the channel and the weir,
where E is the slope of the weir face; the other variables are depicted on figure 1.
The relation between C, h/P and E for weirs with no side contraction (b/B= 1.0) is shown on figure 2. The coefficient is defined in the range of h/P from 0 to 5. The value of the coefficient ’ becomes uncertain at higher values of hlP.

MEASUREMENT OF PEAK DISCHARGE AT DAMS BY INDIRECT METHODS 5
Figure 1 .-Definition sketch of a sharp-crested weir.
Side contractions reduce the effective length . of the weir crest. This effect is accounted for
by multiplying the value of Cfrom figure 2 by a correction factor k,. This factor is a function of b/B and h/P, and the relationship for a square-cornered entrance is defined on figure 3. If .the abutment corners are rounded with ra- dius r and rfb>0.12, assume that k,=l.OO. For lesser values of r/b, interpolate between these two values.
Submerged sharp-crested weirs
If the elevation of the tail water is above the elevation of the crest of the weir, the effect of
submergence on the head-discharge relation for free flow must be considered. Many investigations of flow over submerged weirs have shown that the ratio, k,, of discharge under submerged conditions to that for free flow can be expressed as follows:
kr=f (2, s), where
h,=height of tail water above weir crest, H=height of headwater total energy
level above weir crest, and P=height of weir.

TECHNIQUES OF WATER-RESOURCES INVESTIGATIONS
3.2
h -
0
P
Figure I.- Discharge coefficients for full width, vertical, and inclined sharp-crested rectangular weirs.
0.90
y”
0.80
0.7 8
h P
Figure 3.-Definition of adjustment factor, lc,, for contracted sharp-crested weirs.
MEASUREMENT OF PEAK DISCHARGE AT DAMS BY INDIRECT METHODS
0.8
0.6
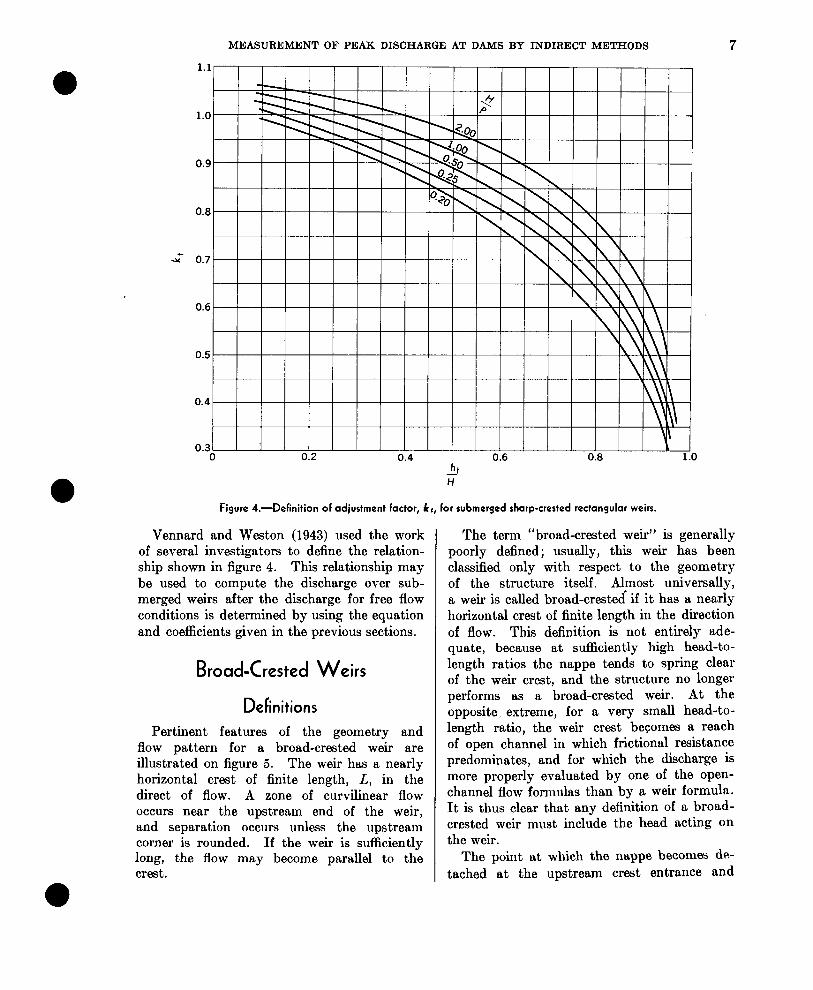
Figure 4.-Definition of adjustment factor, kg, for submerged sharp-crested rectangular weirs.
Vennard and Weston (1943) used the work of several investigators to define the relation- ship shown in figure 4. This relationship may be used to compute the discharge over sub- merged weirs after the discharge for free flow conditions is determined by using the equation and coefficients given in the previous sections.
Broad-Crested Weirs
Definitions
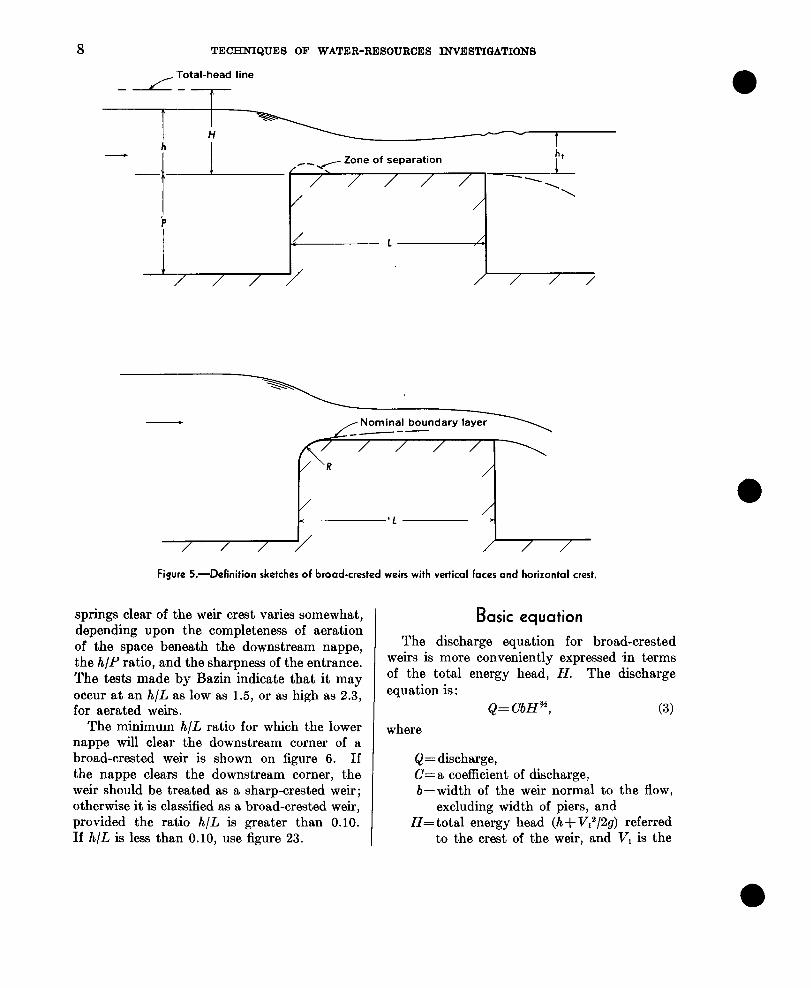
Pertinent features of the geometry and flow pattern for a broad-crested weir are illustrated on figure 5. The weir has a nearly horizontal crest of finite length, L, in the direct of flow. A zone of curvilinear flow occurs near the upstream end of the weir, and separation occurs unless the upstream corner is rounded. If the weir is sufficiently long, the flow may become parallel to the crest.
The term “broad-crested weir” is generally poorly defined; usually, this weir has been classified only with respect to the geometry of the structure itself. Almost universally, a weir is called broad-crested if it has a nearly horizontal crest of finite length in the direction of flow. This definition is not entirely ade- quate, because at sufficiently high head-to- length ratios the nappe tends to spring cleai of the weir crest, and the structure no longer performs as a broad-crested weir. At the opposite, extreme, for a very small head-to- length ratio, the weir crest becomes a reach of open channel in which frictional resistance predominates, and for which the discharge is more properly evaluated by one of the open- channel flow formulas than by a weir formula. It is thus clear that any definition of a broad- crested weir must include the head acting on the weir.
The point at which the nappe becomes de- tached at the upstream crest entrance and
8 TECRNIQUES OF WATER-RESOURCES INVJZSTIGATIONS
Figure S.-Definition sketches of broad-crested weirs with vertical faces and horizontal crest.
springs clear of the weir crest varies somewhat, depending upon the completeness of aeration of the space beneath the downstream nappe, the h/P ratio, and the sharpness of the entrance. The tests made by Bazin indicate that it may occur at an h/L as low as 1.5, or as high as 2.3, for aerated weirs.
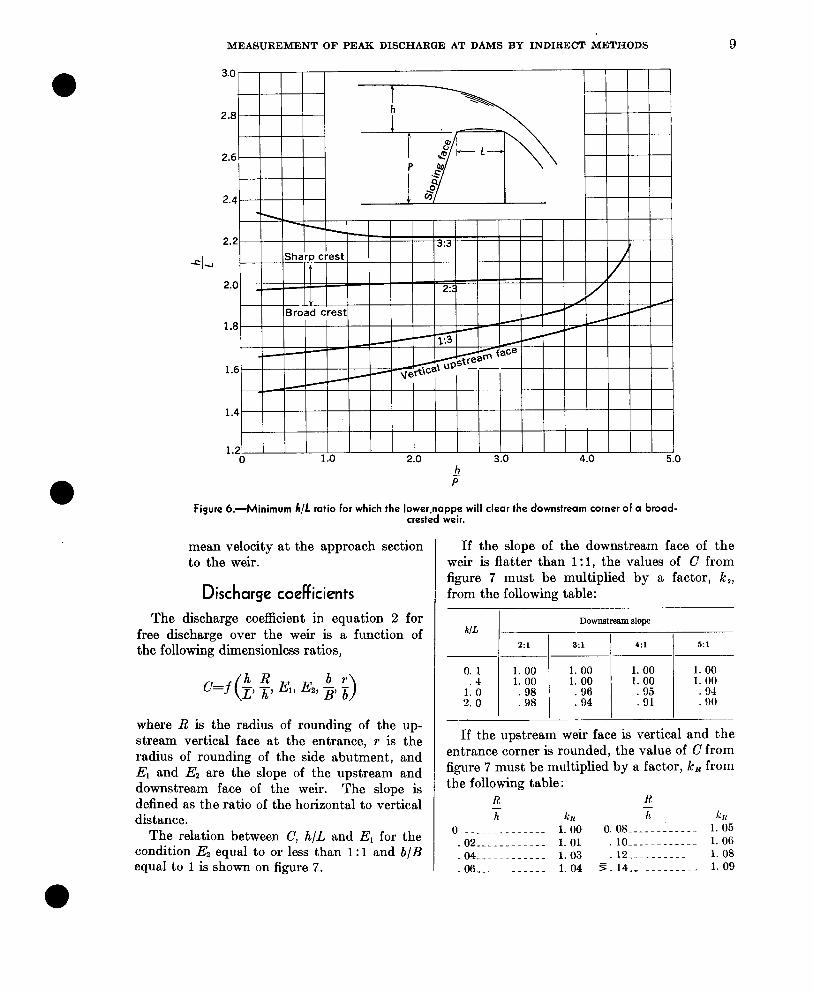
The minimum h/L ratio for which the lower nappe will clear the downstream corner of a broad-crested weir is shown on figure 6. If the nappe clears the downstream corner, the weir should be treated as a sharp-crested weir; otherwise it is classified as a broad-crested weir, provided the ratio h/L is greater than 0.10. If h/L is less than 0.10, use figure 23.
Basic equation
The discharge equation for broad-crested weirs is more conveniently expressed in terms of the total energy head, H. The discharge equation is :
Q= CbH”, (3) where
&= discharge, C=a coefficient of discharge, b=width of the weir normal to the flow,
excluding width of piers, and H= total energy head (hf V12/2g) referred
to the crest of the weir, and VI is the
MEASUREMENT OF PEAK DISCHARGE AT DAMS BY INDIRECT METHODS 9
3.0 -
2.8
2.4
1.8
1.6
2.0 3.0 4.0 5.0 h F
Figure 6.- Minimum h/L ratio for which the lower.nappe will clear the downstream corner of a broad- crested weir.
mean velocity at the approach section to the weir.
Discharge coefficients
The discharge coefficient in equation 2 for free discharge over the weir is a function of the following dimensionless ratios,
where R is the radius of rounding of the up- stream vertical face at the entrance, r is the radius of rounding of the side abutment, and El and Ez are the slope of the upstream and downstream face of the weir. The slope is defined as the ratio of the horizontal to vertical distance.
The relation between C, h/L and E, for the condition Ez equal to or less than 1: 1 and b/B equal to 1 is shown on figure 7.
If the slope of the downstream face of the weir is flatter than 1: 1, the values of C from figure 7 must be multiplied by a factor, k,, from the following table:
hlL Downstream slope
2:l 3:1 4:l 5:l
0. 1 1. 00 1. 00 1. 00 1. 00 .4 1. 00 1. 00 1. 00 1. 00
i:: : ii : El : 8: : El -
If the upstream weir face is vertical and the entrance corner is rounded, the value of C from figure 7 must be multiplied by a factor, kR from the following table:
R K x h Tk lilt
0 _._---__-----_ 1.00 0.08 ____ -_:--_-.. 1.06 .02 _________.__ 1.01 .lO------ __---- 1.06 .04----- _____ -- 1.03 12 _____ -__-_.. 1.08 .06--_--- ____ -- 1.04 5: 14 ____ --__-___ 1. 09
10 TECmIQUES OF WATER-RESOURCES INVESTIGATIONS
3.80
F
3.40 I
/ A’
3.20 / /
3.60
3.00
2.80
2.60
2.40 0 0.2 0.4 0.6 0.8 l.O
h i
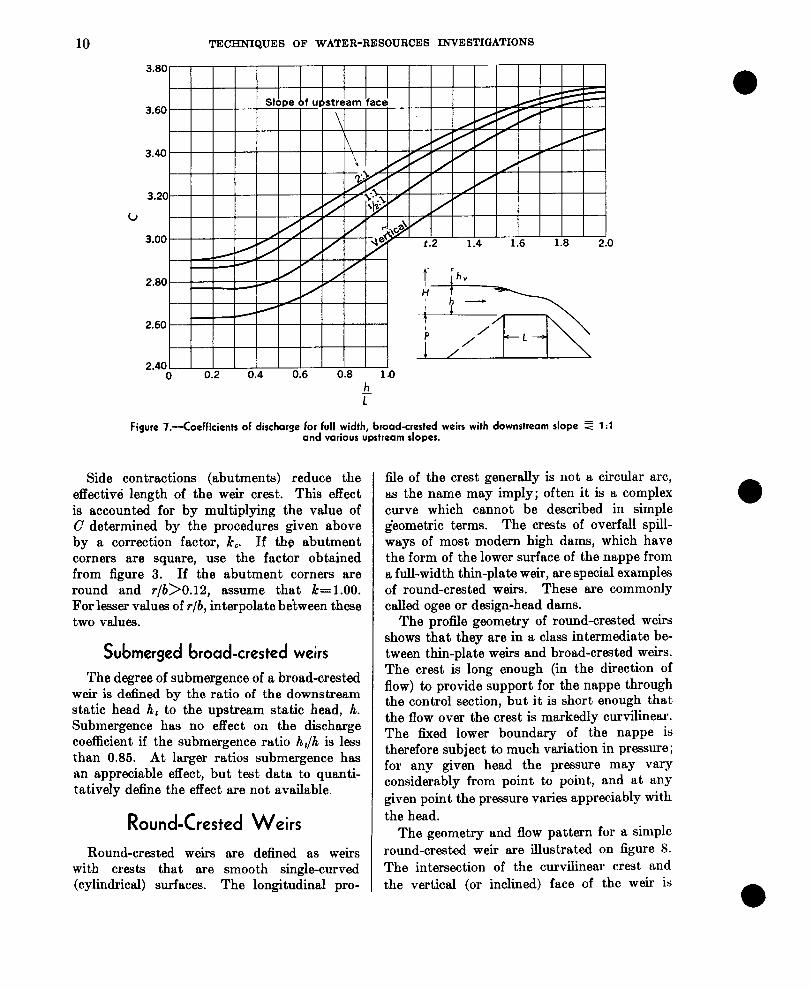
Figure ‘I.--Coefficients of discharge for full width, broad-crested weirs with downstream slope Z 1:l and various upstream slopes.
Side contractions (abutments) reduce the effective length of the weir crest. This effect is accounted for by multiplying the value of C determined by the procedures given above by a correction factor, k,. If the abutment corners are square, use the factor obtained from figure 3. If the abutment corners are round and r/b>0.12, assume that k=l.OO. For lesser values of r/b, interpolate between these two values.
Submerged broad-crested weirs
The degree of submergence of a broad-crested weir is defined by the ratio of the downstream static head h, to the upstream static head, h. Submergence has no effect on the discharge coefficient if the submergence ratio h,/h is less than 0.85. At larger ratios submergence has an appreciable effect, but test data to quanti- tatively define the effect are not available.
Round-Crested Weirs
Round-crested weirs are defined as weirs with crests that are smooth single-curved (cylindrical) surfaces. The longitudinal pro-
fle of the crest generally is not a circular arc, as the name may imply; often it is a complex curve which cannot be described in simple geometric terms. The crests of overfall spill- ways of most modern high dams, which have the form of the lower surface of the nappe from a full-width thin-plate weir, are special examples of round-crested weirs. These are commonly called ogee or design-head dams.
The profile geometry of round-crested weirs shows that they are in a class intermediate be- tween thin-plate weirs and broad-crested weirs. The crest is long enough (in the direction of flow) to provide support for the nappe through the control section, but it is short enough that the flow over the crest is markedly curvilinear. The fixed lower boundary of the nappe is therefore subject to much variation in pressure; for any given head the pressure may vary considerably from point to point, and at any given point the pressure varies appreciably with the head.
The geometry and flow pattern for a simple round-crested weir are illustrated on figure 8. The intersection of the curvilinear crest and the vertical (or inclined) face of the weir is
MEASUREMENT OF PEAK DISCHARGE AT DAMS BY INDIRECT METHODS 11
-AL--- ~ Energy grade line
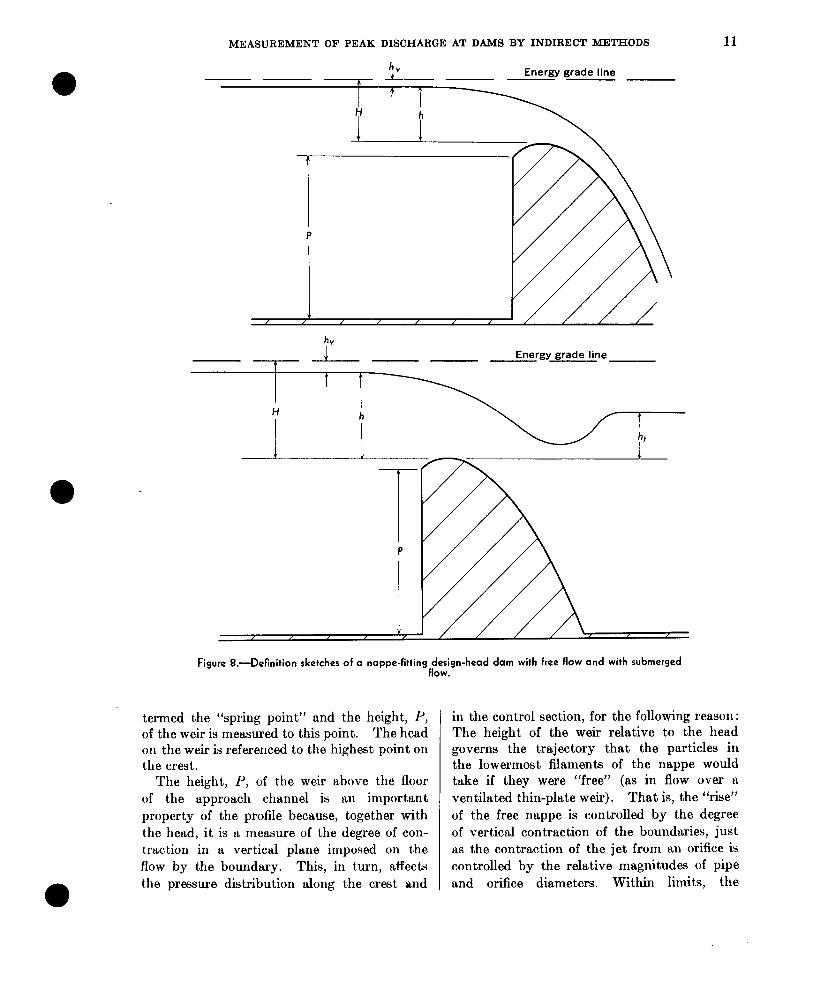
Figure 8.-Definition sketches of a nappe-fittingfp;ign-head dam with free flow and with submerged
termed the “spring point” and the height, P, of the weir is measured to this point. The head on the weir is referenced to the highest point on the crest.
The height, P, of the weir above the floor of the approach channel is an important property of the profile because, together with the head, it is a measure of the degree of con- traction in a vertical plane imposed on the flow by the boundary. This, in turn, affects the pressure distribution along the crest and
in the control section, for the following reason: The height of the weir relative to the head governs the trajectory that the particles in the lowermost filaments of t,he nappe would take if they were “free” (as in flow over a ventilated thin-plate weir). That is, the “rise” of the free nappe is controlled by the degree of vertical contraction of the boundaries, just as the contraction of the jet from an orifice is controlled by the relative magnitudes of pip6 and orifice diameters. Within limits, the

12 TECHNIQUES OF WATER-RESOURCES INVESTIGATIONS
higher the weir is for a given head, the greater the rise. Thus, if a round-crested weir has a crest which fits exactly a free nappe for a certain head, the pressure along the crest is substantially zero (atmospheric). If, with no change in head or in crest conformation, the height of the weir were to be made smaller, the solid crest would protrude above the profile of the nappe from a thin-plate weir of com- parable height. The pressure along the solid crest would no longer be zero. Positive pres- sure would exist because the crest, would deflect the stream slightly upward from its “free” position. The increase of pressure in the control section must result in a decrease in discharge coefficient.
The inclination of the upstream face of the weir likewise influences the discharge through its influence on the contraction of the nappe. As a general rule, the flatter the slope of the upstream face the lower the free-nappe pro- file will be.
Round-crested weirs comprise an unlimited variety of specific crest profiles, even with- in the limitation that no profile may include local curvature so great that the nappe sepa- rates from the crest. Because viscous effects are considered to be negligible, the boundary geometry uniquely determines the flow pattern over the crest. Thus, for each specific boundary profile there is a unique flow pattern for any given head, with unique velocity and pressure distributions in the nappe which determines the discharge coefficient,.
Basic equation
The discharge equation for round-crested weirs as used in this manual is referenced to the piezometric head h. The equation is
where
(2)
Q= discharge, C= coefficient of discharge, b=length of the crest normal to the flow
excluding piers, and h=static head referred to the crest of
the dam.
Discharge coefficients
The discharge coefficient for round-crested weirs is a function of both weir geometry and head. Because of the endless variety of weir shapes, however, no general solution for the discharge coefficient is available. One of the following methods is generally used to es- tablish discharge coefficients for a .particular weir.
1. Results of model tests for the particular dam used in the measurement.
2. Comparison with other crest for which the discharge coefficient is known.
3. Nappe-fitting method. 4. Index-measurement method. Model tests are seldom available except for
very large dams. However, this possibility should be investigated. The owners of the dam will usually provide this information if it is available.
Perhaps the oldest most widely used pro- cedure for estimating a discharge coefficient is to compare the profile of the weir in ques- tion with the profiles of others whose calibra- tions are known and to use the head-discharge coefficient relationship of the one which bears the closest resemblance. For similitude of the two flows, it is necessary that reasonably good correspondence of the crest profiles be obtained, especially from about the “spring” point to the crown; that a proportional, not equal, value of the head be used; that the relative heights of the weirs be not greatly different, especially if one weir is low; and that the width-contraction aspects of the calibrated weir be reasonably similar to those of the weir in question. Often, some important aspects of the geometry are not known, either for one weir or the other, and are necessarily ignored. An extensive catalog of weir calibra- tions which included all important data, systematically arranged, would improve the status of this method, but no such catalog is available.
The nappe-fitting method gives good results if the crest of the weir follows the form of the lower nappe from a full-width thin-plate weir. This method is explained in detail in the following section.
The index-measurement m&hod depends 011 the availability of at least one discharge
MEASUREMENT OF PEAK DISCHARGE AT DAMS BY INDIRECT METHODS 13
measurement to define the coefficient at one value of head. It is most useful for crests which have an odd shape. The method is discussed in detail on page 23.
All four of the methods provide discharge coefficients for free-flow over a full-width weir. The effect of side contractions and submergence are considered separately.
Nappe-Fitting method
Nappe fitting is the comparison of the pro- file of the crest with the profile of the lower nappe of sharp-crested weirs. The head on the sharp-crested weir which produces a lower nappe that coincides with the crest profile is called the reference head, h,. This reference head and the corresponding coefficient for sharp- crested weirs may be used to determine the corresponding discharge coefficient for the round-crested weir at this particular head. Use can then be made of defined relationships to synthesize the entire head-coefficient curve of the round-crested weirs.
The nappe-fitting technique for determining the discharge coefficient for round-crested weirs was first presented by Borland (1938). Additional contributions were made by Bradley (1952) and Kirkpatrick (1957). The relation- ships presented in this report are based on a comprehensive study of existing information by Jones.’
Much of the basic information used in these studies was obtained by the Bureau of Reclamation.
Definitions for reference weir
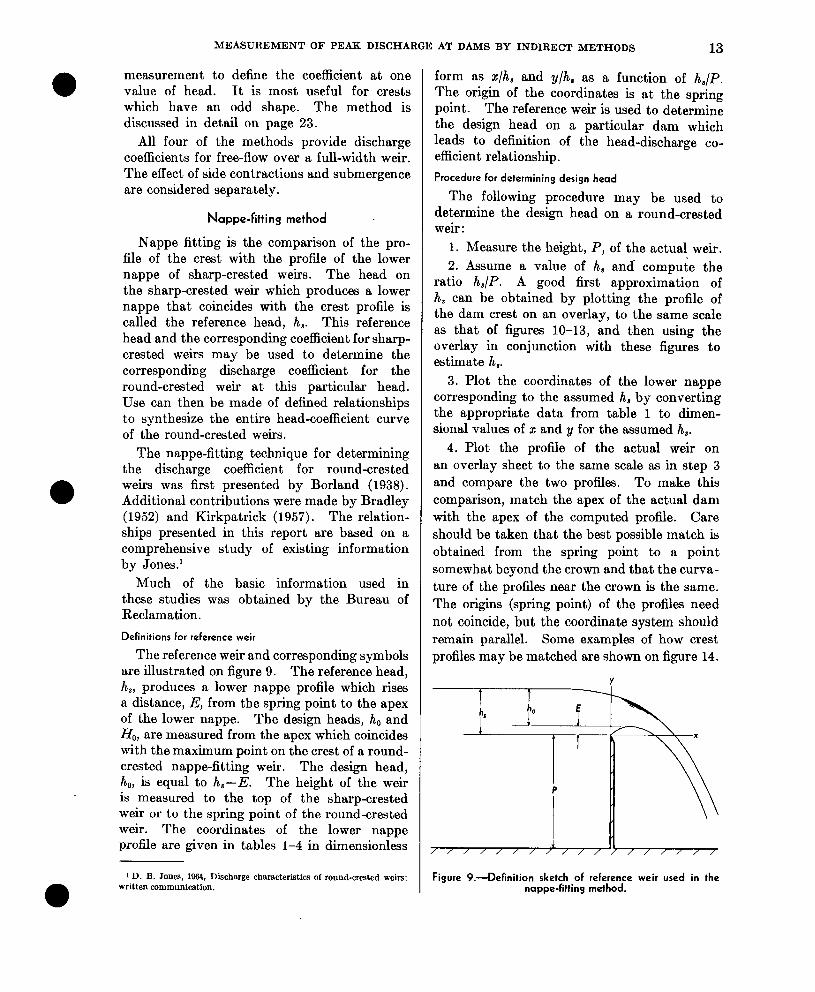
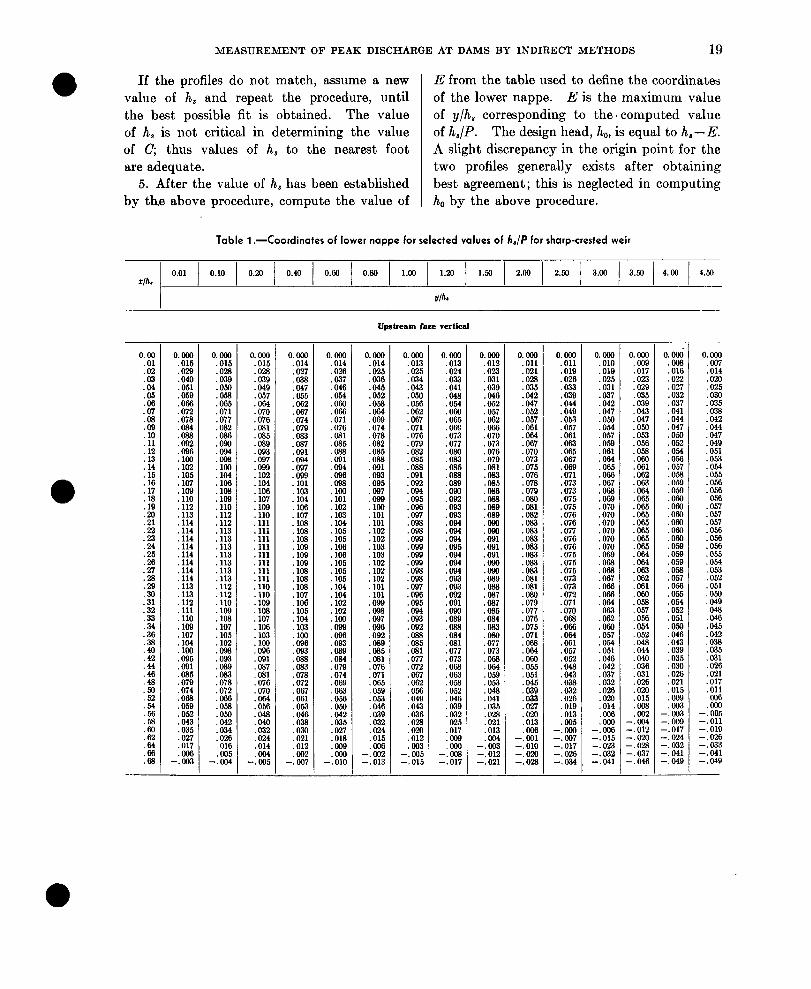
The reference weir and corresponding symbols are illustrated on figure 9. The reference head, h,, produces a lower nappe profile which rises a distance, E, from the spring point to the apex of the lower nappe. The design heads, h, and Ho, are measured from the apex which coincides with the maximum point on the crest of a round- crested nappe-fitting weir. The design head, ho, is equal to h,-E. The height of the weir is measured to the top of the sharp-crested weir or to the spring point of the round-crested weir. The coordinates of the lower nappe profile are given in tables 14 in dimensionless
* D. B. Jones, 1964, Discharge characteristics of round-crested woks: written communication.
form as x/h, and y/h, as a function of h,/P. The origin of the coordinates is at the spring point. The reference weir is used to determine the design head on a particular dam which leads to definition of the head-discharge co- efficient relationship.
Procedure for determining design head
The following procedure may be used to determine the design head on a round-crested weir :
1. Measure the height, P, of the actual weir. 2. Assume a value of h, and compute the
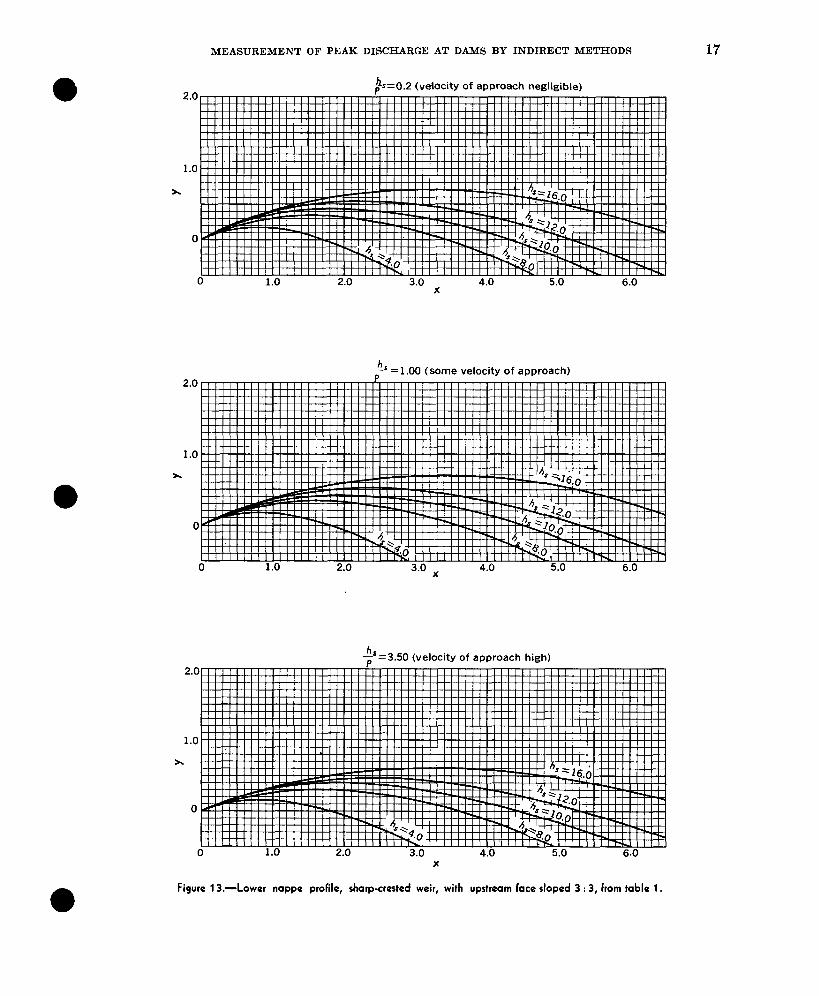
ratio h,/P. A good first approximation of h, can be obtained by plotting the profile of the dam crest on an overlay, to the same scale as that of figures 10-13, and then using the overlay in conjunction with these figures to estimate h,.
3. Plot the coordinates of the lower nappe corresponding to the assumed h, by converting the appropriate data from table 1 to dimen- sional values of x and y for the assumed h,.
4. Plot the profile of the actual weir on an overlay sheet to the same scale as in step 3 and compare the two profiles. To make this comparison, match the apex of the actual dam with the apex of the computed profile. Care should be taken that the best possible match is obtained from the spring point to a point somewhat beyond the crown and that the curva- ture of the profiles near the crown is the same. The origins (spring point) of the profiles need not coincide, but the coordinate system should remain parallel. Some examples of how crest profiles may be matched are shown on figure 14.
x -\.a
Figure 9.-Definition sketch of reference weir used in the nappe-fitting method.

14 TECHNIQUES OF WATER-RESOURCES INVESTIGATIONS
2
1
x
Figure lO.- Lower nappe profiles, sharp-crested weir, with upstream face vertical, from table 1.

MEASUREMENT OF PEAK DISCHARGE AT DAMS BY INDIRECT METHODS 15
h ,s=~.oo (some velocity of approach) 2
1
r,
Figure ll.- Lower nappe profiles, sharp-crested weir, with upstream face sloped 1 : 3, from table I

16 TECHNIQUES OF WATER-RESOURCES INVESTIGATIONS
2
1 x
Figure 1 P.--Lower nappe profiles, sharp-crested weir, with upstream face sloped 2: 3, from table 1.
MEASUREMENT OF PEAK DISCHARGE AT DAMS BY INDIRECT METHODS 17
$ = 1.00 (some velocity of approach)
h -‘=3.50 (velocity of approach high) D
X
Figure 13.-L ower nappe profile, sharp-crested weir, with upstream face sloped 3 : 3, from table 1.

18 TECHNIQUES OF WATER-RESOURCES INVESTIGATIONS
I d
MEASUREMENT OF PEAK DISCHARGE AT DAMS BY INDIRECT METHODS 19
If the profiles do not match, assume a new E from the table used to define the coordinates value of h, and repeat the procedure, until of the lower nappe. E is the maximum value the best possible fit is obtained. The value of y/h8 corresponding to the, computed value of h, is not critical in determining the value of h,/P. The design head, ho, is equal to h,- E. of C; thus values of h, to the nearest foot A slight discrepancy in the origin point for the are adequate. two profiles generally exists after obtaining
5. After the value of h, has been established best agreement; this is neglected in computing by th,e above procedure, compute the value of ho by the above procedure.
Table 1 .-Coordinates of lower nappe for selected values of h./P for sharp-crested weir
0.01 1 0.10 1 0.x) 1 0.40 1 0.60 1 0.80 1 1.09 I 1.20 x/h. I 1.50 I 2.00 1 2.50 I 3.00 1 3.50 ( 4.00 1 4.59
ulh.
0.00 .Ol .02 .03
:3 .06 .07
::
::: .12
:::
::i
2;
:E .21
1: .25 .26
:El
:: .31 .32 .33 .34 .36
:E .42 .44 .46 .48
:-ii
1:
:E .62
:E .6!3
---
0. OIN 5% :E ::2 ,072
:E 1!! .loO
:E
:%
:::i .113
2::
::::
::::
::::
: ::i
2::
:%I
::ii
:% .091 ,085
:E
:iE ,052 .043 ,035 ,027 ,017 ,006
-.003
0. o&l
::2 ,039 .050
;fij
:Z
:E ,094 .098
:E
::Zi
:E
:::; 113
: 113 ,113
: ::z
4: : 112 112
: 110
:E .107
: :"oz"
:E ,089
2%
:E .058 ,050 ,042 ,034 ,026 ,016 ,005
-.MM
0.004 :Z ,039 ,049
:K ,070 ,076 .081 .085 ,089 .093 ,097 .099 102
: 104
: E . 109
:::i
2::
: :::
: ::: .lll
:::i .109 ,108 ,107 106
: 103
:% ,091 ,087 ,081 ,076 .070
:Z
:E ,032 ,024 .014
-:%
0. ooo :Z :E .055 .062 ,067 .074
:% .067 ,091 .094
:E 101
: :::
:::: .108
108 : 108 109
: 109 ,109 ,108 .108
2;
.105 ,104 .103
1;;
:E ,078 .072 ,067 ,061 ,053
:% ,030 .021 ,012 ,002
-.007
0. m ,014 .026
22
;g
,071 ,076 ,081 ,065
t;
.096 ,098
::: 102
:103
:E ,105 .106
::ii .105 ,105
: ii: .102 .102 .lCO
;zJ
.089 ,084
:E .069 .063 ,056 ,050
:E ,027 .018
:% -. 010
Upstream face verticat
0. ooo .014 .025 .036 ,045 .062 .058
:E
:E ,082 ,085 ,088
:E ,095 ,097 ,099
::iG . 101 ,102 ,102
::ii .102 .102
::kY
:A2
;g
,092 ,089 ,085 ,081 ,076 ,071 ,065
:% ,046
5% ,024 ,015
-:E -. 013
0. cm ,013 .025 .034 ,043 * 050
:E ,067 ,071
::;B" .082 ,085 ,088 .091
:E ,095
:Z
:E
Ii2 ,099 ,098
:E .096
:E
:E ,088 .085 .081 .077 ,072 ,067
:% ,049 .043 ,036
:% .012 ,003
-.005 -. 015
0. ooo
:% ,033 ,041
:% ,060 .065 ,069 .073 .077
:E
:E . 039
:ZE ,093 .093 .094
:z
:E
:% ,093 .093
2%
:z .088 ,084 ,081 ,077 .073 ,068
:Ei .052 ,046 ,039 ,032 025
,017
:E --.008 -. 017
0. wo .012 .023 ,031 .039 .046 .052 ,057 .062 ,066 .070 .073 .076 ,079 .081
:%
:E ,039
:"G
;g
. 091
.oQo
:E .0&7
:E ,085 ,084
:E ,077 .073 ,068 ,064
:E.t .048 ,041
:E ,021 .013 ,004
--.m -. 012 -. 021
0. coo .Oll ,021 .028 ,035 .042 .047 ,052 .057 ,061 .064 .067 .070 ,073 .075
:E .079
:E ,082 ,083 ,083 ,083 .083 .083 ,083
2% . 081
5% .077
:% ,071 ,068 ,064
:E ,051
:ZiZ
:Z .om ,013 ,006
-. 001 -. 010 -.020 -.028
0. ooo ,011 .OlQ .026 ,033 .039 .044 .049
:% .061 .063 .065 ,067 .069 .071 ,073 ,073 .075 .076 ,076 ,076 ,077 ,076 .076 ,075
:% .073
:E
:E ,068
:E ,061 ,057 ,052
;E
:Ei ,019 ,013 .005
I$+ -. 017 1:g:
0. ocil ,010 ,019 .025 ,031 .037 ,042 ,047 ,050 .054 ,057 ,059 ,061 .064 ,065 .066 ,067
:E .070 ,070 .070 .070 ,070
: E ,068 ,068 ,067 ,066 ,066
%i
::!i .057 ,054 ,051 .046 .042 .037 ,032 ,026
24 ,006
-1% -. 015 -.023 --.032 -. 041
0. ooa .cM39 ,017 .023 ,029 ,035
:E ,047 .050 ,053 ,056 ,058 ,060 ,061 ,062 .063 .064 ,065 ,065 ,065 ,065 ,065 ,065 ,065 ,064
!!i ,061 ,060 ,058 ,057 ,056 .054 ,052 ,048 ,044 ,040 .036 ,031 ,026 .Ou) ,015 .0x3 ,002
3: -.020 -.028 -. 037 -.046
-
0.04 :k? .022 .027 .032 ,037 ,041 ,044 ,047 ,050 .052 .054 ,056 .057 ,063 ,059 ,059 .060 ,060 ,060 .060 ,060 ,060 .059 ,059 ,059 ,058 ,057 ,056 ,055 ,054 ,052 .051
:E ,043 ,039 ,035 ,030
:% ,015 ,009 ,003
11% -.017 I: ;;: -. 041 -.049
0. ooo :E .020 .025 ,030 ,035 ,038 .042 ,044 ,047 ,049 ,051 .053 .054 ,055 ,056 ,056
.E
.057 ,057
:E
:E ,054 ,053 ,052 .051 ,050 ,049
:E
:E .038 ,035 ,031 ,026 ,021 ,017 ,011
.i% -. 005 -. 011 -. 010 1:g -. 041 --.049

TECHNIQUES OF WATER-RESOURCES INVESTIGATIONS
Table 1 .-Coordinates of lower nappe for selected Mues of L./P for sharp-crested weir-Continued
’ 0.01 FlO 1 0.20 / 0.43 ( 0.60 1 0.80 1 1.00 1 1.20 ) 1.50 1 2.00 1 2.53 1 3.00 1 3.56 1 4.06 z/h. 1 4.50
Up&am face eloped 1: 3 T
4E :E tE :E :E .067 .069 .071
2: .076
:Z
:E .0;9
:Z .oSO ,079
:z
3% .075
1%
:E .069 .067
:E .062
:E
:E
:E
:K
:z
=:E
0. oal . 010 .021
:E
:t .052
;g
:E
:3 .072
:tG: .075 .076 .U76
:%
:E .075
:z
:E .072
:E
:% :Ei .061 .a59 .057
:%
:E
:E
:E
:z
27
-
I
-
-
,
0. ax .016
:E .042
:E
:E
:i .971 .073 ,975 .077 .079 .081
:K%
:E
:E
:E
:E
:E
:E
:E .077 .075 .073
::: .@39
:Z .060
:%
2.i .031 .wzr
:E
-:E
0. ooo
:% .023
1E
:E
5%
:E
;iJf
:E
;g
:E
;g
:%
:E
:% ,061 .049
- -7 T 0. OLM :E :E :3 tc :i .047 .046 .050 .951 .a52
:Eii
:Z
:E
.I
.061
:E
:E
EJ
:E
:E
:E
:E
:E . 010
:% -.005 -. 012
1:g -.034
0.00 . 01 :E :E :: :i :11
12 : 13
3:
::T
::: .20 .21 .22 .23
2: .26 .27
:Z .30 .31 .32
:E
:Z .37
:E .40 .42
3
:1
2
:Z
:z -
- , “2
:Ei :Zi :i! r3 . 11
:::
::t .16 .17 .16
:;i .21
:Z .24 .25
:Z
::
;g
.33
-
I ,
- - , OMY
.014
:z .04(
:E
:E
:Z .069 .07C .072 .074 ,077 .076
:E .C01
;g
.om
:E .CQ31
;E
.077
:E
;f;
:E
:E .061 .a57
:E
22
1!!
:E -. 011
0. ca :E :Z .037
22
:E
:E
:E
:z
:Ei .067
:E
:E
li
2%
:E
E .060
:E
E
:i.Z
:E
tc .015
:E -.oa5 -. 013 -.022
0. ooo
.!!i
.019
:E
:2 .037
:z
:E
:E .O51 .052 .052
:E
:%
;E
.052
1;
.047
%J
0. ooo .w6 . 011 .016 .021
%j
:E
:E
:E .041
:E .043 .043 .043 .042 .042 .041
:Ki
5%
:i%
:z .a1
52
:E .021 ,019
:E
3% .oOl
-.m -.009 -. 016 -. lrzl --.I328 -.m -. 042 -.046 -_ 0.56
-
-
UpeLerim faceslopedZ:t [Asterisk (‘) ind@ates no data available]
O.@M
1;
:E .032
:E .043
:E
:E .053
:E .057
:E
1: .057 .046
:E
1;
.049
:% .045
0. OIM :E ;g :Ei :z :E .057
.!i
.082
:Z
:E
:kE
.!s
.061
:E .057
tii ,050
“:E 16 .021
:E .032
:E
:E
:E
:E .049
.i?
.lW
.051
:s
:%
:% .cM
rE ,040
O.OMl
.E!
.016
:Z
:E
:Ei .a39 .041 .043
:% .047
:El
1;
,051 .6.51
:E
:%
tE
:% .040

MEASUREMENT OF PEAK DISCHARGE AT DAMS BY INDIRECT METHODS
Table 1 .Aoordinates of lower nappe for selected values of ha/P for sharp-crested weir-Continued
upetmam face sloped 2:3--Continued
.045
.045
.043
.041
:L%
:z
:E .021 . 018 .015 ,012
:E .003
:Z :E :E .E .016 .013 .cm
:E
:z .041
:E
:E
:%
:El .017
3:
II
T T --
:E :E .032
:E
:E .UZl . 016 ,016 .012
5%
:%
-7
.040
:%
:z
:E
:E .019
:E .Oll
:z
-:iEl
-
-
-
,
/
/
,
, I I
I I ,
I ,
I
,
,
-
-
-
-
-
-
-
-
-
,045 :E :% :E :E .024 .020 .017
: k%
1!!!
:E 2; :E .030
:E
:E .016 .013 . 010 .007
:E
.34
.35
:E
:Z .40 .41 .42 .43 .44 .45 .40 .47 .48 .49 .Ml
0.00 .Ol .02
2 .05 .06 .07 .08 .09
::: .12
::: 16
:16
::!I
2 .21
:z
:2
:E
:E
4:
:E
:!!
:E
:E .40 .41 .42 .43 .44 .45 .46 .47 .48 .49 .50
5% :E :E .MO
:E
:E ,017
::::
tE
Upetream face sloped 3:3 [.4stedsk (*) indicates no data availablrl
0. ooo
:% . 011 .014 .017
:E
1Ei
SJ
:Ez .040 .040 .041
:E
:E .042 .040
:%
:E .036
SF&
.029
:K5
:%!I .016
:E3” . 010 .ow ,005 .002
-.Gvo
1:g --.OOQ -. 013 -. 016
0.000 1% .016 .020 .023 .026 .029
::e2
:%I .041 .042 .043
r:
:Z
:E .043 .042 .041 ,040 .038 .037 .036
:E :Z .026 .023 .020 .018 .015 ,011
:E .002
--.OOl -. 002 -. 007 -. 010 -. 014 -. 018 -.022 -. 020
“:% :El ,016 ,020
:l .029 .032 .035
s$i
,042
:i
:E
:E
2-z .043 .042 .041 .040
:z
:E .032 .030 .O!B
:E ,020 ,013 .015 ,011 .OOQ
:T -. 001 --.002 -.006 -. 010 -. 014 -. 017 -. 021 --.025
0. ooa
1: :E .022 .025 .028 .031
1%
:E .041
23” .043 .043
:% .043
5% ,041
2.4:
:E
:E .032 .030 .023
:2 .02ll .018 .016 ,013 ,010 ,007
:E -.OQl -.004 -. 008 -. 012 -. 015 -. 019 --.023
0. ml
ri!i .015 .01&l .022 .025 .028
:E ,036
:z ,041 ,042 .043
:E
:E
:E
:E .041 ,040
:E .036 .034 .033 ,031 .029
:2 ,022
:E ,014 .Oll
:E ,002
-. 001 -.003 -.@I7 -. 011 -.014 -.018 -.022
0. ooa
:i .012 .016 .016
:E .023
:E
:“G .039
:E .042
:%
:z
:E
2: ,041 .WO
:%
I% .031
:E .W .022
:% .014 .Oll
:E
-;E
-.GQ0
1: ;:I”
Z:jg
0. cm
.i!i
.015
:E .026 .OzI .030
:%
:E .040
::: .042
:E .043 ,043
:E .041 .041
:E .037
:E
:::: ,029 .027 .024
:Ei .016 .015
:E
:E ,001
-.04X -. 005 --.008 -. 012 -. 016 -. 019
0. ooo
I! .015 .013 .021 .024 .027 .030 .032
tH .040 ,041 ,041
:E
:E
:E
if;
.040
:E .036 .034 .032 .031 .029 .027 ,024 .021
:Z .015 ,012
:Ki
:E
-:El:
~:~ -. 016 -. 019
0. oom :E .Oll .016 .016 ,021 .024
:E .031
:E
rz
.040
.041 ,042 .043 .043
:E
2% ,041 .039
23
:E
:E ,029 .OzI .O% ,022 .019 .017 ,016 .013 . 010
:E .002
-. 001 -.004
3: --.014 -. 013
0. oom
%i :E .02U ,023 .028 .023 .03a .032
:E .037
0. oom
:%
0. OGil
:Z
;j8g
.018
.022
.024
.028
.023
.030
.032
g
.037
:E .039 .039
:E .038 .038 .037 .036
:E
:E .031 .029 .027
:2
:E .017
:i:: .009
:2 .002
-.ooo -. 003 -.006 -.W3 -. 011 -. 016
:E .016 .018 .023
:El ,023 .03a
:E .036 .03E .037
:E
:E
:E
:I%
:E .04a .04a .041 ,042 .042 .041 :E: .04m .039 .03Q
:::
2% .03m .02!3 ,023 .020 ,023 .020 .01&l ,016 .n14
:E .030 .036 .034 .031 .031 .02s .027 .02b ,024 ,022 .O!X ,017
:E .Oll
:E .oa ,001
--.ool -. 006
2% -. 013
,011
:E .003
-:z -.006 -.008

TECHNIQUES OF WATER-RESOURCES INVESTIGATIONS
3.85; ’ ’ ’ ’ ’ ’ ’ ’ 0.2 0.4 0.6 0.8
ho --- P-I-E
I ho \
-
i
.-
P+E
\
Figure 1 5.-Discharge coefficients corresponding to the design values of L/(P+E).
head, /I,,, for full width ogee dams for various
MEASUREMENT OF PEAK DISCHARGE AT DAMS BY INDIRECT METHODS 23
Head-discharge coefficient relationship
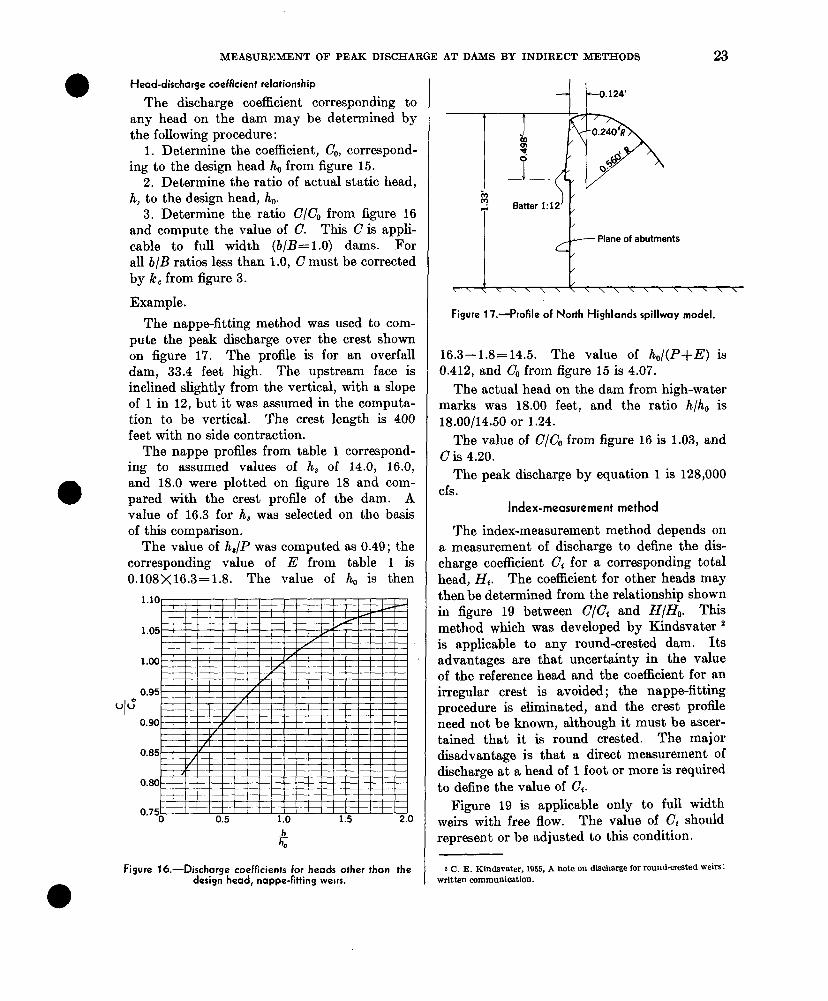
The discharge coefficient corresponding to any head on the dam may be determined by the following procedure:
1. Determine the coefficient, C,, correspond- ing to the design head ho from figure 15.
2. Determine the ratio of actual static head, h, to the design head, h,.
3. Determine the ratio C/C, from figure 16
and compute the value of C. This C is appli- cable to full width (b/B=l.O) dams. For all b/B ratios less than 1.0, C must be corrected by k, from figure 3.
Example.
The nappe-fitting method was used to com- pute the peak discharge over the crest shown on figure 17. The profile is for an overfall dam, 33.4 feet high. The upstream face is inclined slightly from the vertical, with a slope of 1 in 12, but it was assumed in the computa- tion to be vertical. The crest length is 400 feet with no side contraction.
The nappe profiles from table 1 correspond- ing to assumed values of h, of 14.0, 16.0, and 18.0 were plotted on figure 18 and com- pared with the crest profile of the dam. A value of 16.3 for h, was selected on the basis of this comparison.
The value of h,/P was computed as 0.49 ; the corresponding value of E from table 1 is 0.108X16.3=1.8. The value of h, is then
0.80
%
Figure 19 is applicable only to full width weirs with free flow. The value of Ci should represent or be adjusted to this condition.
Figure 16.-Discharge coefficients for heads other thon the 2 C. E. Kindwater, 1955, A note on discharge for round-crested weirs:
design head, nappe-fitting wows. written communication.
-0.124’
<+---Plane of abutments
/
/
1 \\\\\\\\:\\\\\\\\\\\
Figure 17.-Profile of North Highlands spillway model.
16.3-1.8=14.5. The value of hJ(P+E) is 0.412, and C, from figure 15 is 4.07.
The actual head on the dam from high-water marks was 18.00 feet, and the ratio h/ho is 18.00/14.50 or 1.24.
The value of C/C, from figure 16 is 1.03, and C is 4.20.
The peak discharge by equation 1 is 128,000 cfs.
Index-measurement method
The index-measurement method depends on a measurement of discharge to define the dis- charge coefficient Cf for a corresponding total head, Hi. The coefficient for other heads may then be determined from the relationship shown in figure 19 between C/C, and H/H,. This method which was developed by Kindsvater 2 is applicable to any round-crested dam. Its advantages are that uncertainty in the value of the reference head and the coefficient for an irregular crest is avoided; the nappe-fitting procedure is eliminated, and the crest profile need not be known, although it must be ascer- tained that it is round crested. The major disadvantage is that a direct measurement of discharge at a head of 1 foot or more is required to define the value of Ct.

24 TECHNIQUES OF WATER-RESOURCES INVESTIGATIONS
,I./-~--- . ‘-‘-.. . ..\. .,
‘\ \
Figure 18.-Determination of nappe-fitting head, North Highlands Dam.
IL HO
Figure 19.-Discharge coefficients for head other than the index head, round-crested weirs.
MEASUREMENT OF PEAK DISCHARGE AT DAMS BY INDIRECT METHODS 25 1s
0.5
02
0:
0.t
<lx O.!
0.1
0.:
0.;
0.1
(
kt
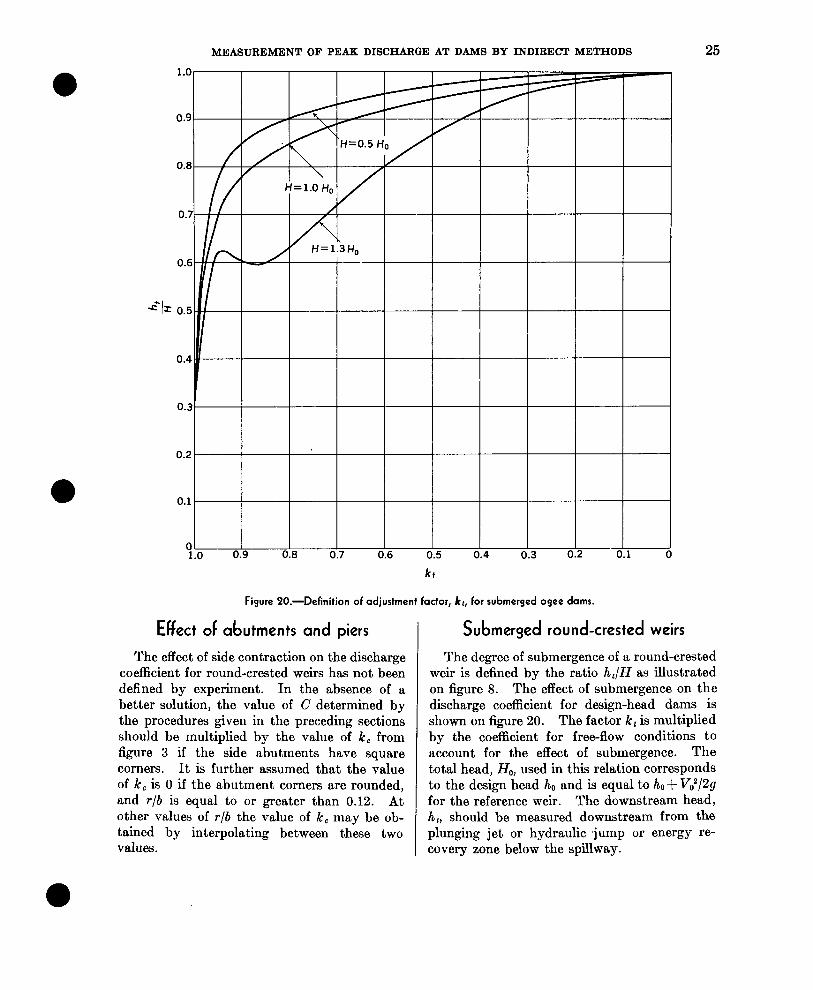
Figure IO.-Definition of adjustment factor, kr, for submerged ogee dams.
Effect of abutments and piers I
Submerged round-crested weirs
The effect of side contraction on the discharge The degree of submergence of a round-crested coefficient for round-crested weirs has not been weir is defined by the ratio h,/H as illustrated defined by experiment. In the absence of a on figure 8. The effect of submergence on the better solution, the value of C determined by discharge coefficient for design-head dams is the procedures given in the preceding sections shown on figure 20. The factor k, is multiplied should be multiplied by the value of k, from by the coefficient for free-flow conditions to figure 3 if the side abutments have square account for the effect of submergence. The corners. It is further assumed that the value total head, Ho, used in this relation corresponds of k, is 0 if the abutment corners are rounded, to the design head ho and is equal to ho + Vo2/2y and r/b is equal to or greater than 0.12. At for the reference weir. The downstream head, other values of r/b the value of k, may be ob- h,, should be measured downstream from the tained by interpolating between these two plunging jet or hydraulic jump or energy re- values. covery zone below the spillway.
26 TECHNIQUES OF WATER-RESOURCES INVESTIGATIONS
-fr_--
t f h H
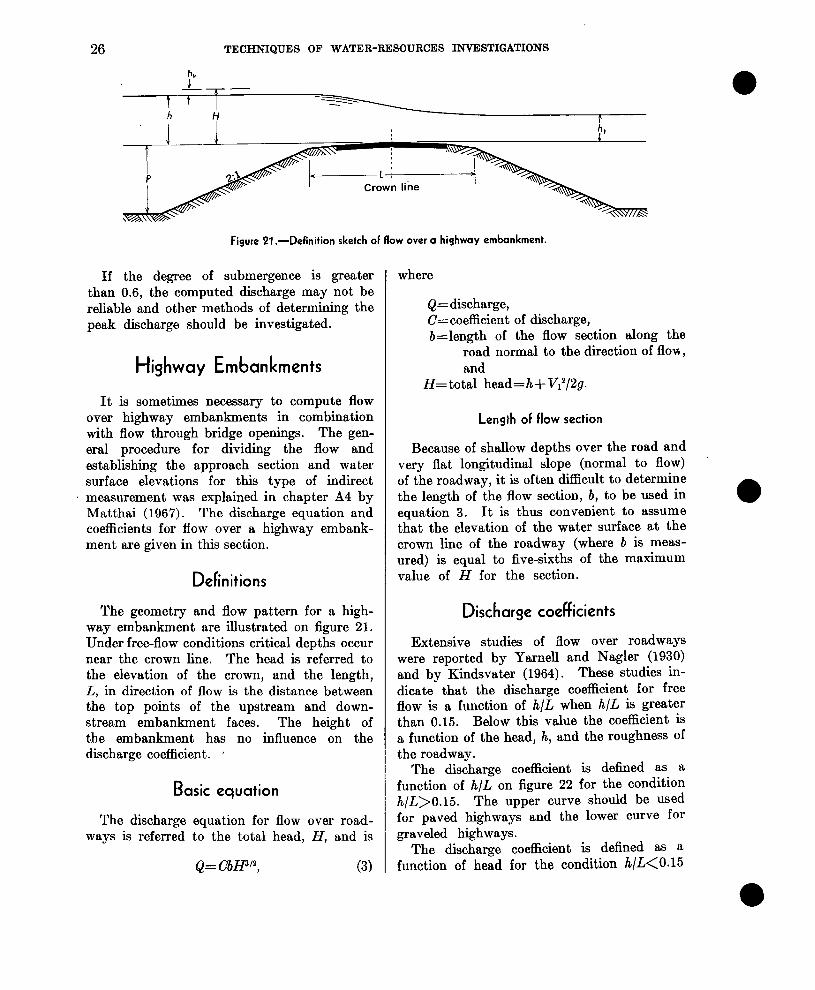
Figure 21 .-Definition sketch of flow over a highway embankment.
If the degree of submergence is greater than 0.6, the computed discharge may not be reliable and other methods of determining the peak discharge should be investigated.
Highway Embankments
It is sometimes necessary to compute flow over highway embankments in combination with flow through bridge openings. The gen- eral procedure for dividing the flow and establishing the approach section and water surface elevations for this type of indirect
f measurement was explained in chapter A4 by Matthai (1967). The discharge equation and coefficients for flow over a highway embank- ment are given in this section.
Definitions
The geometry and flow pattern for a high- way embankment are illustrated on figure 21. Under free-flow conditions critical depths occur near the crown line. The head is referred to the elevation of the crown, and the length, L, in direction of flow is the distance between the top points of the upstream and down- stream embankment faces. The height of the embankment has no influence on the discharge coefficient. 1
B asic equation
The discharge equation for flow over road- ways is referred to the total head, H, and is
Q= C’bH3’=, (3)
where
Q= discharge, C= coefficient of discharge, b=length of the flow section along the
road normal to the direction of flov+, and
H=total head=h+V?/2g.
Length of flow section
Because of shallow depths over the road and very flat longitudinal slope (normal to flow) of the roadway, it is often difficult to determine the length of the flow section, b, to be used in equation 3. It is thus convenient to assume that the elevation of the water surface at the crown line of the roadway (where b is meas- ured) is equal to five-sixths of the maximum value of H for the section.
Discharge coefficients
Extensive studies of flow over roadways were reported by Yarnell and Nagler (1930) and by Kindsvater (1964). These studies in- dicate that the discharge coefficient for free flow is a function of h/L when h/L is greater than 0.15. Below this value the coefficient is a function of the head, h, and the roughness of the roadway.
The discharge coefficient is defined as a function of h/L on figure 22 for the condition h/L>O.15. The upper curve should be used for paved highways and the lower curve for graveled highways.
The discharge coefficient is defined as a function of head for the condition h/L<0.15
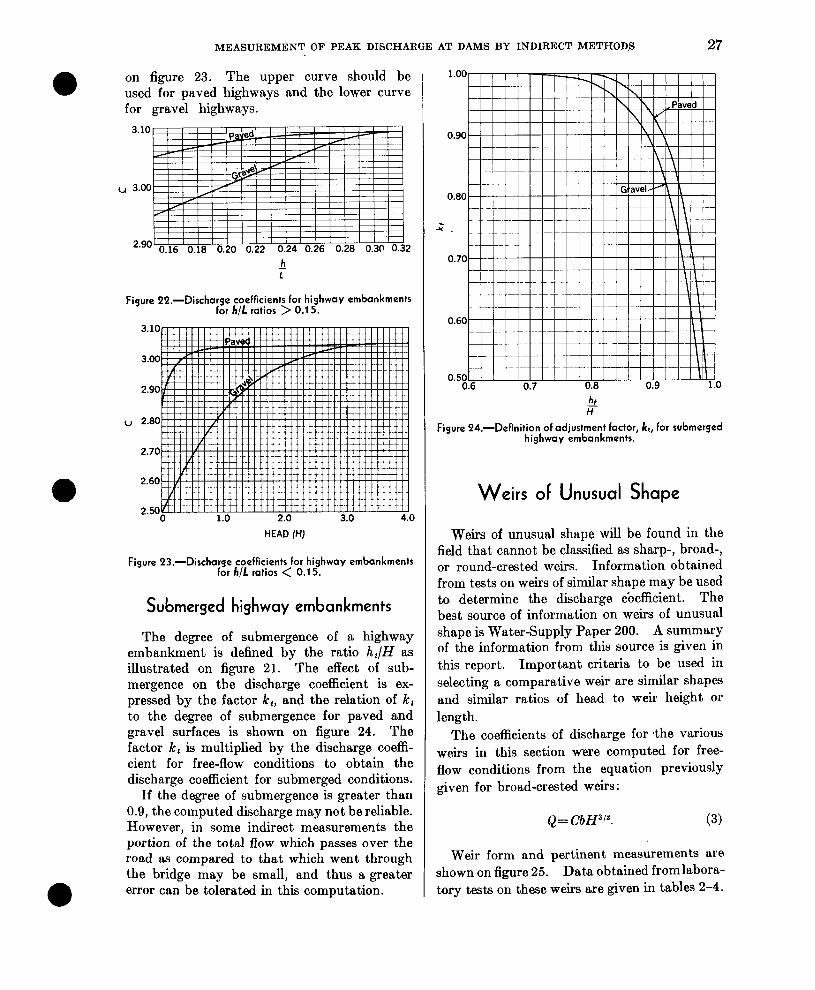
MEASUREMENT OF PEAK DISCHARGE AT DAMS BY INDIRECT METHODS 27
on figure 23. The upper curve should be used for paved highways and the lower curve for gravel highways.
3.10
u 3.00
2.90 2
Figure Il.-Discharge coefficients for highway embankments for h/L ratios > 0.15.
HEAD (H)
Figure 23.-Discharge coefficients for highway embankments for h/L ratios < 0.15.
Submerged highway embankments
The degree of submergence of a highway embankment is defined by the ratio h,/H as illustrated on figure 21. The effect of sub- mergence on the discharge coefficient is ex- pressed by the factor k,, and the relation of k, to the degree of submergence for paved and gravel surfaces is shown on figure 24. The factor k, is multiplied by the discharge coeffi- cient for free-flow conditions to obtain the discharge coefficient for submerged conditions.
If the degree of submergence is greater than 0.9, the computed discharge may not be reliable. However, in some indirect measurements the portion of the total flow which passes over the road as compared to that which went through the bridge may be small, and thus a greater error can be tolerated in this computation.
!!L H
Figure 24.-Definition of adjustment factor, kt, for submerged highway embankments.
Weirs OF Unusual Shape
Weirs of unusual shape will be found in the field that cannot be classified as sharp-, broad-, or round-crested weirs. Information obtained from tests on weirs of similar shape may be used to determine the discharge &efficient. The best source of information on weirs of unusual shape is Water-Supply Paper 200. A summary of the information from this source is given in this report. Important criteria to be used in selecting a comparative weir are similar shapes and similar ratios of head to weir height or length.
The coefficients of discharge for #the various weirs in this section were computed for free- flow conditions from the equation previously given for broad-crested weirs:
Q= CbH31’. (3)
Weir form and pertinent measurements are shown on figure 25. Data obtained fromlabora- tory tests on these weirs are given in tables 2-4.

28 TECHNIQUES OF WATER-RESOURCES INVESTIGATIONS
-I
‘I
h
Y
6 to 1 Sk@ 0.75’
2.0’ ” * 0.2’
4-I & 10.58’ 12.0’-
i
2
-- 4.67 to l -F c-4 SF4 b B a* 7.0’ H i
5
--
4
6
Figure 25.-Odd-shaped weir forms for which the value of C has been determined by laboratory experi- ment. See tables 2-4.

MEASUREMENT OF PEAK DISCHARGE AT DAMS BY INDIRECT METHODS
Table P.-Values of C for weir form 1 on figure 25 I
29
mpe or Slope of
“Wf” d”wnzLz~m
0.2 0.3 “o;yt.a& to Ho;fm~~ to
Head in feet, H
-- --
0.3 0.9 1.0
--
4. 11 4.10 4.08 3.84 3.85 3.85 3.46 3.47 3.48 3.86 3.87 3.87 3.73 3.74 3.74 3.69 3.69 3.69
1.2
3.93
z7” 3: 87 3.73 3.68
1.5
__-
3.75
Ei 3: 87 3.71 3.66
-
--
-
0.6
4.11 3.79 3.46 3.81
I:Ti
0.4 0.6
3.67
0.7
4. 11
3-z 3: 83 3.73 3.69
1:l 1:l 1:l
;;; _ _ _ - - - - 4.26 3.82 3.80
;;: --a-ss- 3.55
2:l 3174 . XBT i?:i 1 3.65 1 3.64
2:l 1:2 1:3
Table X-Values of C for weir forms 2-6 on figure 25 -
--
-
Head in feet, H
3.0 ---
3.5 --
3.22 3.33 3.32 3.39 3.46
i-3; 3: 33 3.38 3.51
-
_-
-
1-o--/- 1.5 1 2.0 1 2.5 4.0 4.5 5.0 5.5 ~ --.-
3.22 3.38
Ei 3: 59
3.22 3.38 3.41 3.39 3.62
3.22 3.22 3.38 3.38 3.46 ________ 3.41 ________ 3.65 ________
3. 13 3.22 3.22 3.22
- - - - - - - - 3.41 3.35
3.47 3.46 3.41 E8 _ - - - - - - - ___--------------- 3144
3.28 3.29 3.32 3.39
Table 4.-Valuer of C for weir forms 7-l 4 on figure 25 [All weirs were 11.25 ft high and either 3 or 16 ft wide. The 8ft weha were contracted at one end]
Head in feet, H -
I 1.6 2.0 1 2.5
--
3.32
Ez 3: 61
i:;
3: 54 3.55 3.10
-I--- 3.36 3.40 3.42 3.41
3.51 3.67 X-f: 3.75 3.52 “3: E4f
3: 46 3.36 3.35 3.20
3.0 3.6 4.0 4.5 5.0 yp-p__-
3.43 3.48 3.53 3.62 3.72
1
--
-
7
x
t
:‘:
:z 14
7.94 15.97 7.98
:E; 15: 97 15.97
:t- i:: 15: 93
I
Selected References Kindsvater, C. E., and Carter, R. W., 1959, Discharge characteristics of rectangular thin-plate weirs: Am. Sot. Civil Engineers Trans., v. 124, p. 772-801.
Kirkpatrick, K. W., 1957, Discharge coefficients for spillways at T.V.A. dams: Am. Sot. Civil En- gineers Trans., v. 122, p. 190-210.
Matthai, H. F., 1967, Measurement of peak discharge at width contractions by indirect methods: U.S. Geol. Survey Techniques Water-Resources Inv., book 3, chap. A4 (in press).
Tracy, H. J., 1957, Discharge characteristics of broad- crested weirs: U.S. Geol. Survey Circ. 397.
U.S. Bureau of Reclamation, 1948, Studies of crests for overfail dams: Buil. 3, Part 6 (Hydraulic Investi- gations), Boulder Canyon Proj. Final Repts.
Vennard, J. K., and Weston, R. F., 1943, Submergence effect on sharp-crested weirs: Eng. News-Rec., June 3, 1943, p. 118.
Yamell, D. L., and Nagler, F. A., 1930, Flow of water over railway and highway embankments: Public Roads, v. 11, no. 2, p. 30.
Benson, M. A., and Dalrymple, Tate, 1967, General field and o5ce procedures for indirect discharge measurements: U.S. Geol. Survey Techniques Water-Resources Inv., book 3, chap. Al (in press).
Borland, W. M., 1938, Flow over round-crest weirs: M.S. thesis, Colorado Univ.
Bradley, J. N., 1952, Discharge coefficients for irregular overfali spillways: Eng. Mon. 9, U.S. Bur. Reclamation.
Horton, R. E., 1907, Weir experiments, coefficients, and formulas: U.S. Geol. Survey Water-Supply Paper 200.
Kindsvater, C. E., 1964, Discharge characteristics of embankment-shaped weirs: U.S. Geol. Survey Water-Supply Paper 1617-A.