measurement-based change in libraries case studies from an academic library joan stein, head, access...
Post on 20-Dec-2015
221 views
TRANSCRIPT
Measurement-based Change in Libraries
Case Studies From an Academic Library
Joan Stein, Head, Access Services
Carnegie Mellon University Libraries
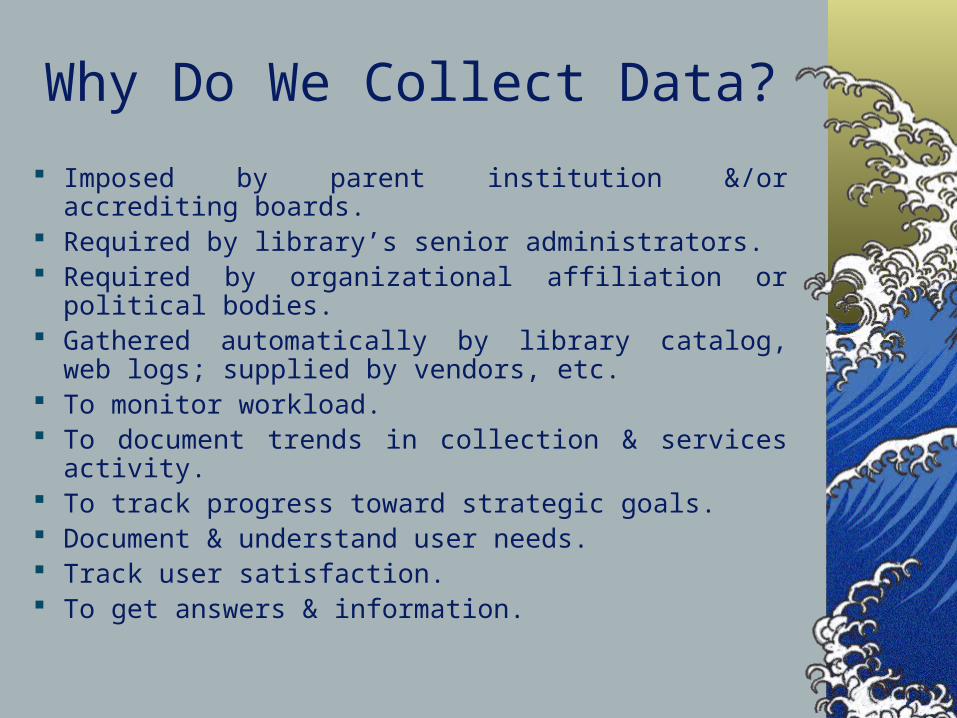
Why Do We Collect Data?
Imposed by parent institution &/or accrediting boards. Required by library’s senior administrators. Required by organizational affiliation or political bodies. Gathered automatically by library catalog, web logs;
supplied by vendors, etc. To monitor workload. To document trends in collection & services activity. To track progress toward strategic goals. Document & understand user needs. Track user satisfaction. To get answers & information.
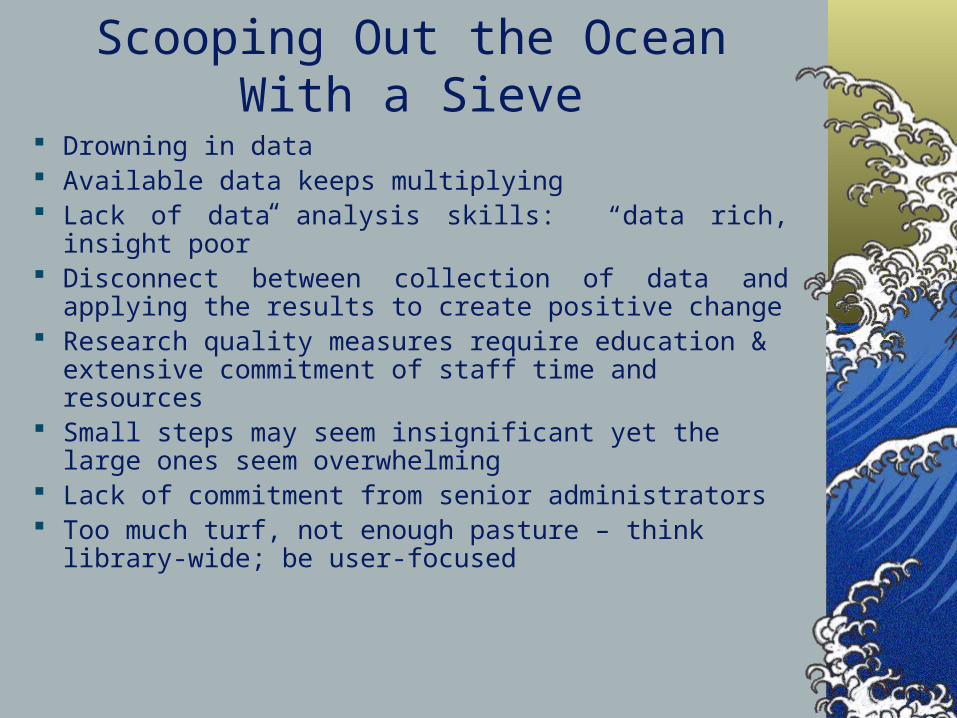
Scooping Out the Ocean With a Sieve
Drowning in data Available data keeps multiplying Lack of data analysis skills: “data rich, insight poor” Disconnect between collection of data and applying the
results to create positive change Research quality measures require education &
extensive commitment of staff time and resources Small steps may seem insignificant yet the large ones
seem overwhelming Lack of commitment from senior administrators Too much turf, not enough pasture – think library-wide;
be user-focused
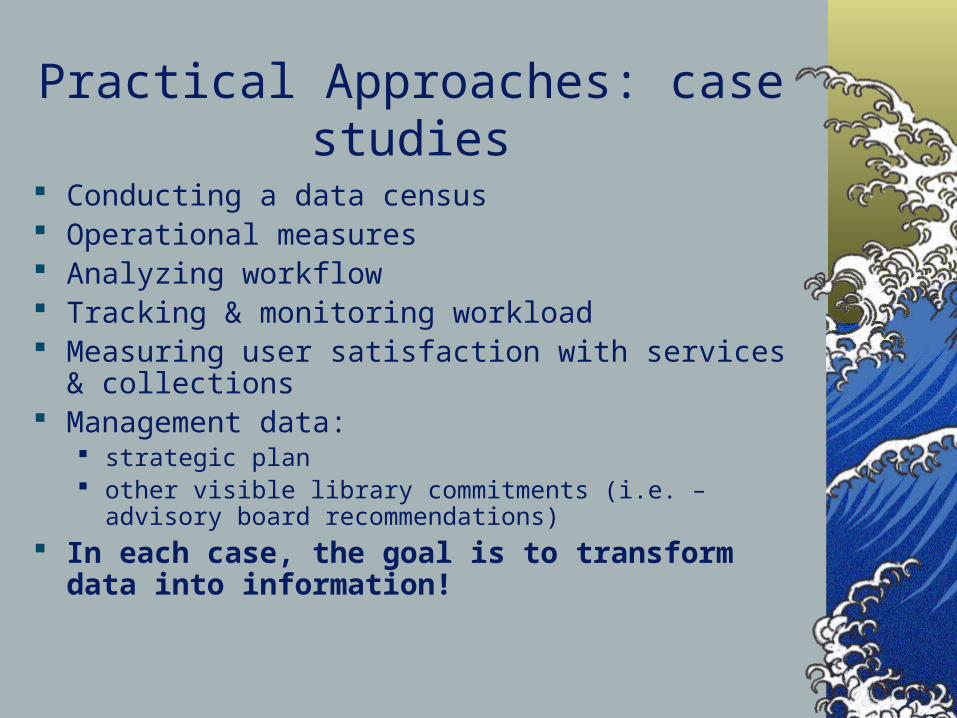
Practical Approaches: case studies
Conducting a data census Operational measures Analyzing workflow Tracking & monitoring workload Measuring user satisfaction with services & collections Management data:
strategic plan other visible library commitments (i.e. – advisory board
recommendations) In each case, the goal is to transform data into
information!

Library-wide Data Census
Conduct interviews of all library departments using needs assessment
Record all data kept, why, how, and for what purpose Have department heads/administrators review results
and provide missing information Review existing standards & emerging measures Determine what else needs to be collected, by whom,
how, & for what purpose
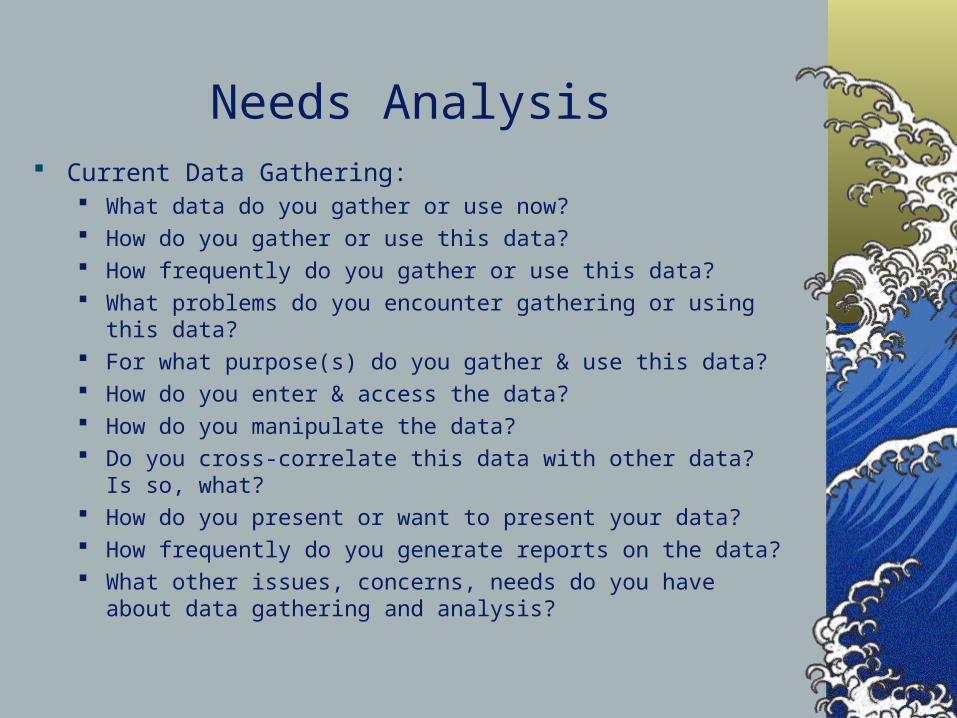
Needs Analysis Current Data Gathering:
What data do you gather or use now? How do you gather or use this data? How frequently do you gather or use this data? What problems do you encounter gathering or using this data? For what purpose(s) do you gather & use this data? How do you enter & access the data? How do you manipulate the data? Do you cross-correlate this data with other data? Is so, what? How do you present or want to present your data? How frequently do you generate reports on the data? What other issues, concerns, needs do you have about data gathering
and analysis?

Census Sample
.
Dept Data
type
Detail Ext.
Aud
Int.
Aud.
Automated?
Current
or
Proposed
How used, by whom?
Keep,
Sample
Stop
Access
Svs.
Circulate items by item type
Defini
tion
ACRL
Lib
admin
Yes
Unicorn
C Track
trends
Keep
Access
Svs.
ILL turnaround
How
Long
Adv
Bd
Unit
head
Yes
ILLiad
C Track
reduction
Sample
Access
Svs.
Total elec.
reserves
Defini
tion
Adv
Bd
Unit
head
No-
manual
C Track
workload
Keep
Access
Svs.
Gate count People
In libs
ACRL
No-manual
C Track
trends
Sample
Access
Svs.
Total
circulation
All
items
ACRL
Yes
Unicorn
C Track
trends
Keep
Access
Svs.
Total ILL All
items
ACRL
Yes
ILLiad
C Track
workload
Keep
Access
Svs.
Mforms
reshelved
Defini
tion
Unit
head
No
manual
C Track
reduction
Sample
Access
Svs.
ILL costs
revenues
Defini
tion
Adv
Bd
No
manual
P Monitor
budget
Keep

Putting Census Results to Use
Distribute & share widely Encourage review of results Eliminate duplicate & unnecessary measures Create or revise your Management Information System
to centralize data entry & facilitate discovery Automate manual data where possible Maintain manual efforts where needed Provides focus for your measurement activity
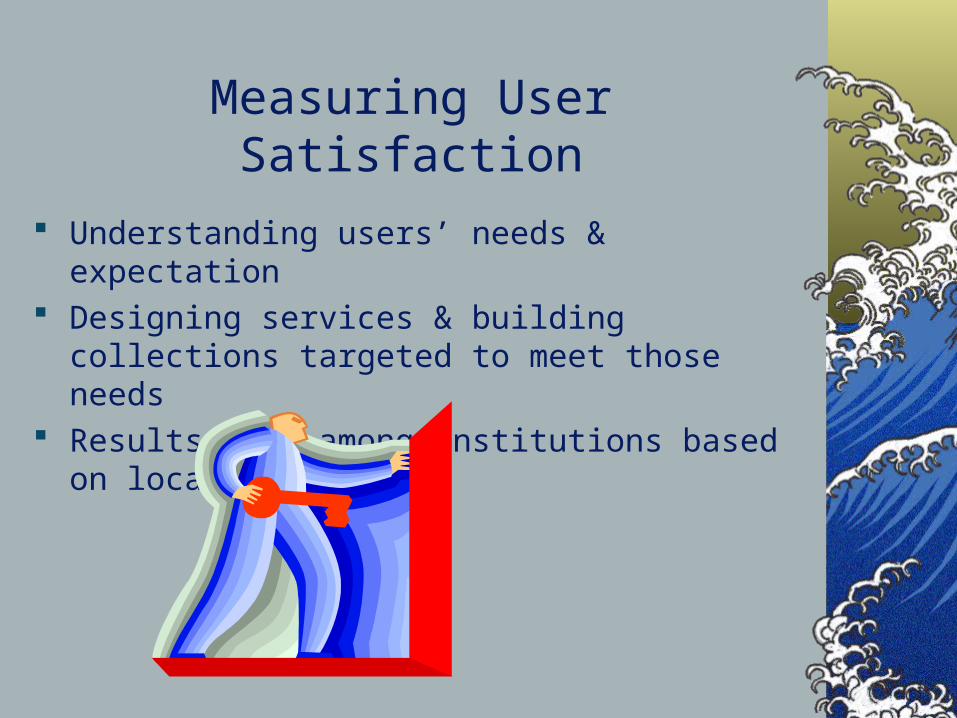
Measuring User Satisfaction
Understanding users’ needs & expectation Designing services & building collections targeted to
meet those needs Results vary among institutions based on local factors
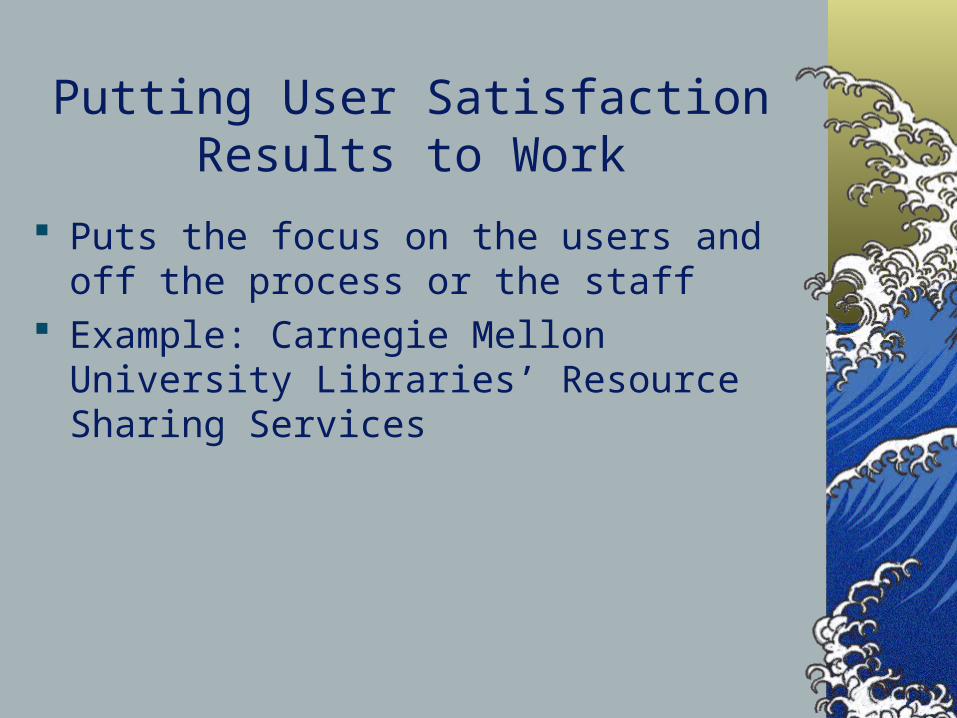
Putting User Satisfaction Results to Work
Puts the focus on the users and off the process or the staff
Example: Carnegie Mellon University Libraries’ Resource Sharing Services

Example: Resource Sharing
Focus groups with all user-groups Focus group with resource sharing staff Servqual study of random sample of service users Analyze feedback from users & staff Group feedback into meaningful categories Look for patterns & trends

Resource sharing example (cont.)
Compare users’ needs to existing service Reengineering service to meet users’ stated needs Requesting needed support Re-measuring after changes are made to test results
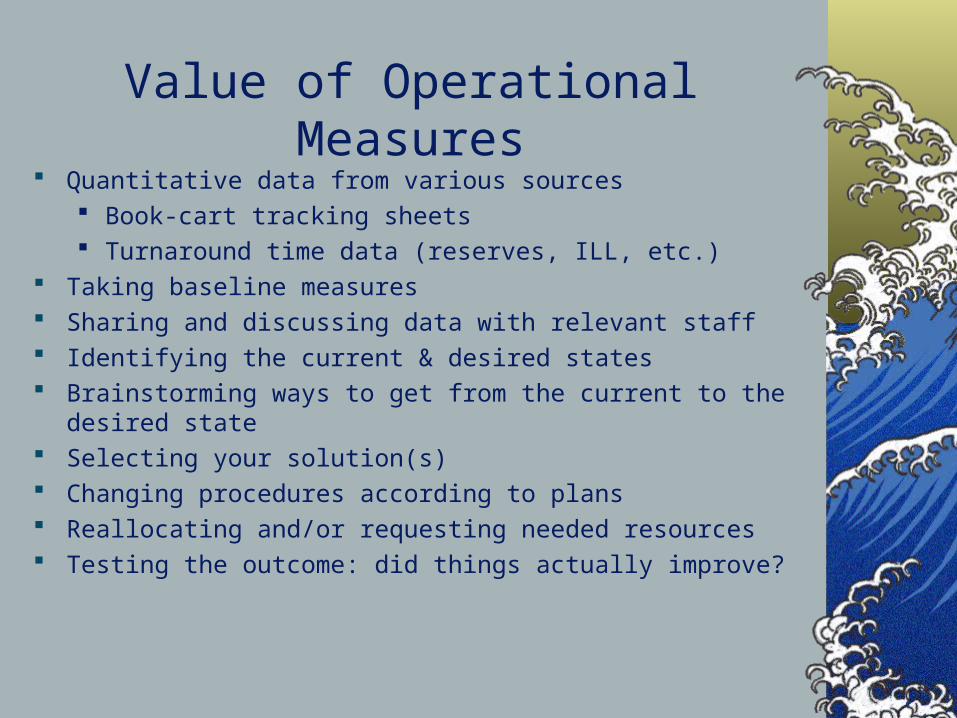
Value of Operational Measures Quantitative data from various sources
Book-cart tracking sheets Turnaround time data (reserves, ILL, etc.)
Taking baseline measures Sharing and discussing data with relevant staff Identifying the current & desired states Brainstorming ways to get from the current to the desired state Selecting your solution(s) Changing procedures according to plans Reallocating and/or requesting needed resources Testing the outcome: did things actually improve?
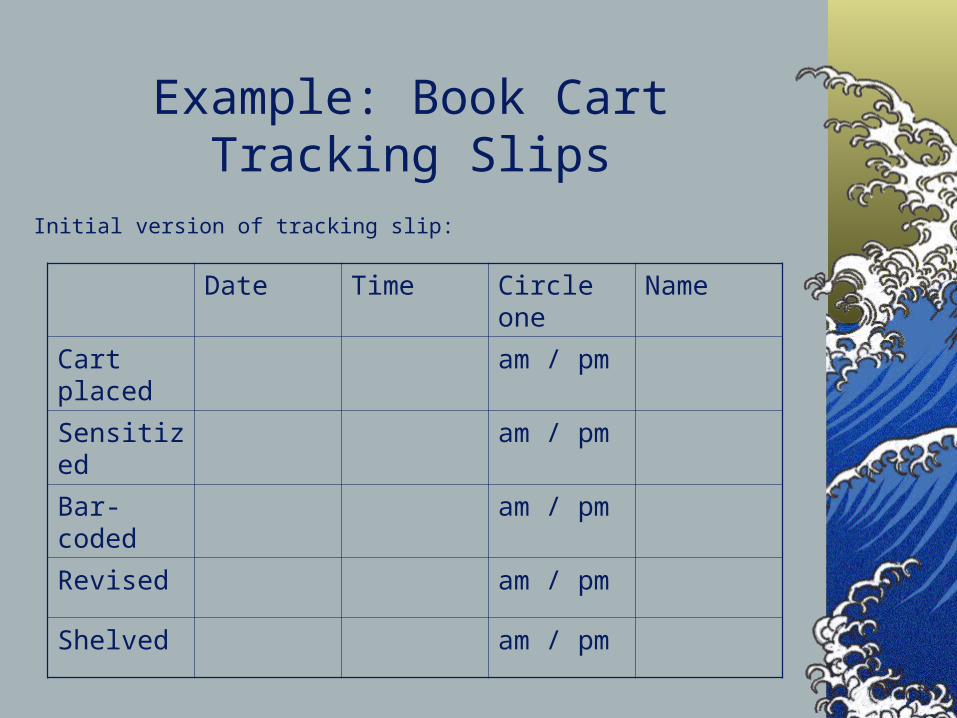
Example: Book Cart Tracking Slips
Initial version of tracking slip:
Date Time Circle one Name
Cart placed am / pm
Sensitized am / pm
Bar-coded am / pm
Revised am / pm
Shelved am / pm
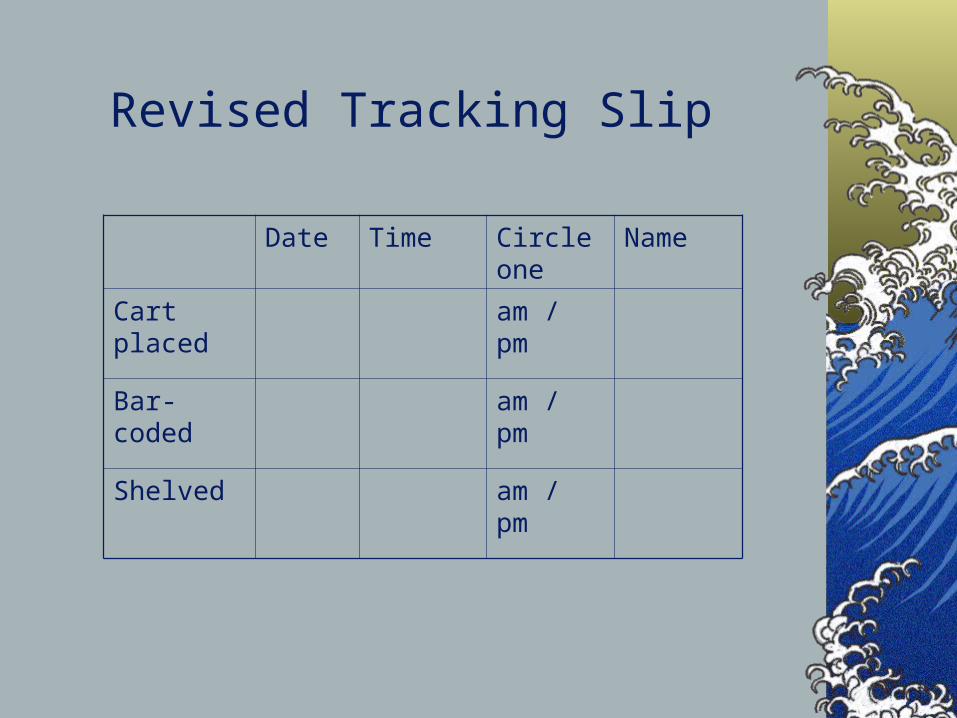
Revised Tracking Slip
Date Time Circle one
Name
Cart placed am / pm
Bar-coded am / pm
Shelved am / pm

Turnaround time studies
Resource sharing example Reserves example
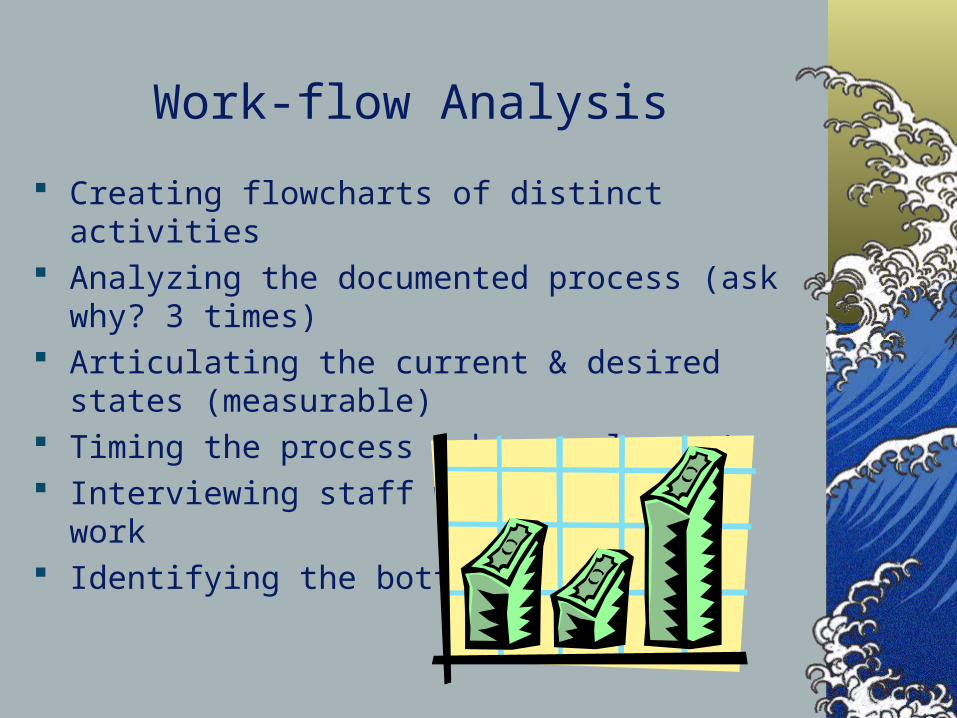
Work-flow Analysis
Creating flowcharts of distinct activities Analyzing the documented process (ask why? 3 times) Articulating the current & desired states (measurable) Timing the process (where relevant) Interviewing staff who perform the work Identifying the bottle-necks

Daily Tracer Procedure
Journal tracers are handled through thePeriodicals Office on the third floor. We
only handle tracers for Hunt Library books.
Use the "Place Hold" feature to place a holdon the book for the patron who requested thetrace. This will ensure that the book's location
in CAMEO will be accurate.
1. Record the search in theTracer stats Excel file.
2. You may recycle the tracer.
If Found,Send an "Item Found"
email to the patron
You may delegate these searches to student assistants.If the active tracer database is up to date, you could have
them search for all or a portion of the items listed.
4. Record that an item has been markedmissing in the Tracer stats Excel file.
5. Recycle the tracer.
After the third search, if the book has not been found:1. Use the "Edit Volume" feature to change the book's
current location to "MISSING." 2. Send an "Item Missing"email to the patron. 3. Update the tracer database.
Search for the book again, once a week for the next two weeks. **Make sure to record all searches
in the Tracer stats Excel file.
1. Add the tracer information to the active tracer database. 2. File the tracer in the tracer binder.
Use the "Edit Volume" feature to add a commentto the book's record. Use this format: "Item
being traced for "patron's email adress," pleasegive to (your name) when found."
If NOT Found,Send a "Tracer"
email to the patron.
1. Search for the book in its correct location first.**Check to see if it has been pushed behind the shelf or
mis-shelved in the area around its correct location.2. Search for the book in the other locations on the form.
1. Log into WorkFlows2. Use the "Item Search & Display" feature
to determine the location and last activity of thebook. 3. Record this information on the form.
Patron completes form at the Circulation Desk (after the overflow area and carts are checked)
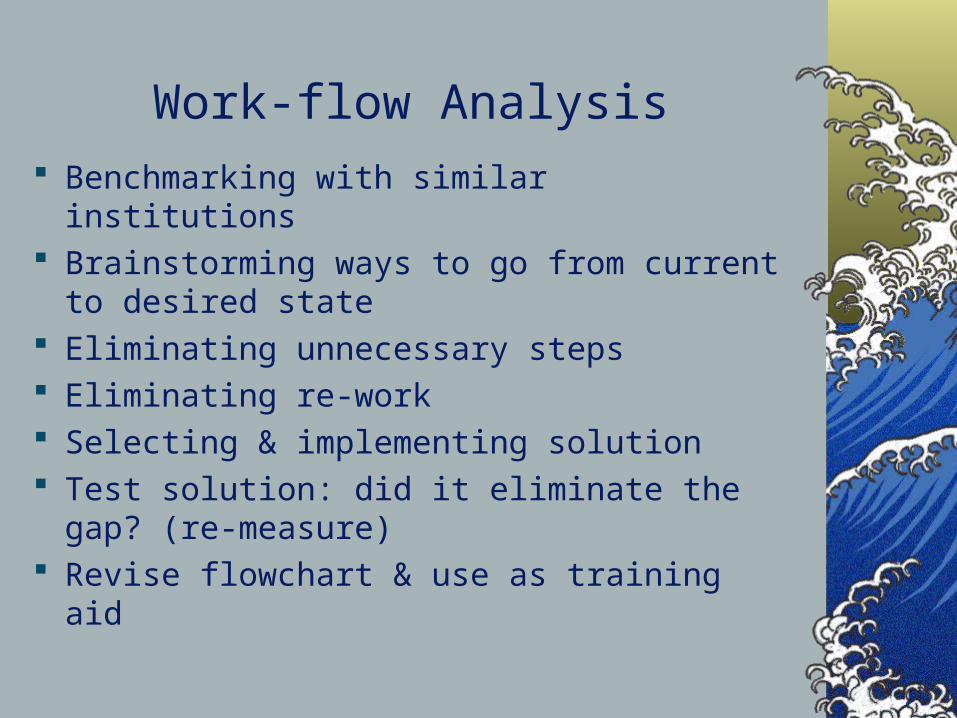
Work-flow Analysis
Benchmarking with similar institutions Brainstorming ways to go from current to
desired state Eliminating unnecessary steps Eliminating re-work Selecting & implementing solution Test solution: did it eliminate the gap? (re-
measure) Revise flowchart & use as training aid
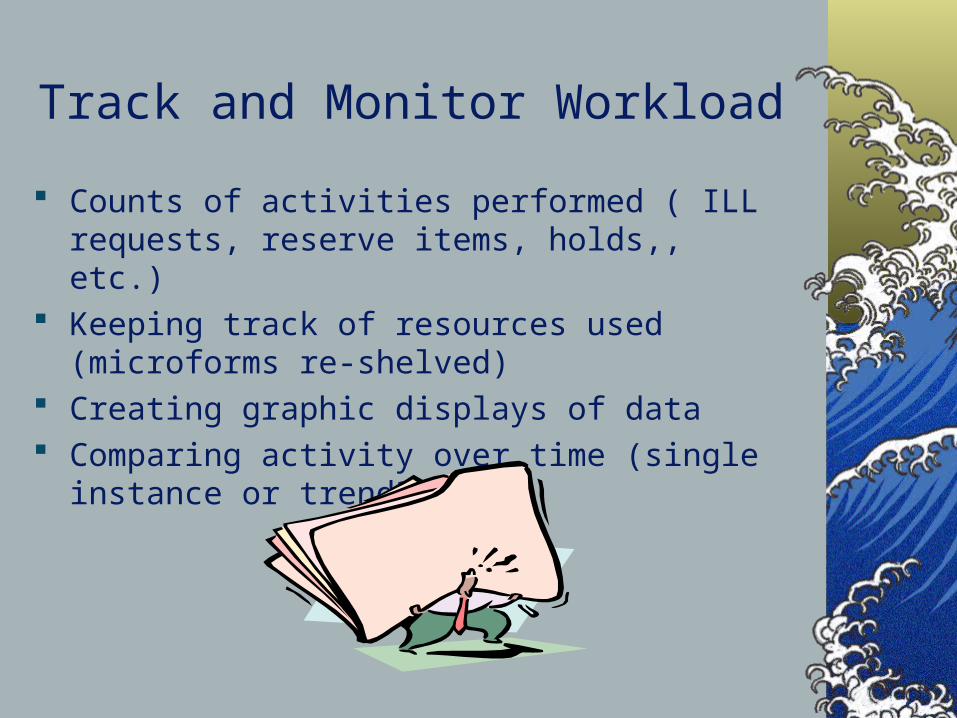
Track and Monitor Workload
Counts of activities performed ( ILL requests, reserve items, holds,, etc.)
Keeping track of resources used (microforms re-shelved)
Creating graphic displays of data Comparing activity over time (single instance or trend?)

Example: Resource Sharing
3 ILL offices; service level uneven due to workload distribution
Met to review workload figures Borrowing activity concentrated primarily in one site Other duties distributed evenly
Brainstormed ways to redistribute work more equitably to better meet users’ needs
Built team skills among staff performing the work Implemented workload leveling

Using Workload Analysis Results
Redistribute work among a group/team (workload leveling)
Use results of data collection & analysis to lobby for resources (human, financial, equipment, etc.)
Justify requests to reclassify existing staff positions, to request pay raises, etc
Management Data
Library’s strategic plan is tied to plan of parent organization Contains broad strategic goals Contains action plan to reach goals
Advisory or accrediting board commitments (or other oversight group) Includes recommendations for improvement Requires goals set to meet recommendations
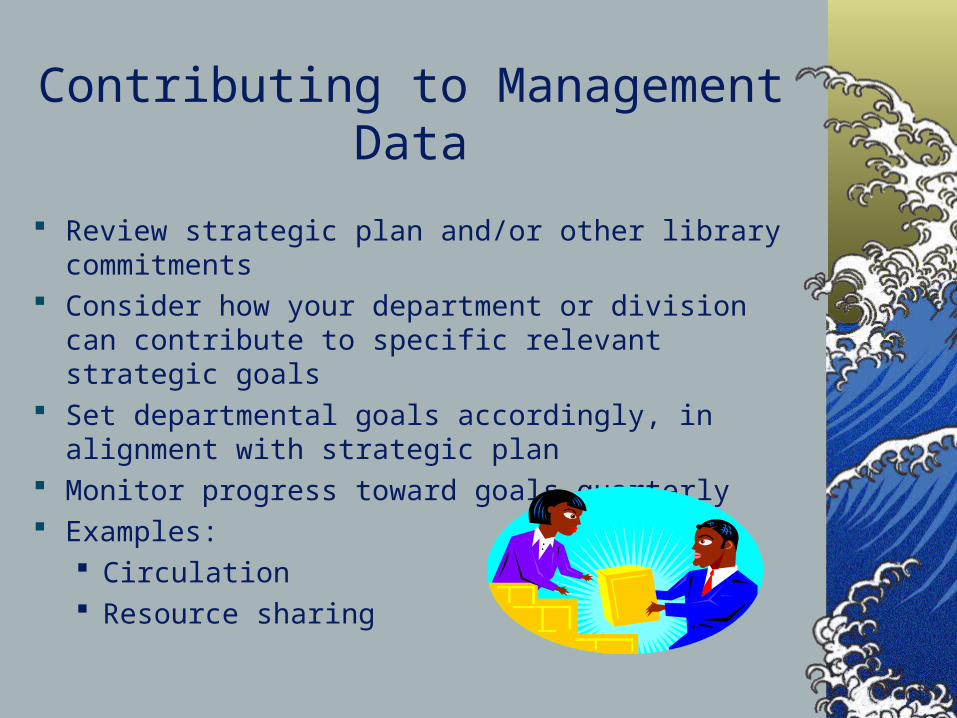
Contributing to Management Data
Review strategic plan and/or other library commitments Consider how your department or division can
contribute to specific relevant strategic goals Set departmental goals accordingly, in alignment with
strategic plan Monitor progress toward goals quarterly Examples:
Circulation Resource sharing
Example: Circulation Goals The relevant library goal from our Advisory Board
Report is: The Libraries will move more aggressively into the electronic reserves arena to meet student and faculty demands.
Departmental goals: Provide electronic access to appropriate Reserve readings,
such as journal articles, book chapters, lecture notes, sample tests, etc. At least 30% of all these readings will be available in electronic format by 2003.
% of Reserve readings that can be accessed electronically from total photocopies on Reserve library-wide.
Total number of Reserve readings in print, total readings scanned and available as a link through the library catalog.
Example: Circulation GoalsRelevant library goal (from Advisory Board Report): Make maximum use of available library automated
systems
Automate and send all notices, over-dues, fines, bills, holds available, and recalls electronically and without staff intervention via the library management system and electronic mail. * 95% of all notices are generated and sent electronically * Percentage increase in the number of notices sent electronically
Complete the assimilation of the video collection into the library system* 100% of videos holdings are catalogued in Unicorn (our LMS)* Percentage increase in the number of videos catalogued* All videos are circulated through the library management system* All videos are acquired through the library management system

Relevant Library Goal: Improve Convenience and Speed in the Interlibrary Loan System.
Example: Resource Sharing Goals
Implement ILLiad, an interlibrary loan management system that will significantly facilitate the work of the department. Improve ILL turnaround time by 20% by 2003 Improve internal turnaround time for borrowing requests (those steps
under our own control) by 50% by 2003.
Increase on-demand scanning and desktop delivery of materials. Acquire and implement Ariel at each ILL location. Percentage of total copies received that are delivered directly to the
desktop.
100% of ILL users will have direct electronic access to the status of their requests and to other ILL service performance information. Percentage increase in the number of requests on systems that provide
this type of information directly to users. 100% of requests will provide service users with this information
reliably.
Eliminate 100% of paper record-keeping.
Tie Measures to Performance Evaluation
Design evaluation forms to include goals and performance measures for each goal.
Goals must be tied to library’s strategic objectives.
Example: Employee Evaluation FormSection IV – Goals
Goals that should be maintained or improved to make the greatest contribution to the department’s goals, and developmental goals that the staff member has identified. Include goals that address performance at the “needs improvement” level. Complete the following sections as appropriate. Copy the template below to include additional goals.
Goal:
Statement:
Employee Action Plan with Targeted Completion Dates:
Outcome Measures (Ways to evaluate or measure the results):
1st review – Date ______ Initials _______ ________ Comments: 2nd review – Date ______ Initials _______ ________ Comments: 3rd review – Date ______ Initials _______ ________ Comments:
Uses for Performance Information1. to inform resource allocation
2. to evaluate library employees and library management
3. to determine the extent of the gap between the library’s goals and reality (as defined by the user)
4. to drive the reengineering of library processes, and
5. to benchmark against best practices
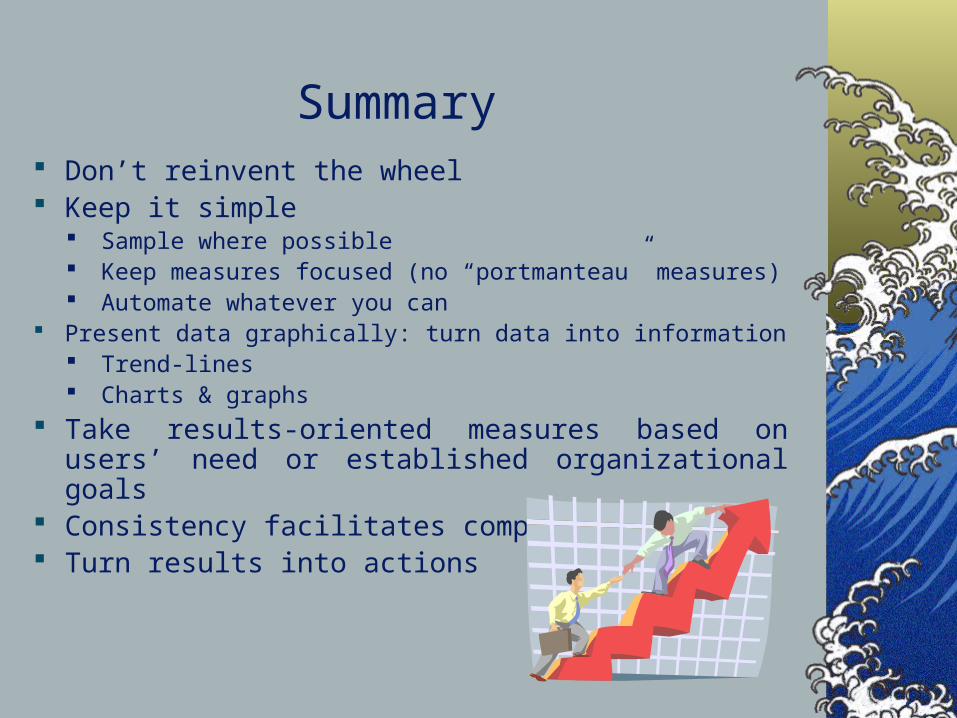
Summary Don’t reinvent the wheel Keep it simple
Sample where possible Keep measures focused (no “portmanteau” measures) Automate whatever you can
Present data graphically: turn data into information Trend-lines Charts & graphs
Take results-oriented measures based on users’ need or established organizational goals
Consistency facilitates comparison Turn results into actions
Conclusions
Performance measurement is multi-faceted Encompasses operational and management data Most effective when participation is full
Departmental and individual contributions matter Focus on users’ needs & expectations Good off-the-shelf software exists to help
Conclusions
Data collected for one purpose can be put to use in multiple ways. Various data elements can be combined to create new insights. Incremental change accumulates. Change based on small measures
adds up to noticeable results. Analyze existing data for potential to drive change. Grass-roots efforts can succeed. Push your own limits.
Learn the necessary skills. Learn from your successes & your failures.
Opportunities
Network with like-minded colleagues. Publish your results. Read broadly in this area of specialty. Northumbria Lite at IFLA, Thursday, August 22nd.
5th Northumbria International Conference on Performance Measurement in Libraries & Information Services, August, 2003 in Durham.
Questions?
Examples or ideas of your own? Questions?