mcguire iarpc presentation alaska land carbon ... amore, scott rupp, bruce wylie, xiaoping zhou,...
TRANSCRIPT
The Alaska Land Carbon Assessment: Baseline and Projected Future Carbon Storage and Greenhouse
Gas Fluxes in Ecosystems of Alaska
Patrick Endres, AK photographics
A. David McGuire, Hélène Genet, Yujie He, Sarah Stackpoole, Dave D’Amore, Scott Rupp, Bruce Wylie, Xiaoping Zhou, Zhiliang Zhu
and others on the Alaska Land Carbon Team

USGS Alaska Land Carbon Assessment
D’Amore D., Bennett A., Biles F., Bliss N., Breen A., Butman D., Clow D., Genet H., He Y., Johnson K., Kurkowski T., McGuire A.D., Pastick N., Rupp S., Stackpoole S., Striegl R., Wylie B., Zhang Y., Zhou X., Zhu Z., Zhuang Q.
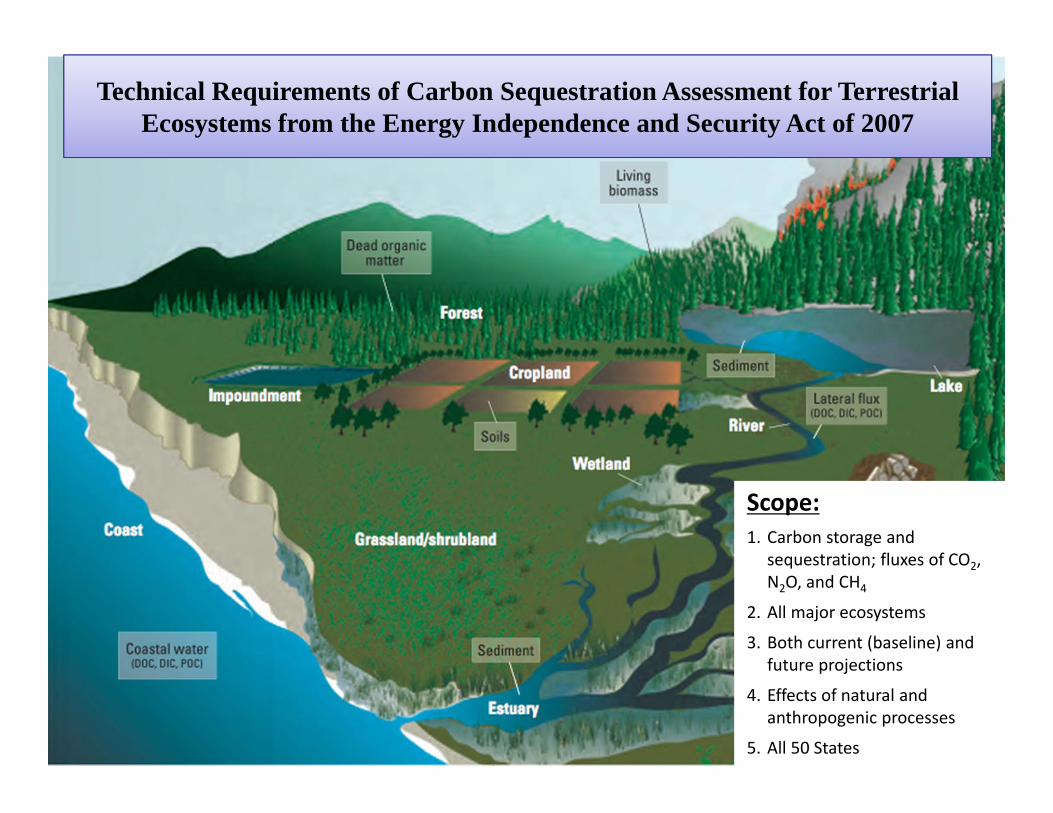
Technical Requirements of Carbon Sequestration Assessment for Terrestrial Ecosystems from the Energy Independence and Security Act of 2007
Scope:1. Carbon storage and
sequestration; fluxes of CO2, N2O, and CH4
2. All major ecosystems
3. Both current (baseline) and future projections
4. Effects of natural and anthropogenic processes
5. All 50 States

Alaska Land Carbon Assessment Methodology

Modeling Framework: Uplands and Wetlands
ALFRESCO
Environmental module
Ecological moduleOrganic Soil module
Disturbance module
OL thickness & Soil structure
Atm & Soil env.LAI
Fire severity
Litter
Fire occurrence
Climate, topography
Climate,Atm. CO2
DOS‐TEM
logging rate
MDM‐TEM
NPP , LAI

What is the Integrated Ecosystem Model (IEM) for Alaska and Northwest Canada?
Habitat & Species
Vulnerability
DisturbancePermafrost
Hydrology
Vegetation
Climate
Conservation Action

What is the IEM?
ALFRESCO GIPLDOS-TEM
Air Temperature, Precipitation, Initial VegetationSnow Water Equivalent

What is the IEM?
ALFRESCO GIPLDOS-TEM
Slope, Aspect Elevation, Historical Fire Mineral Soil Texture
Air Temperature, Precipitation, Initial VegetationSnow Water Equivalent

What is the IEM?
ALFRESCO GIPLDOS-TEM
Burned area
Fire Severity
Vegetation Type Soil Thermal Profile
Vegetation Carbon
Soil Moisture Profile
Moss Thickness
Vegetation Canopy
Slope, Aspect Elevation, Historical Fire Mineral Soil Texture
Air Temperature, Precipitation, Initial VegetationSnow Water Equivalent

What is the IEM? Geographic Domain

Climate Drivers
Mean Annual Temperature (MAT) and Annual Sum of Precipitation (ASP) from 1950 to 2100 summarized for the simulation extent. The black line represents the CRU data for the historical period and the colored lines represent the CCCMA (solid) and ECHAM5 (dotted) projections for the 3 emission scenarios.

Reporting Regions in AlaskaThe total area of Alaska considered in this assessment was 1,474,844 km2, which is
composed of 84 percent “uplands”, 12 percent wetlands, and 4 percent inland waters.
Landscape Conservation Cooperatives Main Hydrologic Units

Environmental Drivers

Evaluation of ALFRESCO Simulations of Fire Dynamics
Cumulative area burned (km2) through time (left) and vs. individual fire size (right). Record of observation 1950-2010 indicated by the red line. Individual model simulations (n=200) indicated by gray lines. Projections through 2099 are for the CCCMA A1B climate scenario.

Disturbance regimes : Fire
Simulated fire scars for the historical period 1950-2009. Individual fire scar colors indicate age of burn from oldest (red) to youngest (green).
Cumulated area burned for the historical period (black line) are estimated from the Alaskan Large Fire Database. Projections from 2009 to 2100 are simulated by ALFRESCO for the 6 climate scenarios.

Vegetation Change: Northern Northwest Boreal LCC
Projected land cover type change (in 1000 square km) across the NW Boreal North LCC subregion under the ECHAM5 climate model for three emission scenarios.

Evaluation of Permafrost Distribution Estimates by DOS‐TEMPresence‐absence of near‐surface (within 1 m) permafrost for Alaska: a) STATSGO; b) Pastick et al., (2015); c) Geophysical
Institute Permafrost Lab (GIPL) 2.0, and; d) DOS‐TEM.
a b
c d

Evaluation of Soil Carbon Estimates by DOS‐TEMSoil organic carbon characterization by Landscape Conservation
Cooperative (LCC) and land cover class.

Evaluation of DOS‐TEM Performance
TEM soil C stocks compared with soil C stocks based on 315 samples collected in Alaska (Johnson et al. 2011). Both simulated and observed soil C stock estimates are for the organic and 0‐1m mineral horizons.
Evaluation of TEM for vegetation biomass using data from 190 permanent study plots of the Cooperative Alaska Forest Inventory (CAFI) for boreal forest communities and LTER data for the arctic tundra communities.

Historical change in Net EcosystemC balance [1950‐2009] in Terrestrial Boreal Alaska
• ‐7.9 TgC/yr were lost on average between 1950 and 2009 in Interior Alaska.
• The loss over the 60 year period is primarily driven by unprecedented fire emissions during the decade of 2000s (record fire years in 2004 and 2005).Δ VEGC
‐2.6
Δ SOILC+CWD‐5.3
NPP96.5
RH73.1
Litter88.5
Fire30.7
Unit = TgC/yr
CH40.6
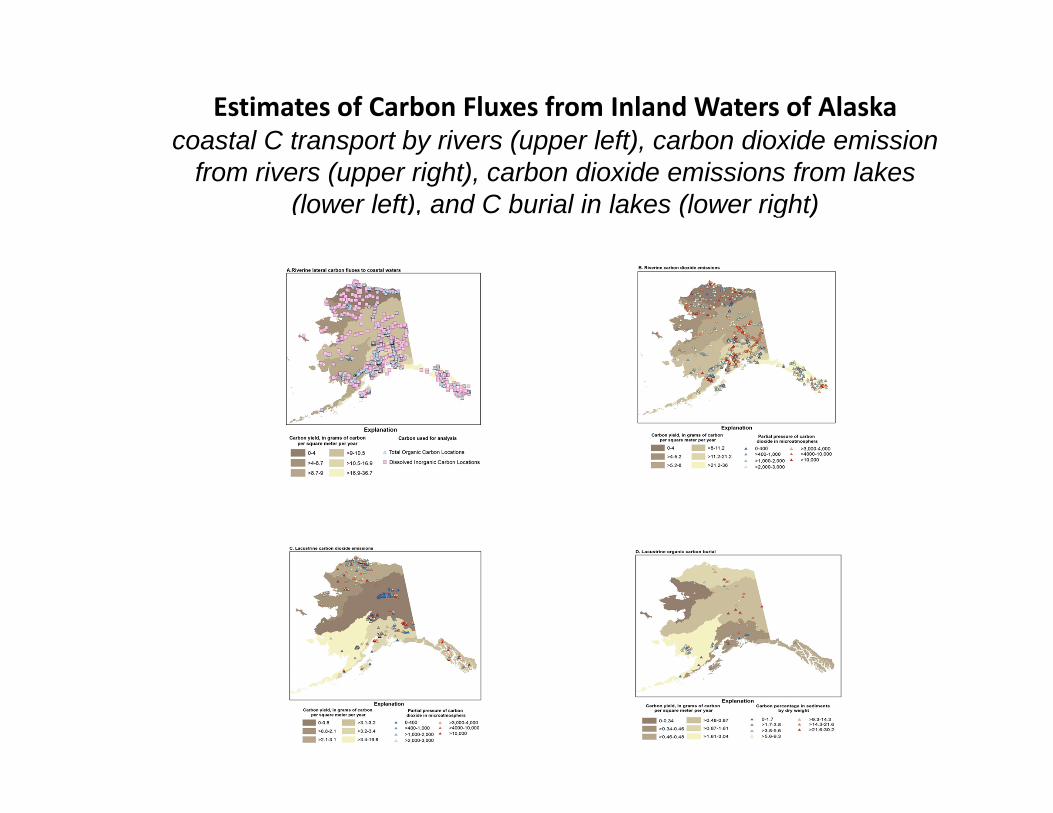
Estimates of Carbon Fluxes from Inland Waters of Alaskacoastal C transport by rivers (upper left), carbon dioxide emission
from rivers (upper right), carbon dioxide emissions from lakes (lower left), and C burial in lakes (lower right)
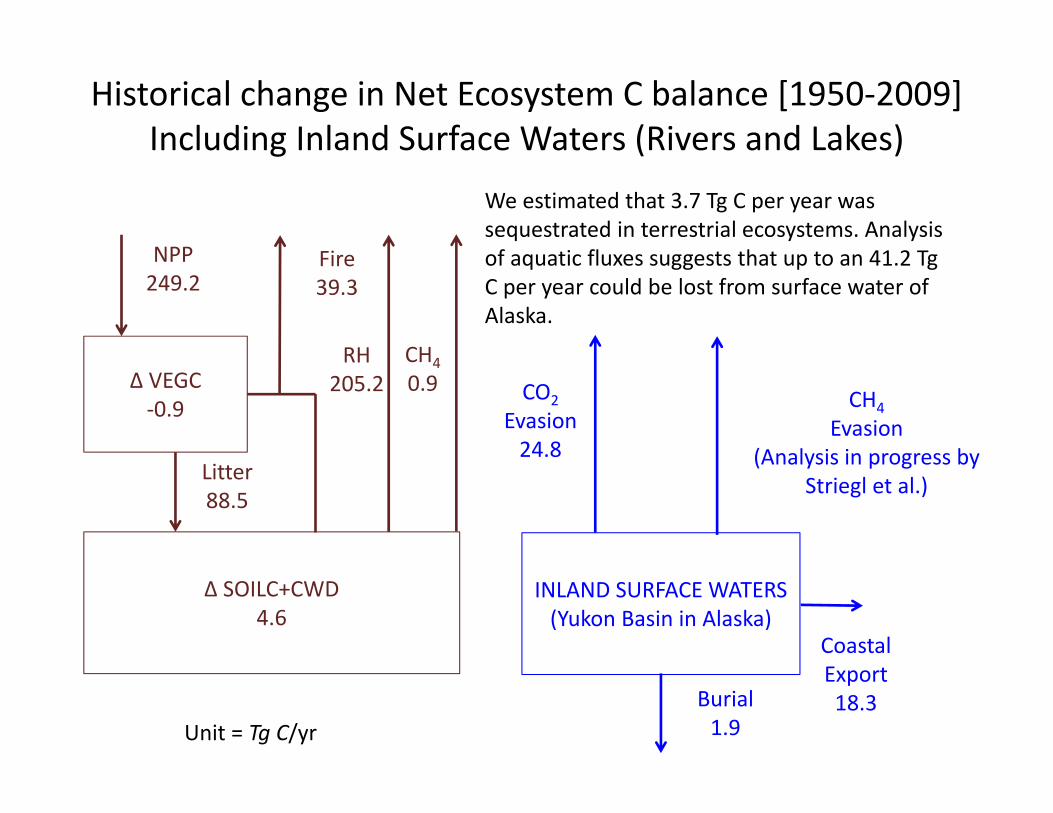
Historical change in Net Ecosystem C balance [1950‐2009]Including Inland Surface Waters (Rivers and Lakes)
Δ VEGC‐0.9
Δ SOILC+CWD4.6
NPP249.2
RH205.2
Litter88.5
Fire39.3
Unit = Tg C/yr
CH40.9
INLAND SURFACE WATERS(Yukon Basin in Alaska)
Burial1.9
CoastalExport18.3
CH4Evasion
(Analysis in progress by Striegl et al.)
CO2Evasion24.8
We estimated that 3.7 Tg C per year was sequestrated in terrestrial ecosystems. Analysis of aquatic fluxes suggests that up to an 41.2 TgC per year could be lost from surface water of Alaska.

Projections of Alaska Future Carbon Storage [2010‐2100]
Climate Scenario
Delta VEG C
Delta SOIL C NPP RH Fire C Bio CH4 NECB GWP
CCCMA B1 6.2 20.5 278.2 ‐219.9 ‐30.4 ‐1.1 26.8 ‐62.4
ECHAM5 B1 9.8 8.5 282.3 ‐222.4 ‐40.3 ‐1.3 18.2 ‐24.5
CCCMA A1B 10.2 21.9 306.6 ‐168.7 ‐103.4 ‐1.9 32.2 ‐51.0
ECHAM5 A1B 12.5 11.7 323.3 ‐190.5 ‐106.5 ‐1.6 24.3 ‐31.2
CCCMA A2 6.8 25.6 292.6 ‐232.0 ‐25.1 ‐1.1 34.4 ‐91.6
ECHAM5 A2 12.6 8.9 324.1 ‐176.9 ‐122.7 ‐2.7 21.4 11.6
Unit = TgC/yr
Projected Carbon Balance (Tg C/ yr) and Greenhouse Gas Warming Potential (GWP, TgCO2 eq/yr) of Terrestrial Ecosystems in the Northern Northwestern Boreal LCC

Take home messages on the historical assessment of C dynamics in Alaska
• Upland and wetland Ecosystems of Alaska are estimated to have gained 3.7 Tg C per year from 1950 to 2009, which is ~2% of NPP, but sequestration is spatially variable with the northern Northwest Boreal region losing carbon.
• We estimate that the combined carbon loss through various pathways of the inland aquatic ecosystems of Alaska was 41.2 Tg C per year, or about 17 percent of upland and wetland NPP.
• We estimate that the greenhouse gas forcing potential of upland and wetland ecosystems of Alaska was approximately neutral during the historical period, but that the state as a whole could be a source for greenhouse gas forcing to the climate system from CH4 emissions from lake ecosystems.
• A major uncertainty of the historical assessment is related to the fact that aquatic inland ecosystems were not able to be integrated with upland and wetland ecosystems.

Take home messages on the projected C dynamics for Alaska
• During the projected period (2010‐2099), carbon sequestration of upland and wetland ecosystems of Alaska would increase substantially (18.2 to 34.4 Tg C per year) primarily because of an increase in NPP of 8 to 19 percent associated with responses to rising atmospheric CO2, increased nitrogen cycling, and longer growing seasons. Although C emissions to the atmosphere from wildfire increase substantially for all of the projected climates, the increases in NPP more than compensate for those losses.
• Our analysis indicates that upland and wetland ecosystems would be sinks for greenhouse gases for all scenarios during the projected period. However, as in the case of the analysis of the historical period, there is uncertainty as whether the state would be a net source for GHG if emissions of CH4 from lakes in Alaska were considered.

Identifying Indicators of State Change and Forecasting Future Vulnerability in the Alaskan Boreal Forest
● Technical Objective 2: Develop models that can forecast landscape change in response to projected changes in climate, fire regime, and fire management.
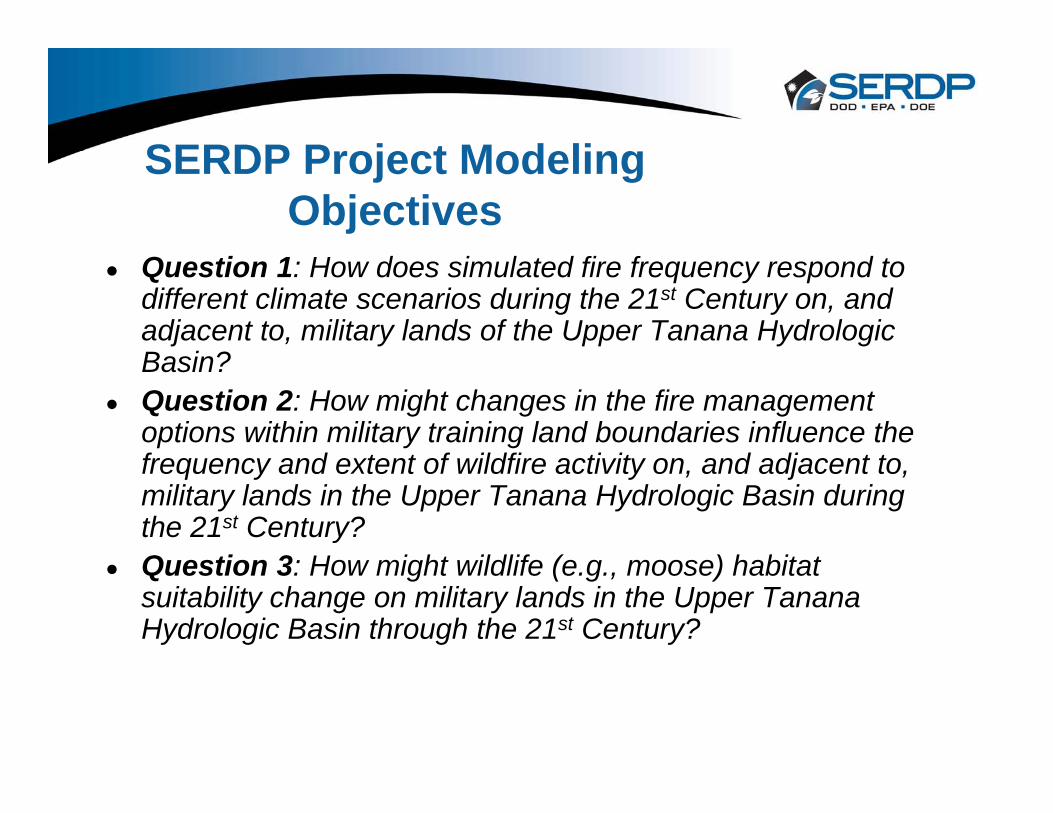
SERDP Project Modeling Objectives
● Question 1: How does simulated fire frequency respond to different climate scenarios during the 21st Century on, and adjacent to, military lands of the Upper Tanana Hydrologic Basin?
● Question 2: How might changes in the fire management options within military training land boundaries influence the frequency and extent of wildfire activity on, and adjacent to, military lands in the Upper Tanana Hydrologic Basin during the 21st Century?
● Question 3: How might wildlife (e.g., moose) habitat suitability change on military lands in the Upper Tanana Hydrologic Basin through the 21st Century?

Critical Full Modified Limited
Mean 0.24 0.69 1.43 1.64
Standard deviation 1.14 1.75 4.28 2.88
Median 0 0.03 0.03 0.41
Mean Annual Area Burned (%) from 1988-2012
Calef et al. 2015 Earth Interactions
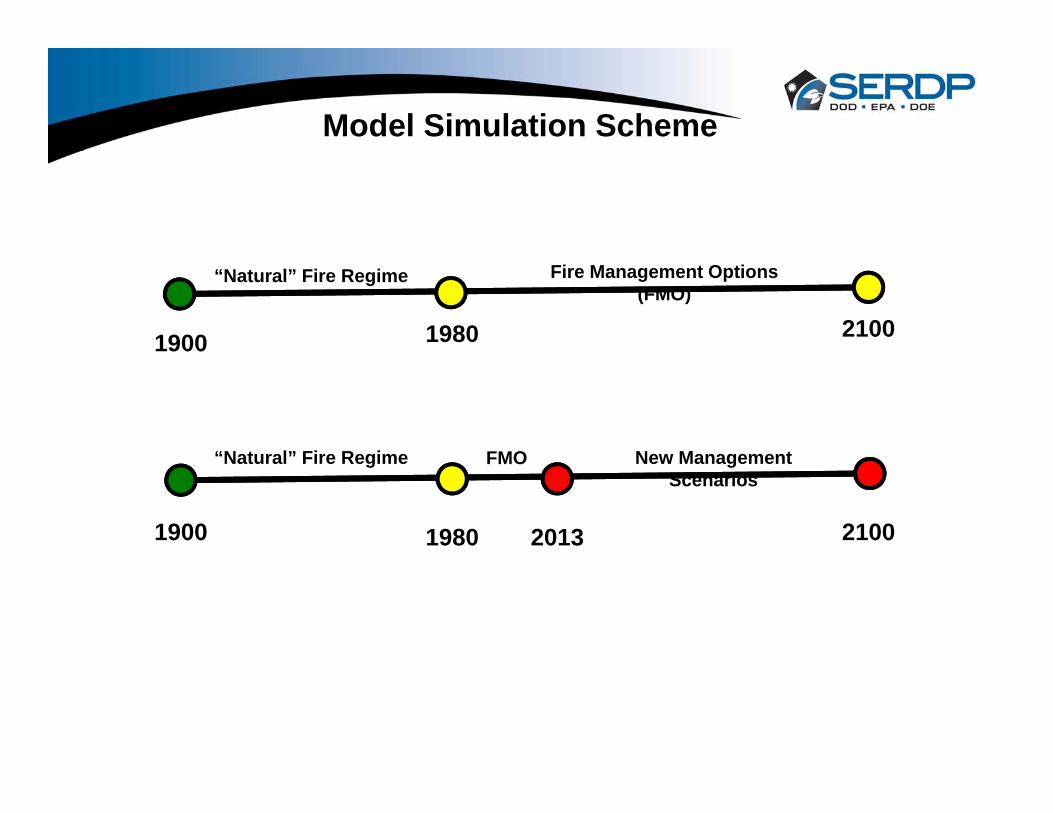
1900 1980 2100
1900 1980 21002013
Model Simulation Scheme
“Natural” Fire Regime
“Natural” Fire Regime
Fire Management Options (FMO)
FMO New Management Scenarios

IEM Acknowledgements
DoI USGS/UAF Alaska Climate Science Center and Alaska Landscape Conservation Cooperatives
Postdoctoral ResearchersHelene Genet Mark LaraColin Tucker Reginald MuskettJennifer Roach Yujin Zhang
Graduate StudentsLouise Farquharson Elchin JavarovVijay Patil
Data Production & ManagementTom Kurkowski Michael Lindgren
Software EngineersAlec Bennett Tobey CarmanRuth Rutter
Hardware Systems SupportBob Torgenson
CommunicationsKristin Timm
CollaboratorsNorman Bliss Bob Bolton Tom Douglas Paul DuffyBrad Griffith Guido GrosseSteph McAfee Dana NossovMark Waldrop
LCC Science CoordinatorsPhilip Martin Joel ReynoldsAmanda Robertson