mapping carbon emissions & removals for the land use, land
TRANSCRIPT

1
Mapping Carbon Emissions & Removals for the Land Use, Land Use Change & Forestry Sector Report based on the 1990-2014 Inventory
CEH Project Code: NEC 04531
Gwen Buys, Amanda Thomson, Janet Moxley, Heath Malcolm
Centre for Ecology & Hydrology, Bush Estate, Penicuik, Midlothian, EH26 0QB. [email protected]

2
1 Land Use, Land Use Change and Forestry in the National Inventory
The Department of Energy and Climate Change (DECC) takes the lead in the UK in preparing the annual Inventory of Greenhouse Gas Emissions for the United Nations Framework Convention on Climate Change. DECC contract Ricardo Energy & Environment (REE) to compile the overall greenhouse gas emissions inventory and contract the Centre for Ecology and Hydrology (CEH) to prepare the data relating to Land Use, Land Use Change and Forestry (LULUCF) in the UK.
This report is prepared to describe the method used to spatially disaggregate the emissions and removals in the LULUCF sector to enable the compiling of LULUCF estimates for Local Authorities as part of DECC’s assistance to Local Authorities in tracking progress on decarbonisation.
The LULUCF data reported to the annual inventory is prepared in accordance with the reporting requirements of the United Nations Framework Convention on Climate Change (UNFCCC). However in addition the UK is required to provide reports to both the EU and the UNFCCC on progress towards its Kyoto Protocol (KP) target following KP reporting requirements. These are substantially different in coverage and approach. The data provided in this report is taken from the UNFCCC reporting data set and is consistent with current UK carbon budgets approaches.
For Kyoto Protocol reporting Article 3.3 of the Kyoto Protocol requires Parties in meeting their emissions reduction commitments to account for Afforestation, Reforestation and Deforestation (ARD) since 1990. Accounting for ARD under Article 3.3 requires i) a definition of forest, ii) knowledge of forest type and planting/deforestation date, iii) geographical location, and iv) a method to distinguish deforestation from areas harvested and replanted. Article 3.4 of the Kyoto Protocol allows Parties flexibility to choose Forest Management, Cropland Management, Grazing Land Management, Wetland Drainage and Rewetting and Re-vegetation towards meeting commitments. For the first commitment period of the Kyoto Protocol from 2008 to 2012, the UK only elected Forest Management as an activity under Article 3.4. For the second commitment period from 2013 to 2020 Forest Management reporting is mandatory and the UK has elected to also include Cropland Management and Grazing Land Management, and is considering whether to elect to furthermore include Wetland Drainage and Rewetting.
The Centre for Ecology and Hydrology annually prepares LULUCF estimates following both UNFCCC and KP approaches for inclusion in the UK GHG Inventory. These estimates are made using dynamic models of changes in stored carbon driven by land use change data. For forestry, the model deals with plant carbon, dead organic matter, soil and harvested wood products and is driven by the area of land newly afforested each year, management practices and harvesting. Changes in soil carbon are driven by estimated time series of land use transitions between semi-natural grassland, improved pasture, cropland, forest land and settlement land uses. These models, and those for other LULUCF activities, are run for each of the four devolved administrative regions of the UK. Until the 1990-2004 inventory (submitted in 2006) no data were reported in map format at a scale below the devolved administrations (England, Scotland, Wales and Northern Ireland); here we report results from methods to provide estimates of LULUCF emissions and removals at the scale of local authority within the UK for the 2014 inventory year.
The LULUCF Sector differs from other sectors in the Greenhouse Gas Inventory in that it contains both sources and sinks of greenhouse gases. The sources, or emissions to the atmosphere, are given as positive values; the sinks, or removals from the atmosphere, are given as negative values.

3
1.1 Categories
The IPCC Good Practice Guidance (GPG) for Land Use, Land Use Change and Forestry (IPCC 2006) describes a uniform structure for reporting emissions and removals of greenhouse gases. This format for reporting can be seen as “land based”; all land in the country must be identified as having remained in one of six classes since a previous survey, or as having changed to a different (identified) class in that period. The six land classes are A: Forest Land, B: Cropland, C: Grassland, D: Wetlands, E: Settlements and F: Other land. There is a seventh category for harvested wood products: Category G.
The GPG allows modification of the basic set of six land classes to match national databases. In current UK reporting, the Wetlands category only includes peat workings and inland waters. Emissions from peat extraction sites have been allocated to their local authorities in the UK. Bogs, marshes and fens are assumed to be used for grazing and are included in the Grassland category. Naturally occurring emissions and removals from pristine areas of bog, marsh and fen are not included in LULUCF. Emissions from drained organic soils under Cropland and improved Grassland are reported in those respective categories. Emissions from drained organic soils under semi-natural Grassland are not currently captured in the LULUCF inventory because mapping of these areas is not available, but will be addressed when the results of the research project to develop this mapping are available. The Other land category includes lakes, rivers, reservoirs and rocky coastal land etc. and no emissions or removals are reported. In addition, it is assumed that there are very few, if any, transitions of land to a type that is classified as ‘Other’.
The UK land use change matrix can be simplified to that shown in Figure 1, including only Forest Land (A), Cropland (B), Grassland (C) and Settlements (E) (shown clockwise from top left). For each land use and land use transition, the change in stocks of carbon in living biomass (above and below ground), dead biomass and soil organic matter should be reported. In Figure 1, each arrow represents the possible change for an area of land between two time points showing the corresponding category designation; ‘1’ refers to land that has not changed use (e.g. 4A1 is for Forest Land remaining Forest Land) , ‘2’ refers to land that has undergone change (e.g. 4A2.1 is for Cropland converted to Forest Land). The very small areas of conversion between Wetland and Grassland as a result of peat extraction activity and site restoration are not shown on this diagram.

4
Figure 1: UK Sector 4 land use transitions showing categories for carbon stock change. See text for details.
Different activities are associated with each land use or land use change. For example, ‘afforestation’ refers to all land use change to Forest Land, ‘drainage’ activity can relate to Forest Land, Cropland and Grassland and ‘peat extraction’ affects Wetlands remaining Wetlands. However, transitions to or from Wetlands are very small and therefore this category is not shown in Figure 1. The change in carbon stocks of living biomass, dead biomass and soil organic matter must be reported for each activity together with other relevant non-carbon changes.
Further subdivision of the classes by ecosystem, administrative region or time of occurrence of change is also encouraged in the IPCC Good Practice Guidance. For the UK, the data is currently subdivided into England, Scotland, Wales and Northern Ireland where possible. Subdivision into smaller units, such as 20kmx20km regions, is appropriate for modelling purposes and the development of estimates at local authority scale as described in this report.
1.2 Activities
The activities relevant to LULUCF are listed in Table 1. The main category designations are listed with the activity description and the UK total emissions/removals (Gg C) for 2014 as reported in the 1990-2014 Inventory. The activities are sorted in order of magnitude and divided into five groups; afforestation, emissions from soils due to land use change, emissions from soils due to drainage, minor emissions and categories assumed to have zero emissions/removals for the UK. Full details are given in the National Inventory Report (Brown et al, 2016).
Table 1: The UK carbon emissions and removals in Sector 4 (Land Use, Land Use change and Forestry) for 2014 sorted in order of magnitude.
4A1 4B1
4C1 4E1
4B2.1
4B
2.2
4A2.1
4C
2.2
4C2.4
4E2
.1 4A
2.4
4E2.3
Forest Land Cropland
Settlement Grassland

5
Category Activity 2014 UK total
GgC emission (+) or removal (-)
Group
4A Land converted to Forest land and land remaining Forest Land (not including emissions from wildfires)
-4753.39
Forest Land
4B Land converted to Cropland and land remaining Cropland (change in soil carbon not including losses from drainage of organic soils)
2875.35
Emissions from soils due to land use change
4C Land converted to and Grassland and land remaining Grassland (change in soil carbon not including losses from drainage of organic soils)
-2664.62
Emissions from soils due to land use change
4E Land converted to Settlement and land remaining Settlement (change in soil carbon)
1609.28
Emissions from soils due to land use change
4B1 Cropland remaining Cropland (drainage of organic soils)
464.15
Emissions from soils due to drainage
4G* Harvested Wood Products -328.50 NA
4C2 Forest Land converted to Grassland (deforestation to grass – not including soil changes)
142.66
Minor emissions
4B1 Cropland remaining Cropland (cropland soil management practices)
-139.57
Minor emissions
4D1 Wetlands remaining Wetlands (peat extraction)
103.47
Minor emissions
4C2 Non-Forest land converted to Grassland (change in non-forest living biomass)
-62.91
Minor emissions
4C1 Grassland remaining Grassland (drainage of organic soils)
48.22
Emissions from soils due to drainage
4B2 Non-Forest land converted to Cropland (change in non-forest living biomass)
36.03
Minor emissions
4A1 Forest Wildfires 26.58
Minor emissions
4E2 Non-Forest land converted to Settlements (change in non-forest living biomass)
-14.52
Minor emissions
4E2 Forest Land converted to Settlement (deforestation to settlement – not including soil changes)
13.24
Minor emissions
4B1 Cropland remaining Cropland (cropland biomass management practices)
-10.52
Minor emissions
4C1 Grassland remaining Grassland (grassland biomass management practices)
6.09
Minor emissions
4B2 Forest Land converted to Cropland (deforestation to crop – not including soil changes)
0.67
Minor emissions
* Sector 4G (Harvested Wood Products) is not included in the LA estimates because of insufficient data for distributing the emissions

6
Each of the three groups of activities is described below. Emissions and removals from the LULUCF Sector are predominantly of CO2. Emissions of other greenhouse gases are produced by biomass burning during wildfires or the conversion of Forest Land to Cropland, Grassland or Settlements (CH4, N2O, NOx and CO), or by any nitrogen fertilisation of new forests. Estimates of N2O and CH4 emissions and removals from other land use change activities are included in the 2014 inventory (1.3 Gg CH4 or 8.6 Gg Ce for methane and 2.4 Gg N2O or 197.0 Gg Ce for nitrous oxide across the UK). Emissions of these non-CO2 gases from agricultural land (e.g. due to fertilization) are reported in the Agriculture sector of the Greenhouse Gas Inventory. Only changes in carbon resulting from emissions and removals of CO2 are included in this report.
2 Forest Land
For the National Inventory, the carbon uptake by forests planted in the UK is calculated by a carbon accounting model, CARBINE, as gains and losses in pools of carbon in standing trees, litter and soil in conifer and broadleaf forests and in harvested wood products. Forests accumulate carbon (by removing CO2 from the atmosphere) in their biomass and soils as they grow, but timber harvesting and planting activities disturb this accumulation and result in loss of carbon via emissions of carbon dioxide, and other carbon-containing substances to the atmosphere. The net carbon stock change at any one time depends on the balance between these different activities. Forestry management cycles operate over long time scales (40 years+) so the rate of carbon dioxide removal now is driven by the rate of forest planting in previous decades. Two types of input data are required for the model; a) areas of new forest planted in each year in the past, and b) the stemwood growth rate and management/harvesting pattern.
The national estimates use the combined area of new private and state planting from 1920 to 2014 and estimated planting areas for pre-1920 for England, Scotland, Wales and Northern Ireland sub-divided into conifers and broadleaves. For mapping at LA scale, the results from the CARBINE model for England, Scotland, Wales and Northern Ireland were disaggregated to 20km × 20km grid squares across the UK using estimates of planting data at this scale. The disaggregated data was then combined to provide estimates per local authority (LA). This is achieved by taking the grid square data and assigning appropriate values to every 1km square in the UK. These smaller units can then be combined according to the LA boundaries (see Figure 2).

7
Figure 2: Model output is generated for 852 squares across the UK. Data are combined to provide estimates for each local authority (data for illustration only).
Figure 3 shows the distribution of carbon removals due to afforestation across the UK expressed as tonnes of Carbon per square kilometre (tC per km2). Maps of total carbon emissions/removals per LA can be misleading due to the wide range of areas across authorities – maps tend to be dominated by the Highland region of Scotland.

8
Figure 3: Distribution of carbon removals from the atmosphere in 2014 due to afforestation across the UK expressed as tC per km
2.

9
3 Emissions from soils due to land use change - Cropland, Grassland, Settlements
Changes from one land use type to another will result in a change in soil carbon stocks over time. The change in vegetation cover and management will affect the amount of carbon that goes into the soil from biomass decomposition. This results in ongoing emissions or removals which continue for decades after the change in land use until equilibrium carbon stocks characteristic of the new land use are reached. Also, the initial disturbance of the soil will release carbon from soils to the atmosphere as CO2.
For the National Inventory, the method for assessing changes in soil carbon stock due to land use change links a matrix of change from land surveys to a dynamic model of carbon stock change. For Great Britain, matrices from the Monitoring Landscape Change data from 1947 & 1980 (MLC 1986) and the Countryside Surveys (CS) of 1984, 1990,1998 and 2007 are used.
In Northern Ireland, for 1990 to 1998 and 1998 to 2007, a matrix for the whole of Northern Ireland was available from the Northern Ireland Countryside Survey (Cooper, McCann and Rogers 2009). The only data available pre-1990 for Northern Ireland are land use areas from the Agricultural Census and the Forest Service (Cruickshank and Tomlinson 2000). Matrices of land use change were then estimated for 1970-80 and 1980-90 using area data. The basis of the method devised assumed that the relationship between the matrix of land use transitions for 1990-1998 and the area data for 1990 is the same as the relationship between the matrix and area data for each of two earlier periods – 1970-79 and 1980-89. The matrices developed by this approach were used to extrapolate areas of land use transition back to 1950 to match the start year in the rest of the UK.
Time series of land use change in 20 × 20 km grid-cells (to match those used for the afforestation fluxes) have been developed using the Countryside Surveys covering periods 1984 to 1990, 1990 to 1998 and 1998 to 2007. The land use change matrices for the 20 × 20 km grid-cells are scaled to match those used in estimates of emissions and removals for the devolved administration areas in the United Kingdom. These matrices are then used for each grid-cell in a model analogous to that presently used for the full devolved area. The data are then combined to give estimates per local authority region (see Figure 4). The pattern of emissions and removals across the UK for each land use type is dependent on the ratio of land use change in each LA in relation to the total for that devolved administration (England, Scotland, Wales and Northern Ireland). For example, the majority of land use change to both Cropland and Grassland in Scotland occurs in the south and east of the country. For Northern Ireland there is no spatial information available so the values for each LA are the same.

0
Figure 4: Emissions in 2014 from soil due to land use change (tC/km2) for conversion of all land types to (a) Cropland (b) Grassland and (c) Settlements.
1
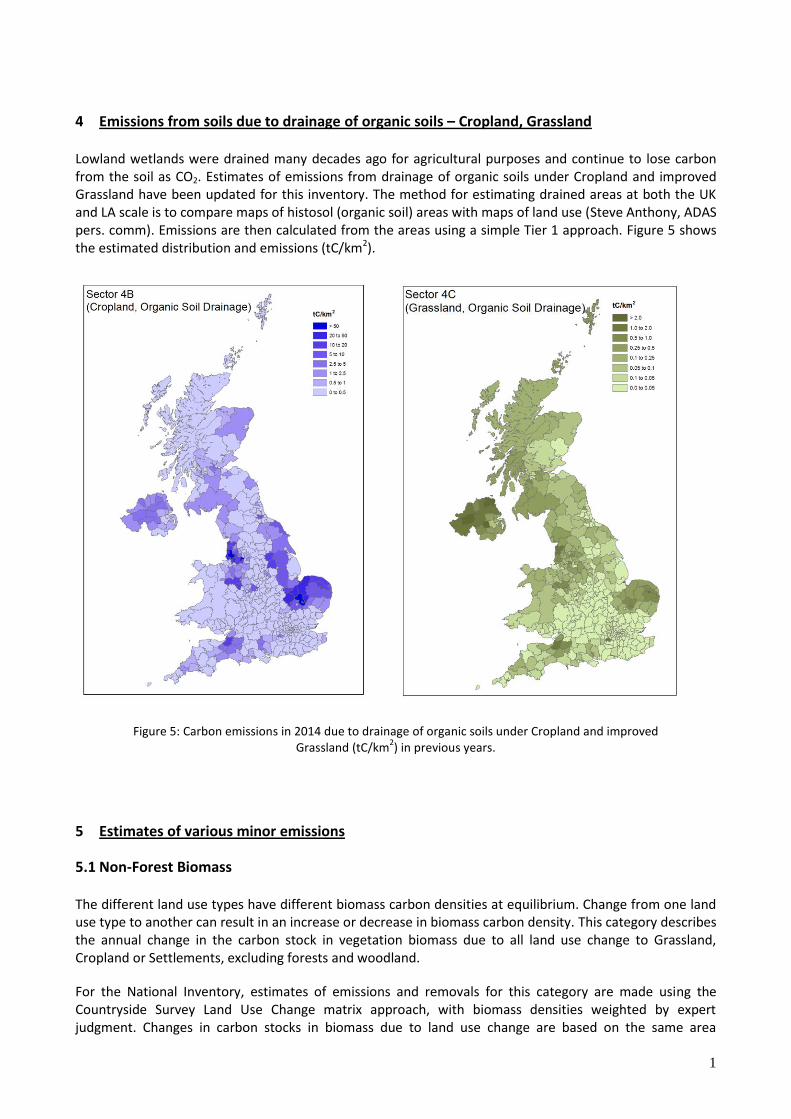
4 Emissions from soils due to drainage of organic soils – Cropland, Grassland
Lowland wetlands were drained many decades ago for agricultural purposes and continue to lose carbon from the soil as CO2. Estimates of emissions from drainage of organic soils under Cropland and improved Grassland have been updated for this inventory. The method for estimating drained areas at both the UK and LA scale is to compare maps of histosol (organic soil) areas with maps of land use (Steve Anthony, ADAS pers. comm). Emissions are then calculated from the areas using a simple Tier 1 approach. Figure 5 shows the estimated distribution and emissions (tC/km2).
Figure 5: Carbon emissions in 2014 due to drainage of organic soils under Cropland and improved
Grassland (tC/km2) in previous years.
5 Estimates of various minor emissions
5.1 Non-Forest Biomass
The different land use types have different biomass carbon densities at equilibrium. Change from one land use type to another can result in an increase or decrease in biomass carbon density. This category describes the annual change in the carbon stock in vegetation biomass due to all land use change to Grassland, Cropland or Settlements, excluding forests and woodland.
For the National Inventory, estimates of emissions and removals for this category are made using the Countryside Survey Land Use Change matrix approach, with biomass densities weighted by expert judgment. Changes in carbon stocks in biomass due to land use change are based on the same area

2
matrices used for estimating changes in carbon stocks in soils. The biomass carbon density for each land type is assigned by expert judgement based on the work of Milne and Brown (1997). Five basic land uses were assigned initial biomass carbon densities, then the relative occurrence of these land uses in the four countries of the UK were used to calculate mean biomass carbon densities for each of the IPCC types, Cropland, Grassland and Settlements. The mean biomass carbon densities for each land type were then weighted by the relative proportions of change occurring between land types in the same way as the calculations for changes in soil carbon densities. Changes between these equilibrium biomass carbon densities were assumed to happen in a single year.
This matrix approach was extended and applied to each 20km × 20km grid square across the UK, and the results combined to give estimates for each local authority (see Figure ).

3
Figure 6: Carbon emissions and removals in 2014 across the UK due to changes in living biomass (tC/km2) following land use change to Cropland (4B2), Grassland (4C) or Settlements (4E).

4
5.2 Peat Extraction
Carbon emissions from peat extraction are calculated for the National Inventory based on data published in the Mineral Extraction in Great Britain Business Monitor PA1007 which gives data on volumes of peat sold; and the Directory of Mines and Quarries (DMQ) which gives the location of peat extraction sites and Google Earth which provides information on the area of peat extraction sites. The 2014 DMQ included information on the location of peat extraction sites in NI for the first time. The peat extraction data for 2014 were not published in time for inclusion in this year’s data, so the volumes for 2014 were carried forward from 2013. The peat extraction data gives the location of origin of the peat and we have assumed that the carbon emission applies to this area (see Figure ).
Due to rounding errors in the published figures, the sum of the extraction areas for the regions does not exactly equal the national totals. The emissions per LA have been adjusted in proportion to their area so that the total equals the submitted national emission. Emissions from peat extraction are reported in category 4D (Wetlands).
Figure 7: Carbon emissions in 2014 (tC/km2) resulting from the extraction of peat for horticultural use.
This is part of the Wetlands category.

5
5.3 Deforestation
Emissions due to deforestation are disaggregated into deforestation to Cropland (reported in 4B and only occurs in England and Scotland), Grassland (4C) and deforestation to Settlements (4E).
The area of land deforested in each Local Authority is not currently available so we assume that the area deforested is proportional to the total area of forest in each LA, and that the relative conversion of forest to either Cropland, Grassland or Settlement is the same for each LA (see Figure ).

6
Figure 8: Emissions of carbon in 2014 resulting from deforestation to Cropland, Grassland or Settlements (tC/km2).

7
5.4 Wildfires
Information on areas of wildfires on forest land in Great Britain and in Northern Ireland is available from the Fire Service Incident Reporting System (IRS). This dataset is available at individual grid referenced fire level for Great Britain and as a national total for Northern Ireland. Hence in Great Britain fires can be assigned to the LA in which they occurred and in Northern Ireland the emissions are assigned between LAs in proportion to the total area of forest land in each LA. The results of this assignment can be seen in Figure 9. The IRS data for 2014 in Scotland was not available in time for compilation of the inventory. In this case the previous ten year average area was used for 2014 and the emissions are assigned between LAs in proportion to the total area of forest land in each LA.
Figure 9: Emissions of carbon in 2014 resulting from wildfires on Forest Land (tC/km2).

8
5.5 Cropland Management Soil
Cropland management activities including inputs of fertiliser, manure and crop residues have an impact on soil carbon stocks. Data on the areas under the main crop types are obtained from the annual June Agricultural Censuses carried out by each UK administration (Defra, 2014a; Welsh Government, 2014; Scottish Government, 2014; DARDNI, 2014). Data on the areas of Cropland receiving inputs of manure, fertiliser and crop residues is obtained from the annual British Survey of Fertiliser Practice (Defra, 2014b and previous editions). The emissions were disaggregated to the LA level using the same methodology as for Cropland soil emissions. The resulting assignment by LA is shown in Figure 10.
Figure 10: Emissions / removals of carbon in 2014 from Cropland Management soil activities (tC/km2).

9
5.6 Cropland and Grassland Management Biomass
A new methodology has been developed to assess changes in biomass carbon stocks arising from Cropland and Grassland management activities. These include change between annual crops, orchards, short rotation coppice, set aside and fallow for Cropland and change between shrubby and non-shrubby grassland types for Grassland. Data on the areas under the main crop types are obtained from the annual June Agricultural Censuses carried out by each UK administration (Defra, 2014a; Welsh Government, 2014; Scottish Government, 2014; DARDNI, 2014). Data on areas of grassland types are derived from the Countryside Surveys of 1990, 1998 and 2007. Information on emission factors was derived from a literature review carried out as part of the biomass variation to the Defra project SP1113. The emissions and removals were disaggregated to the LA level using the same methodology as for Cropland and Grassland non-forest biomass emissions. The resulting assignment by LA is shown in Figure 11.
Figure 11: Emissions / removals of carbon in 2014 from Cropland and Grassland Management biomass activities (tC/km
2).

10
6 LULUCF Totals
The total carbon emissions for the UK land use, land use change and forestry sector (excluding harvested wood products which cannot be mapped) are shown in Figure 12.
Figure 4: The total carbon emissions or removals in 2014 for Sector 4 across the UK (tC/km2).

11
7 Uncertainties
The uncertainties in calculating the LULUCF inventory are described in the annex of the national inventory report (Brown et al, 2016) and are in the range of 30-50%. Additional uncertainty is associated with disaggregating the dataset to LA scale. A full uncertainty analysis of this procedure has not been carried out, however, it is estimated that the uncertainty in the disaggregation process is in the range of 20-30 %.

12
8 Recalculations
The National Inventory is often updated to include improved, or new, datasets and modelling techniques. In the 2014 inventory there were many changes and improvements (Table 2).
Table 2: Details of all changes between the 2013 and 2014 LULUCF inventories.
Description of Change Reason for Change Categories Affected
1990-2013 Inventory
2013 UK Value (GgC)
1990-2014 Inventory
2013 UK Value (GgC)
1990-2014 Inventory
2014 UK Value (GgC)
The method for aggregating the output from the CARBINE model for Forest remaining Forest, allowing for the 20 year transition period, was corrected to ensure that carbon stock changes were attributed to the correct reporting years.
Correction of a previous error.
4A -4722.95
-4820.26
-4753.39
The emission factor used for grassland drainage was corrected, as in the previous inventory the IPCC 2006 emission factor for cultivated organic soils was used for Grassland on drained organic soils rather than the emission factor for Grassland on drained organic soils.
Correction of a previous error.
4C1 soil drainage
964.35
48.22
48.22
The methodology for estimating areas of peat extraction has been updated following new datasets becoming available.
Improvement due to new activity data.
4D1 peat extraction
81.95
103.48
103.47
Reporting of biomass carbon stock change from Cropland and Grassland Management activities
New reporting categories.
4B1 biomass management
NA 3.36
-10.52
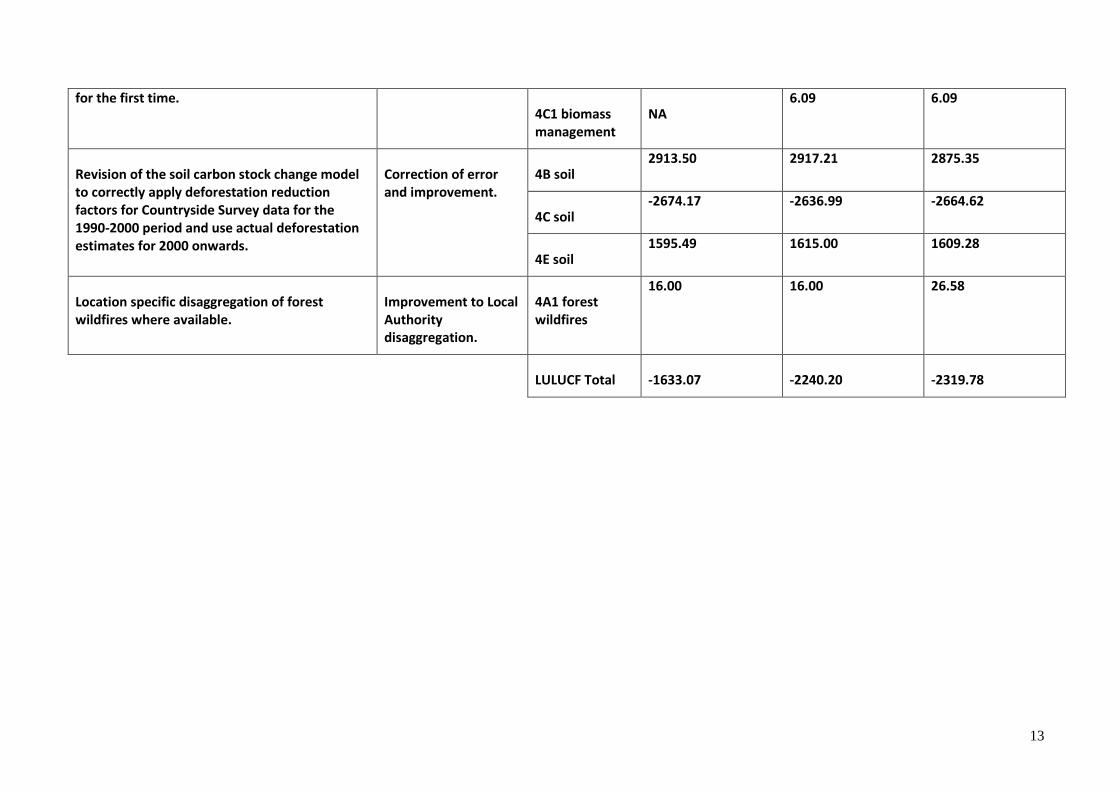
13
for the first time. 4C1 biomass management
NA 6.09 6.09
Revision of the soil carbon stock change model to correctly apply deforestation reduction factors for Countryside Survey data for the 1990-2000 period and use actual deforestation estimates for 2000 onwards.
Correction of error and improvement.
4B soil 2913.50 2917.21 2875.35
4C soil -2674.17 -2636.99 -2664.62
4E soil 1595.49 1615.00 1609.28
Location specific disaggregation of forest wildfires where available.
Improvement to Local Authority disaggregation.
4A1 forest wildfires
16.00 16.00
26.58
LULUCF Total -1633.07 -2240.20 -2319.78

14
References
Anthony, S. (2013) Spatial Extent of Cultivated Organic (Histosol) Soils. Unpublished Defra report for project AC0114, personal communication.
Bradley, R. I. (1997). Carbon loss from drained lowland fens. Carbon Sequestration in Vegetation and Soils. M. G. R. Cannell. London, Department of Environment.
Brown et.al. (2016). UK Greenhouse Gas Inventory, 1990 to 2014: Annual Report for submission under the Framework Convention on Climate Change. Brown P, Broomfield M, Buys G, Cardenas L, Kilroy E, MacCarthy J, Murrells T, Pang Y, Passant N, Ramirez Garcia J, Thistlethwaite G, Webb N Ricardo Energy & Environment report to DECC Ricardo Energy & Environment/R/3462, ISBN 978-0-9933975-1-6 http://naei.defra.gov.uk/reports/reports?report_id=902
CEH (2010). Inventory and projections of UK emissions by sources and removals by sinks due to land use, land use change and forestry. Amanda Thomson, Deena Mobbs, Ronnie Milne, Peter Levy, Kirstie Dyson, Heath Malcolm and Stephen Hallsworth, CEH., Alice Holt, Robert Matthews and Gemma Miller, Forest Research, Justin Goodwin Aether Ltd, Abingdon:
Cooper, A., McCann, T. and Rogers, D. (2009). Northern Ireland Countryside Survey 2007: Broad Habitat Change 1998-2007. Northern Ireland Environmental Agency Research and Development Series No. 09/06.
Cruickshank, M. and R. Tomlinson (2000). Changes in soil carbon storage in Northern Ireland: estimated by the IPCC default and matrix methods. Carbon Sequestration in Vegetation and Soils. R. Milne. London, Department of Environment.
DARDNI (2014) Agricultural Census in Northern Ireland 2013 https://www.daera-ni.gov.uk/sites/default/files/publications/dard/agricultural-census-ni-2014.pdf
Defra (2006). UK’s report to the European Commission made under Decision 280/2004/EC of the European Parliament and of the Council of 11 February 2004 concerning a mechanism for monitoring Community greenhouse gas emissions and for implementing the Kyoto Protocol, Defra: 36.
Defra, (2014a), Structure of the agricultural industry in England and the UK at June. https://www.gov.uk/government/statistical-data-sets/structure-of-the-agricultural-industry-in-england-and-the-uk-at-june
Defra (2014b). British Survey of Fertiliser Practice: Fertiliser Use on Farm Crops for Crop Year 2014. Data for preceding years comes from earlier versions of the same publication. https://www.gov.uk/government/collections/fertiliser-usage
IPCC (2006). 2006 IPCC Guidelines for National Greenhouse Gas Inventories. Eggleston H.S. et al. (eds.) IPCC National Greenhouse Gas Inventories Programme Technical Support Unit. Volume 4: Agriculture, Forestry and Other Land Use.
Milne, R. and T. A. Brown (1997). "Carbon in the vegetation and soils of Great Britain." Journal of Environmental Management 49(4): 413-433.
MLC (1986). Monitoring Landscape Change, Report prepared by Hunting Surveys & Consultants Ltd for Department of the Environment and the Countryside Commission.

15
Scottish Government (2014) Results from the June 2014 June Agricultural Census. http://www.scotland.gov.uk/Topics/Statistics/Browse/Agriculture-Fisheries/PubFinalResultsJuneCensus
Welsh Government (2014) Survey of Agricultural and Horticulture, June 2014. http://wales.gov.uk/statistics-and-research/survey-agricultural-horticulture/?lang=en#/statistics-and-research/survey-agricultural-horticulture/?tab=previous&lang=en