mcconkie (1996) visual stability across saccades while ...wexler.free.fr/library/files/mcconkie...
TRANSCRIPT

Journal of Experimental Psychology:Human Perception and Performance1996, Vol. 22, No. 3, 563-581
Copyright 1996 by the American Psychological Association, Inc.0096-1523/96/53.00
Visual Stability Across Saccades While Viewing Complex Pictures
George W. McConkie and Christopher B. CurrieUniversity of Illinois at Urbana-Champaign
As people examine their world, the proximal stimulus changes position on their retinae withevery saccade, but they perceive the world as being stable. This phenomenon of visualstability was explored by making changes in natural, full-color pictures during selectedsaccades as observers examined them in preparation for a recognition test. In Experiment 1,the pictures were displaced up, down, left, or right by 0.3, 0.6, or 1.2°. In Experiment 2, thepictures were expanded or contracted by 10% or 20%. As a secondary task, subjects presseda button when a change was detected. Three results from previous studies with simpler stimulidid not generalize. Evidence suggests that subjects' detection of image changes primarilyinvolves the use of local information in the region of the eyes' landing position. A saccadetarget theory of visual stability is proposed.
Making a saccadic eye movement causes a displacementof the light pattern across the retinae. If a similar retinaldisplacement occurs during an eye fixation, there is percep-tion of movement, that is, the world appears to jump.However, the same pattern of motion on the retinae, occur-ring as a consequence of making a saccade, is not perceivedand the world appears stable.1 This phenomenon, referred totraditionally as space constancy, and which we will callvisual stability, permits people to visually explore the worldwith a moving sensory matrix without misattributing self-induced stimulus motion on the matrix to the world itself.How the visual system achieves this stability has been amatter of speculation and research since Helmholtz (186671963) discussed the problem.
George W. McConkie and Christopher B. Currie, Center for theStudy of Reading and The Beckman Institute for Advanced Sci-ence and Technology, University of Illinois at Urbana-Champaign.
These studies were a fully collaborative effort on the part of thetwo authors. Equipment necessary to conduct this research waspurchased with funds from American Telephone and Telegraph,Center for the Study of Reading, and the Research Board of theUniversity of Illinois at Urbana-Champaign. The research wassupported by the Center for the Study of Reading and used soft-ware developed by Gary Wolverton. Part of the data analyses inthese studies were conducted while George McConkie was onsabbatical leave at the University of Leuven, Belgium, supportedby a Senior International Fogarty Fellowship from the PublicHealth Service and a Research Fellowship from the Belgian Gov-ernment.
Thanks are expressed to Gery d'Ydewalle and members of theEye Movement Laboratory at the University of Leuven for theirsupport and encouragement. Ehtibar Dzhafarov was very helpful insuggesting appropriate statistical tests. We thank David Irwin forproviding feedback on an earlier version of this article and Alex-ander Pollatsek, John Findlay, and Bruce Bridgeman for theirhelpful reviews.
Correspondence concerning this article should be addressed toGeorge McConkie, 2251 Beckman Institute, University of Illinoisat Urbana-Champaign, 405 North Mathews, Urbana, Illinois61801. Electronic mail may be sent via Internet to gmcconk®uiuc.edu.
Two classes of theories have been proposed to explainthis visual stability. One class assumes that the characteris-tics of the proximal stimulus alone are sufficient to distin-guish between retinal change resulting from saccadic eyemovements and change resulting from movement in dieworld. The other class assumes that some additional, non-retinal information is required, though individual theoriesdiffer in the nature of the information proposed.
Proximal Stimulus Alone: Gibson
Gibson (1966) argued that the transformation of the visualarray over time that results from making a saccade is dif-ferent from that which typically results from motion in theworld. A saccadic eye movement produces a rigid displace-ment of the entire light pattern on the retinae. Thus, this typeof transformation specifies a self-induced stimulus displace-ment, rather than a change in the world. Furthermore,though not stated by Gibson, saccadic suppression (Volk-man, Schick, & Riggs, 1968), together with visual maskingfrom pre- and postsaccadic visual fields, prevents the per-ception of the stimulus motion on the retinae that resultsfrom a saccade-produced stimulus displacement. Thus, arigid stimulus transformation, together with no direct sen-sation of the motion that typically accompanies stimulustransformations, affords the perception of a stable world.
Two types of evidence argue against Gibson's explana-tion. First, as MacKay (1973) and Bridgeman (1981) pointout, pressing the side of the eyeball while fixating a constantposition produces a perception of world motion even whenthe light pattern remains stable on the retina. Second, if thestimulus is physically displaced during a saccade, this can
1 Note that, except in highly controlled circumstances, thechange in the pattern of light on the retina that results from makinga saccade is not identical to that produced by shifting a two-dimensional image the same distance in the opposite direction.However, the small differences that might result, given the cir-cumstances of the experiments reported later, will be ignored inthis article.
563

564 McCONKIE AND CURRIE
be detected (Bridgeman, Hendry, & Stark, 1975) eventhough the stimulus change consists of a rigid transforma-tion during a saccade. These two observations indicate thatthe experience of world motion can arise without stimulustransformation on the retina, and in spite of a rigid trans-formation. Thus, additional information is required in dis-tinguishing between world- and self-motion.
Theories Postulating a Secondary Factor
There are currently three classes of theories that postulatethe use of something else beyond the transformation of theretinal stimulus pattern itself in achieving the perception ofa stable visual world as saccades are made. They will bereferred to as cancellation theories, "taking-into-account"theories, and target-object theories.
Cancellation theories: von Hoist and Mittelstaedt(1950/1971) proposed that when the visual system producesa neural signal to cause a saccadic eye movement, anefference copy is also generated that is used to cancel theresulting retinal displacement. This efference copy, or cor-ollary discharge, is strictly correlated with the original sig-nal. The retinal image, or afferent signal, is retinally dis-placed by a distance equal to that of the saccade, but in theopposite direction. Thus, by combining the efference copyand the postsaccadic afferent signal, the saccade-produceddisplacement is canceled and is not perceived.
Breitmeyer, Kropfl, and Julesz (1982) suggested furtherdetail for such a mechanism, resulting in an integration, orspatiotopic fusion, of the successive images. Their proposedmechanism would operate early in vision to eliminate theretinal displacement produced by a saccade, thus yielding astable, continuous internal signal from which continuousvision proceeds.
Cancellation theories predict that a mismatch between theefference copy and the afferent signal will be attributed tomovement in the world. Such mismatches can be producedby physically moving the stimulus during saccades, so itsposition in the world is different following the saccade thanit was before the saccade. Extensive psychophysical re-search has been conducted to examine the sensitivity of thevisual system to these types of intrasaccadic stimulus dis-placements, as a way of studying the mechanism underlyingspace constancy. Most of this research has been conductedin complete darkness with stimuli consisting of dots orsimple light patterns that are displaced different distancesand directions during saccades. The subjects' task is todetect the stimulus displacements when they occur. Theprimary findings from these studies can be summarized asfollows:
Saccade length function: If the stimulus shift magnitudeis held constant, displacement detection drops as saccadelength increases (Bridgeman et al., 1975; Li & Matin, 1990;Mack, 1970).
Displacement threshold level: Displacements can be re-liably detected when the magnitude of the shift is about 10%to 20% of the length of the saccade (Mack, 1970; Whipple& Wallach, 1978).
Constant detection—saccade length ratio: A constantdetection level is maintained as saccade length increases ifthe magnitude of the stimulus displacement is a constantproportion of the saccade length (Li & Matin, 1990).
Direction independence: Detection likelihood is inde-pendent of relative saccade direction, where this is definedas the angle between the saccade and stimulus shift vectors(Bridgeman et al., 1975; Mack, 1970). One exception to thisis reported by Macknik, Fisher, and Bridgeman (1991).
The typical interpretation of these findings is that theextraretinal information concerning eye position is some-what imprecise, and that this imprecision increases withsaccade length (Li & Matin, 1990). Skavenski (1990) sug-gests that there is a need for some mechanism to determinehow much of the mismatch between efference copy andafferent signal is to be attributed to error in the system andhow much is due to movement in the world.
Recent physiological research by Duhamel, Colby, andGoldberg (1992) provides support for the existence of aremapping of retinal space with each saccade, as cancella-tion theory suggests. However, two lines of research haveraised questions about cancellation theories. First, Matin(1986) has attempted to measure the accuracy of the ex-traretinal information concerning eye position that is pro-duced in making a saccade and has concluded that theaccuracy is too low to account for research results on visualstability. Second, a number of studies have failed to findevidence for the integration or spatiotopic fusion of imagesfrom successive eye fixations that cancellation theories sug-gest (for a review, see Irwin, 1992).
Finally, it appears that even if the cancellation mechanismis the basis for visual stability when examining simplestimuli in the dark, its role may be severely reduced whenviewing more complex stimuli. Matin, Picoult, Stevens,Edwards, and MacArthur (1982) studied perception in sub-jects with partially paralyzed oculomotor muscles. In thiscondition, it was assumed that attempting to make a saccadeproduced a large deviation between the efferent signal,indicating the intended length of the saccade, and the affer-ent signal, indicating where the eyes actually positionedthemselves. When participants were asked, in the dark, tosaccade away from illuminated points set directly ahead ateye level, they perceived the points of light to move eventhough they did not. This illusion of stimulus movementwas attributed to the mismatch between efferent and affer-ent signals. However, when the same task was conducted ina normally illuminated room, no motion was perceived.Stark and Bridgeman (1983) obtained compatible resultswith another method. If the results of studies investigatingintrasaccadic displacements of simple stimuli in the dark donot generalize to more normal viewing situations, this callsinto question the assumption that the mechanism beingstudied underlies visual stability. A primary goal of theexperiments presented later was to determine whether theseresults do generalize to the viewing of complex pictures ina natural perceptual task.
Taking-into-account theories: A second class of theo-ries also postulates the existence of retinal and extraretinalsignals but without assuming a cancellation or remapping

VISUAL STABILITY 565
process. MacKay (1973) assumes the existence of a spa-tiotopic map, and argues that the efferent command to makea saccade is also a signal to the visual system to beginevaluating the retinal signal for "map-changing informa-tion-content" (p. 314). If the retinal signal contains infor-mation that the world has changed, and the evaluationmechanism detects this, then the system decides that theworld is different from the internal map, and proceeds toupdate that map. Furthermore, the evaluation mechanismmust decide, by some criteria, whether or not the retinalimage displacement "is significantly different from thatwhich the saccade was calculated to bring about" (p. 318).MacKay does not propose the exact mechanism by whichthis evaluation is carried out and leaves open the possibilitythat it is flexible and varies under different conditions.However, it seems that it must involve a comparison of theretinal stimulus pattern with information retained from pre-vious fixations, together with some basis for judgingwhether the stimulus pattern is where it is expected to be.The latter judgment could involve an efference copy, aswith cancellation theory. However, in MacKay's theory, theefference copy would simply be "taken into account"(Bridgeman, van der Heijden, & Velichkovsky, 1994) injudging whether the world has changed, rather than beingthe basis for a cancellation process.
Bridgeman et al. (1994) abandon the use of an efferencecopy in achieving visual stability and deny that any type ofperceptual instability is produced by the displacement of theretinal signal across saccades. They argue that although it istrue that a displaced pattern on the retina is reflected by achange in position of the retinal pattern in the variouscortical retinotopic maps (e.g., the LGN, VI, V2, etc.), theposition of any cortical pattern in a map is itself not a codefor position. Rather, it is the particular pattern itself that isa code for position, and this pattern of activation is invariantacross eye movements. (For neurophysiological and mod-eling evidence on this point, see Andersen, Essick, & Sie-gel, 1985, and Zipser & Andersen, 1988.)
Although Bridgeman et al.'s position explains the exis-tence of space constancy, it raises the question of how thevisual system detects rigid stimulus displacements acrosssaccades. To deal with this problem, Bridgeman et al.(1994) postulate a mechanism mat derives anew, with eachfixation, the visual direction of the world from both ex-traretinal (i.e., efferent and proprioceptive) and retinalsources of information. A comparison process across eyemovements then detects any change in direction. This com-parison process tolerates mismatches up to a point; beyondthis point, the mismatch produces a perception of stimulusdisplacement.
In contrast to cancellation theories, which assume that alow-level visual process automatically cancels out the stim-ulus displacement by remapping retinal space, MacKay(1973) and Bridgeman et al. (1994) presumed the existenceof higher level mechanisms that are able to detect and makeuse of cues indicating that a stimulus change has occurred.If no such cues are detected, then space constancy is expe-rienced. The use of available cues, including the weightingof retinal and extraretinal information in detecting stimulus
displacements, is likely to depend on characteristics of thevisual stimulus, the task, and the observers. Such flexibilitywould limit the generalizability of the psychophysical re-sults from early studies of detectability (Bridgeman et al.,1975; Mack, 1970; Stark, Kong, Schwartz, Hendry, &Bridgeman, 1976; Whipple & Wallach, 1978). However,there are no published studies that report psychophysicalfunctions for detection rates of stimulus displacements withcomplex stimuli in more naturalistic tasks, in order to de-termine whether the earlier results do or do not generalizewell to other conditions.
Target-object theories: A third type of theory is sug-gested in a "localist" or "retinotopic error" explanation thatBridgeman and Stark (1979) give to results obtained byWhipple and Wallach (1978), although they do not developthe theory further. Whipple and Wallach asked participantsto saccade between two sides of a large circle, 7° in diam-eter, and they shifted the circle different distances horizon-tally or vertically during the saccades. The ratio of thedisplacement size to the saccade length is called the dis-placement ratio. The displacement was either parallel to thedirection of the saccade or was orthogonal to it. Whippleand Wallach discovered that displacements in the orthogo-nal direction must be twice as great as displacements in theparallel direction to produce equal detection frequency.Furthermore, the displacement ratio necessary for orthogo-nal displacements to be detected was much greater than thatobserved by other investigators (Bridgeman et al., 1975;Mack, 1970; Stark et al., 1976).
Bridgeman and Stark (1979) observed that, because thestimulus was a circle, the distance that the eyes landed fromthe edge of the circle was much greater when a paralleldisplacement occurred than when an orthogonal displace-ment occurred. Therefore, they reanalyzed the data by usingthe distance of the eyes from their target—the edge of thecircle (operationalized as the distance to the nearest point ofthe circle)—as a predictor of detection frequency rather thanthe displacement distance itself. Using this local informa-tion as a predictor eliminated the difference between paral-lel and orthogonal displacements and brought the detectionthresholds for orthogonal displacements into line with thoseobtained for other conditions as well as with results fromprevious studies.
Bridgeman and Stark's observation suggests that the crit-ical variable in detecting displacements could be the dis-tance of the eye from its target at the beginning of the neweye fixation. In most research, this variable has been largelyconfounded with the size of the displacement itself: Largerdisplacements take the eyes farther from their target. Atarget-object theory, then, would propose that the detectionof displacements is based not on an efference copy of thesaccade signal, nor on global properties of the visual stim-ulus itself, such as general stimulus direction, but strictly onlocal information, for example, the distance of the intendedtarget, at the beginning of the new fixation, from someanticipated retinal location, probably the center of vision.
This review of the literature highlights two issues to beaddressed in the studies described later: (a) Do the psycho-physical functions of intrasaccadic displacement detection,

566 McCONKIE AND CURRIE
which have been obtained in studies with simple stimulipresented in the dark, generalize to the more normal con-dition of viewing complex, naturalistic stimuli; and (b) isthe detection of such displacements based in some way onthe global retinal pattern, or only on local aspects of thepattern in the region of the object to which the eyes werebeing sent?
Two experiments are reported here, in which participantswere asked to examine colored photographs of houses innatural settings in preparation for a recognition test. Duringselected saccades in the viewing, pictures were horizontallyor vertically displaced (Experiment 1) or were increased ordecreased in size (Experiment 2). As a secondary task,participants were asked to press a button when they detectedany type of change in the picture. Actually, the data for bothstudies were collected simultaneously, from the same par-ticipants viewing the same pictures. Mathematical modelingof the data is used to address the two issues mentionedearlier. Note that the experiments were not designed toinvestigate maximal detection under conditions optimizedfor that purpose. Rather, they were designed to provideinformation on the degree to which certain display changes,which are assumed in cancellation theory to interfere withthe processes underlying space constancy, disrupt process-ing in a natural ongoing perceptual task to the extent thatpeople notice, or detect, the disruption.
Experiment 1
The first experiment was conducted to examine the func-tional relationships between several variables and the like-lihood of detecting an intrasaccadic displacement of a com-plex picture.
Method
Stimuli. Forty pictures of houses were digitized from photo-graphs at 617 X 398 pixels with 16 bits of color per pixel. At aviewing distance of 27 inches, each image subtended an area of22 X 15°.
Apparatus. The pictures were displayed on a Princeton Ultra-Synch monitor in 756 X 486 pixel mode, controlled by an ATVistadisplay controller card in a 386 computer and refreshed at 60 Hz.To hide the edge of the display screen, we blackened the plasticmolding of the monitor and placed a large (44 X 39°) glare filterin front. This effectively hid the edge of the display screen and ofthe monitor itself, causing the pictures to appear on a large,darkened field.
In the ATVista display controller, four images can be stored inthe image memory. This makes it possible to quickly switch fromone image to another, simply by switching to a different region inimage memory. This change can occur at the end of any horizontalscan, so the change can be initiated at any point during a verticalrefresh of the image and is completed in 16.7 ms.
The observer's eyes were tracked with a fifth generation DualPurkinje Image Eyetracker, sampling eye position every millisec-ond and producing 12-bit data values for horizontal and verticalposition. The equipment was adjusted so that a 1° movementproduced about a 200 value change in the eyetrack signal. Occa-sionally, successive samples differed by as much as 5 values,
suggesting a noise level of about ± 1 min of arc. Saccades wereidentified within 10 ms of their initiation, and on critical saccadesan image change was initiated immediately on detection. Saccadeonset was detected online as a difference of 10 values or more (3min of arc) between the current sample and that taken 4 ms earlier,followed by 4 additional samples indicating movement in the samedirection. Because image changes can begin at any point during avertical refresh cycle, the display of the old image was discontin-ued by no more than 10 ms after the onset of the saccade, and thenew image was completely written on the monitor 16.7 ms later.
Participants. Eighteen members of the University of Illinoiscommunity were paid to participate.
Task. Participants examined the set of 40 pictures twice, thefirst time to study the pictures and the second time to indicatewhether each picture was the same as one seen on the first viewing.Each picture was shown for 20 s on each presentation. As asecondary task, participants were to press a button immediately ifthey detected any change take place in a picture. During fourwarm-up pictures they were shown the types of display changesthat could occur. They were not told the frequency with whichchanges would occur.
Three types of changes occurred during the presentation of 32 ofthe pictures: horizontal or vertical displacements, changes in thesize of the picture, and appearance or disappearance of an objectfor a single fixation. Data from the last type of change are notreported in this article. The display changes were made possible bystoring four variations of a picture in the image memory: (a) thebase image, (b) the same base image displaced horizontally orvertically from its original location, (c) an enlarged or reducedversion of the base image, and (d) a version of the base image withan added or deleted object. Picture changes then occurred byswitching among the four images. Participants were not asked todiscriminate among the different types of changes but simply toindicate when any change was detected.
During the second viewing of the pictures, the only pictures thatwere different from the first viewing were 8 in which no displaychanges occurred during the viewing. The modifications to these 8pictures included left-right picture reversal or large object re-moval. Subjects indicated whether each picture was the same asone in the earlier viewing following its 20-s viewing period.
Stimulus displacement conditions. The stimulus displacementsused in this experiment included horizontal shifts of the entireimage by 1.2 or 0.6° either left or right, and vertical shifts of 0.6or 0.3° either up or down. The choice of shift sizes was made onthe basis of pilot data, indicating a wide range of detection fre-quencies, and in anticipation of analyses planned for Experiment 2.
Design. Of the 40 pictures, 8 were shown with no displaychanges, thus serving as a control condition. During the viewing ofthe other 32 pictures, the image was displaced on the screen on the2nd, 9th, 16th, 23rd, or 30th saccade (in some cases, for reasonsunrelated to this study, a displacement scheduled later than the 2ndsaccade was delayed by one saccade). A second displacement thenoccurred exactly 7 saccades later, bringing the picture back to itsoriginal position. Thus, during the viewing of each experimentalpicture, there were exactly two image displacements, except incases where too few saccades were made to reach a critical saccadeon which a displacement was planned. The 7-saccade differencebetween display changes was selected on the basis of pilot datathat indicated participants very seldom pressed their button inresponse to a stimulus change later than 7 saccades following thechange. Typically, the response was within 2 or 3 saccades of theone on which the change occurred.
During another of the critical saccades, no display change oc-curred, thus providing a second control condition. Finally, during

VISUAL STABILITY 567
the remaining critical saccades, the other types of changes in thedisplay occurred, as described earlier.
The order of the different types of display changes (displace-ment, size change, object appearance or disappearance, and nochange) varied from picture to picture and was balanced insofar aspossible. Furthermore, participants were assigned to one of fourgroups, with groups differing in the order in which they saw thepictures, order of conditions on each picture, and the particularvalue of a condition for a given picture. Thus, if a picture wereshifted upward by 0.6° for one group on the 2nd saccade, this samecondition occurred for different pictures on other critical saccadesfor the other groups. Type of change and order of change werecompletely counterbalanced within each group. An example of theoccurrence of the different conditions during the viewing of asingle picture is shown in Figure 1.
Phosphor persistence concerns. Phosphor persistence is a con-cern in this study. If phosphor decays slowly enough, a change inthe stimulus during a saccade can be detected on the basis ofseeing the persistence during the following fixation. To determinewhether this could be the basis for detecting changes in this study,a follow-up experiment was conducted by using a "shutter test"(Irwin, 1994). Four participants viewed 6 of the images used inExperiment 1 monocularly through a shuttered aperature con-trolled by computer, with viewing distance and lighting conditionssimilar to Experiment 1.
The shutter opened with a delay of 2 ms and remained open for100 ms. The viewed image shifted horizontally or vertically by thesame distances as the maximum shifts used in Experiment 1. Thetime of the shift varied with respect to the opening of the shutter:The shift occurred 30 ms after the opening of the shutter (condition30), at the time of the opening of the shutter (condition 0) or 10,20, or 30 ms before the opening of the shutter (conditions —10,-20, and -30).
Each participant had 96 trials in each shift condition, randomlymixed with 360 trials in a no-shift control condition. On each trial,participants indicated whether or not they detected a change andwere encouraged to use a liberal criterion. In the control condition,detection (false alarm) likelihood was .26 across participants. Forthe other conditions, detection rates were .99, .36, .30, .27, and .24for conditions 30, 0, —10, —20, and —30. Thus, changes madewhile the shutter was open were highly detectable. In the otherconditions, the standard error used for comparisons with the con-trol condition ranged from .025 to .026. Condition 0 differed fromthe control condition by more than twice the standard error. Noother condition approached this criterion.
These results show that persistence is rarely, if ever, detected ator beyond 12 ms (i.e., 10 ms plus 2 ms shutter delay) following theinitiation of a display change, thus being within the period of evenshort saccades.
Results
Each shift condition did not occur equally often for threereasons: (a) Sometimes a participant made insufficient sac-cades on a picture to cause all scheduled display changes tooccur, (b) sometimes data were lost due to blinks andeyetracking difficulties, and (c) sometimes the last criticalsaccade was not followed by at least 7 fixations, in whichcase the data for that display change was not includedbecause there may not have been adequate time for theparticipant to respond. Out of a possible 2,304 plannedimage displacements (18 participants X 32 pictures X 2displacements per picture), good data were obtained for1,490 displacements.
Onset Shift
S2
Change back
F1 - F2 F3 - F9
Control
S9 S16 S23
F10 - F16 F17 - F23
Change size Change back
S30
Object Change back
S37 S38
F24 - F30 F31 - F37 F38 F39 - . . .
Figure 1. Schematic example of the sequence of changes taking place in a picture during the 20-sviewing period. Each change occurs during the indicated saccade.

568 McCONKffi AND CURRffi
False alarms and late responses. In this study, positiveresponses could include two types of errors: false alarms,and late responses (responses to one display change thatactually occurred after the next display change occurred).The frequency of these can be estimated by using data fromthe two control conditions included in the study.
The frequency of false alarms was estimated by usingdata from control pictures in which no display changesoccurred. The saccades on these pictures that correspondedto the critical saccades in the experimental pictures wereidentified, and the frequency of pressing the button duringthe following 7 fixations was calculated. This gave thefrequency of responding during this interval when no dis-play change occurred. The response rate was 0.6%.
A second estimate was made by calculating the frequencyof responding to the control condition (no display change)on experimental pictures when that condition occurred onthe 2nd saccade. In this case, there were no precedingdisplay changes on that picture to which the subject mightbe giving a late response. The frequency of responding wasquite similar: 1.0%.
In cases in which the control condition occurred later thanthe 2nd saccade, it was always preceded by a display change7 saccades earlier. In these cases, it is possible that theresponse to the earlier change was late enough to occurfollowing the critical saccade for the control condition.Therefore, the frequency of responding during the intervalfollowing the control condition in these cases gives anindication of the frequency of late responses plus falsealarms. This frequency was 1%, which is low enough toallow false alarms and late responses to be ignored in theremaining analyses.
Saccade length function. The major goal of Experiment1 was to determine whether certain relations among saccadelength, shift size, and shift detection, observed in previousstudies, hold true while viewing complex pictures. To ac-complish this, it was necessary to quantify the relationsamong these variables. The first step in doing this was toestablish the relationship between saccade length and shiftdetection. The data were reduced to a list of cases, eachconsisting of a dyad: the length of the saccade during whichthe picture was shifted and whether or not the shift wasdetected. Thus, data were collapsed across participants andshift size. The cases were sorted by the length of thesaccade. Because the dependent variable was binary (detector no detect), the relationship between saccade length anddetection likelihood was plotted by using a sliding windowtechnique. A window was defined on the sorted data thatincluded the shortest 100 saccades; for these cases a detec-tion likelihood and a mean saccade length were calculated.The window was then stepped in increments of 50 saccades,and at each new position a detection likelihood and meansaccade length were obtained for the 100 cases containedwithin the window. Figure 2 shows the relation betweenthese two variables, indicating that detection likelihooddrops in a negatively accelerated manner as saccade lengthincreases. The data are well fit by the function:
i.o
0.8
0.6
o& 0.4
0.2
0.0
n r 1 r
• DataFit
f(s) = A*e S
A = 0.863K = -.591
f(s) = (1)
0 1 2 3 4 5 6 7
Saccade length (s)
Figure 2. Relationship between saccade length, s, and propor-tion of detections of intrasaccade shifts of the picture, f(s). Eachproportion and mean saccade length is based on 100 cases (seetext).
where f(s) is the likelihood of detection, A is a parameterindicating the intercept of the function, A" is a parametercontrolling the rate of change, and 5 is the saccade length.
Nonlinear regression was used to obtain maximum like-lihood estimates for the parameters A and K, using theNonlin module of SYSTAT (Wilkinson, 1989). This wasdone by minimizing the sum of the values obtained bytaking the negative of the log of the difference between themodel's prediction for each individual data point and theobtained binary data value (i.e., detection or nondetectionon that trial), the negative log-likelihood difference. Be-cause the data set was larger than SYSTAT could handle,the 151 longest saccades were removed from the data set,which consisted of all saccades over 7.25°. These casesshowed a 2% detection rate and would play little role in theultimate fit of the model. The remaining 1,339 cases yieldedestimates of .863 for A, the intercept parameter, and —.591for K, the slope parameter, with a loss value of 619.642,shown as Model A in Table 1. A graph of Equation 1 withthese parameter values is included with the windowed datain Figure 2. Note that the model-fitting process was carriedout by using data for individual saccades and not using the"binned" data from which Figure 2 was constructed. Thus,the figure provides only an approximate indication of theactual fit, which cannot be presented graphically.
Goodness of fit was tested with a chi-square test. Dou-bling the negative log-likelihood loss value yields an indexthat is chi-square distributed. By this test, the obtained lossvalue is not statistically significant, ̂ (1337, N = 1,339) =1,239.484, p = .977. Thus, the data do not deviate signifi-cantly from the model's predictions. In fact, only one of themodels presented later is statistically rejected by this test, sothe results of this test are not reported further unless noted.

VISUAL STABILITY 569
Table 1Models Tested in Experiment 1
Model
A
A'
A parameters (intercept)
Base model (Equation 1)A 0.863
Base model fit separatelyof data (Equation 1)A 0.685 to 1.096
No.K parameters (slope) parameters Loss Tests"
Kto each
K
-.591 2Group X View subset
-0.473 to -0.809 16
620
611 A
B
D
H
Effect of shift size
Base model (Equation 1) fit separately to each shift sizeA03 0.383 K03 -0.698 6 572 A*A06 0.922 K06 -0.621A1 2 1.141 K12 -0.518
Base model (Equation 1) modified: Shift size affects intercept onlyA03 0.332 K -0.581 4 573 BA06 0.894A12 1.194
Base model (Equation 1) modified: Shift size affects slope onlyA 0.912 A:03 -1.310 4 578 B*
K06 -0.614K12 -0.411
Effect of shift and shiftback, and serial position
E
F
G
Base model (Equation 1) fit separately to each shiftand shift-back by serial position subset of dataBase model (Equation 1) fit separately to each serialpositionBase model (Equation 1) fit separately to first vs. laterserial positions
60
36
12
533
546
561
B*
E,F*B*
E,F,B*
Effect of shift direction
Relative shift direction (180°) included in model (Equation 2)A/03 0.759 AS03 -0.004
A506 -0.003541 B*
557 B*
543 H
K03 -0.711A/06 1.001 A506 -0.003 K06 -0.506A/,2 1.713 AS12 -0.005 Kt2 -0.493
I Relative shift direction (90°) included in model 9(Equation 2)
J Intercept as function of relative shift direction (180°) (Equation 2)A/03 °-
662 ASo3 -0.004 K03 -0,573 7A/06 1.249 A506 -0.005A/,;2 1.764 ASV2 -0.006
K Only intercept is function of relative shift direction (180°) (Equation 2)A/os °-933 Asoi -0.005 K03 -0.591 5 560Ai i innAY0.6 1-lUUA/,,2 1.785
Note. Codes only indicate tests against earlier models.a Where a statistical test was performed between a model (as labeled in the first column) and a prior,simpler model, the simpler model is indicated by label in this column. An asterisk indicates that themore complex model fits the data significantly better (at least p < .05) than does the indicatedsimpler model.
H*J*
The excellent fit of Equation 1 replicates and quantifiesthe saccade length function obtained in earlier studies, aspreviously described.
Influence of group and view on detection. Experiment 1used four groups of participants, and each group saw theentire set of stimulus pictures twice. Crossing these twovariables, labeled group and view, yields eight conditions.To determine whether these variables influence detectionrate, Equation 1 was fit to the data from each of these
conditions separately, and the resulting 8 loss values weresummed. This is the equivalent to fitting a 16-parametermodel (i.e., 8 A and 8 K parameters) to the entire data set,with parameters varying with group and view variables. Incases where the value of A exceeded 1.0, a cap of 1.0 wasplaced on the value of that parameter in calculating the lossvalue. Thus, even when the intercept parameter was greaterthan 1.0, the model's prediction for the likelihood of detec-tion at any point was constrained to lie between 1.0 and 0.

570 McCONKffi AND CURRIE
This is equivalent to assuming that the observer's internalsignal for stimulus movement may exceed 1.0, but whenthis occurs the resulting response rate cannot exceed 100%.This constraint was used in all model-fitting in both Exper-iments 1 and 2. The total loss value for this 16-parametermodel, labeled Model A' in Table 1, was 611.365.
A chi-square test was used to test the null hypothesis thatModel A' fits the data no better than the original 2-param-eter Model A. Model A' was considered to be a "full"model, and Model A to be a reduced version of that modelin which certain parameters from the full model have beendropped. Under these conditions, the difference between theloss value of the full model—which will never be less thanthat of the reduced model—and the loss value for thereduced model is chi-square distributed with degrees offreedom being equal to the difference between the numberof parameters of the two models. This test, ^(14, N =1,339) = 16.754, p = .73, did not find the difference to bestatistically significant. The A parameters had a mean of0.844 and SD of 0.148; the K parameters, -0.622 and0.104. Thus, adding the 14 extra parameters failed to sig-nificantly improve the fit of the model to the data, indicatinga lack of evidence that the group and view variables andtheir interaction influenced the likelihood of detecting theshifts of the images. These variables are ignored in furtheranalyses.
The statistical test between the models described earlier,comparing full and reduced models, is referred to as areduced test model. It was described in detail because it isused throughout the remainder of this article to test pro-posed hypotheses.
Influence of shift size on detection. The experiment usedthree shift sizes: 0.3, 0.6, and 1.2°. Because of unequal cellsizes, a repeated measures, general linear model analysiswas used to test whether this variable influences detectionfrequency. A significant effect was obtained, F(2, 17) =3.97, p < .0004, and a post hoc test found that detectionrates for all three conditions were significantly different(11%, 28%, and 37% for the three conditions; Duncanmultiple-range test, df = 3, MSB = 0.0095). Thus, partici-pants are able to detect the shifts, and larger shifts are moredetectable.
A second test of the effect of shift size on detection wasconducted by using the reduced model test. The data werepartitioned into three sets corresponding to the three shiftsizes, and Equation 1 was fit to each separately. Thisyielded estimates of 6 parameters, an A and K parameter foreach shift size, shown as Model B in Table 1. The lossvalues were summed for the three conditions, yielding anoverall loss value of 571.971. Because Model A is a reducedversion of Model B, the reduced model test was again used,showing that the 6-parameter, full Model B fit the datasignificantly better than the reduced, 2-parameter Model A,/(4, N = 1,339) = 95.822, p < .001. This result confirmedthe fact that shift size affects the likelihood of detection.
The next test asked whether shift size actually affects onlyone of the two parameters being studied. It was hypothersized that increasing the shift size would elevate the func-tion, increasing the intercept parameter, A, without chang-
ing its shape, indexed by the slope parameter, K. To test thishypothesis, two additional models were fit to the data:Model C, in which parameter K was held constant, andModel D, in which parameter A was held constant, while, ineach case, letting the other parameter vary with shift size.The parameter estimates for these 4-parameter models areshown in Table 1. The loss value for constant slope ModelC was 573.346 and for constant intercept Model D, 577.980.Both models were significant improvements over Model A,^(2, AT = 1,339) = 83.324, p < .0001, j?(2, N = 1,339) =92.592, p < .0001. The 6-parameter Model B was a signif-icant improvement over the constant intercept Model D,tf(2, N = 1,339) = 12.018, p = .002, but did not differsignificantly from the constant slope Model C, x*(2, N =1,339) = 2.750, p = .25.
Because neither Model C nor Model D was a reducedversion of the other, there is not an appropriate means oftesting for a significant difference between them. However,because the constant slope Model C has a lower loss valuethan Model D and is not significantly different from the6-parameter Model B, it is accepted as equivalent to ModelB and becomes the basis for further work. In acceptingModel C, it is concluded that shift size affects the interceptof the saccade length function and not its slope. The fit ofModel C to the data from the three shift size conditions isshown in Figure 3, using the same sliding window methodthat was used for preparing Figure 2.
Within trial serial position effects on detection. In Ex-periment 1, the experimental pictures were each shiftedtwice during the 20-s viewing period, and these shifts couldoccur at different times during this period. This raises twoquestions. First, does the likelihood of detection changeacross the viewing period for a picture? Second, is there anydifference in the likelihood of detection of the first versusthe second picture shift?
s0>Q<*«O
>,
aaao
A Data (1.2 shift)— Fit:
f(s) = 1.194*ea Data (0.6° shift)— Fit:
f(s) = .894*e• Data (0.3° shift)
1 2 3 4 5 6 7
Saccade length (s)
Figure 3. Relation between saccade length, s, and proportion ofdetections of intrasaccadic shifts of the picture, f(s), for shifts ofdifferent distances. Each proportion and mean saccade length isbased on 100 cases (see text).

VISUAL STABILITY 571
Concerning the first question, researchers have often sug-gested that processing during the initial fixations on a pic-ture is different from that occurring later: During initial eyefixations the general, low spatial frequency characteristicsof the scene (global, holistic, or background features) areacquired, with greater detail being picked up during laterfixations (Buswell, 1935; Loftus, Nelson, & Kallman,1983). In addition, it is possible that, given the nature of therecognition task used, participants might attend carefully tothe picture during the first part of a viewing trial to store itscharacteristics (first viewing with the picture) or to deter-mine whether anything had changed (second viewing) andthen turn greater attention to the detection task during thelatter part.
Concerning the second issue, because an initial shift ofthe picture was always followed 7 saccades later with anopposite shift of equal length (here called a shift-back), theoccurrence of the first shift might prime sensitivity to thesecond. This could particularly occur if the internal responseto the first shift was not large enough to lead to detection butwas large enough to sensitize the observer to the shift-back.
To test the hypothesis that detectability is greater toshift-backs than to shifts, we partitioned the data accordingto three variables: shift size (3 conditions), shift versusshift-back (2 conditions), and serial position (6 positions:saccades 2, 9, 16, 23, 30, and 38). Crossing these variablesyields 36 conditions, but only 30 actually exist: No shift-backs could occur on the 2nd saccade, and all changes onthe 38th saccade were shift-backs. Equation 1 was sepa-rately fit to data from each of these conditions, and the lossvalues summed across conditions. With 2 parameters percondition, this effectively created a 60-parameter model,Model E, which yielded a loss value of 533.184. A reducedmodel, Model F, was then constructed by eliminating thedistinction between shift and shift-back, resulting in 18conditions (3 shift sizes by 6 serial positions). Equation 1was fit separately to the data of each of these conditions, andthe loss values summed for a total of 546.447 for this36-parameter model. The chi-square test failed to show asignificant difference between Models E and F, x*(24, N =1,339) = 26.526, p = .327. Thus, the hypothesis thatparticipants are more sensitive to shift-backs man to shifts isnot supported.
Turning next to the question of whether the likelihood ofdetecting a shift varies across the course of viewing apicture, the 36-parameter Model F was compared withModel B, the 6-parameter model that included only the shiftsize conditions and ignored serial position of the saccade onwhich the shift occurred. Thus, a test between Models B andF is a test of significance for serial position effects. This testyielded a significant difference, ^(30, N = 1,339) =51.048, p < .01, indicating the presence of serial positioneffects.
To test the hypothesis that this effect is due to processingdifferences during the initial fixations on a picture, a re-duced version of the 36-parameter Model F was produced inwhich data for all serial positions greater than the 2ndsaccade were collapsed into a single set for each shift size.This left only two values on the serial position factor, the
2nd saccade versus other saccades, which, when crossedwith shift size, resulted in a total of 6 conditions. Equation1 was fit separately to data from each of these conditionsand the summed loss value for this new model, Model G,with 12 parameters, was 560.536. Applying the reducedmodel test between the 36-parameter Model F and the12-parameter Model G found no significant difference,X*(2A, AT = 1,339) = 28.176, p = .253, nor does Model Gdiffer significantly from the 60-parameter Model E, ^(48,N = 1,339) = 54.702, p = .235. Thus, collapsing the dataacross all serial positions following the 2nd saccade did notdecrease the fit of the model significantly. On the otherhand, a test between Model B, which did not include serialposition effects, and Model G, which maintains the distinc-tion between 2nd and later saccades, did produce a signif-icant result, ;̂ (6, N = 1,339) = 95.506, p < .005. Thispattern of results indicates that the likelihood of detection isdifferent for shifts that occur during the 2nd saccade thanduring later saccades. The likelihood of detection is quitelow early in the viewing sequence. The A parameter esti-mates indicate the maximum level of detection for eachcondition: for the 0.3° condition, this reached only 5% forshifts occurring during the 2nd saccade in contrast to the47% on later saccades.
In conclusion, detection is low on the initial fixations ona picture, but no further change in detection rate occursacross the sequence of later fixations. Thus, there is noevidence for increased sensitivity on change-backs nor forgreater attention to the secondary task later in the viewingperiod for a picture.
Influence of relative shift direction. Previous investiga-tors report that relative shift direction, the direction of a shiftrelative to the direction of the saccade during which itoccurs, has no effect on the likelihood of detecting the shift.To determine whether a relation between these variablesexists in the data from Experiment 1, two indices werecreated concerning the angular distance between the direc-tion of a saccade and the direction of the shift that occurredduring that saccade. First, the value of the internal anglebetween the direction of the saccade and the direction thatthe picture moved during the saccade was calculated. Thisvalue, which ranges from 0° to 180°, served as the firstrelative shift direction index. The second relative shift di-rection index, ranging from 0° to 90°, was constructed bytaking the value of the complementary angle of any anglegreater than 90°. The first index would be related to detect-ability if it changes as the direction of image movementdeviates from shift direction over a full 180°; the secondindex, if detectibility changes as the shift direction deviatesfrom the line of saccade motion, ignoring direction, causingorthogonal motion to be either most or least detectable.
Because the A parameter was influenced by shift size, itwas hypothesized that this same parameter might also beaffected by relative shift direction. Therefore, Model B,which assumed a constant value for the K parameter acrossshift sizes, was expanded by writing A as a linear functionof relative shift direction, as shown in Equation 2:
f(rsd, s) = (A/ + A5 * rsd) * e(K"s}. (2)

572 McCONKffi AND CURRffi
In Equation 2, f(rsd, s) is the likelihood of detection, AI isa parameter indicating the intercept of the linear function,AS is the slope of the linear function, K is a parametercontrolling the rate of change with saccade length, rsd is therelative shift direction, and s is the saccade length.
The data from Experiment 1 were partitioned into threesets, based on the shift size (0.3, 0.6, and 1.2°). Equation 2was fit separately to each of these sets of data, using the180° relative shift direction index. Summing the resultingloss values yielded a total loss value of 541.103 for this9-parameter model, Model H. Estimated parameter valuesare given in Table 1. Because Model B is a reduced versionof Model H, including shift size differences but ignoringrelative shift direction, the reduced model test was applied,yielding a significant difference, ^(3, N = 1,339) =61.736, p < .005. Because the two models differ strictly interms of whether relative shift direction is included, thisresult supports the hypothesis that relative shift directionaffects shift detection. The parameter estimates in Table 1show that the AS parameter is negative, indicating thatdetection likelihood decreases as relative shift directionincreases; that is, with shift length and saccade directionheld constant, shifts in the same direction as the saccade aremore detectable than shifts in the opposite direction of thesaccade.
A second test was conducted to determine whether the90° relative saccade direction index is related to detectabil-ity. This was done in the same way as the application ofModel H, except that the 90° relative shift direction indexwas used as the rsd variable. This model, Model I, produceda loss value of 556.755, which was also significantly dif-ferent from Model B, ̂ (3, N = 1,330) = 30.432, p < .005.Notice, however, that the loss value produced by the 180°index was substantially lower than that produced by the 90°index. This observation leads to the conclusion that theeffect of relative shift direction is less related to the degreeof orthogonality of the shift from the line along which theeyes move than to the degree to which the shift directiondeviates from the actual direction of the saccade.
An attempt was made to further simplify Model H byholding different parameters constant across shift size.Holding K constant produced a 7-parameter model, ModelJ, with loss value of 543.159, which is not significantlydifferent from the 9-parameter Model H, ^(2, N =
1,339) = 4.112, p = .128, again indicating that the variablesare affecting the intercept rather than the slope of the basicsaccade length function. Holding the AS parameter constantas well produced a 5-parameter model, Model K, with lossvalue of 560.556, which is significantly different from the9-parameter Model H, x*(4, N = 1339) = 38.906, p < .005.Model K, with the AS parameter constant, is also signifi-cantly different from the 7-parameter Model J in which theA5 parameter varies with shift size, x*(2, N = 1,339) =34.794, p < .005. These findings confirm that relative shiftdirection affects the intercept parameter, A, rather than theslope, K, of the saccade length function.
Discussion
The goal of Experiment 1 was to determine whether thelikelihood of detecting intrasaccadic shifts of a naturalisticscene while examining it over time would show four char-acteristics observed with the detection of intrasaccadicshifts in much simpler displays. Only one of these charac-teristics was observed in the current data: the saccade lengthfunction (i.e., drop in the likelihood of detecting a shift assaccade length increases). In contrast, displacement thresh-old levels were much higher in our study, as can be seen inTable 2, which compares current detection rates from Ex-periment 1, as estimated from the appropriate models, withthose of previous studies having sufficiently overlappingconditions. Detection rates in our study were much lowerthan in previous studies that used very simple stimuli, butmore similar to those of Bridgeman, Hendry, and Stark(1975) who used the most complex stimulus pattern andrelatively free viewing. The constant detection-saccadelength ratio was not confirmed, as shown in Figure 4.Moreover, the current data did not show direction indepen-dence: Rather, detection rate varied with relative saccadedirection being greatest for shifts in the direction of thesaccade, which is opposite to the direction reported byMacknik et al. (1991). An interpretation for this result isgiven in the General Discussion.
In answer to the first question posed in the introduction ofthis article, it appears that findings from earlier studies withsimpler stimuli do not generalize very well to a morenaturalistic situation. Image shifts of sizes that can be de-
Table 2Between-Study Comparisons of Average Detection Rates (Detect) as a Function ofSaccade Length and Shift Size
Previous study Experiment 1
Study
Li & Matin (1990)Whipple & Wallach (1978)Li & Matin (1990)Mack (1970)Bridgeman, Hendry, & Stark (1975)
Saccadelength
4° -7°7°4° -7°3°3° -5°
Shiftsize
0.5°0.7°1.5°0.6°1.0°
SaccadeDetect length
60% 4° -7°80% 7°60% 4° -7°50% 3°0% 4°
Shiftsize
0.45°b
0.6°1.2°0.6°1.0°
Detect3
9%0%
12%15%12%
a These values are derived from the exponential functions in Figure 2.b This is an average of the 0.3° and 0.6° shift size condition.

VISUAL STABILITY 573
1.6
1.4
1.20)Nin£ 1.0'
0.8
0.6
0.4
0.2
O 30% detect rate• 20% detect rateV 10% detect rate
1 2 3 4 5
Saccade Length
Figure 4. Shift magnitudes that result in three constant detectionrates for three saccade lengths, as estimated from Model K. Ifdetection were a constant function of the ratio of shift magnitudeto saccade length, these curves would be linear.
tected under optimal conditions do not necessarily disruptprocessing to an extent that they are noticed during normalviewing of complex scenes. This raises doubts aboutwhether the earlier studies were investigating a fundamentalmechanism by which visual stability is achieved in all visualperception, as cancellation theory would suggest. Rather,the fact that different situations not only change the level ofdetection but even properties of the psychophysical func-tions themselves, is more consistent with theories that sug-gest that, although there is some basis for registering anintrasaccadic spatial displacement of the image, this doesnot necessarily disrupt ongoing processing; the degree towhich the displacement is detected varies with the task andstimulus conditions. This is consistent with the observationsof Matin et al. (1982) and Bridgeman and Graziano (1989)that the basis on which stimulus shifts are detected isdifferent under illuminated conditions and with more com-plex stimuli than for simple stimuli in the dark.
The second question posed in the introduction concernsthe functional stimulus region issue for detection of in-trasaccadic shifts: Is this detection based on a global assess-ment of stimulus position or direction, or only on some localinformation? This question cannot be addressed with datafrom Experiment 1 because local and global displacementproperties are entirely confounded: The size of the displace-ment of the picture as a whole is the same as the size of thedisplacement of every object within the picture. Thus, asecond experiment was conducted to investigate this secondissue.
Experiment 2
To investigate the functional stimulus region issue fordetecting stimulus shifts, and to test the target-object theory,
it is necessary to create an intrasaccadic stimulus manipu-lation in which there is no unidirectional shift of the entireimage, but the absolute position of objects in the region ofthe eyes' landing site varies. This was accomplished byexpanding or contracting the picture from its center duringselected saccades. With this manipulation, the image as awhole is not moved in any single direction, as it is whenshifted, but the local objects do move, with direction anddistance varying with position in the picture. There is littleor no spatial displacement of objects near the center of thepicture; magnitude of displacement increases with distancefrom the center, with direction of displacement determinedby the direction of the object from the picture center. Thus,a local displacement size metric, Ids, can be defined whichis the distance that the eyes land from the point in thepicture where they would have been had the image notchanged size.
Detection of a change in the size of a picture might occurin any of three ways. First, detection might be based strictlyon the local object displacements that result from changingthe size of the picture, rather than on the size change itself.This is called the displacement-only hypothesis. If this werethe case, the likelihood of detecting a change would varywith local displacement size and should be completelypredictable by a generalization of the type of model devel-oped for data in Experiment 1 with no additional effect ofthe magnitude of the size change. Second, it might actuallybe the size change itself that is detected, either perceiving achange in the size of the entire picture or some variable,such as total luminance, that varies with it, or perceiving achange in the size of local objects within the picture. This iscalled the size-only hypothesis. Because amount of changein size is constant across the picture, both locally andglobally (i.e., with a 10% increase the entire picture andevery part of it increase by 10%), the likelihood of detectinga change would not vary with local displacement size butonly with the magnitude of the size change itself. Third,detection might be based on some combination of these twotypes of information, which will be called the combinationhypothesis. In this case, detection should vary with localdisplacement size in a manner that could be captured withthe type of model developed for Experiment 1, but thismodel should require an additional parameter that varieswith size change, independent of eye position within thepicture. The goal of Experiment 2 was to determine whichof these three hypotheses best accounts for detection ofintrasaccadic changes in the size of a picture.
Method
The method used in Experiment 2 was identical to that inExperiment 1, with the data being acquired during the same pictureviewings by the same participants. A change in picture size wasimplemented by replacing the base picture, during one of thecritical saccades, with an alternative version of the same picturethat was either 10% or 20% larger or smaller, by volume, than thebase version. Seven saccades later, the base picture was returned tothe screen, producing a size change in the opposite direction ofabout the same amount. The base image was approximately 22° X

574 McCONKffi AND CURRffi
15° in size at the displayed distance, and the alternatives wereapproximately 24 X 17, 23 X 16, 21 X 14, and 20 X 13. The fiveversions were created by enlarging or shrinking the base image,using the Truevision ATVista TIPS imaging software packagev2.0. One change and change-back was scheduled on each exper-imental picture, but whether these occurred depended on the num-ber of saccades that were made. The four resulting size changeconditions were counterbalanced across picture, critical saccade,and picture sequence position in the same way as shift conditionswere in Experiment 1. Participants were not asked to determinewhat type of change occurred as they were viewing the picture butasked only to press their button if they detected a change of anytype.
Two additional variables were attached to each saccade. Thefirst, local displacement size (Ids) indicates the absolute distancebetween the point in the picture where the eyes would have beendirected had the picture size not changed, and the actual eyeposition. The second, relative displacement direction (rdd), indi-cates the angle in degrees, from 0 to 180, between the direction ofthe saccade and the direction of the local displacement.
Results
With 16 participants, 32 experimental pictures, 2 presen-tations of each picture and two image size changes sched-uled for each picture, there was a total of 2,048 changespossible; of these, good data, as defined in Experiment 1,were obtained from 1,543 changes, which were used in thefollowing analyses.
For each participant, the percentage of cases in which thedisplay change was detected was computed for each of 8conditions: the initial size change versus the change-back,and 4 different initial degrees of size change: large andsmall size increase, and large and small size decrease. Arepeated measures analysis of variance (ANOVA) on thesedata found a significant effect for size of change, F(3, 51) =19.67, p < .0002, but not for change versus change-backnor for any interaction. The detection rates for size changeconditions are presented in Table 3, together with meanvalues for saccade length, local displacement size (Ids), and
Table 3Likelihood of Detecting Changes in Picture Size (Detect),Together With Mean Local Displacement Size (Ids),Saccade Length (si), and Relative DisplacementDirection (rdd)
Picturechange
10% increaseMSD
10% decreaseMSD
20% increaseMSD
20% decreaseMSD
Ids
0.25°0.15°
0.24°0.14°
0.45°0.29°
0.49°0.34°
Average
si
3.00°2.78°
2.99°2.57°
3.03°2.91°
3.40°3.10°
values
rdd
60.77°52.26°
61.27°52.81°
68.07°55.17°
60.16°53.22°
Detect
.253
.238
.469
.431
relative displacement direction (rdd). As indicated earlier,the frequency of false alarms and late responses was verylow, around 1%. Detection rates when the picture size waschanged were much higher than these control conditionrates and differed significantly with condition, with largerchanges being associated with more frequent detection. Thedirection of the size change (expansion vs. contraction ofthe picture) had no effect on detection, a fact that wasreplicated in several attempts to include this variable inmodels that are reported later, thus, this variable is ignoredin further analyses.
To test among the three alternate hypotheses stated ear-lier, we developed a series of models and fit them to the datain a similar fashion to the exploration reported for Experi-ment 1. Parameter values are presented in Table 4. As a firststep, three models were developed. Model L assumed thatonly size change affected detection: A single parametervaried with size change (10% or 20% change), producing aloss value of 957. A chi-square test rejected this model as anadequate description of the data, ^(1541, N = 1,543) =1,914, p < .0005. Thus, a simple version of the size-onlyhypothesis is rejected.
To determine whether the length of the saccade affectsdetection of changes in the size of a picture, Model M wascreated. It was identical to Model A of Experiment 1, fittingEquation 1 to the data. The loss value was 698, which wasnot rejected by chi-square test, ^(1541, TV = 1,543) =1,396, p = .997. This result indicates that the detection of achange in the size of a picture, like the detection of a pictureshift, is greatly affected by the length of the saccade duringwhich the change occurred. Changes are more frequentlydetected when they occur during short saccades.
The third model uses the results of Model M to testwhether the magnitude of the size change has an effect onits detection, once the effect of saccade length is taken intoaccount. To do this, Model N was created by fitting Equa-tion 1 separately to the two size change conditions, produc-ing a 4-parameter model. The resulting loss value was654, which is a significant improvement over Model M,^(2, N = 1,543) = 88, p < .0001. This result indicates thatboth saccade length and the magnitude of the size changeaffect the likelihood of detecting the change.
Having established that the magnitude of the size changeaffects its detection, the issue addressed in the next set ofmodels concerns whether this is due directly to the detectionof the change in size itself, as represented by a morecomplex version of the size change hypothesis, which al-lows saccade length to also have an effect or is due to thelocal displacement of eye position that is produced by thesize change manipulation (local displacement hypothesis).The first step in this process was to develop Equation 3,which makes detection likelihood a function of both saccadelength and local displacement size (Ids):
f(lds, s) = (AI, + AS, * Ids) * e(**s). (3)
Because previous models have found that other variablesprimarily have their effect on the intercept of the detectionfunction, Equation 3 makes the intercept a linear function of

VISUAL STABILITY 575
Table 4Models Tested in Experiment 2
Model L:
Model M:
A parameters
Size change only
Base model fit to size change data
K SC No.parameters parameters parameters
SC°SC20
0.245 20.507
Loss Tests"
960
(Equation 1)A 1.030
Model N: Base model fit separately to two sizechange data sets (Equation 1)
A10 0.985A20 1.216
Model O: Make A a function of Ids (localdisplacement size) (Equation 3)
AI 0.880 A5 Ids 0.460Model P: Apply Model O to size change
conditions separately (Equation 3)AI10 0.907 AS ldsw 0.280A/20 1-106 ASlds20 0.143
Model Q: Base model plus size change(Equation 4)
A 1.034
Model R: Base model plus size change(Equation 5)
AI 0.928 AS Ids 0.347
Model S: Base model, Ids, rdd, & size change(Equation 5)
AI 0.922 AS Ids 0.302 AS rdd 0.0004
Model T: Base model, Ids, rdd, & size change20% only (Equation 5)
AI 0.941 AS Ids 0.284 AS rdd 0.0002
K -.542
-.733.474
K -0.547
Klo -0.727K20 -0.457
K
K
K
K
.837 SC10 0.023SC20 0.182
.828 SC10 0.0235C20 0.162
.837 SC10 0.024SC20 0.160
.687 SC10 Set to 0SC20 0.116
2
4
3
6
698
654 M*
682 M*
645 N*
636 M*
631 Q*
630 R
650 R*
Note, rdd = relative displacement direction.a Where a statistical test was performed between a model (as labeled in the first column) and a prior, simpler model, the simpler modelis indicated by label in this column. An asterisk indicates that the more complex model fits the data significantly better (at least p < .05)than does the indicated simpler model.
Ids.2 If the size of the local displacement is not having aneffect on detection, then Equation 3 should fit the data nobetter than Equation 1.
To test for an effect of Ids, we created two further models:Model O in which Equation 3 was applied to the total dataset, collapsed across size change, and Model P in whichEquation 3 was fit separately to data from the two sizechange conditions. Model O had a loss value of 682, andModel P, 645. The test of whether Equation 3, containingthe Ids variable, fits the data better than Equation 1, whichdoes not, was accomplished in two steps. First, Model Owas compared with Model M, and a significant differencewas obtained, ^(1, N = 1,543) = 32, p < .0001. Addingthe Ids parameter significantly improved the fit of themodel. Second, Model N and Model P were compared.Model N applies Equation 1 to the data from the two sizechanges separately, and Model P does the same for Equation3. Thus, this comparison tested the question of whether,after taking size change into account, adding the Ids param-eter still improves the fit of the model. A significant differ-ence was again found, ^(2, N = 1,543) = 88, p < .0001,with Model P fitting the data better. Thus, the local dis-placement size has an effect on detection likelihood, over
and above any effect of size change itself. This effectivelyrules out the size change-only hypothesis.
A choice between the local displacement-only hypothesisand the combination hypothesis can be made by examiningthe loss values of Models N and O. If the effect of sizechange on detection were entirely due to the local displace-ments that are produced, as the local displacement-onlyhypothesis assumes, then the fit of Model O should be atleast as good as that of Model N. Having the Ids parameterin Model O, which does not distinguish between size change
2 As an alternative to Equation 3, a model was also created inwhich K, rather than A, was written as a function of Ids. Thismodel yielded a loss value of 678.13, which is significantly betterthan that from Model M, ̂ (1, N = 1,543) = 39.04, p < .0001.This model fit the data slightly better than Model O. Because theseare not nested models, there is no good method of statisticallytesting whether they differ, but they are so close that it is unlikelythat the obtained difference is reliable. Because, in prior models,having variables affect the intercept parameter led to better fittingmodels, we chose to continue the analysis based on Equation 3,rather than on this alternative equation.

576 McCONKffi AND CURRffi
conditions, should allow it to fit the data at least as well asModel N, which takes size change into account directly buthas no Ids parameter. This prediction is not supported by thedata: The loss value for Model O is much higher than thatfor Model N, thus failing to support the local displacement-only hypothesis. Thus, size change is producing an effect ondetection likelihood beyond effects of saccade length andlocal displacement size.
If size change is producing an independent effect, thissuggests that a model in which the effect of size change isrepresented by a separate parameter should give a moreadequate description of the data. Equation 4 captures thisassumption by adding a size change parameter, Csc, toEquation 1, where the C parameter varies as a function ofsize change, sc.
f ( s , sc) = A * e(K*s) + Csc (4)
Model Q consists of fitting Equation 4 to the data fromExperiment 2, thus having 4 parameters, A, K, and twovalues of C, one for the 10% change and one for 20%change data. A and K are assumed not to vary with sizechange. The loss value for Model Q is 636, which issignificantly lower than that of Model M, ^(2, N =1,543) = 124, p < .0001. It is also much lower than the lossvalue for Model N, which has the same number of param-eters but which attempts to capture the difference betweensize change conditions by varying the A and K parameters.Thus, there is an effect of size change that is best repre-sented by a separate parameter.
Given that Model Q gives a more adequate representationof the effect of size change on detection, it is necessary todetermine whether local displacement size still affects de-tection. This was done by creating Equation 5, which makesthe intercept parameter A from Equation 4 a linear functionof Ids.
f ( s , sc, Ids) = (A/, + ASi * Ids) * e(K*s) + CK (5)
Model R consisted of fitting Equation 5 to the data, thusproducing a 5-parameter model, and yielding a loss value of631, which is a significant improvement over Model Q,X*(l,N= 1,543) = 10, p < .002. Thus, local displacementsize is still found to produce an effect on detection, furtherruling out the size change-only hypothesis. The fact thatcontrary evidence has been found for both the size change-only and local displacement-only hypotheses leads to theacceptance of the combination hypothesis: Both local dis-placement size and magnitude of size change are affectingdetection likelihood.
A further model tested whether relative displace direc-tion, rdd, produces an additional effect on detection, as itdid in Experiment 1. Model S was created by replacing theA/j parameter in Equation 5 with a linear function of rdd.This did not significantly improve the fit of the model, ascompared to Model R, loss value = 630, ^(1, N =1,543) = 0.8, p < .371. Thus, there is no evidence thatrelative displacement direction influences the frequency ofdetecting the picture size changes in Experiment 2.
In Equation 5, Model R, the estimates for parameters C10
and C20 directly indicate the size of the increment in detec-tion likelihood due to size change after the effects of sac-cade length and local displacement size are taken intoaccount. As Table 4 indicates, the estimates for these pa-rameters are 0.024 and 0.160. The size of the increment for10% size changes is very small, which raises the question ofwhether this is a statistically significant increment. Thisquestion was tested by modifying Model R to force theC10 = 0, producing Model T having 4 parameters. The lossvalue for Model T is 650, which is a significantly poorer fitthan that for Model R, x*(l,N= 1,543) = 39.8, p < .0001.This finding leads to the conclusion that even the 10% sizechange is being detected directly to some degree, beyonddetection based on local displacements.
Discussion
Experiment 2 was conducted to determine whether thedetection of intrasaccadic shifts of pictures, studied in Ex-periment 1, is based on local displacements of eye positionwithin the pictures. The results indicate that the size of thelocal displacement does provide a signal on which detectionof intrasaccadic change is based but that, in addition, changein picture size itself makes a unique contribution to thisdetection, as suggested by the combination hypothesis. Thisresult is evidence that at least part of the picture shiftdetection in Experiment 1 was based on local displacementsize rather than on a detection of the global displacement ofthe picture as a whole.
The finding that the size of the local displacement affectsdetection raises a final question concerning whether thiswas the only basis for shift detection in Experiment 1, orwhether detection was based both on this factor and somemore global perception of the displacement of the picture asa whole. To test for the detection of picture shifts based onglobal stimulus characteristics, a final pair of models wasdeveloped and fit simultaneously to data from Experiments1 and 2. The data consisted of a 6-tuple for each criticalsaccade in which the image was either shifted or changed insize. The 6-tuple consisted of (a) whether or not the changewas detected (the dependent variable); (b) the saccade size,s; (c) the local displacement size, Ids, which, in the case ofExperiment 1, consisted of the shift size; (d) the relativedisplacement direction, rdd, similar to relative shift direc-tion in Experiment 1; (e) the global shift size, gss, whichhad a value equal to the shift size for data from Experiment1 and a value of zero for data from Experiment 2; and (f) theglobal size change, sc, which had a value of the size changefor data from Experiment 2 and a value of zero for data fromExperiment 1. The first model, Model U, was constructedby combining Equations 2 and 3 to make the intercept anadditive function of both Ids and rdd and adding terms forglobal shift size and size change, as shown in Equation 6:
f(s, sc, Ids, rdd, gss)
= (A/ + ASL * Ids + ASR *rdd)* e(Kts) + Csc + Ggss. (6)
This model assumes that there is a common factor thatcontributes to detection likelihood in both experiments,

VISUAL STABILITY 577
namely, local displacement size and direction. In addition,there is a unique factor in Experiment 2, global size change,and another unique factor in Experiment 1, global shift size.With 2 size changes and 3 global shift sizes, Model U hasa total of 9 parameters. A reduced model, Model V, wasformed by deleting the G parameter. Testing the differencebetween the fit of these two models constitutes a test forwhether the size of picture shifts in Experiment 1 influenceddetection likelihood in a manner not captured by localdisplacement size. A significant difference between thesetwo models would serve as evidence that a global influenceof shift size is producing an effect on the likelihood ofdetecting the intrasaccadic changes, above and beyond thatresulting from the local displacements of the eyes' landingposition that results.
Loss values for Models U and V were 1,257 and 1,271,successively, which are significantly different, ^(3, N =3,033) = 28.4, p < .0001. This difference leads to theconclusion that the detection of shift size is not basedentirely on local displacement size, indicating the presenceof a more global effect as well. Estimated parameter valuesare presented in Table 5.
General Discussion
Two experiments were performed to study the phenom-enon of space constancy or visual stability, the tendency toperceive the world as stable even though its position isdisplaced on the retinae with every saccadic eye movement.The studies focused on two issues that arise from a reviewof current theories of visual stability: whether results fromearlier studies, involving the detection of intrasaccadicshifts of simple stimuli in the dark, generalize to a morenaturalistic stimulus and task and whether shifts in thestimuli are detected on the basis of local information in theregion of the saccade's landing position, or on the basis ofmore global information about the position of the image asa whole. A visual world was created with naturalistic,
full-color images on a computer screen, in which the pic-tures being examined occasionally changed position (shift-ed) or changed size during saccades as the observers wereexamining the pictures either to remember them or to de-termine whether they were the same as in an earlier viewing.The observers indicated when they detected a change, thusnoting a violation of visual stability. Experiment 1 investi-gated the issue of generalizability of results. Of the fourprimary results from earlier research, only one, the tendencyfor detection to drop as saccade length increases, was rep-licated here. The other three results did not generalize: (a)Displacement thresholds were much higher in the natural-istic situation than in earlier studies, (b) there was not aconstant ratio between detection likelihood and saccadelength as saccade length varied, and (c) it was not true thatthe shift direction, relative to the saccade direction, had noeffect. Rather, shifts that went in the direction of the saccadewere detected more frequently than shifts in the oppositedirection, though this result was not replicated with thesmaller local shifts in Experiment 2. Thus, it is concludedthat detection frequency and its relationship to other vari-ables is not constant across stimulus and task conditions.
Experiment 2 addressed the issue of whether the detectionof image shifts is based on local versus more global infor-mation. The results indicate that detection of intrasaccadicchanges in the size of pictures is a function of the localdisplacement size, or how far the eyes land from the picturelocation where they would normally have landed had thechange not occurred. This is taken as evidence for detectionbased to a large extent on local information, namely, wherethe eyes land with respect to their target. Evidence was alsofound for the direct detection of size change, although thestudy did not permit distinguishing whether this was basedon local information, such as the change in size of, or indistance between, objects in the region of the eyes' landingposition, or global information, the overall change in size ofthe picture.
In a final attempt to simultaneously model data from both
Table 5Models Involving Data from Both Experiments 1 and 2
A parameter
Intercept SlopeK
parameter
Global parametersNo.
parameters Loss Tests3
Model U, including global parameters for size change (Q and shift size (G) (Equation 6)
AI 0.951 AS Ids 0.423AS rdd -0.002
-0.799 .033.192
G0.3G0.6G 1.2
.005
.013
.083
1,257
Model V, including global parameters for C but not G (Equation 6)
AI 0.880 AS MsAS rdd
0.526 -0.799-0.002
.026
.1631,271 U*
Note. Ids = local displacement size; rdd = relative displacement direction.a Where a statistical test was performed between a model (as labeled in the first column) and a prior,simpler model, the simpler model is indicated by label in this column. An asterisk indicates that themore complex model fits the data significantly better (at least p < .05) than does the indicatedsimpler model.

578 McCONKIE AND CURRIE
experiments, the model did not account for all of the effectof shift size on detection observed in Experiment 1. Thisindicates either an inadequacy in the model or that somefactor other than local displacement size also contributes tothe detection of the shifts in that experiment. These possi-bilities require further investigation.
These observations have implications for each of the fourtypes of theories of visual stability outlined in the introduc-tion. The fact that observers detect intrasaccadic shifts inpictures, even when this is not their primary task, once againargues against Gibson's (1966) account of visual stability asbeing the result of properties of the proximal stimulus alone:rigid, discrete retinal displacements during periods of sac-cadic suppression. The image shifts used in Experiment 1largely met that criterion yet were detected about as well asthe size changes occurring in Experiment 2, which did not.One qualification on this conclusion results from the factthat, although the pictures appeared on a large, dark surfaceand in semi-darkness, there were two aspects of the visualfield that did not shift when a picture shifted, thus resultingin a lack of a completely rigid transformation from fixationto fixation: dim patterns in the far periphery, and part of theeyetracking equipment itself which was visible. Still, thefact that other investigators, working in complete darkness,have found intrasaccadic stimulus shifts that constitute rigidtransformations to be detected argues against a strictly stim-ulus-based explanation of visual stability.
Our results are compatible with other recent observationsthat the perception of stability is different with complexstimulus patterns than with simple patterns in the dark(Bridgeman & Graziano, 1989). This suggests that themechanism postulated by cancellation theory, and studied inmany earlier experiments, is either not fundamental to themaintenance of visual stability in normal viewing, or thatthe signal produced by across-saccadic image misalignmentplays a decreasing role in vision as image complexity in-creases. In this study, it can be further argued that the signalproduced by misalignment is less likely to be noticed whenits detection is not the observer's primary task, thus ac-counting for the low detection levels relative to those foundin previous experiments. However, taking this positionraises serious questions about how fundamental the cancel-lation process really is in maintaining visual stability: Ap-parently, normal perceptual processing can proceedsmoothly in the face of stimulus displacements that aremuch larger than those that can be detected with simplestimuli in the dark.
Finally, our results indicate a need for cancellation theoryto be revised to give priority to the alignment of localinformation in the region of the eyes' landing positionfollowing a saccade.
Postulating a process that does not cancel out discrepan-cies between the retinal locations of the stimulus patternbetween fixations but, rather, that provides a signal con-cerning the extent to which the image on one fixation is atthe location where it would be expected, given the inter-vening saccade, leads naturally to the third type of theory.MacKay's (1973) "cognitive approach," and Bridgeman etal.'s (1994) "taking-into-account" theory, suggest that var-
ious types of information are evaluated in determiningwhether a change has occurred in the stimulus. Unlessevidence is present suggesting otherwise, the visual systemassumes that the world has remained stable from one fixa-tion to the next. This type of theory seems to accommodatethe results from Experiments 1 and 2 most easily becausethe information examined and the nature of the tests madecould vary with stimulus and task characteristics. Thus,differences in detection frequency and psychophysical func-tions across tasks are to be expected, and greater consider-ation could be given to information near the eyes' landingposition than to the global stimulus pattern. The primaryproblem with this type of theory is that it lacks specificity;the nature of the mechanism that takes information intoaccount, the nature of the information used, and the rules ofoperation have not yet been specified sufficiently well topermit strong tests of the approach. In particular, it is notclear what the information and mechanism might be thatdetects intrasaccadic shifts of pictures. In this case, theinterpretation given to the picture, the objects contained init, and the spatial relations among them, remain invariant,thus providing no indication of stimulus change. The onlything that is changed is the spatial relation between theobserver and the stimulus. Thus, Bridgeman et al. (1994)proposed that, on each fixation, a calculation is made con-cerning the "direction of the world." This vector can becompared from fixation to fixation, and a discrepancy indirection is detected if it is sufficiently large.
Irwin, McConkie, Carlson-Radvansky, and Currie (1994)have criticized Bridgeman et al.'s explanation of detectingstimulus shifts by pointing out that the world, in fact, has nodirection; only objects or regions have direction with re-spect to the observer. Furthermore, each object or region hasa different direction. This raises the question of whether thevisual system calculates a direction for each, or for a subsetof, objects or regions and then detects shifts on the basis ofchanges in all or some of these directions. In particular, thefinding that local discrepancies in landing positions predictshift detection suggests that the direction of the object towhich the eyes are being sent may play a key role indetecting stimulus shifts.
Closely related to the above interpretation of taking-into-account theory is the fourth type of theory discussed earlier,the saccade target theory, which postulates that a shift of thestimulus is detected on the basis of the postsaccadic retinallocation of the object to which the eyes are sent. This theoryappears to overcome the limitations of the Bridgeman et al.proposal and to be quite compatible with many of ourresults. Because this type of mechanism has only beenalluded to indirectly in previous literature (Bridgeman &Stark, 1979), an elaboration of it is attempted here. It isreferred to as the saccade target theory of visual stability(Irwin et al., 1994).3
3 The Saccade Target Theory of Visual Stability was first pre-sented by George W. McConkie at the 6th European Conferenceon Eye Movements, Leuven, Belgium, in September 1991, in apaper entitled "Perceiving a Stable Visual World."

VISUAL STABILITY 579
The proposed theory makes the following basic assump-tions:
Assumption 1: The visual system assumes that the worldremains consistent during the period of a saccade (Bridge-man et al., 1994; MacKay, 1973). This assumption is ac-cepted unless there is disconfirmatory evidence. Of course,a key issue concerns the nature of such evidence and how itbecomes available.
Assumption 2: There is no carry-over of the retinal imagefrom the end of one eye fixation to the beginning of the next(Irwin, 1991; O'Regan, 1992; Pollatsek & Rayner, 1992).Hence, there is no integration of successive images, asBreitmeyer et al. (1982) and others have assumed. The onlyinformation that survives a saccade is that which has beenspecifically selected for encoding and storage in a moreabstract form. From an evolutionary perspective, there is noneed for an organism to have a memory for the full com-plexity of the visual stimulus because the full set of infor-mation is contained within the world itself and is continu-ously projected to the retina of the observer whose eyes areopen (O'Regan, 1992).
Assumption 3: There exists a mental representation ofselected information from the scene being viewed, whichincludes information about the properties and locations ofobjects and regions within the scene that have been previ-ously attended as well as more global information about thenature, structure, and characteristics of the scene as a whole.The nature of this representation is, of course, much indispute.
Assumption 4: The early visual processes parse a com-plex stimulus configuration into a hierarchical structure ofregions, together with their features or properties, that arereferred to as an object hierarchy (Palmer, 1977).
Assumption 5: On each eye fixation, a mapping Junctionis established between the stimulus configuration providedby the retina and the mental representation. This mappingfunction makes it possible, from any region in either ofthese two spaces, to locate the corresponding region in theother, on request.
Assumption 6: Each saccade is normally an attempt todirect the eyes toward some selected entity in the retinallyprovided stimulus structure, thus bringing it onto a part ofthe fovea that provides higher spatial resolution. The se-lected entity will be referred to as the target object.
With these basic assumptions about visual perception, wenow propose a mechanism by which stimulus displacementsmay be detected.
Step 1: During each eye fixation, a target object (seeAssumption 6) is selected from the retinally provided objecthierarchy as the goal of the following saccade. Although theprocess by which this selection is made is of great interest,it will not be dealt with further at this time.
Step 2: The location of the saccade target in the mentalrepresentation is noted.
Step 3: Certain features or information about the targetobject are selected and stored to facilitate its identificationat the onset of the following fixation. This is referred to asthe locating information. The nature of the locating infor-mation, and whether it varies by task, stimulus, or eccen-
tricity of the saccade target, are issues that require furtherresearch.
Step 4: A saccade is initiated to bring the target objectinto central vision. The accuracy of the saccade can becompromised by various influences such as the global effect(Findlay, 1982), range effect (Kapoula, 1985), and percep-tual inaccuracy (Coeff6 & O'Regan, 1987).
Step 5: As new visual information begins to becomeavailable following the saccade, a fast, probably parallel,search is made in an attempt to find the locating informationthat indicates the retinal location of the saccade target. Thisscan is made within a limited region, referred to as thesaccade target-search region, probably determined by pastexperience with the distribution of retinal locations of sac-cade targets. We refer to this as the saccade target-locatingprocess.
Step 6: When the saccade target is located in the stimulusarray, the relationship between its retinal location and thepreviously noted location (see Step 2) in the mental repre-sentation is identified. This gives rise to a bidirectionalmapping function between these two spaces. Given a loca-tion in either space, the approximate corresponding locationin the other space is specified. Thus, this function is thebasis for identifying the appropriate location in the mentalrepresentation for information obtained from a stimulusobject or region and for identifying where in the retinallyprovided stimulus array attention should be directed toobtain further information about some object or regionalready included in the mental representation.
Step 7: Having established the mapping relationship be-tween retinal space and the mental representation, normalperceptual activity (i.e., acquiring and using visually pro-vided information for the task at hand) is able to proceednormally during that fixation.
By the saccade target theory, the sense of a stable visualworld occurs when the locating process is successful, that is,when, at the onset of each fixation, the saccade target isfound within the initial search region. It is postulated that afailure of the saccade target locating process is evidence forinstability in the stimulus array, contradicting the assump-tion of a stable visual world. When the image is shiftedduring a saccade, this increases the likelihood that thesaccade target will not lie within the search region, thusincreasing the likelihood that the locating process will notsucceed. When the locating process initially fails, a widersearch must be initiated in an attempt to find the target.Normal perception proceeds only when the target is found,or it is concluded that it no longer exists and processingmust continue on some other basis.
The saccade target theory provides explanations for sev-eral of the observations from Experiments 1 and 2. First, theconclusion that image shifts are detected on the basis oflocal information is consistent with this theory, which de-pends specifically on the saccade target-locating process tomaintain visual stability, rather than on any sort of globalimage integration across saccades. Second, larger imageshifts are more likely to be detected because they are morelikely to move the saccade target out of the search area forthe following fixation. Third, image shift detection drops
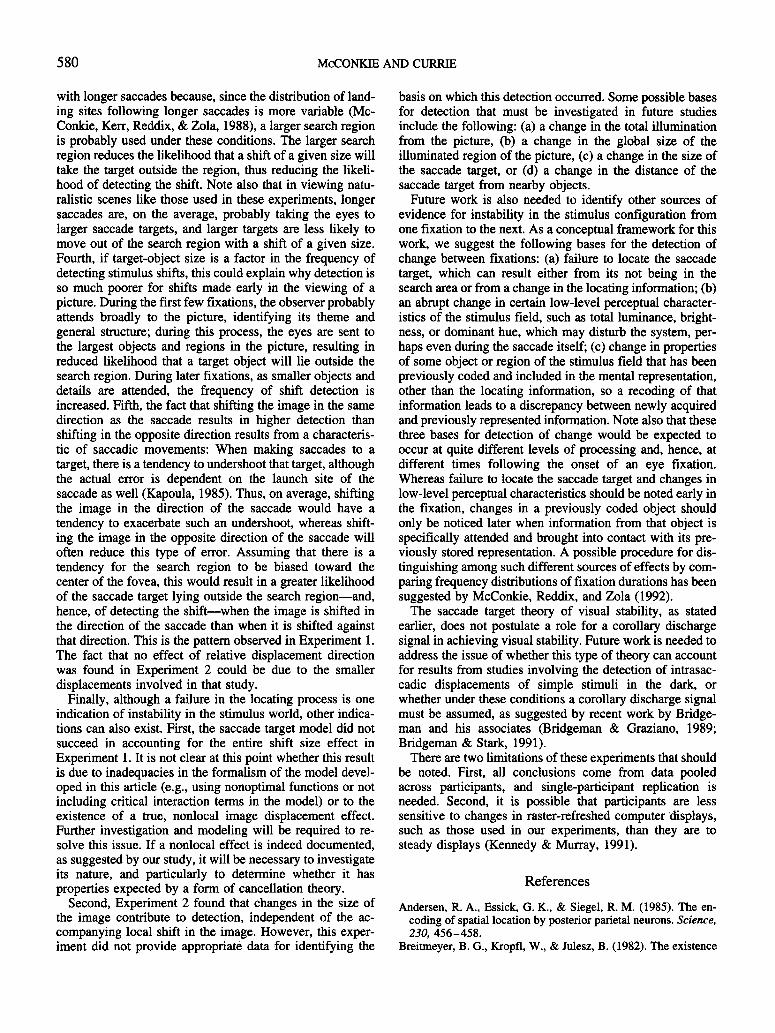
580 McCONKffi AND CURRIE
with longer saccades because, since the distribution of land-ing sites following longer saccades is more variable (Mc-Conkie, Kerr, Reddix, & Zola, 1988), a larger search regionis probably used under these conditions. The larger searchregion reduces the likelihood that a shift of a given size willtake the target outside the region, thus reducing the likeli-hood of detecting the shift. Note also that in viewing natu-ralistic scenes like those used in these experiments, longersaccades are, on the average, probably taking the eyes tolarger saccade targets, and larger targets are less likely tomove out of the search region with a shift of a given size.Fourth, if target-object size is a factor in the frequency ofdetecting stimulus shifts, this could explain why detection isso much poorer for shifts made early in the viewing of apicture. During the first few fixations, the observer probablyattends broadly to the picture, identifying its theme andgeneral structure; during this process, the eyes are sent tothe largest objects and regions in the picture, resulting hireduced likelihood that a target object will lie outside thesearch region. During later fixations, as smaller objects anddetails are attended, the frequency of shift detection isincreased. Fifth, the fact that shifting the image in the samedirection as the saccade results in higher detection thanshifting in the opposite direction results from a characteris-tic of saccadic movements: When making saccades to atarget, there is a tendency to undershoot that target, althoughthe actual error is dependent on the launch site of thesaccade as well (Kapoula, 1985). Thus, on average, shiftingthe image in the direction of the saccade would have atendency to exacerbate such an undershoot, whereas shift-ing the image in the opposite direction of the saccade willoften reduce this type of error. Assuming that there is atendency for the search region to be biased toward thecenter of the fovea, this would result in a greater likelihoodof the saccade target lying outside the search region—and,hence, of detecting the shift—when the image is shifted inthe direction of the saccade than when it is shifted againstthat direction. This is the pattern observed in Experiment 1.The fact that no effect of relative displacement directionwas found in Experiment 2 could be due to the smallerdisplacements involved in that study.
Finally, although a failure in the locating process is oneindication of instability in the stimulus world, other indica-tions can also exist. First, the saccade target model did notsucceed in accounting for the entire shift size effect inExperiment 1. It is not clear at this point whether this resultis due to inadequacies in the formalism of the model devel-oped in this article (e.g., using nonoptimal functions or notincluding critical interaction terms in the model) or to theexistence of a true, nonlocal image displacement effect.Further investigation and modeling will be required to re-solve this issue. If a nonlocal effect is indeed documented,as suggested by our study, it will be necessary to investigateits nature, and particularly to determine whether it hasproperties expected by a form of cancellation theory.
Second, Experiment 2 found that changes in the size ofthe image contribute to detection, independent of the ac-companying local shift in the image. However, this exper-iment did not provide appropriate data for identifying the
basis on which this detection occurred. Some possible basesfor detection that must be investigated in future studiesinclude the following: (a) a change in the total illuminationfrom the picture, (b) a change in the global size of theilluminated region of the picture, (c) a change in the size ofthe saccade target, or (d) a change in the distance of thesaccade target from nearby objects.
Future work is also needed to identify other sources ofevidence for instability in the stimulus configuration fromone fixation to the next. As a conceptual framework for thiswork, we suggest the following bases for the detection ofchange between fixations: (a) failure to locate the saccadetarget, which can result either from its not being in thesearch area or from a change in the locating information; (b)an abrupt change in certain low-level perceptual character-istics of the stimulus field, such as total luminance, bright-ness, or dominant hue, which may disturb the system, per-haps even during the saccade itself; (c) change in propertiesof some object or region of the stimulus field that has beenpreviously coded and included in the mental representation,other than the locating information, so a receding of thatinformation leads to a discrepancy between newly acquiredand previously represented information. Note also that thesethree bases for detection of change would be expected tooccur at quite different levels of processing and, hence, atdifferent times following the onset of an eye fixation.Whereas failure to locate the saccade target and changes inlow-level perceptual characteristics should be noted early inthe fixation, changes in a previously coded object shouldonly be noticed later when information from that object isspecifically attended and brought into contact with its pre-viously stored representation. A possible procedure for dis-tinguishing among such different sources of effects by com-paring frequency distributions of fixation durations has beensuggested by McConkie, Reddix, and Zola (1992).
The saccade target theory of visual stability, as statedearlier, does not postulate a role for a corollary dischargesignal in achieving visual stability. Future work is needed toaddress the issue of whether this type of theory can accountfor results from studies involving the detection of intrasac-cadic displacements of simple stimuli in the dark, orwhether under these conditions a corollary discharge signalmust be assumed, as suggested by recent work by Bridge-man and his associates (Bridgeman & Graziano, 1989;Bridgeman & Stark, 1991).
There are two limitations of these experiments that shouldbe noted. First, all conclusions come from data pooledacross participants, and single-participant replication isneeded. Second, it is possible that participants are lesssensitive to changes in raster-refreshed computer displays,such as those used in our experiments, than they are tosteady displays (Kennedy & Murray, 1991).
References
Andersen, R. A., Essick, G. K., & Siegel, R. M. (1985). The en-coding of spatial location by posterior parietal neurons. Science,230, 456-458.
Breitmeyer, B. G., Kropfl, W., & Julesz, B. (1982). The existence

VISUAL STABILITY 581
and role of retinotopic and spatiotopic forms of visual persis-tence. Acta Psychologies 52, 175-196.
Bridgeman, B. (1981). Cognitive factors in subjective stabilizationof the visual world. Acta Psychologies 48, 111—121.
Bridgeman, B., & Graziano, J. A. (1989). Effect of context andefference copy on visual straight ahead. Vision Research, 29,1729-1736.
Bridgeman, B., Hendry, D., & Stark, L. (1975). Failure to detectdisplacements of the visual world during saccadic eye move-ments. Vision Research, 15, 719-722.
Bridgeman, B., & Stark, L. (1979). Omnidirectional increase inthreshold for image shifts during saccadic eye movements. Per-ception and Psychophysics, 25, 241-243.
Bridgeman, B., & Stark, L. (1991). Ocular proprioception andefference copy in registering visual direction. Vision Research,31, 1903-1913.
Bridgeman, B., van der Heijden, A., & Velichkovsky, B. (1994). Atheory of visual stability across saccadic eye movements. Be-havioral and Brain Sciences, 17, 247-292.
Buswell, G. (1935). How people look at pictures. Chicago: Uni-versity of Chicago Press.
Coeffe", C., & O'Regan, J. K. (1987). Reducing the influence ofnontarget stimuli on saccade accuracy: Predictability and latencyeffects. Vision Research, 27, 227-240.
Duhamel, J.-R., Colby, C. L., & Goldberg, M. E. (1992). Theupdating of the representation of visual space in parietal cortexby intended eye movements. Science, 255, 90-92.
Findlay, J. M. (1982). Global visual processing for saccadic eyemovements. Vision Research, 22, 1033-1045.
Gibson, J. J. (1966). The senses considered as perceptual systems.Boston: Houghton Mifflin.
Helmholtz, H., von. (1963). Hanbuch der Physiologischen Optik[Handbook of physiological optics]. In J. P. C. Southall (Ed. 2ndTrans.). Helmholtz's treatise on physiological optics (Vol. 3, pp.247-270). New York: Dover. (Original published 1866; Englishtranslation originally published 1925)
Irwin, D. E. (1991). Information integration across saccadic eyemovements. Cognitive Psychology, 23, 420-456.
Irwin, D. E. (1992). Perceiving an integrated visual world. In D. E.Meyer & S. Kornblum (Eds.), Attention and performance XIV:Synergies in experimental psychology (pp. 121-142). Cam-bridge, MA: MIT Press.
Irwin, D. E. (1994). On the measurement of phosphor persistencein oscilloscopic displays. Vision Research, 34, 1623.
Irwin, D. E., McConkie, G. W., Carlson-Radvansky, L., & Currie,C. (1994). A localist evaluation solution for visual stabilityacross saccades. Behavioral and Brain Sciences, 17, 265-266.
Kapoula, Z. (1985). Evidence for a range effect in the saccadicsystem. Vision Research, 25, 1155-1157.
Kennedy, A., & Murray, W. S. (1991). The effects of flicker oneye movement control. Quarterly Journal of Experimental Psy-chology, 43A, 79-99.
Li, W., & Matin, L. (1990). The influence of saccade length on thesaccadic suppression of displacement detection. Perception andPsychophyics, 48, 453-458.
Loftus, G. R., Nelson, W. W., & Kallman, H. J. (1983). Differen-tial acquisition rates for different types of information frompictures. Quarterly Journal of Experimental Psychology, 35A,187-198.
Mack, A. (1970). An investigation of the relationship between eyeand retinal image movement in the perception of movement.Perception and Psychophyics, 8, 379-384.
MacKay, D. M. (1973). Visual stability and voluntary eye move-ments. In R. Jung (Ed.), Handbook of sensory physiology (Vol.8, pp. 307-331). Berlin: Springer-Verlag.
Macknik, S. L., Fisher, B. D., & Bridgeman, B. (1991). Flickerdistorts visual space constancy. Vision Research, 31, 2057-2064.
Matin, L. (1986). Visual localization and eye movements. In K. R.Boff, L. Kaufman, & J. P. Thomas (Eds.), Handbook of percep-tion and human performance (Vol. 1, pp. 20.1-20.45). NewYork: Wiley.
Matin, L., Picoult, E., Stevens, J., Edwards, M., & MacArthur, R.(1982). Oculoparalytic illusion: Visual-field dependent spatialmislocations by humans partially paralyzed with curare. Science,216, 198-201.
McConkie, G. W., Kerr, P. W., Reddix, M. D., & Zola, D. (1988).Eye movement control during reading: I. The location of initialeye fixations on words. Vision Research, 28, 1107-1118.
McConkie, G. W., Reddix, M. D., & Zola, D. (1992). Perceptionand cognition: Where is the meeting point? In K. Rayner (Ed.),Eye movements and visual cognition: Scene perception andreading (pp. 293-303). New York: Springer-Verlag.
O'Regan, J. K. (1992). Solving the "real" mysteries of visualperception: The world as an outside memory. Canadian Journalof Psychology, 46, 461-480.
Palmer, S. E. (1977). Hierarchical structure in perceptual repre-sentation. Cognitive Psychology, 9, 441-474.
Pollatsek, A., & Rayner, K. (1992). What is integrated acrossfixations? In K. Rayner (Ed.), Eye movements and visual cog-nition: Scene perception and reading (pp. 161-191). New York:Springer-Verlag.
Skavenski, A. (1990). Eye movements and visual localization ofobjects in space. In E. Kowler (Ed.), Eye movements and theirrole in visual and cognitive processes (pp. 263-287). New York:Elsevier Science.
Stark, L., & Bridgeman, B. (1983). Role of corollary discharge inspace constancy. Perception and Psychophyics, 34, 371-380.
Stark, L., Kong, R., Schwartz, S., Hendry, D., & Bridgeman, B.(1976). Saccadic suppression of image displacement. VisionResearch, 16, 1185-1187.
Volkman, P., Schick, A., & Riggs, L. (1968). Time course ofvisual inhibition during voluntary saccades. Journal of the Op-tical Society of America, 58, 1310-1414.
von Hoist, E., & Mittelstaedt, H. (1971). The principle of reaffer-ence: Interactions between the central nervous system and pe-ripheral organs. In P. C. Dodwell (Ed.), Perceptual processing:Stimulus equivalence and pattern recognition (pp. 41-72). NewYork: Appleton. (Original work published 1950)
Whipple, W. R., & Wallach, H. (1978). Direction-specific motionthresholds for abnormal image shifts during saccadic eye move-ments. Perception & Psychophysics, 24, 1349-1355.
Wilkinson, L. (1989). SYSTAT: The System for Statistics.Evanston, IL: SYSTAT.
Zipser, D., & Andersen, R. A. (1988). A back-propagation pro-grammed network that stimulates response properties of a subsetof posterior parietal neurons. Nature, 331, 679-684.
Received May 31, 1994Revision received October 25, 1994
Accepted March 24, 1995 •