mba project on capital budgeting
TRANSCRIPT

INTRODUCTION

CAPITAL BUDGEING:
An efficient allocation of capital is the most important finance function
in modern times. It involves decisions to commit firm’s funds to long-term
assets. Such decisions are tend to determine the value of company/firm by
influencing its growth, profitability & risk.
Investment decisions are generally known as capital budgeting or
capital expenditure decisions. It is clever decisions to invest current in long
term assets expecting long-term benefits firm’s investment decisions would
generally include expansion, acquisition, modernization and replacement of
long-term assets.
Such decisions can be investment decisions, financing decisions or
operating decisions. Investment decisions deal with investment of
organization’s resources in Long tern (fixed) Assets and / or Short term
(Current) Assets. Decisions pertaining to investment in Short term Assets fall
under “Working Capital Management”. Decisions pertaining to investment in
Long term Assets are classified as “Capital Budgeting” decisions.
Capital budgeting decisions are related to allocation of investible funds to
different long-term assets. They have long-term implications and affect the
future growth and profitability of the firm.
In evaluating such investment proposals, it is important to carefully consider
the expected benefits of investment against the expenses associated with it.
Organizations are frequently faced with Capital Budgeting decisions. Any
decision that requires the use of resources is a capital budgeting decisions.

Capital budgeting is more or less a continuous process in any growing
concern.
NEED FOR THE STUDY
The Project study is undertaken to analyze and understand the
Capital Budgeting process in cement manufacturing sector,
which gives mean exposure to practical implication of theory
knowledge.
To know about the company’s operation of using various Capital
Budgeting techniques.
To know how the company gets funds from various resources.
OBJECTIVES OF THE STUDY
To study the relevance of capital budgeting in evaluating the project for project finance
To study the technique of capital budgeting for decision- making.
To measure the present value of rupee invested.
To understand an item wise study of the company financial performance of the company.
To make suggestion if any for improving the financial position if the
company.
To understand the practical usage of capital budgeting techniques
To understand the nature of risk and uncertainty

METHODOLOGY
To achieve aforesaid objective the following methodology has
been adopted. The information for this report has been collected through
the primary and secondary sources.
Primary sources It is also called as first handed information; the data is collected
through the observation in the organization and interview with officials. By
asking question with the accounts and other persons in the financial
department. A part from these some information is collected through the
seminars, which were held by KESORAM
Secondary sources
The secondary data have been collected through the various
books, magazines, brouchers & websites
LIMITATION OF THE STUDY :
Lack of time is another limiting factor, ie., the schedule period of 8
weeks are not sufficient to make the study independently regarding
Capital Budgeting in KESORAM.
The busy schedule of the officials in the KESORAMis another limiting
factor. Due to the busy schedule officials restricted me to collect the
complete information about organization.
Non-availability of confidential financial data.
The study is conducted in a short period, which was not detailed in all
aspects.
All the techniques of capital budgeting are not used in KESORAM.
Therefore it was possible to explain only few methods of capital
budgeting.

INDUSTRY PROFILE

INTRODUCTION OF CEMENT:
The basic need of human being is food clothing and shelter love and
affection /possession is on never ending process for a human being.
As the time passes on human beings their wants and wishes also
changed from ancient times to modern times and among them the living
pattern and costruction works also have been changed from temporary
construction of house to permanent construction and the basic material used
in construction is “Cement”.
Cement the word derived from a latin word ‘CEMENTTUM’ means stone
chipping such as we used in roman.
Cement the word as per oxford, it is commonly used is any substance
applied for soft stocking things. But cement means is most vital and
important material for modern constructions. It is a material which sets and
hardness when mixed with water. Cement is basically used in construction
as a building agent. In ancient times clay bricks and stones have been used
for construction works.
The Romans were using a binding or a cementing material that would
harden and water. The first systematic effort was made by “SMEATON” who
undertook the execution of a new light house in 1756. He observed that
production obtained by during lime stone was the best cementing material
for work under water.

The construction in lost centuries was with Lime that was the main
equipment used for construction work. The ancient constructions like
Tajmahal, Qutubminar, Mysore Palace, Red fort, Charminar etc., the evidence
of lime construction.
THE INDIAN CEMENT INDUSTRY:
By staring priduction in 1914 the story of India cement industry is a
stage of continuous of growth.
India is the fourth largest cement producer after China, Japan and
U.S.A. so far annual production and demand has been growing a pace at
roughly 68 million tons with an installed capacity of 82 millions tons.
In 1914 as the foundation of stable cement Industry was laid as sun
above. It was Indian Cement Company at Porbandar in Gujarat. In 1920, the
cement marketing corporation was formed to promote the sale and
distribution of cement. A significant development was made in 1930 when all
manufacturers mergers together to form the Associated Cement Company
Limited.
Cement Industry is the major Industry it has taken rapid strides for a
modest beginning at porbandar in 1914 to the 1980’s with over
understanding out of the 60 units, 14 units are in the public sectors
remaining units are in private sector.
Indian endowed with cement grade lime stones (90 Billion tons ) and
coal (190 Billion tons ). The basic raw material required for cement
manufacture and self sufficient in manufacturing cement making
machineries. During nineties it had a particular impressive expansion with a
growth rate of 10%.

The strength and vitality of cement Industry can be gouged by the
intrest shown and support given by World Bank, considering the excellent
performance of the industry in utilizing loans and achieving the objectives
and targets. The World Bank is examine the feasibility of providing a third
line of credit for further upgrading Industry in varying areas, which will make
it global.
Therefore, India today totally installed capacity of over 30 million tons,
employing over a 100 thousand people directly and contributing amount of
rupees 8 billion to India’s GDP.
TECHNOLOGY:
Cement may be manufactured employing three alternative
technologies.
1. The largely out molded well process technology.
2. The more modern dry process that requires only 19% coal
utilization.
3. The latest percallinator technology through which optimum
utilization may be achieved. Here the calcinatory or raw.
Material is partly or completed carried out before the feud enters the rotator
kin besides saving power, the adoption of this technology enable in increase
in installed capacity by 30-35%, the 30,000 tons per day plants being setup
in the country use this technology.
TECHNOLOGICAL CHANGES:
Continuous technological upgrading and assimilation of latest
technology has been going on in the cement industry. Presently 93% of the

total capacity in the industry is based on modern and environment friendly
dry process technology and only 7% of the capacity is based on old wet and
semi-dry process technology.
There is tremendous scope for waste heat recovery in cement plants
and there by reduction in emission level. One project for co-generation of
power utilizing waste heat in an Insian cement plant is being implemented
with Japanese assistance under Green Aid Plan. The induction of advanced
technology has helped the industry immensely to conserve energy and fuel
and to save materials substantially.
India is also producing different varieties of cement like Ordinary Portland
Cement (OPC), Portland Puzzling Cement (PPC), Portland Blast Furnace Slag
Cement (PBFS), Oil Well Cement, Rapid Hardening Portland Cement,
Sulphate Resisting Portland Cement, White Cement etc. production of these
varieties of cement conform to the BIS Specifications. Also, some cement
plants have set up dedicated jetties for promoting bulk transportation and
export.
TOTAL PRODUCTION:
The cement industry comprises of 125 large cement plants with an
installed capacity of 148.28 million tons and more than 300 mini cement
plants with an estimated capacity of 11.10 million tons per annum. The
Cement Corporation of India, which is a Central Public Sector Undertaking,
has 10 units. There are 10 large cement plants owned by various state
Governments. The total installed capacity in the country as a whole is 159.38
million tons.

Actual cement production in 2004-05 was 116.35 million tons as
against a production of 107.90 million tons in 2003-04, registering a growth
rate of 8.84%. Major players in cement production are Ambuja cement,
Aditya cement, J K Cement and L & T cement.
Apart from meeting the entire domestic demand, the industry is also
exporting cement and clinker. The export of cement during 2003-04 and
2005-06 was 5.14 million tons and 6.92 million tons respectively. Export
during April-May, 2005 was 1.35 million tons. Major exporters were Gujarat
Ambuja Cements Ltd. and L & T Ltd.
The planning commission for the formulation of X Five Year Plan
constituted a ‘Working Group on Cement Industry’ for the development of
cement industry. The Working Group has identified following thrust areas for
improving demand for cement;
1. Further push to housing developments programs;
2. Promotion of concrete Highways and roads, and
3. Use of ready-mix concrete in large infrastructure projects.
Cement industry has been decontrolled from price and distribution on 1st
march 1989 and de-licensed on 25th July 1991. However, the performance
of the industry and prices of cement are monitored regularly. Being a key
infrastructure industry, the constraints faced by the
Actual cement production in 2004-05 was 116.35 million tons as
against a production of 107.90 million tons in 2003-04, registering a growth
rate of 8.84%. Major players in cement production are Ambuja cement,
Aditya cement, J K Cement and L & T cement.

Apart from meeting the entire domestic demand, the industry is also
exporting cement and clinker. The export of cement during 2003-04 and
2005-06 was 5.14 million tons and 6.92 million tons respectively. Export
during April-May, 2005 was 1.35 million tons. Major exporters were Gujarat
Ambuja Cements Ltd. and L & T Ltd.
The planning commission for the formulation of X Five Year Plan
constituted a ‘Working Group on Cement Industry’ for the development of
cement industry. The Working Group has identified following thrust areas for
improving demand for cement;
4. Further push to housing developments programs;
5. Promotion of concrete Highways and roads, and
6. Use of ready-mix concrete in large infrastructure projects.
Cement industry has been decontrolled from price and distribution on 1st
march 1989 and de-licensed on 25th July 1991. However, the performance of
the industry and prices of cement are monitored regularly. Being a key
infrastructure industry, the constraints faced by the industry are reviewed in
the Infrastructure Coordination Committee meetings held in the Cabinet
Secretariat under the Chairmanship of Secretary (Coordination). The 444
Committee on Infrastructure also reviews its performance.
DISTRIBUTION SYSTEM:
Distribution of cement was entirely under Government control until
1982. at present the Industry has to make an agreement towards the levy
quota which is to be sold compulsorily to the Government the rest of the
output or open market quota may be sold in the open market evolved prices
the output lifted by the Government is allocated state wise.
NEED AND IMPORTANCE:
In India we see rapid industrial development in the last few centuries.
Indian industry is growing at considerable ratio which reveals India is a
developing country. And there are different industrial sectors are playing a
vital role for the economy’s development. They are steel cement SOF.
Information Technology Medical Science etc.
One among them was “CEMENT INDUSTRY” which plays a vital role for
the country’s development. In India cement industry is growing rationally
and marketing is the king pin of all activities particularly to the business
because of this changes in the external environment i.e., social, political,
legal, technical and international environment and changes in marketing.
There is increased in the salaries in all most in every market leading to
competition is aspects of price, promotion etc., which help to increase the
standard of living of people.
The manufacturers of Cement like Kesoram cement, India limited,
Orient limited, Ultratech etc. are providing cement and they are distributing
cement through wide network of dealers.
Kesoram cements are doing its business from decades and it is
continuously contributing to the national economy. In even Industry now a
days there is no special interest for particularly department like production
or manufacturing but know a days total quality management plays a vital for
the company’s success.
Distribution channel which plays a vital role for the company success.
Distribution channels are link between the company and consumers.
CHAPTER 3

COMPANY PROFILE
PROFILE OF THE COMPANY
One among the industrial gains in the country today serving the nation on
the industrial front kesoram industries limited has a tenured and extent full
history dating hock to the twenties when the industrial house of Birla’s
enquired it.With only a Textile mill under its banner in 1924,it grew from
strength and spread its activities to newer fields like Rayon pulp Transparent
Paper.Spun pipes and Refectory Tyres oil mills and refinery Extraction.
Looking to the wide gap between the demand and supply of vital
commodity cement which it plays on important role in Nation Building, the
government Private entrepreneurs to argument the cement production
Kesoram rose to the occasion and decided to set up few cement plants in the
country.

Kesoram cement is one of the prestigious units in the renowned
Kesoram industries group that is one of India’s leaden industrial
conglomerates, under the leadership of Mr.B.K.Birla, the famous personality
of Indian Industry, who owes branches all over India.
Kesoram cement Industry is one of the leading manufactures of cement in
India Kesoram cement is a division of Kesoram Industries limited. It is a dry
process cement plant. It is located at Basant Nagar in Karimnagar District of
Andhra Pradesh with the plant capacity is 8.26 lakhs tones per annum. It is
8Kms away from the Ramagundam Railway Station Lining Madras to New
Delhi.
PLANTS SETUP:
The first cement point of Kesoram with a capacity of 2.1 lacks tones per annum
incorporating Humboldt’s suspension preheated system was committed during the year 1969.
The second unit was setup in the year 1971 with capacity of 2.1lacks
tons which added to the above plant capacities.
The third plant with a capacity of 2.5lacks tons per anum, which
went on stream in the year 1978.
The coal for this company is obtained by singareni collieries and the
power is obtained from APSEB. The power demand capacity for the factory is
about 21M.W. Kesoram has got 20G sets of 4MN each installed in the
year1987.

Kesoram cement belongs to the Birla group companies one of the
industrial giants in the country.
Kesoram cement industries distinguished it self among the cement
factories in India by bagging the national productivity award for two
successive years i.e., in 1985-86 and 87. Kesoram cement also got the
FAPCCI award for best family planning effort in the state for the year 1987-
88.
Kesoram also bagged NCBCN’S national award for energy
conservation for the year 1989-90. The Kesoram industries look for the
welfare of the employees and it provide various facilities which the
employees and it provide various facilities which the employee feels satisfied
with in the organization and after the work they fees satisfies the worker and
works families by providing various welfare schemes and by providing
recreational facilities of a glace.
The company set up “Recreation Club” for the purpose of recrimination
facilities two auditoriums are provided for playing indoor games like chess,
shuttle and caroms and for organizing cultural functions and activities like
drama, music, and dance centers etc.
It provides Library and reading rooms for the benefit of the
employees more than 5000 books are available in the library along with
other Newspapers and magazines.
They setup English and Telugu medium schools for the growth of workers
child. The company provides “Dispensary” with a qualified medical offer and
Medical staff for the benefit of the employees.

A House Journal in the name of Basant Nagar sam char is brought out
quarterly where an all important activities and information of the plant is
published.
The company provides cooperative stores where the supply essential
commodities like rice, wheat, sugar, kerosene etc. at cash and credit basis.
They conduct games for twice a year on the occasion of 26 th January
Republic Day and 15th August Independence Day in order to encourage the
employees, outside of their workstation.
The family planning camps are held regularly with the help of the
District Medical and Health Authorities at the Government Hospital. It has got
on award for their excellent service.
Not only the employees of the factory are taken care, butthe
company plays a lot of attention towards the rural development activities.
Twelve villages are adopted and the company has extended help in
constructing temples, road, and giving programmers to the farmers, Eye
surgical camps health checkup schemes etc.
To keep the ecological balance, company has also undertaken massive
tree plantation in and around Basant Nagar and near by villages there by
eliminating the pollution and they have been nominated by the government
of India for “VRUKSHAMITRA AWARD” but effort of an industrial unit in the
state for rural development 1994-95 presented by CM in march 1996.
BRANDS:

Kesoram brands with namely Birla Supreme and Birla supreme gold
(53 grades) has made a niche with outstanding quality and commands a
premium in the market. The latest offering, “Birla Shakthi” is also very well
received and is the most sought offer brand now.
KESORAMS CAREER:
Kesoram has an outstanding track record. Achieving 100% capacity
utilization in productivity and energy conservation. It has provided its
distinctions by bagging several awards of national and state level are worthy.
AWARDS:
National productivity award for 1985-86.
National productivity award for 1986-87.
National award for energy conservation for 1980-90.
National award for mines safely 1985-86, 1986-87.
Prestigious state award yajamanya ratna and but management
award for the year 1980.
Best FAPCCI award for but family planning effort in the state
1987-88.

FAPCCI award for best workers welfare 1995-96.
Best industrial productivity award of FAPCCI.
Best management award of state government 1993.
It has got “Vanamitra award” from the government of Andhra
Pradesh.
KESORAM GROUP OF INDUSTRIES
a)Textiles Kesoram Industries Ltd,42, Garden Reach RoadCalcutta-700034.
b)Rayon Kesoram Rayon Triennia (P.O.), Dist : Hoogly, West Bengal.
c)Spun Pipes Kesoram Spun pipes & Foundries,
bansberia (P.O.), Dist: Hoogly,West Bengal.
d)Cement Kesoram Cement, Basantnagar-506187,
Dist : Karimnagar, Andhra Pradesh
e)Cement Vasavadatta Cement,Sedam-585222,Dist : Gulbargah, Karnataka.
f) Tyres Birla Tyres,Shivam Chambers,53, Syed Amir Ali Avenue.Calcutta-700029.
Product Profile
The main brands of cement manufactured are:
RAASI GOLD (53 Grade)
RAASI SUPER POWER
RAASI 43 Grade cement.
All the brands are known for its best quality standards.
Human Resources
The Plant has well qualified, highly motivated manpower of 649 employees
on its rolls. Out of 649 employees, 92 are executive cadre and remaining are
in staff and workmen cadre. The KIL, KNR manpower is known for their spirit
and commitment.

Pollution Control
The Plant is commissioned for pollution free environment and installed all the
required pollution control equipment as per the statutory requirement. A
separate team will regularly monitor and maintain the said equipment.
Safety
The Plant maintains high standards of safety and good housekeeping
methods in line with ‘5S’ techniques.
Contribution to the exchequer
KIL, KNR has been contributing around Rs.175.00 crores to the exchequer in
the form of taxes, royalty etc.
TownshipKIL, KNR has a well planned township consisting of 378 quarters having
facilities like
School
Hospital
Temple
Guest House
Co-operative Stores
Recreation Club
Play Ground etc.
Rural Development

KIL, KNR as apart of Rural & Social Development Programme adopted 8
surrounding villages . The company extends the facilities like
Housing
Water
School
Old age pension
Roads etc;
By allocating a budget amount of about Rs.25.00 lakhs per
annum.
Industrial Relations
KIL,KNR is known for its best Industrial Relations practices in this region and
won many awards from Govt. of A.P. and Chamber of Industries.
Norms
Raw Mill Clinker Cement
Lime stone 96%
Iron ore 2.5%
Laterite 1.5%
Raw Mill 1.5 tonnes
Coal 20%
Clinker97%
Gypsum 3%

CONCEPTUAL FRAME-WORK
CAPITAL BUDGEING:
An efficient allocation of capital is the most important finance function
in modern times. It involves decisions to commit firm’s funds to long-term
assets. Such decisions are tend to determine the value of company/firm by
influencing its growth, profitability & risk.
Investment decisions are generally known as capital budgeting or
capital expenditure decisions. It is clever decisions to invest current in long
term assets expecting long-term benefits firm’s investment decisions would
generally include expansion, acquisition, modernization and replacement of
long-term assets.
Such decisions can be investment decisions, financing decisions or
operating decisions. Investment decisions deal with investment of

organization’s resources in Long tern (fixed) Assets and / or Short term
(Current) Assets. Decisions pertaining to investment in Short term Assets fall
under “Working Capital Management”. Decisions pertaining to investment in
Long term Assets are classified as “Capital Budgeting” decisions.
Capital budgeting decisions are related to allocation of investible funds to
different long-term assets. They have long-term implications and affect the
future growth and profitability of the firm.
In evaluating such investment proposals, it is important to carefully consider
the expected benefits of investment against the expenses associated with
it.Organizations are frequently faced with Capital Budgeting decisions. Any
decision that requires the use of resources is a capital budgeting decisions.
Capital budgeting is more or less a continuous process in any growing
concern.
For Example: Purchase of Land is an example of Capital Budgeting
decision. Similarly replacement of outdated equipment with modern
machines, purchase of a brand or business, computerization and networking
the organization, investment in research and development of a product
launch of a major promotional campaign etc are all example of Capital
Budgeting decisions.
However, in all cases, the decisions have a long-term impact on the
performance of the organization. Even a single wrong decision may in
danger the existence of the firm as a profitable entity.
IMPORTANCE OF CAPITAL BUDGETING:
There are several factors that make capital budgeting decisions among the
critical decisions to be taken by the management. The importance of capital
budgeting can be understood from the following aspects of capital budgeting
decisions.
1. Long Term Implications: Capital Budgeting decisions have long term
effects on the risk and return composition of the firm. These decisions
affect the future position of the firm to a considerable extent. The
finance manger is also committing to the future needs for funds of that
project.
2. Substantial Commitments: The capital budgeting decisions
generally involve large commitment of funds. As a result, substantial
portion of capital funds is blocked.
3. Irreversible Decisions: Most of the capital budgeting decisions are
irreversible decisions. Once taken the firm may not be in a position to
revert back unless it is ready to absorb heavy losses which may result
due to abandoning a project midway.
4. After the Capacity and Strength to Compete: Capital budgeting
decisions affect the capacity and strength of a firm to face competition.
A firm may loose competitiveness if the decision to modernize is
delayed.
PROBLEMS & DIFFICULTIES IN CAPITAL BUDGETING:
1. Future uncertainty: Capital Budgeting decisions involve long-term
commitments. There is lot of uncertainty in the long term. The
uncertainty may be with reference to cost of the project, future
expected returns, future competition, legal provisions, political
situation etc.

1. Time Element: The implications of a Capital Budgeting decision are
scattered over a long period. The cost and benefits of a decision may
occur at different point of time. The cost of a project is incurred
immediately. However, the investment is recovered over a number of
years. The future benefits have to be adjusted to make them comparable
with the cost. Longer the time period involved, greater would be the
uncertainty.
3. Difficulty in Quantification of Impact: The finance manger may
face difficulties in measuring the cost and benefits of projects in
quantitative terms.
Example: The new product proposed to be launched by a firm may
result in increase or decrease in sales of other products already being
sold by the same firm. It is very difficult to ascertain the extent of
impact as the sales of other products may also be influenced by factors
other than the launch of the new product.
ASSUMPTIONS IN CAPITAL BUDGETING:
The Capital Budgeting decision process is a multi-faceted and analytical
process. A number of assumptions are required to be made.
1. Certainty with respect to cost & Benefits: It is very difficult to
estimate the cost and benefits of a proposal beyond 2-3 years in
future.

2. Profit Motive : Another assumption is that the capital budgeting
decisions are taken with a primary motive of increasing the profit of
the firm.
The activities can be listed as follows:
Dis-investments i.e., sale of division or business.
Change in methods of sales distribution.
Undertakings an advertisement campaign.
Research & Development programs.
Launching new projects.
Diversification.
Cost reduction.
FEATURES OF INVESTMENT DECISIONS:
The exchange of current funds for future benefits.
The funds are invested in long-term assets.
The future benefits will occur to the firm over a series of years.
IMPORTANT OF INVESTMENT DECISIONS:
They influence the firm’s growth in long run.
They effect the risk of the firm.
They involve commitment of large amount of funds.
They are irreversible, or reversible at substantial loss.
They are among the most difficult decisions to make.

TYPE OF INVESTMENT DECISIONS:
Expansion of existing business.
Expansion of new business.
Replacement & Modernization.
INVESTMENT EVALUATION CRITERIA:
Estimation of cash flows.
Estimation of the required rate of return.
Application of a decision rule for making the choice.
Consideration of cash flows is to determine true profitability of the project
and it is an unambiguous way of identifying good projects from the pool.
Ranking is possible it should recognize the fact that bigger cash flows are
preferable to smaller ones & early cash flows are referable to later ones I
should help to choose among mutually exclusive projects that which
maximizes the shareholders wealth. It should be a criterion which is
applicable to any considerable investment project independent of
other.There are number of techniques that are in use in practice. The chart
of techniques can be outlined as follows:
Capital Budgeting Techniques:
Traditional Approach Modern Approach
(or) (or)
Non-Discounted Cash Flows Disconnected Cash Flows
Pay Back Period (PB) Net Present Value (NPV)
Accounting Rate of Return (ARR) Internal Rate of ReturnProfitability Index (PI)

Discounted Payable Period
NET PRESENT VALUE :
The Net Present value method is a classic economic method of
evaluating the investment proposals. It is one of the methods of discounted
cash flow. It recognizes the importance of time value of money”.
It correctly postulates that cash flows arising of different time period,
differ in value and are comparable only when their equivalent i.e., present
values are found out.
The following steps are involved in the calculation of NPV:
Cash flows of the investment project should be forecasted based on
realistic assumptions.
An appropriate rate of interest should be selected to discount the cash
flows, generally this will be the “ Cost of capital rate” of the company.
The present value of inflows and out flows of an investment proposal,
has to be computed by discounting them with an appropriate cost of
capital rate.
The Net Present value is the difference between the “Present Value of
Cash inflows” and the present value of cash outflows.
Net present value should be found out by subtracting present value of
cash outflows from present value of cash inflows. The project should be
accepted if NPV is positive.
NPV = Present Value of Cash inflow – Present value of the cash
outflow
Acceptance Rule:
Accept if NPV > 0
Reject if NPV < 0
May accept if NPV = 0
One with higher NPV is selected.
INTERNAL RATE OF RETURN METHOD:
The internal rate of return (IRR) method is another discounted cash
flow technique .This method is based on the principle of present value. It
takes into account of the magnitude & timing of cash flows.
IRR nothing but the rate of interest that equates the present value of
future periodic net cash flows, with the present value of the capital
investment expenditure required to undertake a project.

The concept of internal rate of return is quite simple to understand in
the case of one-period project.
Acceptance Rule:
Accept if r > k
Reject if r < k
May accept if r = k
where r = rate return
k = opportunity cost of capital
PROFITABILITY INDEX (OR) BENEFIT COST RATIO:
Yet another time-adjusted method of evaluating the investment
proposals is the benefit-cost (B/C) ratio of profitability index PI). It is benefit
cost ratio. It is ratio of present value of future net cash inflows at the
required rate of return, to the initial cash outflow of the investment.
Present Value of Cash inflows
PI = -----------------------------------------
Present Value of Cash outflows
Acceptance Rule :
Accept if PI > 1
Reject if PI < 1
May accept if PI = 1
Profitability Index is a relative measure of projects profitability.
PAY BACK PERIODE METHOD:
One of the top concerns of any person or organization investing a large
amount of money would be the time by which the money will come back.
The concern making the investment would want that at least the capital
invested is recovered as early as possible. The pay back period is defined
as the period required for the proposal’s cumulative cash flows to be equal
to its cash outflows. In other words, the payback period is the length of
time required to recover the initial cost of the project. The payback period
is usually stated in terms of number of years. It can also be stated as the
period required for a proposal to ‘break even’ on its net investment.

The payback period is the number of years it takes the firm to recover its
original investment by net returns before depreciation, but after taxes.
If project generates constant annual cash inflows, the pay back period is completed as follows:
Initial Investment
Pay Back = ------------------------
Annual cash inflow
In case of unequal cash inflows, the payback period can be found out
by adding up the cash inflows until the total is equal to initial cash outlay.
Acceptance Rule:
Accept if calculated value is less than standard fixed by management
otherwise reject it.
If the payback period calculated for a project is less than the
maximum payback period set up by the company it can be accepted.
As a ranking method it gives highest rank to a project which has lowest
pay back period, and lowest rank to a project with highest pay back
period.
DISCOUNTED PAY BACK PERIOD:
One of the serious objections to pay back method is that it does not
discount the cash flows. Hence discounted pay back period has come into
existence. The number of periods taken in recovering the investment
outlay on the present value basis is called the discounted pay back period.
Discounted Pay Back rule is better as it does discount the cash flows until
the outlay is recovered.
ACCOUNTING RATE OF RETURN (OR)

AVERAGE RATE OF RETURN (ARR) :
It is also known as return on investment (ROI). It is an accounting method,
which uses the accounting information revealed by the financial statements
to measure the profitability of an investment proposal. According to
Solomon, ARR on an investment can be calculated as “ the ratio of
accounting net income to the initial investment i.e.” .
Average Net Income
ARR = ---------------------------
Average Investment
Average Income = Average of after tax profit
Average Investment = Half of Original Investment
Acceptance Rule:
Accept if calculated rate is higher than minimum rate established by
the management.
It can reject the projects with an ARR lower than the expected rate of
return.
This method can also help, the management to rank the proposals on
the basis of ARR.
A highest rank will be given to a project with highest ARR, whereas a
lowest rank to a project with lowest ARR.

CAPITAL BUDGETING METHODS IN PRACTICE In a study of the capital budgeting practices of fourteen medium to
large size companies in India, it was found tat almost all companies
used by back.
With pay back and/or other techniques, about 2/3rd of companies used
IRR and about 2/5th NPV. IRR s found to be second most popular
method.

Pay back gained significance because of is simplicity to use &
understand, its emphasis on the early recovery of investment & focus
on risk.
It was found that 1/3rd of companies always insisted on computation of
pay back for all projects, 1/3rd for majority of projects & remaining for
some of the projects.
Reasons for secondary of DCF techniques in India included difficulty in
understanding & using threes techniques, lack of qualified
professionals & unwillingness of top management to use DCF
techniques.
One large manufacturing and marketing organization mentioned that
conditions of its business were such that DCF techniques were not
needed.
Yet another company stated that replacement projects were very
frequent in the company, and it was not considered necessary to use
DCF techniques for evaluating such projects. techniques in India
included difficulty in understanding & using threes techniques, lack of
qualified professionals & unwillingness of top management to use DCF
techniques.
PROCESS
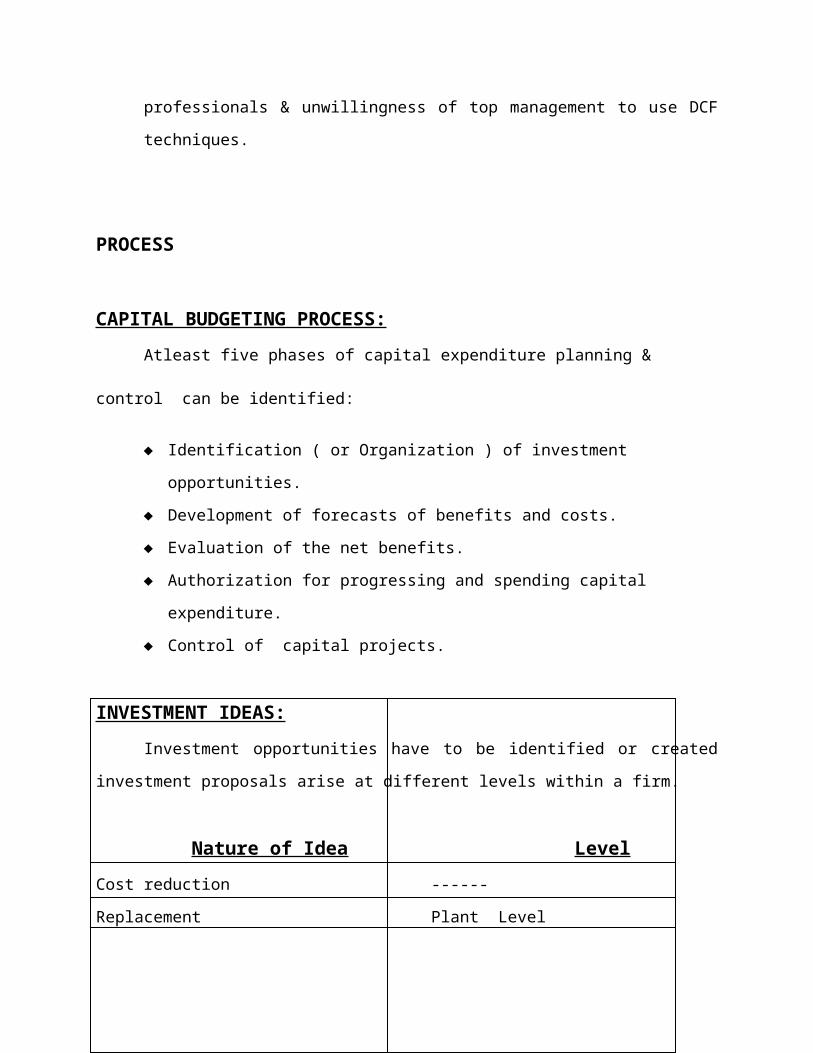
CAPITAL BUDGETING PROCESS:
Atleast five phases of capital expenditure planning & control can be
identified:
Identification ( or Organization ) of investment opportunities.
Development of forecasts of benefits and costs.
Evaluation of the net benefits.
Authorization for progressing and spending capital expenditure.
Control of capital projects.
INVESTMENT IDEAS:
Investment opportunities have to be identified or created investment
proposals arise at different levels within a firm.
Nature of Idea Level
Cost reduction ------
Replacement Plant Level
Process/Product Development ( 50% in India cover this
level)
Expansion Top management
Diversification In India, it is insignificantNew Product Marketing Dept., ( or) Plant Manager
Replacing an old
Machine ( or)
Improving the Factory Level.
Production techniques.
Investment proposals should be generated to employ the firm’s funds fully
well & efficiently.

FORECASTING :
Cash flow estimates should be development by operating managers
with the help of finance executives. Risk associated should be properly
handled. Estimation of cash flows requires collection and analysis of all
qualitative and quantitative data, both financial and non-financial in nature.
MIS provide such data.
Correct treatment should be given to :
Additional working capital
Sale proceeds of existing assets.
Depreciation
Financial flows (to be distinguished from operation flows)
EVALUATION :
Group of experts who have no ake to grind should be taken in selecting
the methods of evaluation as NPV, IRR, PI, Pay Back, ARR & Discounted Pay
Back.
Pay Back period is used as “Primary” method & IRR/NPV as
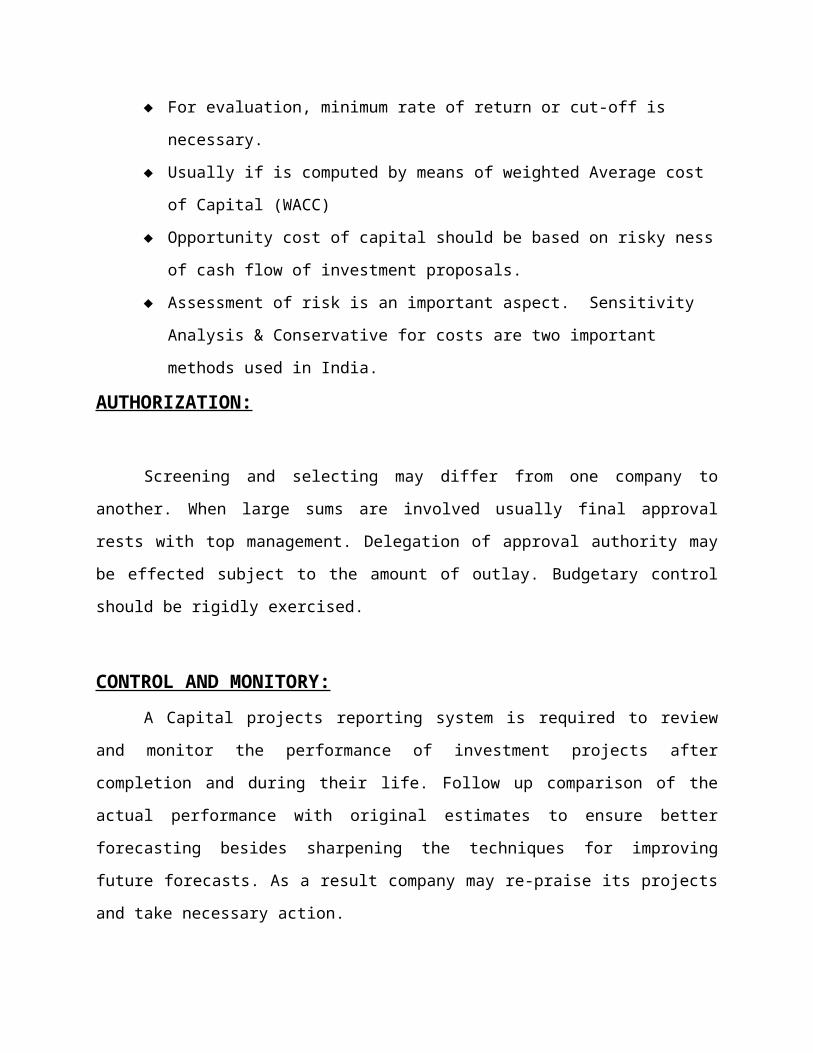
“Secondary” method in India. The following are to be given due importance.
For evaluation, minimum rate of return or cut-off is necessary.
Usually if is computed by means of weighted Average cost of Capital
(WACC)
Opportunity cost of capital should be based on risky ness of cash
flow of investment proposals.
Assessment of risk is an important aspect. Sensitivity Analysis &
Conservative for costs are two important methods used in India.
AUTHORIZATION:
Screening and selecting may differ from one company to another.
When large sums are involved usually final approval rests with top
management. Delegation of approval authority may be effected subject to
the amount of outlay. Budgetary control should be rigidly exercised.
CONTROL AND MONITORY:
A Capital projects reporting system is required to review and monitor
the performance of investment projects after completion and during their
life. Follow up comparison of the actual performance with original estimates
to ensure better forecasting besides sharpening the techniques for improving
future forecasts. As a result company may re-praise its projects and take
necessary action.
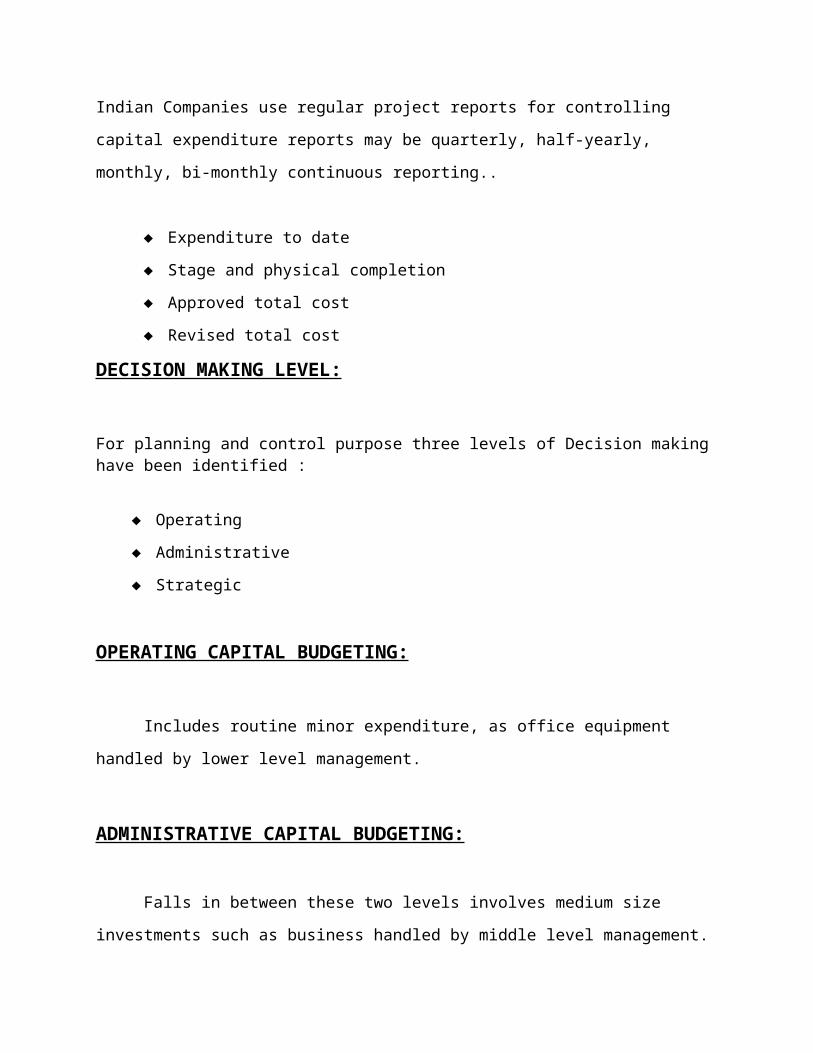
Indian Companies use regular project reports for controlling capital
expenditure reports may be quarterly, half-yearly, monthly, bi-monthly
continuous reporting..
Expenditure to date
Stage and physical completion
Approved total cost
Revised total cost
DECISION MAKING LEVEL:
For planning and control purpose three levels of Decision making have been identified :
Operating
Administrative
Strategic
OPERATING CAPITAL BUDGETING:
Includes routine minor expenditure, as office equipment handled by
lower level management.
ADMINISTRATIVE CAPITAL BUDGETING:
Falls in between these two levels involves medium size investments
such as business handled by middle level management.
STRATEGIC CAPITAL BUDGETING:
Involves large investment as acquisition of new business or expansion
in a new time of business, handled by top management unique nature.

Long Term Capital Budgeting In KESORAM
PRE – INVESTMNET STAGE:
In a planned economy, as in India, the identification of public sector
projects needs to be done within the overall framework of national the
sectoral planning. All projects of every sector need to be identified
scientifically at the time of plan formulation. In actual practice, however, it is
observed that ‘identification’ stage is the most neglected stage of the project
planning.
The five year plans indicate the broad strategy of planning economic
growth rate and other basic objectives to be achieved during the plan period.
The macro level planning exercise undertaken at the beginning of every five
year plan indicates broadly the role of each sector’s physical targets to be
achieved and financial outlays, which could be made available for the
development of the sector during the plan period.
The identification of a project in the Five Year Plan is not the sanction
of the project for implementation. It provides only the ‘green signal’ for the
preparation of feasibility report (FR0 for appraisal and investment decision.
A preliminary scrutiny of the FR of the project is done in the Ministry and
thereafter copies of the feasibility report are submitted to the appraising
agencies, viz., Planning Commission, Bureau of Public Enterprises and the
Plan Finance Division of the Ministry of Finance.

Thus the organizational responsibility for identifying these projects
rests with the concerned administrative ministry, in consultation with its
public enterprises.
The essential steps for project identification and preparation relates to
studying (i) imports (ii) substitutes (iii) available and raw material (iv)
available technology and skills (v) inter-industry relationship (vi) existing
industry (vii) development plans (viii) old projects etc.
It may be mentioned that in actual practice, these steps are hardly
scientifically studied and followed by the administrative ministry public
sector undertaking at the time of project identification. The public sector
projects many a time come spontaneously on the basis of ideas and
possibilities of demand or availability of some raw materials and not an
outcome of scientific investigation and systematic search for feasible
projects.
PROJECT FORMULATION :
The second stage of “Project Cycle” viz. Project Formulation, is a pre-
investment exercise to determine whether to invest, where to invest, when
to invest and how much to invest. The project/feasibility reports are meant
to provide required information for assessing technical, financial,
commercial, organization and economic viability of the project planning in
India, mainly because of relatively late realization of its importance. As a
result, the investment decisions for large projects in the past were taken on

half-baked and ill-conceived projects and time-over runs and cost-over runs
of public sector projects have become a regular feature rather than
exception.
In early seventies along with the setting up of the Public Investment Board
(PIB) the Government created a new project Appraisal Division in the
Planning Commission. This Division prepared and circulated “Guidelines for
preparing Feasibility Reports of Industrial Projects” in 1974.
This guidelines, unlike earlier manual, indicates all the information and data
required to be presented and analysed in the feasibility report, so as to
enable the appraisal agency to carry out (i) technical analysis – to determine
whether the specification of technical parameters are realistic, (ii) financial
anaylsis – to determine whether the proposal is financially viable, (iii)
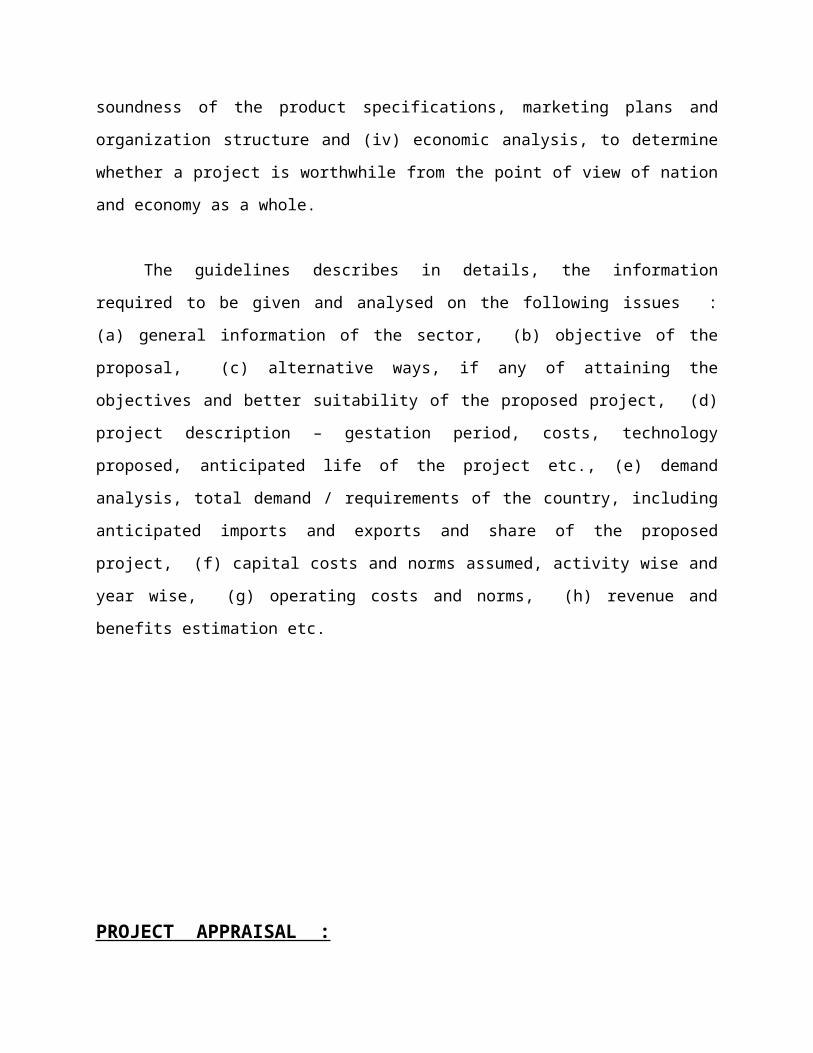
commercial analysis – to determine soundness of the product specifications,
marketing plans and organization structure and (iv) economic analysis, to
determine whether a project is worthwhile from the point of view of nation
and economy as a whole.
The guidelines describes in details, the information required to be
given and analysed on the following issues : (a) general information of the
sector, (b) objective of the proposal, (c) alternative ways, if any of attaining
the objectives and better suitability of the proposed project, (d) project
description – gestation period, costs, technology proposed, anticipated life of
the project etc., (e) demand analysis, total demand / requirements of the
country, including anticipated imports and exports and share of the proposed
project, (f) capital costs and norms assumed, activity wise and year wise,
(g) operating costs and norms, (h) revenue and benefits estimation etc.

PROJECT APPRAISAL :
The appraisal of the project follows the formulation stage. The
objective of the appraisal process is not only to decide whether to accept or
reject the investment proposal, but also to recommend the ways in which the
project can be redesigned or reformulated so as to ensure better technical,
financial, commercial and economic viabilities.
The project appraised which is an essential tool for judicious
investment decisions and project selection is a multi-disciplinary task. But
many a times this is considered doubt, have played an important role in
contributing systematic methods for forecasting the future and evolving
appraisal methods to quantify socials costs and benefits, but they alone can
not carry out complete appraisal of an investment proposal.
The need for project appraisal and investment decisions based on
social profitability arises mainly because of the basic characteristics of
developing countries limited resources for development and multiple needs –
objective of planning being ‘Economic Growth with Social Justice’. The
project appraisal is a convenient and comprehensive fashion to achieve, the
laid down objectives of the economic development plan. The appraisal work
presupposes availability of a certain minimum among of reliable and up to
date data in the country, as well as the availability of trained persons to
carry out the appraisal analysis.
As stated earlier the investment decision of public sector projects are
required to be taken within the approved plan frame work. The Project
Appraisal Division (PAD) that prepares the comprehensive appraisal note of
projects of Central Plans was therefore set up in Planning Commission. The
Finance Ministry issues expenditure sanction for all investment proposals
within the frame work of annual budget. The plan Finance Division and the
Bureau of Public Enterprises of the Finance Ministry are also required to
examine and give comments on the investment proposals of public.
DATA ANALYSIS
All finance activity commences with an investment proposal, which calls for a
financial appraisal of a project. Here, capital Budgeting has its role. Each
one of the projects is appraised on following basis”
Cost Estimates.
Cost Generations.
Cost Estimates :-
Feasibility Report of the project is prepared based on the cost of similar
units prevailing at the time of preparation of projects report of the latest
costs are not available, the same should be escalated. Collection of data
with regard to the cost of the various equipment should from part of a
continuous planning so tat a realistic cost estimate is made for the project
Reports for civil works are generally based on KESORAM schedule of rates
with reasonable premium there on.
Cost of Generation :-The financing of public sector company is generally based on Debt
Equity of 3:1 the general rate of interest chargeable by the central
Government on loan components is 10.5% ( Now enhanced to 11%) . The
plant life as provided under the Electricity Supply Act, 1948 is 25 years and
depreciation based on this period has to be calculated on straight line

method, on 90% of the cost fixed assets. The operation & maintenance
expenses are generally of the order 2.5% of the capital cost based on the
above assumptions, the cost of generation could be worked out discounted
cash flow basis taking 12% IRR (Internal Rate of Return). This rate has been
generally accepted by various appraising agencies of the power projects.
Feasibility Report based on above methodology and indicating site
selection, coal linkage, power distribution examined by Central Electricity
Authority in all cases where investment is Rs.1 Crore and above. Since
KESORAM is public sector undertaking, all the investment decisions have to
be formally sanctioned by Government after PIB’s (Public Investment
Board’s) clearance.
SHARE CAPITAL :
The entire share capital is owned by Government of India. During the
Year no addition has been made. However the authorized capital has been
increased from Rs. 80,000 million to Rs.1,00,000 million and the face value
or share has been split to Rs.10/- each from Rs.1000/- each.
ROLE OF FINANCE MANAGEMENT IN INVESTMENT
DECISIONS IN KESORAM:
Finance Manager is the number of a project team. He plays an
important role in investigation stage of the project, when various
alternatives are analysed & the most optimum solution is decided upon.
The soundness upon the accuracy of the data & as a finance manager has to
questing and satisfy himself on the validity of the data.

The power projects are extremely capital intensive and before large
resources are committed to a scheme a detailed feasibility study need to be
prepared covering-
The need of the project
The demand projections
The alternatives of the site locations
The broad parameters of the plant and equipment
The cost estimates
The viability of the scheme.
Cost Estimates :- Cost estimates and financial justification and returns of
the projects are the areas where financial management has to play its role.
Cost estimates should be prepared by the cost engineers and vetted by the
finance manager. Cost engineering is a specialized filed & need to be
developed in the contest of power projects because of insufficient cost data
on the components of the projects.
This raises an important question of the present methodology of
preparing the cost estimates without any provision for price contingencies.
Because of time lag between preparation of cost estimates and investment
decisions, after its scrutiny by the appraising agencies, these estimates are
already out of data and hence would need updating.
CAPITAL BUDGETING
EXAMPLE OF STAGE I & II
Sl. Schemes Outlay
1. Stage-I ( 3 x 20000 MT) 5,48,92,00,000
2. Stage- II( 3 x 50000 MT) 11,03,69,00,00
3. Stage-III( 1 x 50000MT) 1229.38(Millions)
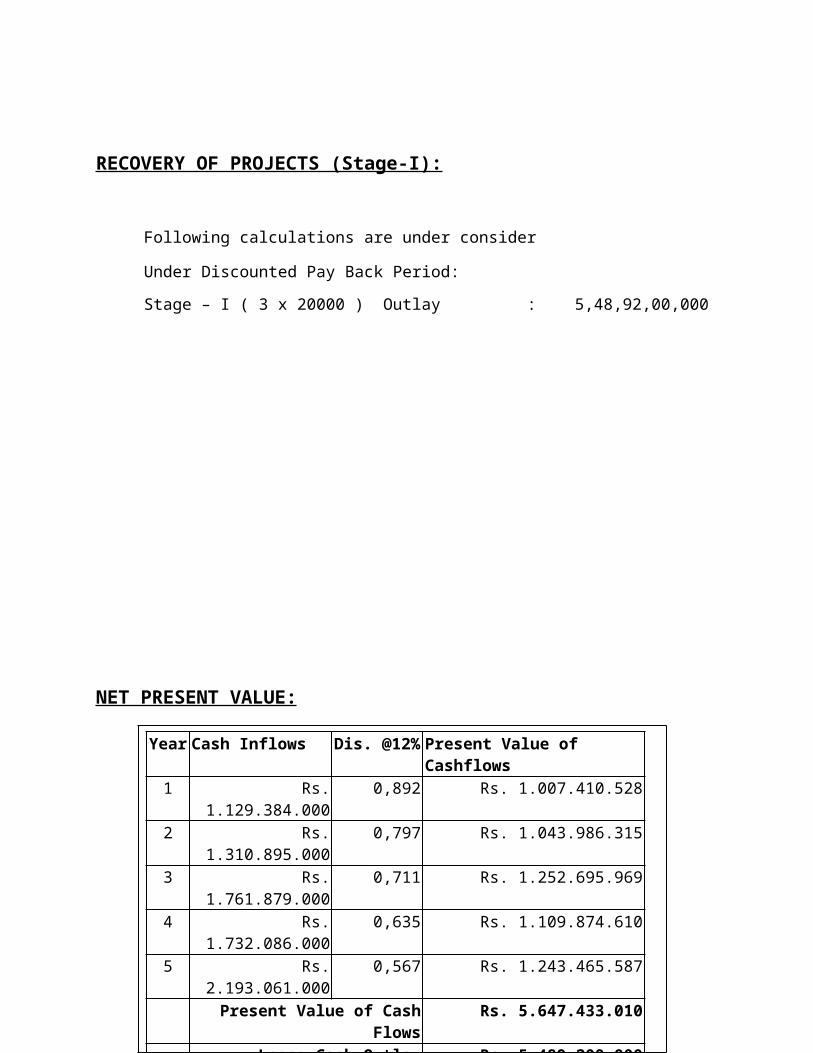
Stage – I consisting outlay of 5,48,92,00,000 this is Recovered in 5 years of
time.
RECOVERY OF PROJECTS (Stage-I):
Following calculations are under consider
Under Discounted Pay Back Period:
Stage – I ( 3 x 20000 ) Outlay : 5,48,92,00,000
NET PRESENT VALUE:
GRAPH 1:
Year
Cash Inflows Dis. @12%
Present Value of Cashflows
1 Rs. 1.129.384.000
0,892 Rs. 1.007.410.528
2 Rs. 1.310.895.000
0,797 Rs. 1.043.986.315
3 Rs. 1.761.879.000
0,711 Rs. 1.252.695.969
4 Rs. 1.732.086.000
0,635 Rs. 1.109.874.610
5 Rs. 2.193.061.000
0,567 Rs. 1.243.465.587
Present Value of Cash Flows
Rs. 5.647.433.010
Less: Cash Outlay Rs. 5.489.200.000
Net Present Value
Rs. 158.233.010

Interpretation:
The Net Present Value is the difference between the “ Present value of cash
inflows” and “Present value of cash outflows.
PROFITABILITY INDEX ( P.I):
Year Investments (In Lakhs)
Cash inflows(P.V.)
Cash Out Flows (Initial)
1999-00
2,945,083.37
18180 20000
2000-01
3,040,293.17
24780 30000
2001-02
3,192,444.28
45070 60000
2002-03
3,071,183.11
54640 80000
2003-04
3,545,210.87
18630 30000
2004-05
9,025,874.00
161290 22000
2005-06
3,991,459.40
19210 33000
2006-07
4,038,114.20
11130 70000
2007-08
3,667,441.15
65420 40000
2008- 7,338,000.0 19233 80000

09 0 2009-10
2,089,775.00
61323 60000
Total: 498896 525000
P.V. of Cash InflowsPI = ---------------------------
Initial Cash outlays
498896= ---------- = 0.95
525000
GRAPH 2 :

Investments (In Lakhs)
0.00
2,000,000.00
4,000,000.00
6,000,000.00
8,000,000.00
10,000,000.00
1999
-00
2001
-02
2003
-04
2005
-06
2007
-08
2009
-10
Investments (In Lakhs)
Interpretation:
a) The profitability index of present value of cash inflows and cash
out flows is fluctuation from year to year in the year 1999-00 the
present value of cash inflows is 18180 were as in the year 2009-
10 has been increased with 61323.
b) The highest cash inflows has been recorded in 2004-2005 as
161290 and lowest has been recorded as 18180 in the year
1999-00.
PAY BACK PERIOD:
Year Investments (In Cash Cash Out Flows

Lakhs) inflows(P.V.) (Initial)1999-00
40,000.00
8000 20000
2000-01
60,000.00
1600 30000
2001-02
70,000.00
2200 60000
2002-03
20,000.00
4500 80000
2003-04
10,000.00
4000 30000
2004-05
66,000.00
3000 22000
2005-06
25,000.00
2900 33000
2006-07
12,000.00
1100 70000
2007-08
90,000.00
1600 40000
2008-09
30,000.00
1200 80000
2009-10
50,000.00
1800 60000
Total: 473,000.00
31900 525000
Initial InvestmentsPay Back Period = ---------------------------
Annual Cash inflows
40,000= --------- 5 Years
8000
GRAPH 3:
Investments (In Lakhs)
0.00
20,000.00
40,000.00
60,000.00
80,000.00
100,000.00
1999
-00
2001
-02
2003
-04
2005
-06
2007
-08
2009
-10
Investments (In Lakhs)
Interpretation:
a) In the Pay Back method the Investment and the case inflows are
fluctuating from year to year where as in the year 1999-00 it is
40000 and in the year 2009-10 is 50000.
b) Cash inflows are in the order of increasing to decreasing from
1999-00 and 2009-10.
AVERAGE RATE OF RETURN:

Year Investments (Lakhs)
Average Income (Thousands)
Cash Flows after Taxes
2000-01
400,000.00
20000 100000
2001-02
480,000.00
15000 260000
2002-03
280,000.00
28000 440000
2003-04
240,000.00
85000 750000
2004-05
150,000.00
75000 160000
2005-06
260,000.00
64000 200000
2006-07
600,000.00
78000 300000
2007-08
100,000.00
25000 600000
2008-09
250,000.00
18000 800000
2009-10
520,000.00
22000 750000
Total 3,280,000.00
430000 4360000
Average IncomeAverage Rate of Return = ----------------------
Average Investments
20000= --------- = 0.06%
400000

GRAPH 4:
Investments (Lakhs)
0.00200,000.00400,000.00600,000.00800,000.00
2000
-01
2001
-02
2002
-03
2003
-04
2004
-05
2005
-06
2006
-07
2007
-08
2008
-09
2009
-10
Investments (Lakhs)
Interpretation:
a) Average rate of return is calculated based on Average income and
Average investment where as Average income in the year 2003-04 is
20000 and investments in the year 2009-10 is 400000.
b) The value from 2003-04 and 2009-10 are fluctuating from year to year.
DISTRIBUTION OF REVENUE 2020-2020
Interpretations:
a) In the year 2009-10 the revenue is distributed in the from of fuel retained earning, dividends is latest finance change, depreciation and for employees.
b) Where as in the year 2009-10 it is been fluctuated the rates compare to the year 2009-10.
TABLE 7:
Fuel51%
Reatined earnings
17%
Dividends5%
Tax3%
Interest & Finance Charges
14%
Depreciation8%
Generation Administration
& Other Expenses
2%
Fuel
Reatined earnings
Dividends
Tax
Interest & FinanceCharges
Depreciation
GenerationAdministration & OtherExpenses

FY YEAR NET BLOCK (IN LAKS)2004-05 2847382005-06 3230832006-07 3289162007-08 3861062008-09 4003812009-10 520861
NET BLOCK AND GROSS FIXED ASSETS
Interpretations:
a) From 2006-2007 the net block and gross fixed assets is 328916.
b) Where as the Net Block and gross fixed asset is been increased in the year 2009-10.
TABLE 8:
284738323073 328916
366106400281
520761
0
100000
200000
300000
400000
500000
600000
2004-05 2005-06 2006-07 2007-08 2008-09 2009-10
Series1

FY YEAR NET SALES(IN LAKS)2004-05 2290552005-06 2581172006-07 2864532007-08 3154002008-09 3555022009-10 440302
NET WORTH AND NET ASSETS
Interpretations:
a) Net worth and net assets has been increasing from year to year from 2005-06 it is 229055 and compare to 2009-10 it has been increased to 440302.
b) By observing the chat we can say the net worth and net assets has been increasing from 2005-06 to 2009-2010.
TABLE 9 :FY YEAR PROFIT AFTER TAX2004-05 34245
229045258117
286453315040
355501
440201
0
50000
100000
150000
200000
250000
300000
350000
400000
450000
500000
04-05 05-06 06-07 07-08 08-09 09-10
Series1
2005-06 373382006-07 353962007-08 360852008-09 526092009-10 72032
PROFIT AFTER TAX
Interpretations:
a) The chart show the increase value after the deduction of tax in the year 2009-10.
b) The Profit is changing from year to year in the year 2004-05 it is 34245 where as increasing value in the year 2004-2005 and decreased, in the year 2009-10 the value is increased.
TABLE 10 :FY YEAR POWER GENERATION (M
UNITS)2004-05 7470
3424537338 35396 36075
52608
72022
0
10000
20000
30000
40000
50000
60000
70000
80000
2004-05 2005-06 2006-07 2007-08 2008-09 2009-10
Series1

2005-06 70802006-07 70902007-08 109232008-09 197902009-10 19237
GENERATION AND SALES
GENERATION IN MUS – SALES IN MILLIONS:
Interpretations:
a) On the X – airs year are been shown from 2004-05 to 2009-10 and the value has been increasing from year to year.
b) In the year 2004-05 the generation and sale has been 7470 and the value has been increasing year to year but 2009-2020 the value is decreasing.
7470 7070 7080
10823
19790 19237
0
5000
10000
15000
20000
25000
2004-05 2005-06 2006-07 2007-08 2008-09 2009-10
Series1
FINDINGS AND SUGGESTIONS
FINDINGS ANDSUGESSTIONS
The Corporate mission of KESORAM is to make available reliable and
quality power in increasingly large quantities. The company will spear
head the process of accelerated development of the power sector by
expeditiously planning, implementing power project and operating
power stations economically and efficiently.

As in project implementation, the station continued to excel in power
generation with the power station having reached its first goal of total
capacity installation. Ramagundam is generating power at consistently
high plant load factor.
The organization needs the capable personalities as management to
lead to organization successfully. The management make the plans
and implement of these plans. These plans are expressed in terms of
long-term investment decisions.
The special budgets are rarely used in the organization like long-term
budgets, research & development budget and budget and budget for
constancy.
From the Revenue budget for the year 2000-2003, it is clear that the
Actual sales ( Rs. 168552.50 lacks) are more then the budgeted or
Estimated sales ( Rs. 164208.54 lacks). It is a good sign and the overall
earnings of the budget indicate high volume over estimated.
Fuel utilization is perfectly carry out in RSTPS. And Cash from Ash
effectively carry out the job.
New projects acceptance consider on the basis of Return Benefits. Risk
is evaluated while considering the new projects.
CONCLUSIONS
Every organization has pre-determined set of objective and goals, but
reaching those objectives and goals only by proper planning and
executing of the plans economically.

With in a Short span of its existence, the corporation has
commissioned 19502 MW as on 31st March, 2000 with an operating
capacity of 19.9%. KESORAM today generate 24.9% of nation’s
electricity. KESORAM is presently executing 12 Cement manufacturing
Projects and 6 Gas based cement manufacturing projects with a total
approved capacity of 29,935 MT as on 31st March 2004.

BIBLIOGRAPHY
References :
Financial accounting

Cost and management accounting
Financial accounting
Accounting for management
Website :
www.google.comwww.KESORAM.comwww.yahoofinance,com