may 24-month study date: may 9, 2013
TRANSCRIPT
May 24-Month Study Date: May 9, 2013
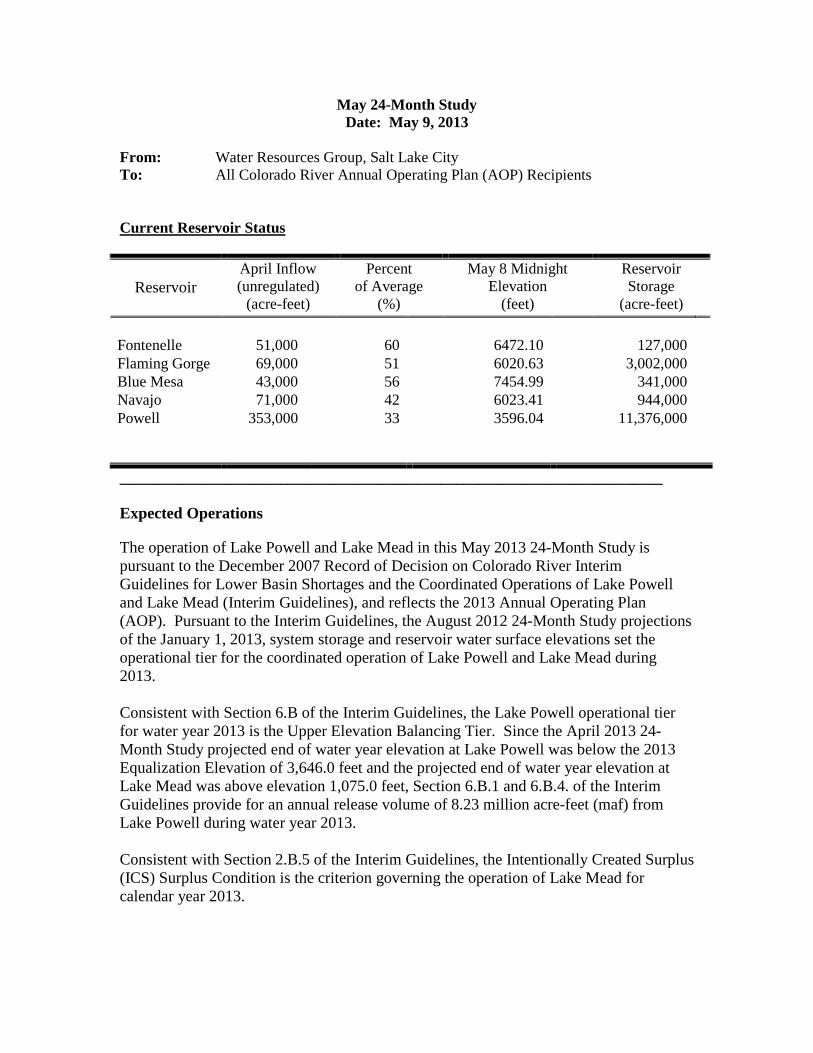
From: Water Resources Group, Salt Lake City To: All Colorado River Annual Operating Plan (AOP) Recipients Current Reservoir Status
Reservoir
April Inflow (unregulated)
(acre-feet)
Percent of Average
(%)
May 8 Midnight Elevation
(feet)
Reservoir Storage
(acre-feet) Fontenelle 51,000 60 6472.10 127,000 Flaming Gorge 69,000 51 6020.63 3,002,000 Blue Mesa 43,000 56 7454.99 341,000 Navajo 71,000 42 6023.41 944,000 Powell 353,000 33
3596.04 11,376,000
_______________________________________________________________________ Expected Operations The operation of Lake Powell and Lake Mead in this May 2013 24-Month Study is pursuant to the December 2007 Record of Decision on Colorado River Interim Guidelines for Lower Basin Shortages and the Coordinated Operations of Lake Powell and Lake Mead (Interim Guidelines), and reflects the 2013 Annual Operating Plan (AOP). Pursuant to the Interim Guidelines, the August 2012 24-Month Study projections of the January 1, 2013, system storage and reservoir water surface elevations set the operational tier for the coordinated operation of Lake Powell and Lake Mead during 2013. Consistent with Section 6.B of the Interim Guidelines, the Lake Powell operational tier for water year 2013 is the Upper Elevation Balancing Tier. Since the April 2013 24-Month Study projected end of water year elevation at Lake Powell was below the 2013 Equalization Elevation of 3,646.0 feet and the projected end of water year elevation at Lake Mead was above elevation 1,075.0 feet, Section 6.B.1 and 6.B.4. of the Interim Guidelines provide for an annual release volume of 8.23 million acre-feet (maf) from Lake Powell during water year 2013. Consistent with Section 2.B.5 of the Interim Guidelines, the Intentionally Created Surplus (ICS) Surplus Condition is the criterion governing the operation of Lake Mead for calendar year 2013.
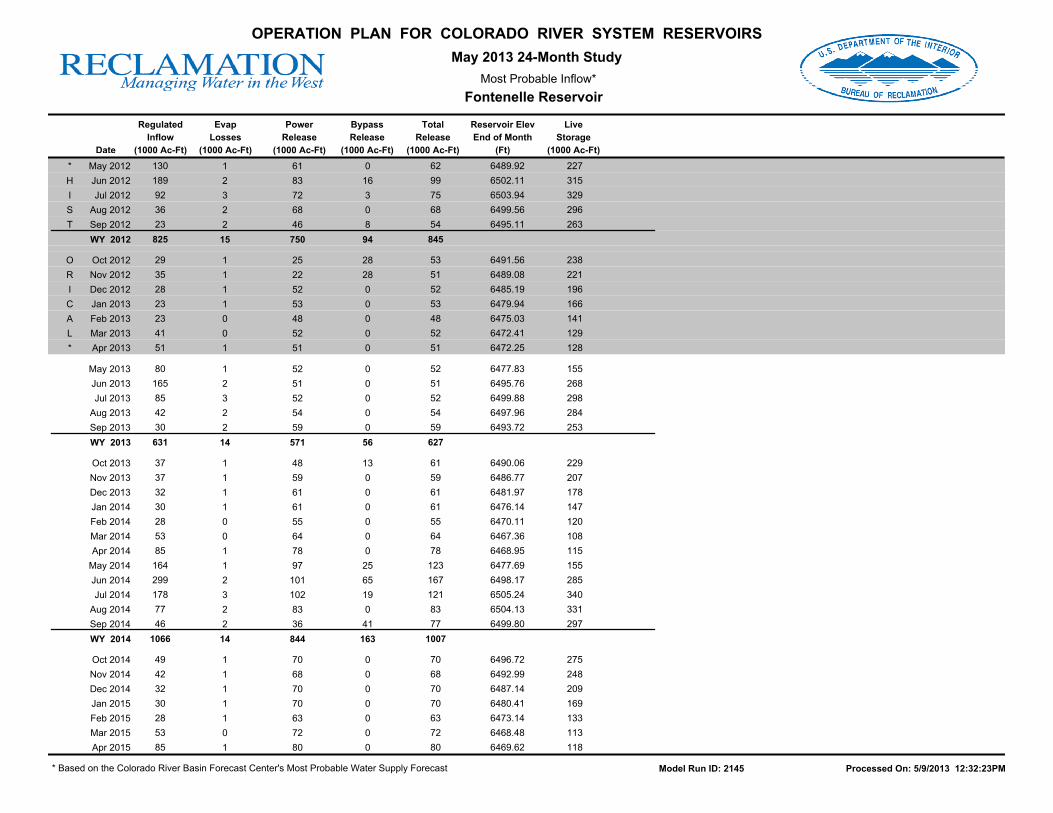
Consistent with Section 6.C.1 of the Interim Guidelines, if the August 24-Month study projects the January 1, 2014, Lake Powell elevation to be less than 3,575.0 feet and at or above 3,525.0 feet and the Lake Mead elevation to be at or above 1,025.0 feet, the operational tier for Lake Powell in water year 2014 would be the Mid-Elevation Release Tier and the water year release volume from Lake Powell would be 7.48 maf. This May 2013 24-Month study projects that, with an 8.23 maf annual release pattern in water year 2014, the January 1, 2014, Lake Powell elevation would be 3,577.27 feet and the Lake Mead elevation would be 1,107.47 feet. Therefore, the 2014 Lake Powell operational tier is not currently projected to be the Mid-Elevation Release Tier. Based on analysis of a range of inflow scenarios, the current probability of realizing an inflow volume that would result in the Mid-Elevation Release Tier in 2014 is approximately 45 percent. The Interim Guidelines are available for download at http://www.usbr.gov/lc/region/programs/strategies/RecordofDecision.pdf. The 2013 AOP is available for download at http://www.usbr.gov/uc/water/rsvrs/ops/aop/AOP13_final.pdf. Fontenelle Reservoir – Inflows to Fontenelle Reservoir for the month of April were 50,600 acre-feet (AF), or 78 percent of average. The reservoir elevation is 6472.2 feet, 38 percent of live capacity and decreasing. Inflows are averaging 750 cubic feet per second (cfs) and are expected to increase over the next few weeks as spring runoff flows enter the reservoir. Reservoir releases remain at 850 cfs and will likely remain close to this level this spring, with a small possibility of a spring peak occurring sometime in July.
Inflows for the next three months are projected to be below average: with May, June and July forecasted inflow volumes at 80,000 AF (49% of average), 165,000 AF (55% of average), and 85,000 AF (48% of average), respectively. The Colorado Basin River Forecast Center has issued the official water supply forecast for the April through July unregulated inflow volume which is 380,000 af or 52 percent of the 1981-2010 thirty-year average.
The next Fontenelle Working Group meeting is scheduled for August 22, 2013, at 10:00 am at the Joint Powers and Water Board in Green River, Wyoming. The Fontenelle Working Group is an open public forum for information exchange between Reclamation and other parties associated with the operation of Fontenelle Reservoir. The spring Fontenelle Working Group meeting was held on April 25, 2013 at Seedskadee National Wildlife Refuge. Minutes from the meeting will be posted on the Working Group webpages.
Flaming Gorge Reservoir – Unregulated inflow into Flaming Gorge Reservoir during the month of April was 68,700 acre-feet (af), or 63 percent of average. The reservoir elevation is 6020.57 feet and increasing. Observed inflows are approximately 1,025 cubic feet per second (cfs).
Forecasts remain below average and Flaming Gorge Dam is in the moderately dry hydrologic classification as outlined in the Record of Decision. Flaming Gorge Dam releases are currently steady at approximately 820 cfs, and are expected to remain at this level until spring runoff begins sometime in late May or early June. Information on spring releases will be updated throughout the next few months.
The Colorado Basin River Forecast Center has issued the official May water supply forecast for the April through July unregulated inflow volume which is 480,000 af or 49 percent of the 1981-2010 thirty-year average.
Reclamation will be involved in a cooperative experimental program this year where the capture of endangered larval razorback sucker is the “trigger” to increase releases from Flaming Gorge Dam this spring. Reclamation plans to coordinate with scientists involved in real-time monitoring on the river to determine the first appearance of larval razorback sucker. Reclamation anticipates at least 2 days notification in the event larval presence is reported and Flaming Gorge Dam releases are increased.
The spring hydrologic classification is officially in the moderately dry classification. Snowpack continues to be below average in both basins and spring weather has large impacts on runoff. Additionally, timing of the Yampa River spring peak flows and emergence of larval razor fish may not occur simultaneously, as evidenced by larval presence historically occurring as the Yampa River decreases to base flows. At this time, Reclamation is recommending operating conservatively and continuing to exercise the flexibility in the Record of Decision to operate one classification lower than indicated in the Flow Recommendations while being prepared to adjust if conditions warrant. Reclamation is currently operating in the dry hydrologic classification.
The next Flaming Gorge Working Group meeting is scheduled for August 21, 2013, at 11:00 a.m. at the new Utah Department of Natural Resources building in Vernal, Utah, located at 318 North Vernal Avenue. The Flaming Gorge Working Group is an open public forum for information exchange between Reclamation and the stake holders of Flaming Gorge Dam. The public is encouraged to attend and comment on the operations and plans presented by Reclamation at these meetings. For more information on this group and these meetings please contact Ed Vidmar at 801-379-1182.
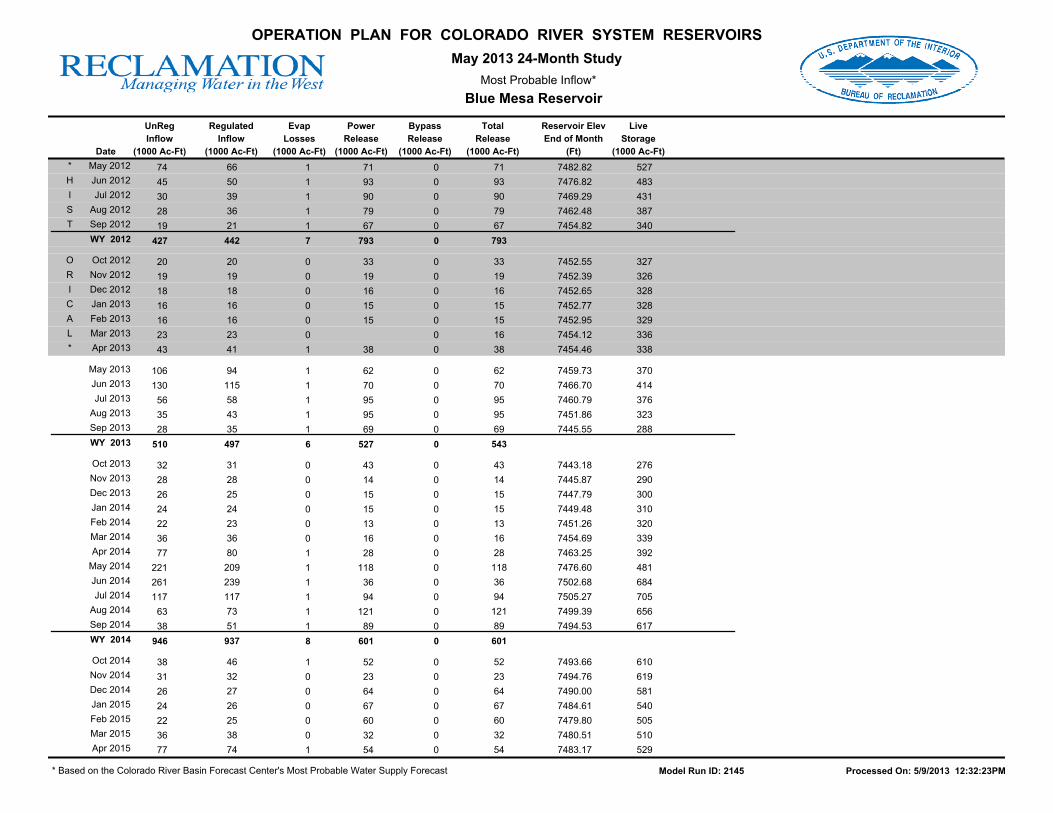
Aspinall Unit Reservoirs – April unregulated inflow into Blue Mesa Reservoir was 43,000 acre-feet or 56 percent of average. Precipitation during April was 120 percent of average. The current inflow rate into Blue Mesa Reservoir is about 1200 cfs while reservoir releases are averaging about 1100 cfs. The reservoir elevation is currently at 7455.00 feet, which corresponds to a storage content of about 341,000 acre-feet. The latest Water Supply Forecast for Water Year 2013 has been issued and the April through July unregulated inflow is forecasted to be at 335,000 acre-feet (50% of average), this is 20,000 acre-feet higher than last month’s forecast. The May 1st forecast officially set the senior Black Canyon Water Right. Using this forecast calls for a one
day spring peak flow of 685 cfs below the tunnel diversion. Also using this same forecast for the determining the flow recommendations from the Aspinall ROD at Whitewater gage, the peak flow at that point should be 900 cfs for one day. At this time Reclamation plans to continue to operate the Aspinall Unit to meet both the Black Canyon water right and ROD recommendations. Based on this forecast and the combination of meeting water right and ROD this coming spring, Blue Mesa Reservoir is projected to not fill this runoff season. The projected fill is calculated to be about 7466.7 feet, or about 53 feet and 418,000 acre-feet short of top of active conservation pool, elevation 7519.4 feet. Releases from Crystal are currently set at 1300 cfs. The Gunnison Diversion Tunnel is currently diverting about 1,000 cfs, which results in a river flow below the diversion tunnel of approximately 300 cfs. This lower flow is a result of Reclamation trying to conserve reservoir storage for what is forecasted to be a very dry year. The last meeting of the "Aspinall Unit Working Group" was held on Thursday, April 25, 2013 starting at 1:00 PM in Reclamation’s Grand Junction Office. At this meeting, review of this winter’s reservoir operations, and plans for this spring and summer operations were discussed. These meetings are open forum discussions on the Aspinall Unit reservoir operations with many interested groups participating. Anyone needing further information about these meetings should contact Dan Crabtree in the Grand Junction Area Office at (970) 248-0652. Navajo Reservoir – As a result of increased runoff in the San Juan River Basin, the Bureau of Reclamation decreased the release from Navajo Reservoir from 350 cubic feet per second (cfs) to 250 cfs on Tuesday, May 7th. Releases are made for the authorized purposes of the Navajo Unit, and to attempt to maintain a target base flow through the endangered fish critical habitat reach of the San Juan River (Farmington to Lake Powell). The San Juan River Basin Recovery Implementation Program recommends a target base flow of between 500 cfs and 1,000 cfs through the critical habitat area. The target base flow is calculated as the weekly average of gaged flows throughout the critical habitat area. As of May 9th, the San Juan River basin above Navajo snowpack is 37% of average snow water equivalent (SWE). For the Animas River Basin it is 36%. Precipitation for the month of April throughout the San Juan River basin ranged from 50% to 70% of average. The seasonal peak SWE above Navajo was reached on March 13th and was 13.9 inches (74% of average). Observed inflow into Navajo Reservoir during the month of April was 52,524 acre-feet. Modified-unregulated inflow volume was 71,104 af, which was 49% of average. Currently, the daily observed inflow is averaging 2000 cfs. NIIP is diverting 550 cfs per day (average of the past week). The reservoir water surface elevation is at 6023 feet, which corresponds to a storage content of about 939,500 acre-feet (55% full).
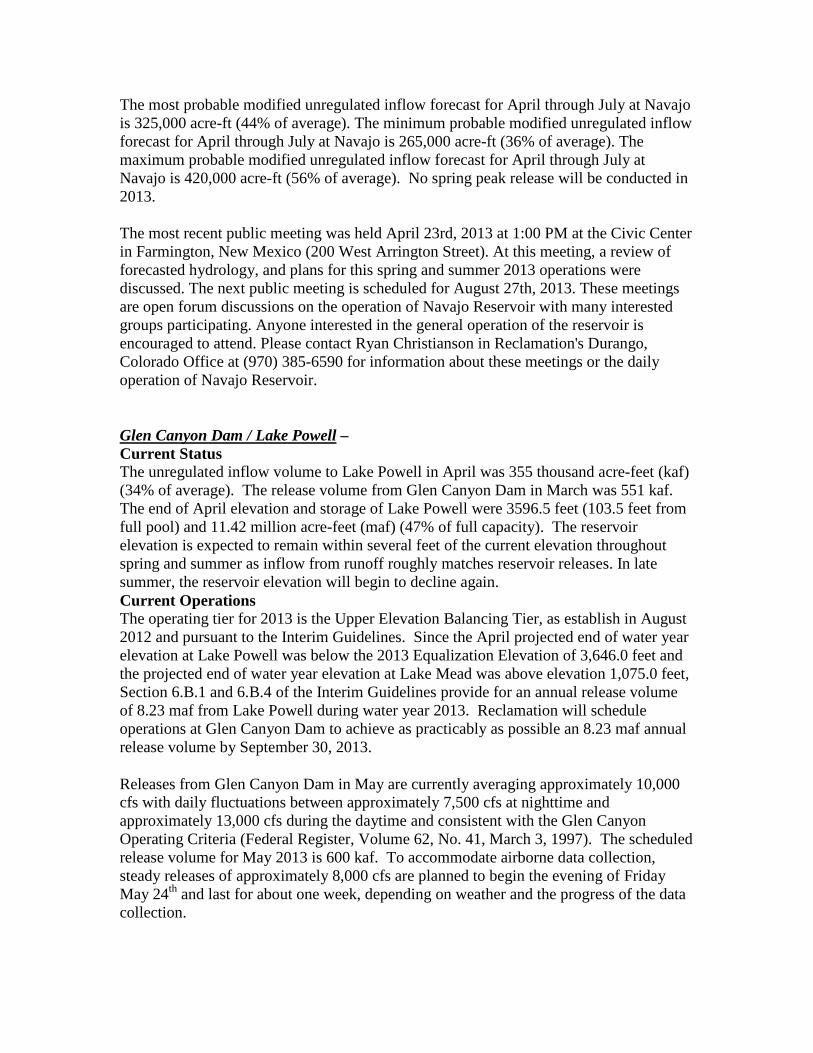
The most probable modified unregulated inflow forecast for April through July at Navajo is 325,000 acre-ft (44% of average). The minimum probable modified unregulated inflow forecast for April through July at Navajo is 265,000 acre-ft (36% of average). The maximum probable modified unregulated inflow forecast for April through July at Navajo is 420,000 acre-ft (56% of average). No spring peak release will be conducted in 2013. The most recent public meeting was held April 23rd, 2013 at 1:00 PM at the Civic Center in Farmington, New Mexico (200 West Arrington Street). At this meeting, a review of forecasted hydrology, and plans for this spring and summer 2013 operations were discussed. The next public meeting is scheduled for August 27th, 2013. These meetings are open forum discussions on the operation of Navajo Reservoir with many interested groups participating. Anyone interested in the general operation of the reservoir is encouraged to attend. Please contact Ryan Christianson in Reclamation's Durango, Colorado Office at (970) 385-6590 for information about these meetings or the daily operation of Navajo Reservoir. Glen Canyon Dam / Lake Powell – Current Status The unregulated inflow volume to Lake Powell in April was 355 thousand acre-feet (kaf) (34% of average). The release volume from Glen Canyon Dam in March was 551 kaf. The end of April elevation and storage of Lake Powell were 3596.5 feet (103.5 feet from full pool) and 11.42 million acre-feet (maf) (47% of full capacity). The reservoir elevation is expected to remain within several feet of the current elevation throughout spring and summer as inflow from runoff roughly matches reservoir releases. In late summer, the reservoir elevation will begin to decline again. Current Operations The operating tier for 2013 is the Upper Elevation Balancing Tier, as establish in August 2012 and pursuant to the Interim Guidelines. Since the April projected end of water year elevation at Lake Powell was below the 2013 Equalization Elevation of 3,646.0 feet and the projected end of water year elevation at Lake Mead was above elevation 1,075.0 feet, Section 6.B.1 and 6.B.4 of the Interim Guidelines provide for an annual release volume of 8.23 maf from Lake Powell during water year 2013. Reclamation will schedule operations at Glen Canyon Dam to achieve as practicably as possible an 8.23 maf annual release volume by September 30, 2013.
Releases from Glen Canyon Dam in May are currently averaging approximately 10,000 cfs with daily fluctuations between approximately 7,500 cfs at nighttime and approximately 13,000 cfs during the daytime and consistent with the Glen Canyon Operating Criteria (Federal Register, Volume 62, No. 41, March 3, 1997). The scheduled release volume for May 2013 is 600 kaf. To accommodate airborne data collection, steady releases of approximately 8,000 cfs are planned to begin the evening of Friday May 24th and last for about one week, depending on weather and the progress of the data collection.
In June, the release volume will likely be about 800 kaf, with daily fluctuations for hydropower between approximately 9,000 cfs in the nighttime and approximately 17,000 cfs in the daytime. In July, the release volume will likely be about 848 kaf with daily fluctuations between approximately 10,000 cfs and 18,000 cfs. In addition to daily scheduled fluctuations for power generation, the instantaneous releases from Glen Canyon Dam may also fluctuate to provide 40 MW of system regulation. These instantaneous release adjustments stabilize the electrical generation and transmission system and translate to a range of about 1,100 cfs above or below the hourly scheduled release rate. Typically, fluctuations for system regulation are very short lived and balance out over the hour and do not have noticeable impacts on downstream river flow conditions. Releases from Glen Canyon Dam can also fluctuate beyond scheduled fluctuations for power generation when called upon as a partner that shares reserve requirements within the electrical generator community (i.e. balancing area). Reserves provide system reliability in the event of an unscheduled outage. Glen Canyon Dam typically maintains 43 MW of reserves (approximately 1,100 cfs). Reserve calls can be maintained for a maximum of 2 hours after which time the generation rate should be returned to the original schedule. If reserves from Glen Canyon Dam are called upon, releases from the dam can exceed scheduled levels and can have a noticeable impact on the river downstream from Glen Canyon Dam. Calls for reserves are fairly infrequent and typically are for much less than 43 MW. Inflow Forecasts and Model Projections The hydrologic forecast for Lake Powell for the April to July water supply season projects that the most probable (median) unregulated inflow volume will be 3.0 maf (42% of average based on the period 1981-2010). Due to late season snow storms over the region, the forecast increased slightly (by 0.3 maf) from last month; however, the overall water supply outlook remains significantly below average this year. The minimum probable and maximum probable forecasts are 1.75 maf (24%) and 4.25 maf (59%), respectively. Based on the current forecast, the May 24-Month study projects Lake Powell elevation will decline approximately 10 feet throughout the spring and summer and end the water year at 3587.7 feet with 10.60 maf in storage (44% capacity). The annual release volume from Lake Powell during water year 2013 is scheduled to be 8.23 maf. Reclamation will schedule operations at Glen Canyon Dam to achieve as practicably as possible an 8.23 maf annual release volume by September 30, 2013. Consistent with Section 6.C.1 of the Interim Guidelines, if the August 2013 24-Month study projects the January 1, 2014, Lake Powell elevation to be at or above 3,575.00 feet and below the equalization level of 3648.00 feet and the Lake Mead elevation to be at or above 1,075.00 feet, the operational tier for Lake Powell in water year 2014 will be the Upper Elevation Balancing Tier and the water year release volume from Lake Powell will be 8.23 maf. This May 2013 24-Month study projects that, with an 8.23 maf annual release pattern in water year 2014, the January 1, 2014 Lake Powell elevation would be 3,577.27 feet and the Lake Mead elevation would be 1,107.47 feet. Therefore, the 2014
Lake Powell operational tier is currently projected to be the Upper Elevation Balancing Tier with an annual release volume of 8.23 maf and no projected shift in April to the Equalization Tier. However, if hydrology should become slightly drier than is currently projected and the August 24-Month Study projects the January 1, 2013 Lake Powell elevation to be less than 3,575.00 feet, the Mid-Elevation Release Tier will govern and the annual release volume from Lake Powell will be 7.48 maf. Based on analysis of a range of inflow scenarios, the current probability of realizing an inflow volume that would result in the Upper Elevation Balancing Tier and an 8.23 maf annual release is approximately 55 percent and the probability for the Mid-Elevation Release Tier and a 7.48 maf annual release is approximately 45 percent. Upper Colorado River Basin Hydrology – Since 2005, the Upper Colorado River Basin has experienced significant year to year hydrologic variability. The unregulated inflow to Lake Powell, which is a good measure of hydrologic conditions in the Colorado River Basin, has averaged a water year volume of 10.22 maf (94% of average (period 1981-2010)) during the period from 2005 through 2012. The hydrologic variability during this period has been from a low water year unregulated inflow volume of 4.91 maf (45% of average) in water year 2012 to a high water year unregulated inflow volume of 15.97 maf (147% of average) in water year 2011. Based on observed inflows and current forecasts, water year 2013 unregulated inflow is expected to be 4.83 maf (45% of average), which would be the second below-average year in a row. At the beginning of water year 2013, overall reservoir storage in the Colorado River Basin had increased by approximately 4 maf compared with water year 2005, which was an improvement over the persistent drought conditions of 2000 through 2004. Total reservoir storage in the Colorado River Basin had increased from 29.8 maf (50% of capacity) at the beginning of 2005 to 33.9 maf (57 % of capacity) at the beginning of 2013. However, during this period, total Colorado Basin storage experienced year to year increases and decreases in response to wet and dry hydrology. In addition, conditions in both 2012 and 2013 have been significantly drier than average and given observed inflows and current forecasts, the projected end of water year 2013 total reservoir storage is approximately 29.4 maf (49% of capacity).
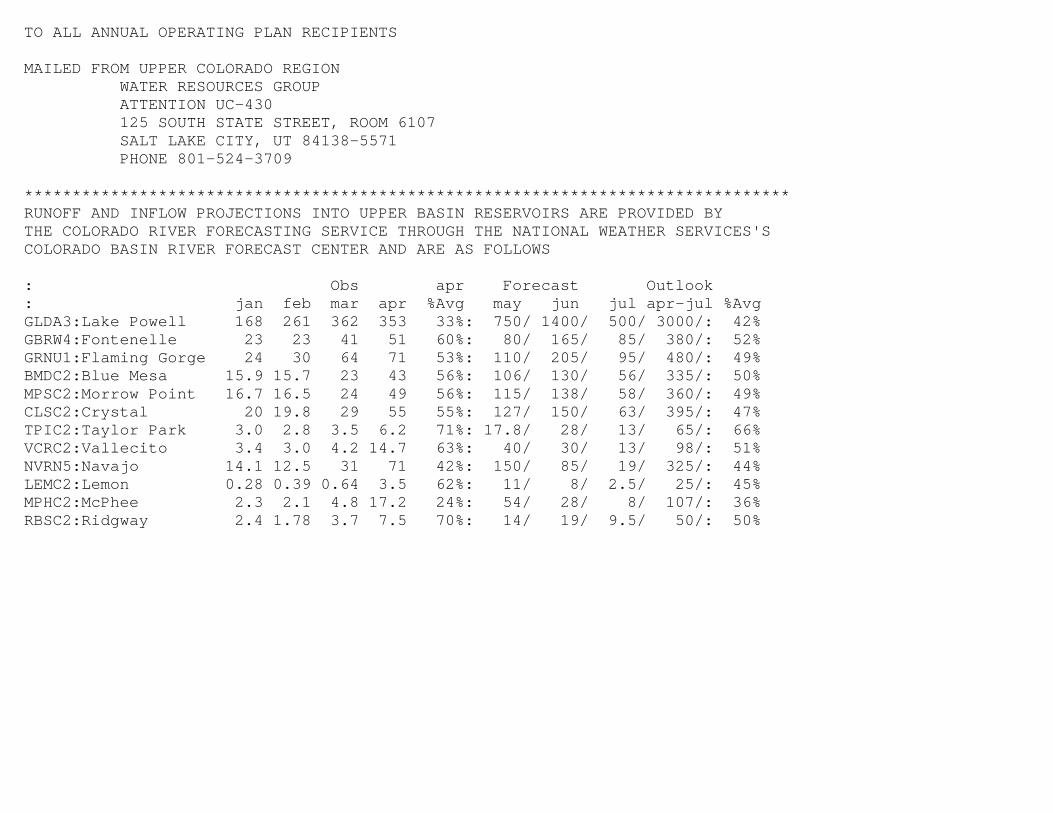
TO ALL ANNUAL OPERATING PLAN RECIPIENTS MAILED FROM UPPER COLORADO REGION WATER RESOURCES GROUP ATTENTION UC-430 125 SOUTH STATE STREET, ROOM 6107 SALT LAKE CITY, UT 84138-5571 PHONE 801-524-3709 ******************************************************************************** RUNOFF AND INFLOW PROJECTIONS INTO UPPER BASIN RESERVOIRS ARE PROVIDED BY THE COLORADO RIVER FORECASTING SERVICE THROUGH THE NATIONAL WEATHER SERVICES'S COLORADO BASIN RIVER FORECAST CENTER AND ARE AS FOLLOWS : Obs apr Forecast Outlook : jan feb mar apr %Avg may jun jul apr-jul %Avg GLDA3:Lake Powell 168 261 362 353 33%: 750/ 1400/ 500/ 3000/: 42% GBRW4:Fontenelle 23 23 41 51 60%: 80/ 165/ 85/ 380/: 52% GRNU1:Flaming Gorge 24 30 64 71 53%: 110/ 205/ 95/ 480/: 49% BMDC2:Blue Mesa 15.9 15.7 23 43 56%: 106/ 130/ 56/ 335/: 50% MPSC2:Morrow Point 16.7 16.5 24 49 56%: 115/ 138/ 58/ 360/: 49% CLSC2:Crystal 20 19.8 29 55 55%: 127/ 150/ 63/ 395/: 47% TPIC2:Taylor Park 3.0 2.8 3.5 6.2 71%: 17.8/ 28/ 13/ 65/: 66% VCRC2:Vallecito 3.4 3.0 4.2 14.7 63%: 40/ 30/ 13/ 98/: 51% NVRN5:Navajo 14.1 12.5 31 71 42%: 150/ 85/ 19/ 325/: 44% LEMC2:Lemon 0.28 0.39 0.64 3.5 62%: 11/ 8/ 2.5/ 25/: 45% MPHC2:McPhee 2.3 2.1 4.8 17.2 24%: 54/ 28/ 8/ 107/: 36% RBSC2:Ridgway 2.4 1.78 3.7 7.5 70%: 14/ 19/ 9.5/ 50/: 50%
Most Probable Inflow*
May 2013 24-Month Study
Fontenelle Reservoir
OPERATION PLAN FOR COLORADO RIVER SYSTEM RESERVOIRS
Reservoir Elev
End of Month
(Ft)
Live
Storage
(1000 Ac-Ft)
Total
Release
(1000 Ac-Ft)
Regulated
Inflow
(1000 Ac-Ft)Date
Evap
Losses
(1000 Ac-Ft)
Power
Release
(1000 Ac-Ft)
Bypass
Release
(1000 Ac-Ft)
130 62 6489.92 227 1 61 0May 2012*
189 99 6502.11 315 2 83 16Jun 2012H
92 75 6503.94 329 3 72 3Jul 2012I
36 68 6499.56 296 2 68 0Aug 2012S
23 54 6495.11 263 2 46 8Sep 2012T
825 845 15 750 94WY 2012
29 53 6491.56 238 1 25 28Oct 2012O
35 51 6489.08 221 1 22 28Nov 2012R
28 52 6485.19 196 1 52 0Dec 2012I
23 53 6479.94 166 1 53 0Jan 2013C
23 48 6475.03 141 0 48 0Feb 2013A
41 52 6472.41 129 0 52 0Mar 2013L
51 51 6472.25 128 1 51 0Apr 2013*
80 52 6477.83 155 1 52 0May 2013
165 51 6495.76 268 2 51 0Jun 2013
85 52 6499.88 298 3 52 0Jul 2013
42 54 6497.96 284 2 54 0Aug 2013
30 59 6493.72 253 2 59 0Sep 2013
631 627 14 571 56WY 2013
37 61 6490.06 229 1 48 13Oct 2013
37 59 6486.77 207 1 59 0Nov 2013
32 61 6481.97 178 1 61 0Dec 2013
30 61 6476.14 147 1 61 0Jan 2014
28 55 6470.11 120 0 55 0Feb 2014
53 64 6467.36 108 0 64 0Mar 2014
85 78 6468.95 115 1 78 0Apr 2014
164 123 6477.69 155 1 97 25May 2014
299 167 6498.17 285 2 101 65Jun 2014
178 121 6505.24 340 3 102 19Jul 2014
77 83 6504.13 331 2 83 0Aug 2014
46 77 6499.80 297 2 36 41Sep 2014
1066 1007 14 844 163WY 2014
49 70 6496.72 275 1 70 0Oct 2014
42 68 6492.99 248 1 68 0Nov 2014
32 70 6487.14 209 1 70 0Dec 2014
30 70 6480.41 169 1 70 0Jan 2015
28 63 6473.14 133 1 63 0Feb 2015
53 72 6468.48 113 0 72 0Mar 2015
85 80 6469.62 118 1 80 0Apr 2015
* Based on the Colorado River Basin Forecast Center's Most Probable Water Supply Forecast Model Run ID: 2145 Processed On: 5/9/2013 12:32:23PM

Most Probable Inflow*
May 2013 24-Month Study
Flaming Gorge Reservoir
OPERATION PLAN FOR COLORADO RIVER SYSTEM RESERVOIRS
Reservoir Elev
End of Month
(Ft)
Live
Storage
(1000 Ac-Ft)
Total
Release
(1000 Ac-Ft)
Evap
Losses
(1000 Ac-Ft)Date
Bank
Storage
(1000 Ac-Ft)
Power
Release
(1000 Ac-Ft)
Unreg
Inflow
(1000 Ac-Ft)
Jensen
Flow
(1000 Ac-Ft)
Bypass
Release
(1000 Ac-Ft)
Reg
Inflow
(1000 Ac-Ft)
159 6023.57 178 385 3108 125 8 19May 2012* 153 85
87 6023.59 87 154 3108 125 10 0Jun 2012H 188 98
84 6023.04 84 99 3088 124 12 0Jul 2012I 93 76
80 6022.19 80 90 3058 123 12 0Aug 2012S 29 60
68 6021.43 68 79 3030 122 10 0Sep 2012T 19 50
1366 1386 2278 78 20WY 2012 990 1010
52 6021.15 52 71 3020 122 7 0Oct 2012O 24 48
49 6021.23 49 75 3023 122 3 0Nov 2012R 39 55
70 6020.63 70 110 3002 121 2 0Dec 2012I 25 50
74 6020.03 74 398 2981 120 2 0Jan 2013C 24 53
67 6019.65 67 388 2967 119 2 0Feb 2013A 30 55
53 6020.19 53 109 2986 120 3 0Mar 2013L 64 76
50 6020.57 50 150 3000 121 5 0Apr 2013* 69 69
50 6021.23 50 50 3023 122 7 0May 2013 110 82
147 6019.45 147 147 2960 119 10 0Jun 2013 205 91
50 6019.43 50 50 2960 119 12 0Jul 2013 95 62
50 6019.30 50 50 2955 119 12 0Aug 2013 45 57
49 6019.29 49 49 2954 119 10 0Sep 2013 30 59
761 761 1647 75 0WY 2013 760 757
50 6019.48 50 50 2961 119 7 0Oct 2013 41 64
49 6019.83 49 49 2974 120 3 0Nov 2013 43 65
50 6020.14 50 50 2985 120 2 0Dec 2013 35 63
50 6020.64 50 50 3002 121 2 0Jan 2014 40 71
46 6021.29 46 46 3025 122 2 0Feb 2014 45 72
50 6022.89 50 50 3083 124 3 0Mar 2014 102 113
49 6024.81 49 49 3153 127 5 0Apr 2014 134 126
104 6027.20 104 104 3242 130 8 0May 2014 245 204
155 6029.52 155 155 3330 134 10 0Jun 2014 390 257
104 6030.41 104 104 3365 135 14 0Jul 2014 210 153
104 6029.88 104 104 3345 134 13 0Aug 2014 89 95
100 6029.26 100 100 3321 134 11 0Sep 2014 55 87
911 911 911 79 0WY 2014 1429 1370
104 6028.50 104 104 3291 132 7 0Oct 2014 59 81
100 6027.82 100 100 3266 131 3 0Nov 2014 51 77
104 6026.99 104 104 3234 130 2 0Dec 2014 35 73
104 6026.35 104 104 3210 129 2 0Jan 2015 40 80
94 6025.95 94 94 3195 129 2 0Feb 2015 45 80
104 6026.34 104 104 3210 129 3 0Mar 2015 102 122
100 6026.94 100 100 3232 130 5 0Apr 2015 134 128
* Based on the Colorado River Basin Forecast Center's Most Probable Water Supply Forecast Model Run ID: 2145 Processed On: 5/9/2013 12:32:23PM
Most Probable Inflow*
May 2013 24-Month Study
Taylor Park Reservoir
OPERATION PLAN FOR COLORADO RIVER SYSTEM RESERVOIRS
Reservoir Elev
End of Month
(Ft)
Live
Storage
(1000 Ac-Ft)
Total
Release
(1000 Ac-Ft)
Regulated
Inflow
(1000 Ac-Ft)Date
* May 2012 15 8 9316.40 81
H Jun 2012 9 15 9312.87 75
I Jul 2012 6 14 9307.53 66
S Aug 2012 4 12 9302.28 58
T Sep 2012 4 6 9300.80 56
WY 2012 80 95
O Oct 2012 4 4 9301.04 57
R Nov 2012 3 3 9301.07 57
I Dec 2012 3 3 9301.09 57
C Jan 2013 3 3 9301.07 57
A Feb 2013 3 3 9301.01 57
L Mar 2013 3 3 9301.27 57
* Apr 2013 6 4 9302.94 59
May 2013 18 6 9310.60 71
Jun 2013 28 13 9319.51 86
Jul 2013 13 15 9318.17 84
Aug 2013 8 15 9313.71 76
Sep 2013 5 12 9309.46 69
WY 2013 97 84
Oct 2013 5 5 9309.86 70
Nov 2013 5 5 9309.90 70
Dec 2013 5 5 9310.01 70
Jan 2014 4 5 9309.92 70
Feb 2014 4 5 9309.48 69
Mar 2014 4 5 9309.44 69
Apr 2014 9 12 9307.35 66
May 2014 28 16 9314.95 78
Jun 2014 42 20 9326.77 100
Jul 2014 20 20 9326.85 100
Aug 2014 10 20 9321.77 90
Sep 2014 7 20 9314.67 78
WY 2014 144 135
Oct 2014 7 14 9310.21 70
Nov 2014 5 6 9309.65 69
Dec 2014 5 6 9308.81 68
Jan 2015 4 6 9307.75 66
Feb 2015 4 6 9306.30 64
Mar 2015 4 6 9305.26 63
Apr 2015 9 6 9307.10 65
* Based on the Colorado River Basin Forecast Center's Most Probable Water Supply Forecast Model Run ID: 2145 Processed On: 5/9/2013 12:32:23PM
Most Probable Inflow*
May 2013 24-Month Study
Blue Mesa Reservoir
OPERATION PLAN FOR COLORADO RIVER SYSTEM RESERVOIRS
Reservoir Elev
End of Month
(Ft)
Live
Storage
(1000 Ac-Ft)
Total
Release
(1000 Ac-Ft)
Regulated
Inflow
(1000 Ac-Ft)Date
Evap
Losses
(1000 Ac-Ft)
Power
Release
(1000 Ac-Ft)
Bypass
Release
(1000 Ac-Ft)
UnReg
Inflow
(1000 Ac-Ft)
* May 2012 66 71 7482.82 527 1 71 0 74
H Jun 2012 50 93 7476.82 483 1 93 0 45
I Jul 2012 39 90 7469.29 431 1 90 0 30
S Aug 2012 36 79 7462.48 387 1 79 0 28
T Sep 2012 21 67 7454.82 340 1 67 0 19
WY 2012 442 793 7 793 0 427
O Oct 2012 20 33 7452.55 327 0 33 0 20
R Nov 2012 19 19 7452.39 326 0 19 0 19
I Dec 2012 18 16 7452.65 328 0 16 0 18
C Jan 2013 16 15 7452.77 328 0 15 0 16
A Feb 2013 16 15 7452.95 329 0 15 0 16
L Mar 2013 23 16 7454.12 336 0 0 23
* Apr 2013 41 38 7454.46 338 1 38 0 43
May 2013 94 62 7459.73 370 1 62 0 106
Jun 2013 115 70 7466.70 414 1 70 0 130
Jul 2013 58 95 7460.79 376 1 95 0 56
Aug 2013 43 95 7451.86 323 1 95 0 35
Sep 2013 35 69 7445.55 288 1 69 0 28
WY 2013 497 543 6 527 0 510
Oct 2013 31 43 7443.18 276 0 43 0 32
Nov 2013 28 14 7445.87 290 0 14 0 28
Dec 2013 25 15 7447.79 300 0 15 0 26
Jan 2014 24 15 7449.48 310 0 15 0 24
Feb 2014 23 13 7451.26 320 0 13 0 22
Mar 2014 36 16 7454.69 339 0 16 0 36
Apr 2014 80 28 7463.25 392 1 28 0 77
May 2014 209 118 7476.60 481 1 118 0 221
Jun 2014 239 36 7502.68 684 1 36 0 261
Jul 2014 117 94 7505.27 705 1 94 0 117
Aug 2014 73 121 7499.39 656 1 121 0 63
Sep 2014 51 89 7494.53 617 1 89 0 38
WY 2014 937 601 8 601 0 946
Oct 2014 46 52 7493.66 610 1 52 0 38
Nov 2014 32 23 7494.76 619 0 23 0 31
Dec 2014 27 64 7490.00 581 0 64 0 26
Jan 2015 26 67 7484.61 540 0 67 0 24
Feb 2015 25 60 7479.80 505 0 60 0 22
Mar 2015 38 32 7480.51 510 0 32 0 36
Apr 2015 74 54 7483.17 529 1 54 0 77
* Based on the Colorado River Basin Forecast Center's Most Probable Water Supply Forecast Model Run ID: 2145 Processed On: 5/9/2013 12:32:23PM
Most Probable Inflow*
May 2013 24-Month Study
Morrow Point Reservoir
OPERATION PLAN FOR COLORADO RIVER SYSTEM RESERVOIRS
Reservoir Elev
End of Month
(Ft)
Total
Release
(1000 Ac-Ft)
Blue Mesa
Release
(1000 Ac-Ft)Date
Side
Inflow
(1000 Ac-Ft)
Power
Release
(1000 Ac-Ft)
Bypass
Release
(1000 Ac-Ft)
Unreg
Inflow
(1000 Ac-Ft)
Live
Storage
(1000 Ac-Ft)
Total
Inflow
(1000 Ac-Ft)
76 112 7154.07 79 79 6 71 0May 2012* 80
93 113 7154.59 93 93 1 93 0Jun 2012H 45
90 114 7155.86 89 89 0 90 0Jul 2012I 31
80 113 7154.84 80 80 0 79 0Aug 2012S 28
68 109 7150.03 71 71 0 67 0Sep 2012T 19
814 811 811 21 793 0WY 2012 447
34 104 7142.80 40 40 1 33 0Oct 2012O 22
20 108 7148.49 16 16 1 19 0Nov 2012R 20
17 106 7146.50 18 18 1 16 0Dec 2012I 18
16 105 7144.75 17 17 1 15 0Jan 2013C 17
15 105 7144.30 16 16 1 15 0Feb 2013A 17
17 105 7144.36 17 17 1 16 0Mar 2013L 24
44 107 7146.71 42 42 6 38 0Apr 2013* 49
71 112 7153.73 66 66 9 62 0May 2013 115
78 112 7153.73 78 78 8 70 0Jun 2013 138
97 112 7153.73 97 97 2 95 0Jul 2013 58
98 112 7153.73 98 98 3 95 0Aug 2013 38
71 112 7153.73 71 71 2 69 0Sep 2013 30
578 575 575 35 543 0WY 2013 545
45 112 7153.73 45 45 2 43 0Oct 2013 34
16 112 7153.73 16 16 2 14 0Nov 2013 30
17 112 7153.73 17 17 2 15 0Dec 2013 28
17 112 7153.73 17 17 2 15 0Jan 2014 27
16 112 7153.73 16 16 3 13 0Feb 2014 25
20 112 7153.73 20 20 4 16 0Mar 2014 40
39 112 7153.73 39 39 11 28 0Apr 2014 88
144 112 7153.73 144 144 26 118 0May 2014 247
56 112 7153.73 56 56 20 36 0Jun 2014 281
100 112 7153.73 100 100 6 94 0Jul 2014 123
124 112 7153.73 124 124 3 121 0Aug 2014 67
92 112 7153.73 92 92 3 89 0Sep 2014 41
686 686 686 85 601 0WY 2014 1030
55 112 7153.73 55 55 3 52 0Oct 2014 41
25 112 7153.73 25 25 2 23 0Nov 2014 33
66 112 7153.73 66 66 2 64 0Dec 2014 28
69 112 7153.73 69 69 2 67 0Jan 2015 27
63 112 7153.73 63 63 3 60 0Feb 2015 25
36 112 7153.73 36 36 4 32 0Mar 2015 40
65 112 7153.73 65 65 11 54 0Apr 2015 88
* Based on the Colorado River Basin Forecast Center's Most Probable Water Supply Forecast Model Run ID: 2145 Processed On: 5/9/2013 12:32:23PM

Most Probable Inflow*
May 2013 24-Month Study
Crystal Reservoir
OPERATION PLAN FOR COLORADO RIVER SYSTEM RESERVOIRS
Reservoir Elev
End of Month
(Ft)
Live
Storage
(1000 Ac-Ft)
Total
Release
(1000 Ac-Ft)
Morrow
Release
(1000 Ac-Ft)Date
Total
Inflow
(1000 Ac-Ft)
Bypass
Release
(1000 Ac-Ft)
Below Tunnel
Flow
(1000 Ac-Ft)
Unreg
Inflow
(1000 Ac-Ft)
Tunnel
Flow
(1000 Ac-Ft)
Power
Release
(1000 Ac-Ft)
Side
Inflow
(1000 Ac-Ft)
86 65 6745.87 86 24 15 84 79 0May 2012* 86 6
97 63 6744.24 97 37 14 96 93 0Jun 2012H 49 3
93 62 6745.39 93 36 15 93 89 0Jul 2012I 35 4
84 52 6743.63 84 38 14 84 80 0Aug 2012S 32 3
63 45 6743.29 74 33 14 74 71 11Sep 2012T 22 2
824 397 862 497 862 811 38WY 2012 498 51
40 20 6750.72 40 20 16 42 40 0Oct 2012O 24 3
21 1 6746.77 21 19 15 19 16 0Nov 2012R 23 4
22 1 6749.11 22 20 16 22 18 0Dec 2012I 22 4
19 0 6747.09 21 20 15 21 17 2Jan 2013C 20 4
10 0 6745.57 19 19 15 19 16 9Feb 2013A 20 3
22 0 6744.50 22 22 15 21 17 0Mar 2013L 29 5
51 33 6738.38 51 20 13 49 42 0Apr 2013* 55 7
73 55 6753.04 73 18 17 78 66 0May 2013 127 12
90 60 6753.04 90 30 17 90 78 0Jun 2013 150 12
102 65 6753.04 102 37 17 102 97 0Jul 2013 63 5
101 65 6753.04 101 36 17 101 98 0Aug 2013 41 3
74 55 6753.04 74 19 17 74 71 0Sep 2013 33 3
623 355 635 282 638 575 12WY 2013 608 63
49 30 6753.04 49 19 17 49 45 0Oct 2013 38 4
20 0 6753.04 20 20 17 20 16 0Nov 2013 34 4
22 0 6753.04 22 22 17 22 17 0Dec 2013 32 5
22 0 6753.04 22 22 17 22 17 0Jan 2014 31 5
19 0 6753.04 19 19 17 19 16 0Feb 2014 29 4
26 5 6753.04 26 21 17 26 20 0Mar 2014 46 6
51 30 6753.04 51 21 17 51 39 0Apr 2014 101 12
134 55 6753.04 178 123 17 178 144 44May 2014 281 34
90 60 6753.04 90 30 17 90 56 0Jun 2014 315 34
114 65 6753.04 114 49 17 114 100 0Jul 2014 138 14
133 65 6753.04 133 68 17 133 124 0Aug 2014 75 8
98 55 6753.04 98 43 17 98 92 0Sep 2014 47 6
778 365 822 457 822 686 44WY 2014 1167 137
61 30 6753.04 61 31 17 61 55 0Oct 2014 47 6
30 0 6753.04 30 30 17 30 25 0Nov 2014 38 5
71 0 6753.04 71 71 17 71 66 0Dec 2014 32 5
74 0 6753.04 74 74 17 74 69 0Jan 2015 31 5
66 0 6753.04 66 66 17 66 63 0Feb 2015 29 4
42 5 6753.04 42 37 17 42 36 0Mar 2015 46 6
78 30 6753.04 78 48 17 78 65 0Apr 2015 101 12
* Based on the Colorado River Basin Forecast Center's Most Probable Water Supply Forecast Model Run ID: 2145 Processed On: 5/9/2013 12:32:23PM

Most Probable Inflow*
May 2013 24-Month Study
Vallecito Reservoir
OPERATION PLAN FOR COLORADO RIVER SYSTEM RESERVOIRS
Reservoir Elev
End of Month
(Ft)
Live
Storage
(1000 Ac-Ft)
Total
Release
(1000 Ac-Ft)
Regulated
Inflow
(1000 Ac-Ft)Date
* May 2012 42 35 7664.36 124
H Jun 2012 17 36 7656.80 104
I Jul 2012 11 35 7647.02 80
S Aug 2012 7 33 7634.93 54
T Sep 2012 4 22 7624.48 36
WY 2012 168 188
O Oct 2012 3 3 7624.51 36
R Nov 2012 3 1 7625.69 37
I Dec 2012 3 0 7627.33 40
C Jan 2013 3 0 7629.10 43
A Feb 2013 3 0 7630.60 46
L Mar 2013 4 0 7632.64 50
* Apr 2013 15 1 7639.26 63
May 2013 40 23 7646.85 80
Jun 2013 30 39 7642.87 70
Jul 2013 13 35 7631.58 48
Aug 2013 12 30 7620.06 29
Sep 2013 11 16 7616.35 24
WY 2013 141 149
Oct 2013 12 6 7620.69 30
Nov 2013 8 0 7625.63 37
Dec 2013 6 0 7629.20 43
Jan 2014 5 0 7632.01 48
Feb 2014 5 0 7634.33 53
Mar 2014 9 0 7638.39 61
Apr 2014 23 2 7648.00 82
May 2014 71 36 7661.80 117
Jun 2014 70 70 7661.76 117
Jul 2014 29 42 7656.72 104
Aug 2014 20 38 7649.23 85
Sep 2014 17 30 7643.84 73
WY 2014 276 225
Oct 2014 16 20 7641.77 68
Nov 2014 9 8 7641.95 68
Dec 2014 6 6 7641.95 68
Jan 2015 5 5 7641.91 68
Feb 2015 5 5 7641.95 68
Mar 2015 9 3 7644.36 74
Apr 2015 23 3 7652.84 94
* Based on the Colorado River Basin Forecast Center's Most Probable Water Supply Forecast Model Run ID: 2145 Processed On: 5/9/2013 12:32:23PM
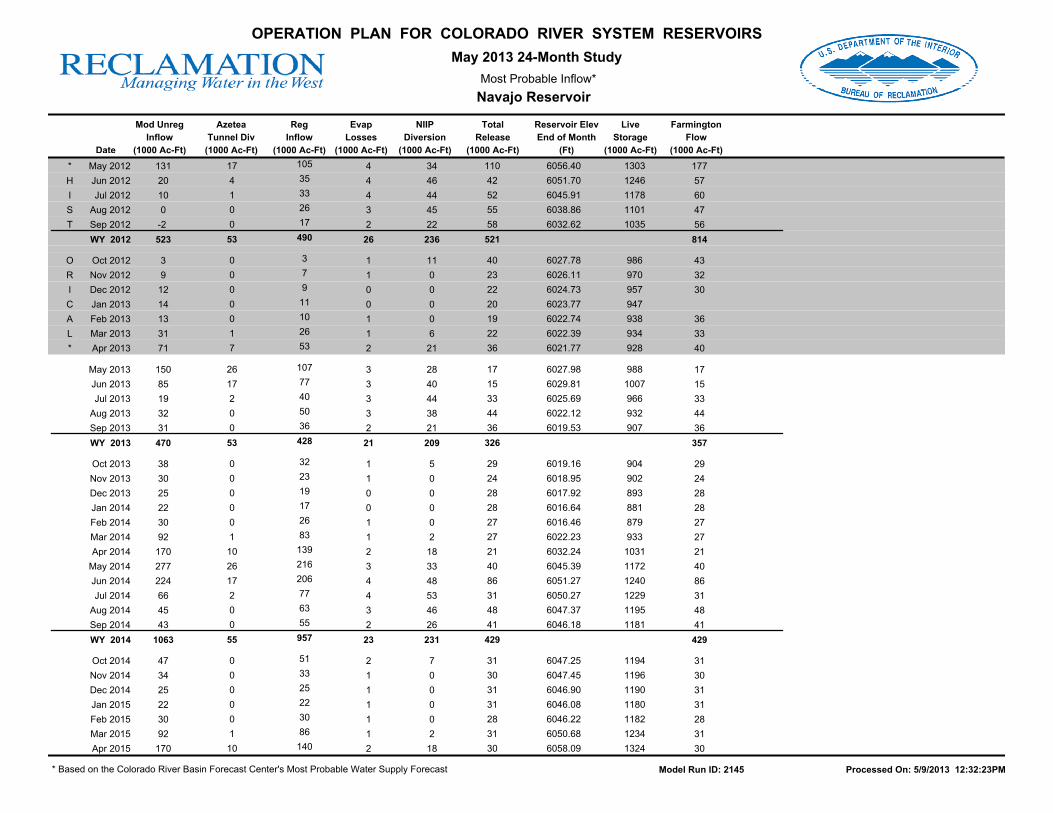
Most Probable Inflow*
May 2013 24-Month Study
Navajo Reservoir
OPERATION PLAN FOR COLORADO RIVER SYSTEM RESERVOIRS
Reservoir Elev
End of Month
(Ft)
Live
Storage
(1000 Ac-Ft)
Total
Release
(1000 Ac-Ft)
Azetea
Tunnel Div
(1000 Ac-Ft)Date
Reg
Inflow
(1000 Ac-Ft)
Evap
Losses
(1000 Ac-Ft)
NIIP
Diversion
(1000 Ac-Ft)
Mod Unreg
Inflow
(1000 Ac-Ft)
Farmington
Flow
(1000 Ac-Ft)
105 1303 6056.40 110 177 34 4 17 131May 2012*
35 1246 6051.70 42 57 46 4 4 20Jun 2012H
33 1178 6045.91 52 60 44 4 1 10Jul 2012I
26 1101 6038.86 55 47 45 3 0 0Aug 2012S
17 1035 6032.62 58 56 22 2 0-2Sep 2012T
490 521 814 236 26 53 523WY 2012
3 986 6027.78 40 43 11 1 0 3Oct 2012O
7 970 6026.11 23 32 0 1 0 9Nov 2012R
9 957 6024.73 22 30 0 0 0 12Dec 2012I
11 947 6023.77 20 0 0 0 14Jan 2013C
10 938 6022.74 19 36 0 1 0 13Feb 2013A
26 934 6022.39 22 33 6 1 1 31Mar 2013L
53 928 6021.77 36 40 21 2 7 71Apr 2013*
107 988 6027.98 17 17 28 3 26 150May 2013
77 1007 6029.81 15 15 40 3 17 85Jun 2013
40 966 6025.69 33 33 44 3 2 19Jul 2013
50 932 6022.12 44 44 38 3 0 32Aug 2013
36 907 6019.53 36 36 21 2 0 31Sep 2013
428 326 357 209 21 53 470WY 2013
32 904 6019.16 29 29 5 1 0 38Oct 2013
23 902 6018.95 24 24 0 1 0 30Nov 2013
19 893 6017.92 28 28 0 0 0 25Dec 2013
17 881 6016.64 28 28 0 0 0 22Jan 2014
26 879 6016.46 27 27 0 1 0 30Feb 2014
83 933 6022.23 27 27 2 1 1 92Mar 2014
139 1031 6032.24 21 21 18 2 10 170Apr 2014
216 1172 6045.39 40 40 33 3 26 277May 2014
206 1240 6051.27 86 86 48 4 17 224Jun 2014
77 1229 6050.27 31 31 53 4 2 66Jul 2014
63 1195 6047.37 48 48 46 3 0 45Aug 2014
55 1181 6046.18 41 41 26 2 0 43Sep 2014
957 429 429 231 23 55 1063WY 2014
51 1194 6047.25 31 31 7 2 0 47Oct 2014
33 1196 6047.45 30 30 0 1 0 34Nov 2014
25 1190 6046.90 31 31 0 1 0 25Dec 2014
22 1180 6046.08 31 31 0 1 0 22Jan 2015
30 1182 6046.22 28 28 0 1 0 30Feb 2015
86 1234 6050.68 31 31 2 1 1 92Mar 2015
140 1324 6058.09 30 30 18 2 10 170Apr 2015
* Based on the Colorado River Basin Forecast Center's Most Probable Water Supply Forecast Model Run ID: 2145 Processed On: 5/9/2013 12:32:23PM

Most Probable Inflow*
May 2013 24-Month Study
Lake Powell
OPERATION PLAN FOR COLORADO RIVER SYSTEM RESERVOIRS
Reservoir Elev
End of Month
(Ft)
Bank
Storage
(1000 Ac-Ft)
Total
Release
(1000 Ac-Ft)
Regulated
Inflow
(1000 Ac-Ft)Date
Evap
Losses
(1000 Ac-Ft)
Bypass
Release
(1000 Ac-Ft)
Lees
Ferry Gage
(1000 Ac-Ft)
Unreg
Inflow
(1000 Ac-Ft)
EOM
Storage
(1000 Ac-Ft)
PowerPlant
Release
(1000 Ac-Ft)
601 15632 3636.83 601 606 5304 35 770 0May 2012* 792
709 15294 3633.90 709 712 5277 54 398 0Jun 2012H 353
886 14680 3628.45 886 892 5228 62 285 0Jul 2012I 154
800 14151 3623.62 800 810 5186 60 289 0Aug 2012S 101
481 13929 3621.56 481 478 5168 54 296 0Sep 2012T 104
9466 9466 9527 455 5964 0WY 2012 4908
498 13706 3619.46 498 495 5150 37 294 0Oct 2012O 190
652 13251 3615.10 730 736 5114 35 273 78Nov 2012R 246
801 12713 3609.82 801 800 5071 27 247 0Dec 2012I 201
801 12177 3604.42 801 801 5028 8 230 0Jan 2013C 168
600 11891 3601.47 600 595 5005 9 300 0Feb 2013A 262
601 11651 3598.96 601 594 4986 14 357 0Mar 2013L 362
551 11422 3596.53 551 547 4967 22 326 0Apr 2013* 355
600 11358 3595.84 600 611 4962 26 557 0May 2013 750
800 11753 3600.03 800 811 4994 41 1268 0Jun 2013 1400
848 11435 3596.67 848 867 4968 50 554 0Jul 2013 500
800 10941 3591.33 800 821 4929 48 315 0Aug 2013 200
600 10611 3587.67 600 614 4903 43 287 0Sep 2013 200
8152 8230 8293 361 5007 78WY 2013 4835
600 10357 3584.81 600 611 4882 29 355 0Oct 2013 338
600 10125 3582.16 600 609 4864 28 377 0Nov 2013 393
800 9708 3577.27 800 812 4830 22 370 0Dec 2013 363
800 9302 3572.39 800 813 4798 6 368 0Jan 2014 361
600 9093 3569.82 600 610 4781 7 381 0Feb 2014 393
600 9018 3568.90 600 611 4775 11 531 0Mar 2014 665
600 9186 3570.97 600 612 4789 18 799 0Apr 2014 1056
600 10386 3585.14 600 611 4885 23 1919 0May 2014 2343
650 11723 3599.72 650 661 4992 40 2134 0Jun 2014 2666
850 11798 3600.51 850 869 4998 50 981 0Jul 2014 1091
900 11494 3597.30 900 921 4973 50 621 0Aug 2014 500
630 11357 3595.84 630 644 4962 45 528 0Sep 2014 408
8230 8230 8384 329 9365 0WY 2014 10576
600 11292 3595.14 600 611 4957 31 561 0Oct 2014 512
600 11181 3593.94 600 609 4948 30 510 0Nov 2014 473
800 10859 3590.42 800 812 4922 24 476 0Dec 2014 363
800 10552 3587.01 800 813 4898 7 476 0Jan 2015 361
600 10431 3585.65 600 610 4888 8 477 0Feb 2015 393
600 10423 3585.56 600 611 4888 13 604 0Mar 2015 665
600 10669 3588.32 600 612 4907 21 886 0Apr 2015 1056
* Based on the Colorado River Basin Forecast Center's Most Probable Water Supply Forecast Model Run ID: 2145 Processed On: 5/9/2013 12:32:23PM
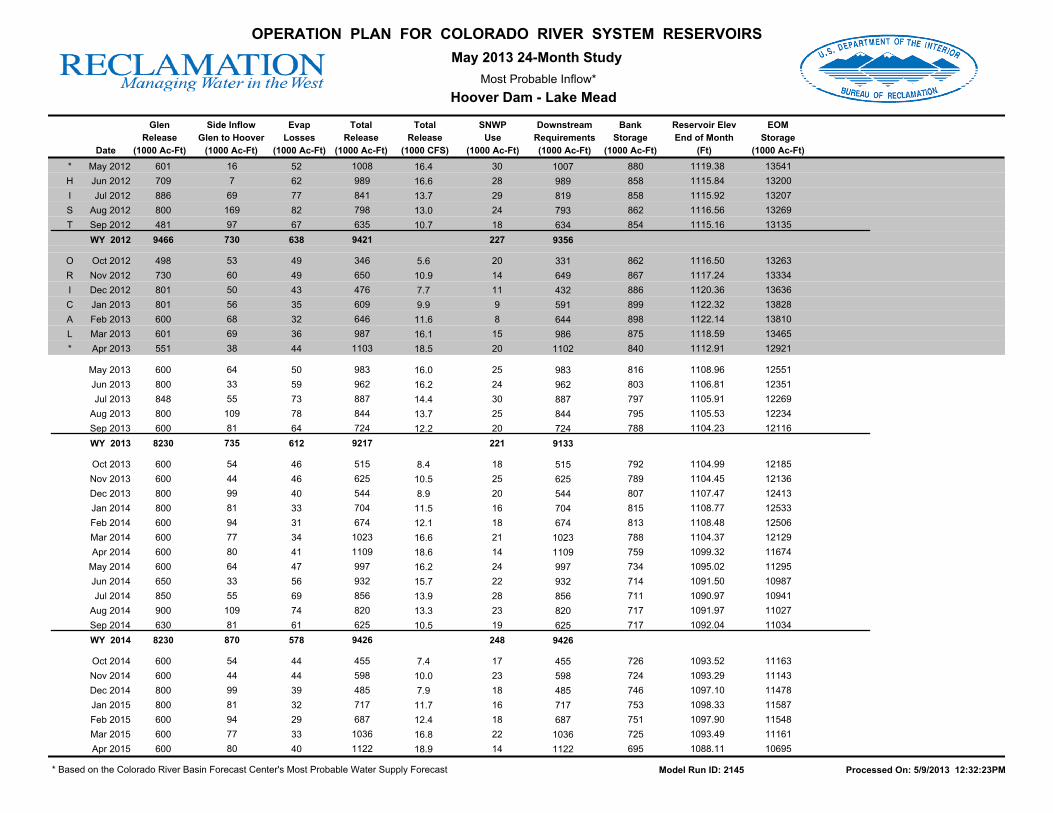
Most Probable Inflow*
May 2013 24-Month Study
Hoover Dam - Lake Mead
OPERATION PLAN FOR COLORADO RIVER SYSTEM RESERVOIRS
Reservoir Elev
End of Month
(Ft)
Bank
Storage
(1000 Ac-Ft)
SNWP
Use
(1000 Ac-Ft)
Side Inflow
Glen to Hoover
(1000 Ac-Ft)Date
Evap
Losses
(1000 Ac-Ft)
Total
Release
(1000 Ac-Ft)
Total
Release
(1000 CFS)
Glen
Release
(1000 Ac-Ft)
EOM
Storage
(1000 Ac-Ft)
Downstream
Requirements
(1000 Ac-Ft)
1007 13541 1119.38 1008 880 16.4 52 16 601May 2012* 30
989 13200 1115.84 989 858 16.6 62 7 709Jun 2012H 28
819 13207 1115.92 841 858 13.7 77 69 886Jul 2012I 29
793 13269 1116.56 798 862 13.0 82 169 800Aug 2012S 24
634 13135 1115.16 635 854 10.7 67 97 481Sep 2012T 18
9356 9421 638 730 9466WY 2012 227
331 13263 1116.50 346 862 5.6 49 53 498Oct 2012O 20
649 13334 1117.24 650 867 10.9 49 60 730Nov 2012R 14
432 13636 1120.36 476 886 7.7 43 50 801Dec 2012I 11
591 13828 1122.32 609 899 9.9 35 56 801Jan 2013C 9
644 13810 1122.14 646 898 11.6 32 68 600Feb 2013A 8
986 13465 1118.59 987 875 16.1 36 69 601Mar 2013L 15
1102 12921 1112.91 1103 840 18.5 44 38 551Apr 2013* 20
983 12551 1108.96 983 816 16.0 50 64 600May 2013 25
962 12351 1106.81 962 803 16.2 59 33 800Jun 2013 24
887 12269 1105.91 887 797 14.4 73 55 848Jul 2013 30
844 12234 1105.53 844 795 13.7 78 109 800Aug 2013 25
724 12116 1104.23 724 788 12.2 64 81 600Sep 2013 20
9133 9217 612 735 8230WY 2013 221
515 12185 1104.99 515 792 8.4 46 54 600Oct 2013 18
625 12136 1104.45 625 789 10.5 46 44 600Nov 2013 25
544 12413 1107.47 544 807 8.9 40 99 800Dec 2013 20
704 12533 1108.77 704 815 11.5 33 81 800Jan 2014 16
674 12506 1108.48 674 813 12.1 31 94 600Feb 2014 18
1023 12129 1104.37 1023 788 16.6 34 77 600Mar 2014 21
1109 11674 1099.32 1109 759 18.6 41 80 600Apr 2014 14
997 11295 1095.02 997 734 16.2 47 64 600May 2014 24
932 10987 1091.50 932 714 15.7 56 33 650Jun 2014 22
856 10941 1090.97 856 711 13.9 69 55 850Jul 2014 28
820 11027 1091.97 820 717 13.3 74 109 900Aug 2014 23
625 11034 1092.04 625 717 10.5 61 81 630Sep 2014 19
9426 9426 578 870 8230WY 2014 248
455 11163 1093.52 455 726 7.4 44 54 600Oct 2014 17
598 11143 1093.29 598 724 10.0 44 44 600Nov 2014 23
485 11478 1097.10 485 746 7.9 39 99 800Dec 2014 18
717 11587 1098.33 717 753 11.7 32 81 800Jan 2015 16
687 11548 1097.90 687 751 12.4 29 94 600Feb 2015 18
1036 11161 1093.49 1036 725 16.8 33 77 600Mar 2015 22
1122 10695 1088.11 1122 695 18.9 40 80 600Apr 2015 14
* Based on the Colorado River Basin Forecast Center's Most Probable Water Supply Forecast Model Run ID: 2145 Processed On: 5/9/2013 12:32:23PM
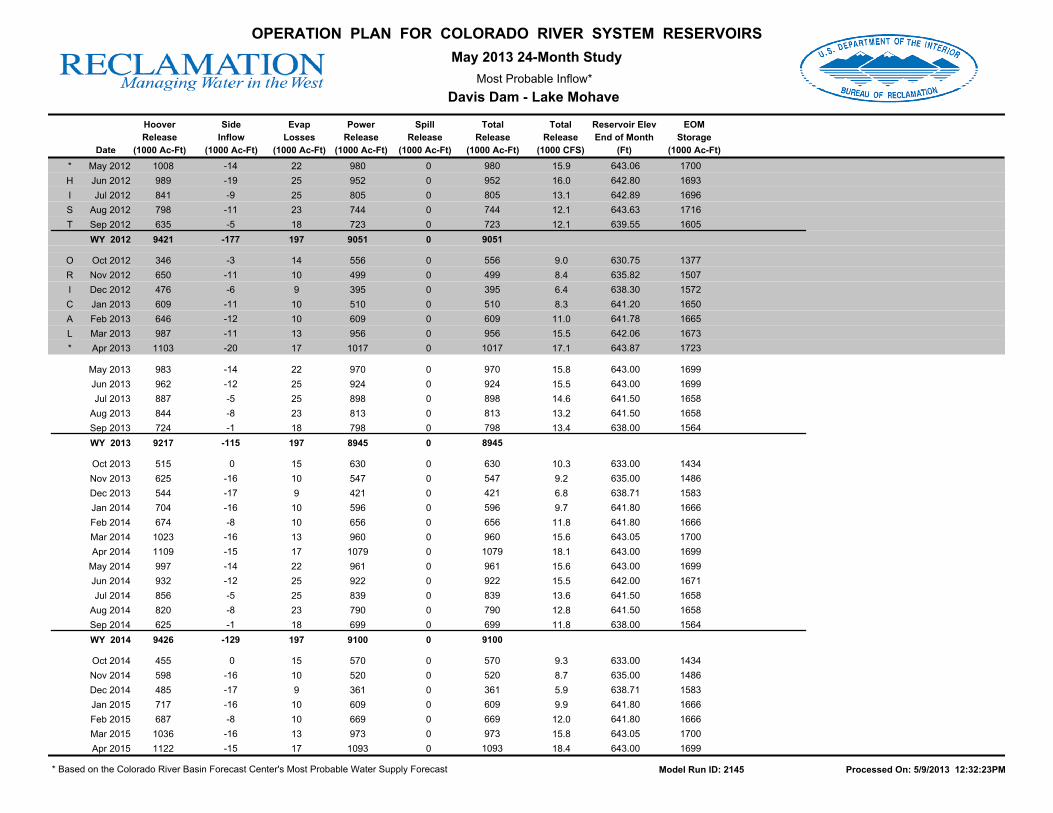
Most Probable Inflow*
May 2013 24-Month Study
Davis Dam - Lake Mohave
OPERATION PLAN FOR COLORADO RIVER SYSTEM RESERVOIRS
Reservoir Elev
End of Month
(Ft)
EOM
Storage
(1000 Ac-Ft)
Total
Release
(1000 Ac-Ft)
Side
Inflow
(1000 Ac-Ft)Date
Evap
Losses
(1000 Ac-Ft)
Power
Release
(1000 Ac-Ft)
Spill
Release
(1000 Ac-Ft)
Hoover
Release
(1000 Ac-Ft)
Total
Release
(1000 CFS)
15.9 1700 643.06 980 0 980 22-14 1008May 2012*
16.0 1693 642.80 952 0 952 25-19 989Jun 2012H
13.1 1696 642.89 805 0 805 25-9 841Jul 2012I
12.1 1716 643.63 744 0 744 23-11 798Aug 2012S
12.1 1605 639.55 723 0 723 18-5 635Sep 2012T
9051 0 9051 197-177 9421WY 2012
9.0 1377 630.75 556 0 556 14-3 346Oct 2012O
8.4 1507 635.82 499 0 499 10-11 650Nov 2012R
6.4 1572 638.30 395 0 395 9-6 476Dec 2012I
8.3 1650 641.20 510 0 510 10-11 609Jan 2013C
11.0 1665 641.78 609 0 609 10-12 646Feb 2013A
15.5 1673 642.06 956 0 956 13-11 987Mar 2013L
17.1 1723 643.87 1017 0 1017 17-20 1103Apr 2013*
15.8 1699 643.00 970 0 970 22-14 983May 2013
15.5 1699 643.00 924 0 924 25-12 962Jun 2013
14.6 1658 641.50 898 0 898 25-5 887Jul 2013
13.2 1658 641.50 813 0 813 23-8 844Aug 2013
13.4 1564 638.00 798 0 798 18-1 724Sep 2013
8945 0 8945 197-115 9217WY 2013
10.3 1434 633.00 630 0 630 15 0 515Oct 2013
9.2 1486 635.00 547 0 547 10-16 625Nov 2013
6.8 1583 638.71 421 0 421 9-17 544Dec 2013
9.7 1666 641.80 596 0 596 10-16 704Jan 2014
11.8 1666 641.80 656 0 656 10-8 674Feb 2014
15.6 1700 643.05 960 0 960 13-16 1023Mar 2014
18.1 1699 643.00 1079 0 1079 17-15 1109Apr 2014
15.6 1699 643.00 961 0 961 22-14 997May 2014
15.5 1671 642.00 922 0 922 25-12 932Jun 2014
13.6 1658 641.50 839 0 839 25-5 856Jul 2014
12.8 1658 641.50 790 0 790 23-8 820Aug 2014
11.8 1564 638.00 699 0 699 18-1 625Sep 2014
9100 0 9100 197-129 9426WY 2014
9.3 1434 633.00 570 0 570 15 0 455Oct 2014
8.7 1486 635.00 520 0 520 10-16 598Nov 2014
5.9 1583 638.71 361 0 361 9-17 485Dec 2014
9.9 1666 641.80 609 0 609 10-16 717Jan 2015
12.0 1666 641.80 669 0 669 10-8 687Feb 2015
15.8 1700 643.05 973 0 973 13-16 1036Mar 2015
18.4 1699 643.00 1093 0 1093 17-15 1122Apr 2015
* Based on the Colorado River Basin Forecast Center's Most Probable Water Supply Forecast Model Run ID: 2145 Processed On: 5/9/2013 12:32:23PM
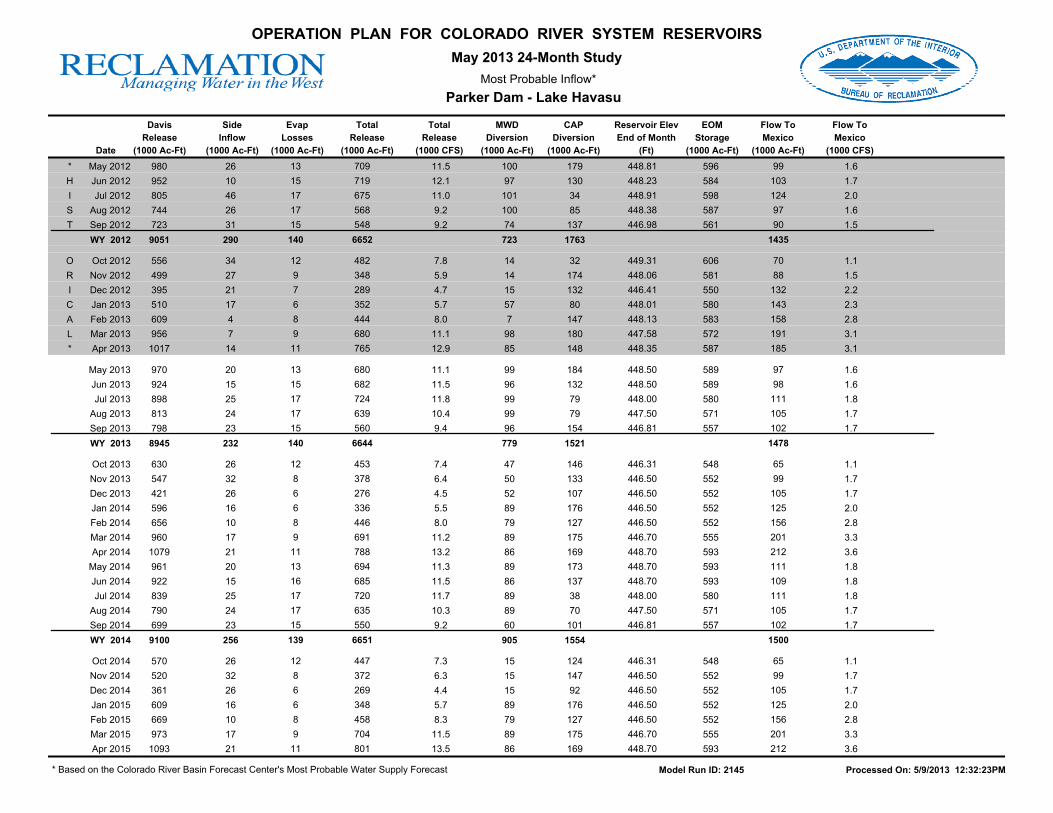
Most Probable Inflow*
May 2013 24-Month Study
Parker Dam - Lake Havasu
OPERATION PLAN FOR COLORADO RIVER SYSTEM RESERVOIRS
Reservoir Elev
End of Month
(Ft)
EOM
Storage
(1000 Ac-Ft)
Total
Release
(1000 Ac-Ft)
Evap
Losses
(1000 Ac-Ft)Date
CAP
Diversion
(1000 Ac-Ft)
MWD
Diversion
(1000 Ac-Ft)
Flow To
Mexico
(1000 CFS)
Davis
Release
(1000 Ac-Ft)
Flow To
Mexico
(1000 Ac-Ft)
Total
Release
(1000 CFS)
Side
Inflow
(1000 Ac-Ft)
11.5 99 448.81 709 1.6 596 179 13 100May 2012* 980 26
12.1 103 448.23 719 1.7 584 130 15 97Jun 2012H 952 10
11.0 124 448.91 675 2.0 598 34 17 101Jul 2012I 805 46
9.2 97 448.38 568 1.6 587 85 17 100Aug 2012S 744 26
9.2 90 446.98 548 1.5 561 137 15 74Sep 2012T 723 31
1435 6652 1763 140 723WY 2012 9051 290
7.8 70 449.31 482 1.1 606 32 12 14Oct 2012O 556 34
5.9 88 448.06 348 1.5 581 174 9 14Nov 2012R 499 27
4.7 132 446.41 289 2.2 550 132 7 15Dec 2012I 395 21
5.7 143 448.01 352 2.3 580 80 6 57Jan 2013C 510 17
8.0 158 448.13 444 2.8 583 147 8 7Feb 2013A 609 4
11.1 191 447.58 680 3.1 572 180 9 98Mar 2013L 956 7
12.9 185 448.35 765 3.1 587 148 11 85Apr 2013* 1017 14
11.1 97 448.50 680 1.6 589 184 13 99May 2013 970 20
11.5 98 448.50 682 1.6 589 132 15 96Jun 2013 924 15
11.8 111 448.00 724 1.8 580 79 17 99Jul 2013 898 25
10.4 105 447.50 639 1.7 571 79 17 99Aug 2013 813 24
9.4 102 446.81 560 1.7 557 154 15 96Sep 2013 798 23
1478 6644 1521 140 779WY 2013 8945 232
7.4 65 446.31 453 1.1 548 146 12 47Oct 2013 630 26
6.4 99 446.50 378 1.7 552 133 8 50Nov 2013 547 32
4.5 105 446.50 276 1.7 552 107 6 52Dec 2013 421 26
5.5 125 446.50 336 2.0 552 176 6 89Jan 2014 596 16
8.0 156 446.50 446 2.8 552 127 8 79Feb 2014 656 10
11.2 201 446.70 691 3.3 555 175 9 89Mar 2014 960 17
13.2 212 448.70 788 3.6 593 169 11 86Apr 2014 1079 21
11.3 111 448.70 694 1.8 593 173 13 89May 2014 961 20
11.5 109 448.70 685 1.8 593 137 16 86Jun 2014 922 15
11.7 111 448.00 720 1.8 580 38 17 89Jul 2014 839 25
10.3 105 447.50 635 1.7 571 70 17 89Aug 2014 790 24
9.2 102 446.81 550 1.7 557 101 15 60Sep 2014 699 23
1500 6651 1554 139 905WY 2014 9100 256
7.3 65 446.31 447 1.1 548 124 12 15Oct 2014 570 26
6.3 99 446.50 372 1.7 552 147 8 15Nov 2014 520 32
4.4 105 446.50 269 1.7 552 92 6 15Dec 2014 361 26
5.7 125 446.50 348 2.0 552 176 6 89Jan 2015 609 16
8.3 156 446.50 458 2.8 552 127 8 79Feb 2015 669 10
11.5 201 446.70 704 3.3 555 175 9 89Mar 2015 973 17
13.5 212 448.70 801 3.6 593 169 11 86Apr 2015 1093 21
* Based on the Colorado River Basin Forecast Center's Most Probable Water Supply Forecast Model Run ID: 2145 Processed On: 5/9/2013 12:32:23PM

Most Probable Inflow*
May 2013 24-Month Study
Hoover Dam - Lake Mead
OPERATION PLAN FOR COLORADO RIVER SYSTEM RESERVOIRS
Reservoir Elev
End of Month
(Ft)
Hoover
Gross Energy
MKWH
Hoover
Static Head
(Ft)
Power
Release
(1000 CFS)Date
Percent of
Units
Available KWH/AF
Change In
Storage
(1000 Ac-Ft)
Power
Release
(1000 Ac-Ft)
EOM
Storage
(1000 Ac-Ft)
Hoover Gen
Capacity
MW
1050.0 13541 1119.38 425.4 429.0-445 56 16.4 1008May 2012* 471.90
1829.0 13200 1115.84 418.8 414.2-341 100 16.6 989Jun 2012H 470.21
1374.0 13207 1115.92 415.6 349.7 8 76 13.7 841Jul 2012I 471.23
1809.0 13269 1116.56 415.2 331.4 61 100 13.0 798Aug 2012S 471.53
1809.0 13135 1115.16 412.2 261.9-134 100 10.7 635Sep 2012T 473.98
3985.6 9421WY 2012
1051.0 13263 1116.50 409.0 141.3 128 58 5.6 346Oct 2012O 476.50
1051.0 13334 1117.24 424.7 276.3 71 58 10.9 650Nov 2012R 473.22
1520.0 13636 1120.36 417.3 198.5 302 84 7.7 476Dec 2012I 475.06
1062.0 13828 1122.32 426.6 259.8 192 59 9.9 609Jan 2013C 474.10
1072.0 13810 1122.14 427.6 276.4-18 59 11.6 646Feb 2013A 475.07
1073.0 13465 1118.59 431.1 425.6-346 59 16.1 987Mar 2013L 472.93
1042.0 12921 1112.91 423.9 467.6-544 57 18.5 1103Apr 2013* 463.52
1353.0 12551 1108.96 420.8 413.6-370 75 16.0 983May 2013 459.69
1746.0 12351 1106.81 403.0 387.6-199 100 16.2 962Jun 2013 454.18
1739.0 12269 1105.91 412.4 365.9-82 100 14.4 887Jul 2013 453.16
1736.0 12234 1105.53 409.9 345.9-35 100 13.7 844Aug 2013 453.01
1730.0 12116 1104.23 404.1 292.4-118 100 12.2 724Sep 2013 453.32
3850.9 9217WY 2013
1423.0 12185 1104.99 407.6 210.1 69 82 8.4 515Oct 2013 457.09
1372.0 12136 1104.45 403.3 252.0-49 80 10.5 625Nov 2013 459.13
1356.0 12413 1107.47 399.5 217.5 276 79 8.9 544Dec 2013 458.62
780.0 12533 1108.77 425.4 299.6 120 45 11.5 704Jan 2014 462.24
1517.0 12506 1108.48 408.8 275.6-27 88 12.1 674Feb 2014 457.05
1428.0 12129 1104.37 409.8 419.2-377 84 16.6 1023Mar 2014 454.89
701.0 11674 1099.32 442.0 447.6-455 42 17.0 1013Apr 2014 454.06
1116.0 11295 1095.02 408.0 406.9-380 68 16.2 997May 2014 447.04
1623.0 10987 1091.50 397.0 370.2-308 100 15.7 932Jun 2014 439.99
1617.0 10941 1090.97 398.4 340.9-46 100 13.9 856Jul 2014 438.48
1617.0 11027 1091.97 396.9 325.6 86 100 13.3 820Aug 2014 438.87
1615.0 11034 1092.04 386.1 241.4 6 100 10.5 625Sep 2014 440.54
3806.4 9329WY 2014
1353.7 11163 1093.52 392.8 178.6 129 82 7.4 455Oct 2014 445.33
1310.2 11143 1093.29 398.9 238.5-20 80 10.0 598Nov 2014 447.87
1307.3 11478 1097.10 398.4 193.3 335 79 7.9 485Dec 2014 447.91
980.4 11587 1098.33 408.9 293.3 109 59 11.7 717Jan 2015 450.37
1461.4 11548 1097.90 401.5 275.8-38 88 12.4 687Feb 2015 446.61
1374.2 11161 1093.49 401.6 415.9-388 84 16.8 1036Mar 2015 444.23
918.6 10695 1088.11 419.7 471.1-466 57 18.9 1122Apr 2015 441.86
* Based on the Colorado River Basin Forecast Center's Most Probable Water Supply Forecast Model Run ID: 2145 Processed On: 5/9/2013 12:32:23PM

Most Probable Inflow*
May 2013 24-Month Study
Davis Dam - Lake Mohave
OPERATION PLAN FOR COLORADO RIVER SYSTEM RESERVOIRS
Reservoir Elev
End of Month
(Ft)
Davis
Gross Energy
MKWH
Davis
Static Head
(Ft)
Power
Release
(1000 CFS)Date
Percent of
Units
Available KWH/AF
Change In
Storage
(1000 Ac-Ft)
Power
Release
(1000 Ac-Ft)
EOM
Storage
(1000 Ac-Ft)
Davis Gen
Capacity
MW
252.5 1700 131.5 128.9-8 99 15.9 980May 2012* 141.39 643.06
255.0 1693 128.8 122.6-7 100 16.0 952Jun 2012H 140.12 642.80
255.0 1696 125.1 100.7 2 100 13.1 805Jul 2012I 143.36 642.89
252.5 1716 124.3 92.5 20 99 12.1 744Aug 2012S 142.43 643.63
255.0 1605 133.5 96.5-111 100 12.1 723Sep 2012T 137.86 639.55
1153.5 9051WY 2012
206.6 1377 123.3 68.5-228 81 9.0 556Oct 2012O 130.98 630.75
168.3 1507 136.0 67.9 130 66 8.4 499Nov 2012R 136.16 635.82
183.6 1572 111.7 44.1 65 72 6.4 395Dec 2012I 134.78 638.30
163.2 1650 123.8 63.2 78 64 8.3 510Jan 2013C 139.33 641.20
153.0 1665 126.1 76.8 16 60 11.0 609Feb 2013A 138.67 641.78
191.3 1673 125.8 120.2 8 75 15.5 956Mar 2013L 140.26 642.06
252.5 1723 126.3 128.5 49 99 17.1 1017Apr 2013* 142.09 643.87
244.8 1699 125.4 121.7-24 96 15.8 970May 2013 136.73 643.00
247.4 1699 125.1 115.6 0 97 15.5 924Jun 2013 136.24 643.00
249.9 1658 124.7 112.0-41 98 14.6 898Jul 2013 135.39 641.50
255.0 1658 124.5 101.2 0 100 13.2 813Aug 2013 134.46 641.50
255.0 1564 122.9 98.0-94 100 13.4 798Sep 2013 132.62 638.00
1117.8 8945WY 2013
214.2 1434 120.1 75.7-130 84 10.3 630Oct 2013 129.33 633.00
211.7 1486 119.2 65.2 51 83 9.2 547Nov 2013 127.83 635.00
209.1 1583 122.7 51.6 97 82 6.8 421Dec 2013 130.91 638.71
209.1 1666 124.6 74.3 83 82 9.7 596Jan 2014 134.46 641.80
209.1 1666 125.3 82.2 0 82 11.8 656Feb 2014 136.08 641.80
255.0 1700 124.6 119.6 34 100 15.6 960Mar 2014 135.44 643.05
255.0 1699 124.4 134.2-2 100 18.1 1079Apr 2014 136.07 643.00
255.0 1699 125.1 120.2 0 100 15.6 961May 2014 136.04 643.00
255.0 1671 124.7 114.9-27 100 15.5 922Jun 2014 135.51 642.00
255.0 1658 124.6 104.5-14 100 13.6 839Jul 2014 134.73 641.50
255.0 1658 124.6 98.4 0 100 12.8 790Aug 2014 134.46 641.50
255.0 1564 123.4 86.3-94 100 11.8 699Sep 2014 132.62 638.00
1127.1 9100WY 2014
214.2 1434 120.5 68.6-130 84 9.3 570Oct 2014 129.33 633.00
211.7 1486 119.4 62.1 51 83 8.7 520Nov 2014 127.83 635.00
209.1 1583 123.1 44.5 97 82 5.9 361Dec 2014 130.91 638.71
209.1 1666 124.5 75.8 83 82 9.9 609Jan 2015 134.46 641.80
209.1 1666 125.2 83.7 0 82 12.0 669Feb 2015 136.08 641.80
255.0 1700 124.5 121.1 34 100 15.8 973Mar 2015 135.44 643.05
255.0 1699 124.3 135.8-2 100 18.4 1093Apr 2015 136.07 643.00
* Based on the Colorado River Basin Forecast Center's Most Probable Water Supply Forecast Model Run ID: 2145 Processed On: 5/9/2013 12:32:23PM

Most Probable Inflow*
May 2013 24-Month Study
Parker Dam - Lake Havasu
OPERATION PLAN FOR COLORADO RIVER SYSTEM RESERVOIRS
Reservoir Elev
End of Month
(Ft)
Parker
Gross Energy
MKWH
Parker
Static Head
(Ft)
Power
Release
(1000 CFS)Date
Percent of
Units
Available KWH/AF
Change In
Storage
(1000 Ac-Ft)
Power
Release
(1000 Ac-Ft)
EOM
Storage
(1000 Ac-Ft)
Parker Gen
Capacity
MW
111.6 596 448.81 69.9 49.6-6 93 11.5 709May 2012* 81.37
120.0 584 448.23 69.1 49.7-11 100 12.1 719Jun 2012H 79.00
120.0 598 448.91 69.4 46.8 13 100 11.0 675Jul 2012I 82.94
120.0 587 448.38 69.2 39.3-10 100 9.2 568Aug 2012S 80.54
120.0 561 446.98 69.0 37.8-26 100 9.2 548Sep 2012T 81.05
458.2 6652WY 2012
96.0 606 449.31 69.0 33.3 44 80 7.8 482Oct 2012O 83.52
92.4 581 448.06 69.2 24.1-24 77 5.9 348Nov 2012R 82.22
103.2 550 446.41 67.5 19.5-31 86 4.7 289Dec 2012I 80.98
102.0 580 448.01 69.4 24.4 30 85 5.7 352Jan 2013C 83.56
115.2 583 448.13 70.1 31.2 2 96 8.0 444Feb 2013A 80.52
120.0 572 447.58 68.9 46.8-10 100 11.1 680Mar 2013L 81.73
97.2 587 448.35 66.8 51.1 15 81 12.9 765Apr 2013* 82.42
111.6 589 448.50 66.6 45.3 3 93 11.1 680May 2013 76.15
120.0 589 448.50 66.3 45.2 0 100 11.5 682Jun 2013 75.86
120.0 580 448.00 66.2 47.9-9 100 11.8 724Jul 2013 75.61
120.0 571 447.50 65.6 41.9-10 100 10.4 639Aug 2013 75.13
120.0 557 446.81 64.9 36.3-13 100 9.4 560Sep 2013 74.55
447.0 6644WY 2013
90.0 548 446.31 65.2 29.5-9 75 7.4 453Oct 2013 75.37
92.4 552 446.50 64.5 24.4 3 77 6.4 378Nov 2013 75.10
90.0 552 446.50 63.2 17.5 0 75 4.5 276Dec 2013 75.32
92.4 552 446.50 64.0 21.5 0 77 5.5 336Jan 2014 75.19
93.6 552 446.50 65.2 29.1 0 78 8.0 446Feb 2014 75.13
90.0 555 446.70 66.3 45.8 4 75 11.2 691Mar 2014 75.42
114.0 593 448.70 66.3 52.2 38 95 13.2 788Apr 2014 75.34
120.0 593 448.70 66.5 46.1 0 100 11.3 694May 2014 76.05
120.0 593 448.70 66.5 45.6 0 100 11.5 685Jun 2014 76.05
120.0 580 448.00 66.3 47.7-13 100 11.7 720Jul 2014 75.71
120.0 571 447.50 65.6 41.6-9 100 10.3 635Aug 2014 75.13
120.0 557 446.81 64.9 35.7-13 100 9.2 550Sep 2014 74.55
436.7 6651WY 2014
102.0 548 446.31 64.6 28.9-9 85 7.3 447Oct 2014 74.77
102.0 552 446.50 64.0 23.8 3 85 6.3 372Nov 2014 74.62
102.0 552 446.50 62.6 16.9 0 85 4.4 269Dec 2014 74.71
102.0 552 446.50 63.7 22.2 0 85 5.7 348Jan 2015 74.71
120.0 552 446.50 64.2 29.4 0 100 8.3 458Feb 2015 73.92
120.0 555 446.70 64.9 45.7 4 100 11.5 704Mar 2015 74.01
120.0 593 448.70 66.0 52.9 38 100 13.5 801Apr 2015 75.08
* Based on the Colorado River Basin Forecast Center's Most Probable Water Supply Forecast Model Run ID: 2145 Processed On: 5/9/2013 12:32:23PM
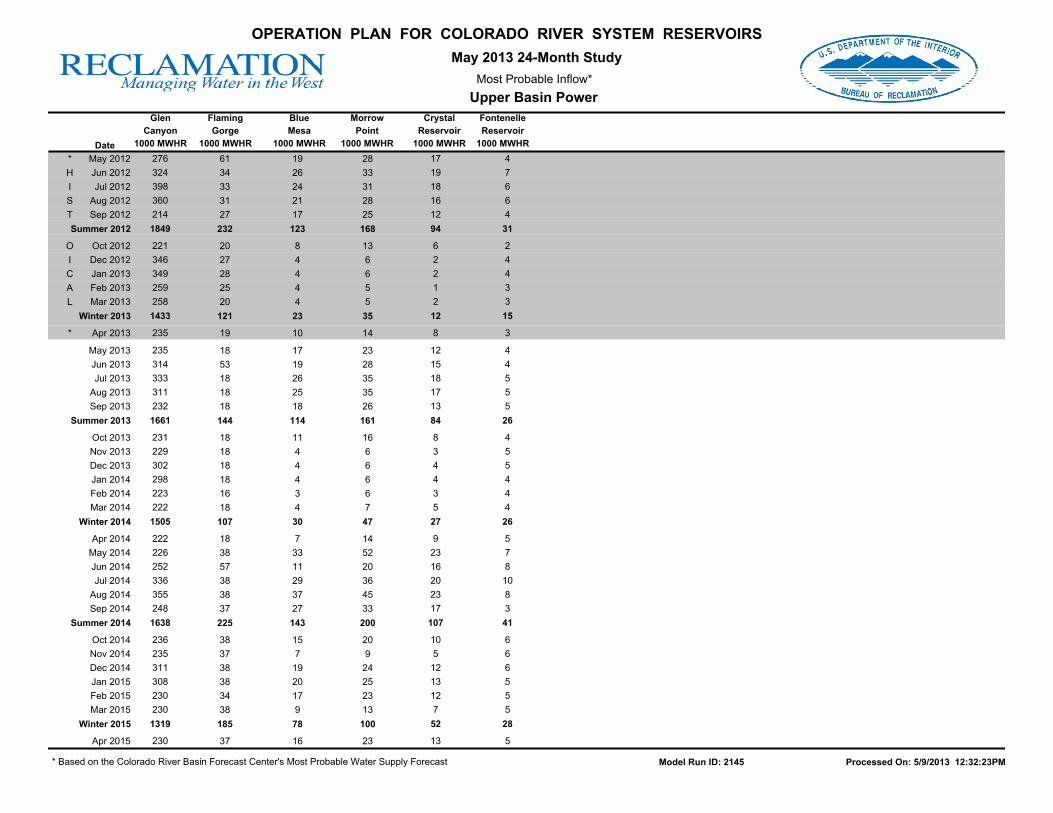
Most Probable Inflow*
May 2013 24-Month Study
Upper Basin Power
OPERATION PLAN FOR COLORADO RIVER SYSTEM RESERVOIRS
Fontenelle
Reservoir
1000 MWHR
Crystal
Reservoir
1000 MWHR
Glen
Canyon
1000 MWHRDate
Flaming
Gorge
1000 MWHR
Blue
Mesa
1000 MWHR
Morrow
Point
1000 MWHR
276 17 4 61 19 28May 2012*
324 19 7 34 26 33Jun 2012H
398 18 6 33 24 31Jul 2012I
360 16 6 31 21 28Aug 2012S
214 12 4 27 17 25Sep 2012T
1849 94 31 232 123 168Summer 2012
221 6 2 20 8 13Oct 2012O
346 2 4 27 4 6Dec 2012I
349 2 4 28 4 6Jan 2013C
259 1 3 25 4 5Feb 2013A
258 2 3 20 4 5Mar 2013L
1433 12 15 121 23 35Winter 2013
235 8 3 19 10 14Apr 2013*
235 12 4 18 17 23May 2013
314 15 4 53 19 28Jun 2013
333 18 5 18 26 35Jul 2013
311 17 5 18 25 35Aug 2013
232 13 5 18 18 26Sep 2013
1661 84 26 144 114 161Summer 2013
231 8 4 18 11 16Oct 2013
229 3 5 18 4 6Nov 2013
302 4 5 18 4 6Dec 2013
298 4 4 18 4 6Jan 2014
223 3 4 16 3 6Feb 2014
222 5 4 18 4 7Mar 2014
1505 27 26 107 30 47Winter 2014
222 9 5 18 7 14Apr 2014
226 23 7 38 33 52May 2014
252 16 8 57 11 20Jun 2014
336 20 10 38 29 36Jul 2014
355 23 8 38 37 45Aug 2014
248 17 3 37 27 33Sep 2014
1638 107 41 225 143 200Summer 2014
236 10 6 38 15 20Oct 2014
235 5 6 37 7 9Nov 2014
311 12 6 38 19 24Dec 2014
308 13 5 38 20 25Jan 2015
230 12 5 34 17 23Feb 2015
230 7 5 38 9 13Mar 2015
1319 52 28 185 78 100Winter 2015
230 13 5 37 16 23Apr 2015
* Based on the Colorado River Basin Forecast Center's Most Probable Water Supply Forecast Model Run ID: 2145 Processed On: 5/9/2013 12:32:23PM
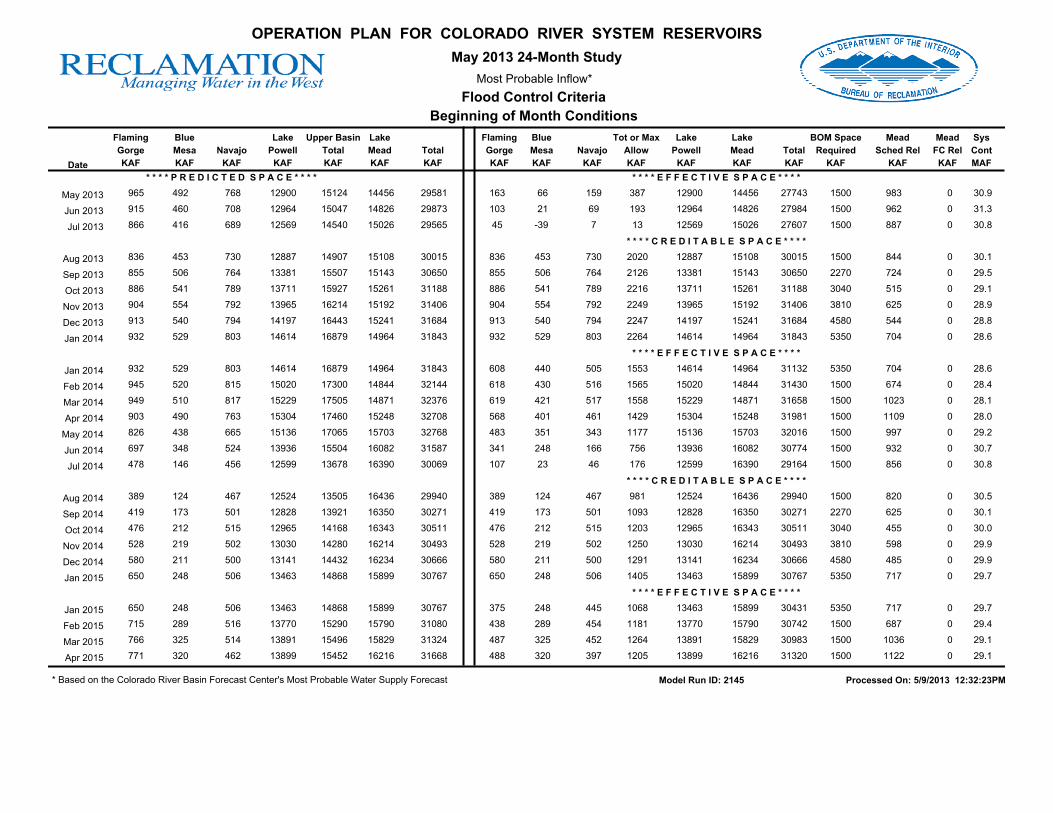
Most Probable Inflow*
May 2013 24-Month Study
Flood Control Criteria
Beginning of Month Conditions
OPERATION PLAN FOR COLORADO RIVER SYSTEM RESERVOIRS
Navajo
KAFDate
Flaming
Gorge
KAF
Blue
Mesa
KAF
Lake
Powell
KAF
Upper Basin
Total
KAF
Lake
Mead
KAF
Total
KAF
Flaming
Gorge
KAF
Blue
Mesa
KAF
Navajo
KAF
Lake
Powell
KAF
Tot or Max
Allow
KAF
Lake
Mead
KAF
Total
KAF
BOM Space
Required
KAF
Mead
Sched Rel
KAF
Mead
FC Rel
KAF
Sys
Cont
MAF
* * * * P R E D I C T E D S P A C E * * * * * * * * E F F E C T I V E S P A C E * * * *
965 492 768 12900 15124 14456 29581 163 66 159 387 12900 14456 27743 1500 983 0 30.9May 2013
915 460 708 12964 15047 14826 29873 103 21 69 193 12964 14826 27984 1500 962 0 31.3Jun 2013
866 416 689 12569 14540 15026 29565 45 -39 7 13 12569 15026 27607 1500 887 0 30.8Jul 2013
* * * * C R E D I T A B L E S P A C E * * * *
836 453 730 12887 14907 15108 30015 836 453 730 2020 12887 15108 30015 1500 844 0 30.1Aug 2013
855 506 764 13381 15507 15143 30650 855 506 764 2126 13381 15143 30650 2270 724 0 29.5Sep 2013
886 541 789 13711 15927 15261 31188 886 541 789 2216 13711 15261 31188 3040 515 0 29.1Oct 2013
904 554 792 13965 16214 15192 31406 904 554 792 2249 13965 15192 31406 3810 625 0 28.9Nov 2013
913 540 794 14197 16443 15241 31684 913 540 794 2247 14197 15241 31684 4580 544 0 28.8Dec 2013
932 529 803 14614 16879 14964 31843 932 529 803 2264 14614 14964 31843 5350 704 0 28.6Jan 2014
* * * * E F F E C T I V E S P A C E * * * *
932 529 803 14614 16879 14964 31843 608 440 505 1553 14614 14964 31132 5350 704 0 28.6Jan 2014
945 520 815 15020 17300 14844 32144 618 430 516 1565 15020 14844 31430 1500 674 0 28.4Feb 2014
949 510 817 15229 17505 14871 32376 619 421 517 1558 15229 14871 31658 1500 1023 0 28.1Mar 2014
903 490 763 15304 17460 15248 32708 568 401 461 1429 15304 15248 31981 1500 1109 0 28.0Apr 2014
826 438 665 15136 17065 15703 32768 483 351 343 1177 15136 15703 32016 1500 997 0 29.2May 2014
697 348 524 13936 15504 16082 31587 341 248 166 756 13936 16082 30774 1500 932 0 30.7Jun 2014
478 146 456 12599 13678 16390 30069 107 23 46 176 12599 16390 29164 1500 856 0 30.8Jul 2014
* * * * C R E D I T A B L E S P A C E * * * *
389 124 467 12524 13505 16436 29940 389 124 467 981 12524 16436 29940 1500 820 0 30.5Aug 2014
419 173 501 12828 13921 16350 30271 419 173 501 1093 12828 16350 30271 2270 625 0 30.1Sep 2014
476 212 515 12965 14168 16343 30511 476 212 515 1203 12965 16343 30511 3040 455 0 30.0Oct 2014
528 219 502 13030 14280 16214 30493 528 219 502 1250 13030 16214 30493 3810 598 0 29.9Nov 2014
580 211 500 13141 14432 16234 30666 580 211 500 1291 13141 16234 30666 4580 485 0 29.9Dec 2014
650 248 506 13463 14868 15899 30767 650 248 506 1405 13463 15899 30767 5350 717 0 29.7Jan 2015
* * * * E F F E C T I V E S P A C E * * * *
650 248 506 13463 14868 15899 30767 375 248 445 1068 13463 15899 30431 5350 717 0 29.7Jan 2015
715 289 516 13770 15290 15790 31080 438 289 454 1181 13770 15790 30742 1500 687 0 29.4Feb 2015
766 325 514 13891 15496 15829 31324 487 325 452 1264 13891 15829 30983 1500 1036 0 29.1Mar 2015
771 320 462 13899 15452 16216 31668 488 320 397 1205 13899 16216 31320 1500 1122 0 29.1Apr 2015
* Based on the Colorado River Basin Forecast Center's Most Probable Water Supply Forecast Model Run ID: 2145 Processed On: 5/9/2013 12:32:23PM