maximizing energy savings with cfls: don’t bench your superstar
TRANSCRIPT

Maximizing Energy Savings With CFLs:
Don’t Bench Your Superstar
Maximizing Energy Savings With CFLs:
Don’t Bench Your Superstar
Presented by:
Stephen BickelD&R International, Ltd.

Overview• CFLs are the superstar• Why coaches say they want to bench them • Taking another look at the game tapes• New game plan
2

CFLs are the efficiency equivalent of LeBron James
QuickTime™ and aTIFF (Uncompressed) decompressor
are needed to see this picture.

4
CFLs Have Delivered forEnergy Efficiency Program Sponsors
Source: D&R International, based on contact with ENERGY STAR Partners.
Program Sponsor Share of total DSM savings from CFL Programs
NYSERDA 84%
Wisconsin Focus on Energy 64%
Pacific Gas and Electric 62%
5
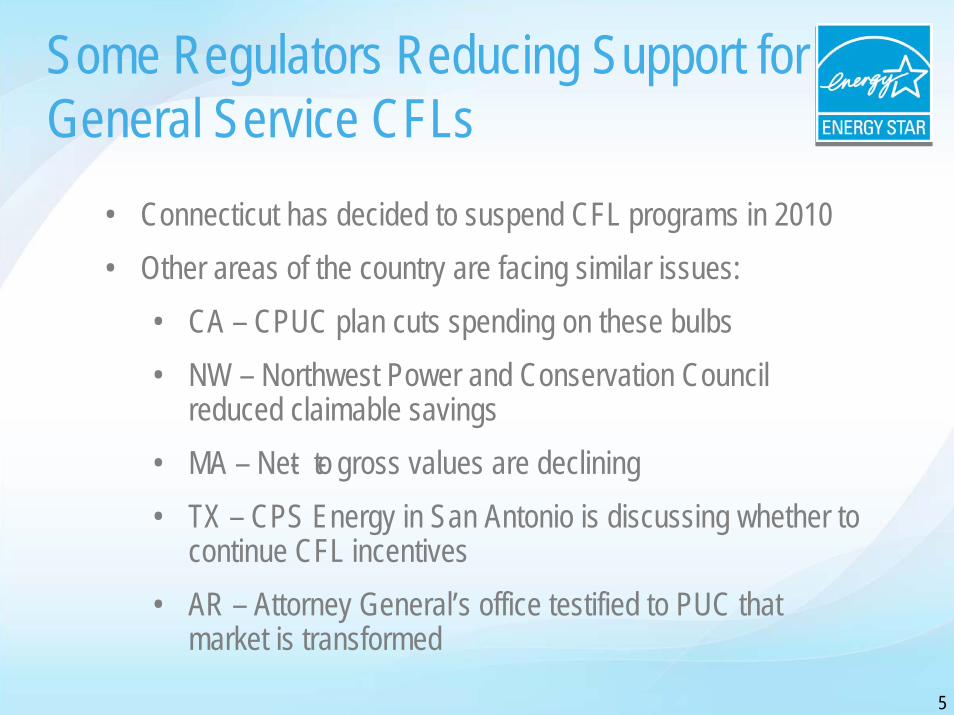
Some Regulators Reducing Support for General Service CFLs
• Connecticut has decided to suspend CFL programs in 2010• Other areas of the country are facing similar issues:
• CA – CPUC plan cuts spending on these bulbs• NW – Northwest Power and Conservation Council
reduced claimable savings• MA – Net- to- gross values are declining• TX – CPS Energy in San Antonio is discussing whether to
continue CFL incentives• AR – Attorney General’s office testified to PUC that
market is transformed

6
Reasons for Proposed Reductions
• Captured most of the general service CFL savings already, remaining sockets require specialty bulbs
• It is a better investment to bring down cost of LEDs, specialty bulbs, and “super CFL”
• General service CFL market no longer needs support, as market is transformed
• EISA will complete remaining market transformation • Need utilities to begin building capacity to deliver big savings
from other sources and not delay while relying on CFLs

Misconception
We have captured most of the general service CFL savings already.
7

We have captured only a fraction of CFLs’savings potential
8Sources: California - “Residential Lighting Metering Study – Preliminary Results,” KEMA, February 2009National – D&R International, estimate for 2008.
70% of potential remains untapped
Avg sockets/home ~40
CFL potential ~31
Filled ~6-8

Misconception
Most of the remaining savings will come from specialty bulbs.
9

More than half of remaining potential is for general service CFLs
10Sources: “Residential Lighting Metering Study – Preliminary Results,” KEMA, February 2009 [California]
53%
32%
14%
Even inmature markets
53% of potential is general service
CFLs

Fewer sockets require specialtybulbs than most people think
11
• California 2009 Inventory Data
Source: “Residential Lighting Metering Study – Preliminary Results,” KEMA, February 2009 [California]
Control Type Percent of Sockets
On/Off 85%Dimmer 12%3-Way 3%
Base Type Percent of Sockets
Medium Screw 69%
Pin 19%
Small Screw 10%
Other 2%

Misconception
Stored CFLs will capture much of the remaining savings.
12

13
Most stored CFLs are unlikely to replace incandescents in high-use sockets
• Failed bulbs in low saturation homes more likely to be replaced with incandescents
• CFL “adopters” have not abandoned incandescents
Number of CFLsInstalled
Socket Saturation%
CFLs Stored Incandescent Lamps Stored
0 0 0.17 6.61
1-10 2.5 - 25 1.97 6.69
More than 10 >25 6.75 7.15
Sources: “Residential Lighting Metering Study – Preliminary Results,” KEMA, February 2009 [California]* 27% - Northwest Energy Efficiency Alliance, “Consumer Product Market Progress Evaluation Report 3,” 2007
Households are storing about1/4 of purchased
CFLs*

Misconception
LEDs will soon deliver more energy savings and are a better investment than CFLs.
14

High volume sales of replacement LED lamps are still some years off
15
• ENERGY STAR LED Replacement Criteria
• Final Criteria - October 2009
• Earliest Possible Effective Date - July 2010
• Expect few products at first with momentum building in 2011 as the technology matures, as was the case for SSL Luminaire program
• First cost will be big barrier – price points on some products are $50/unit
• Current non- ENERGY STAR products could damage market

Current LED replacement lamps perform poorly compared to CFLs
As measured by the DOE CALiPER Program Cycle 8http://apps1.eere.energy.gov/buildings/publications/pdfs/ssl/caliper_round_8_summary_final.pdf
MR-16 and directional lamps are closer, but still not there
16
Misconception
We must use sophisticated segmentation to capture remaining savings.
17
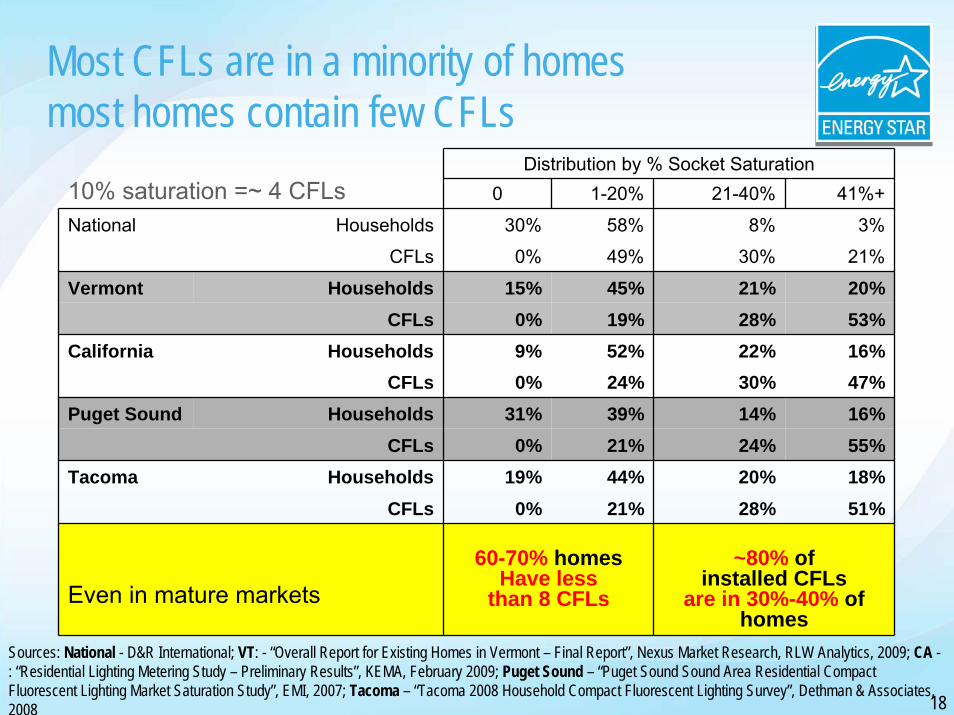
Most CFLs are in a minority of homesmost homes contain few CFLs
18
Sources: National - D&R International; VT: - “Overall Report for Existing Homes in Vermont – Final Report”, Nexus Market Research, RLW Analytics, 2009; CA -: “Residential Lighting Metering Study – Preliminary Results”, KEMA, February 2009; Puget Sound – “Puget Sound Sound Area Residential Compact Fluorescent Lighting Market Saturation Study”, EMI, 2007; Tacoma – “Tacoma 2008 Household Compact Fluorescent Lighting Survey”, Dethman & Associates, 2008
Distribution by % Socket Saturation10% saturation =~ 4 CFLs
Puget Sound Households 31% 39% 14% 16%CFLs 0% 21% 24% 55%
0 1-20% 21-40% 41%+
National Households 30% 58% 8% 3%
CFLs 0% 49% 30% 21%
Vermont Households 15% 45% 21% 20%CFLs 0% 19% 28% 53%
California Households 9% 52% 22% 16%CFLs 0% 24% 30% 47%
Tacoma Households 19% 44% 20% 18%CFLs 0% 21% 28% 51%
Even in mature markets60-70% homes
Have less than 8 CFLs
~80% of installed CFLs
are in 30%-40% of homes

Bulbs are not distributed evenly across homes
0%
5%
10%
15%
20%
25%
30%
35%
40%
45%
50%
0% 4% 8% 12%
16%
20%
24%
28%
32%
36%
40%
44%
48%
52%
56%
60%
64%
68%
72%
76%
80%
84%
88%
92%
96%
100%
Percent Saturation
Perc
ent o
f Sam
ples
19
US National (2008)Mean 11%Median 5%
FullPotentialTacoma (2008)
Mean 28%Median 16%
Vermont (2009)Mean 21%
Median 13%
California (2009)Mean 21%
Median 14%
4 8 30~Bulbs: 20

Misconception
The market for general service medium screw based lamps is transformed.
20

21
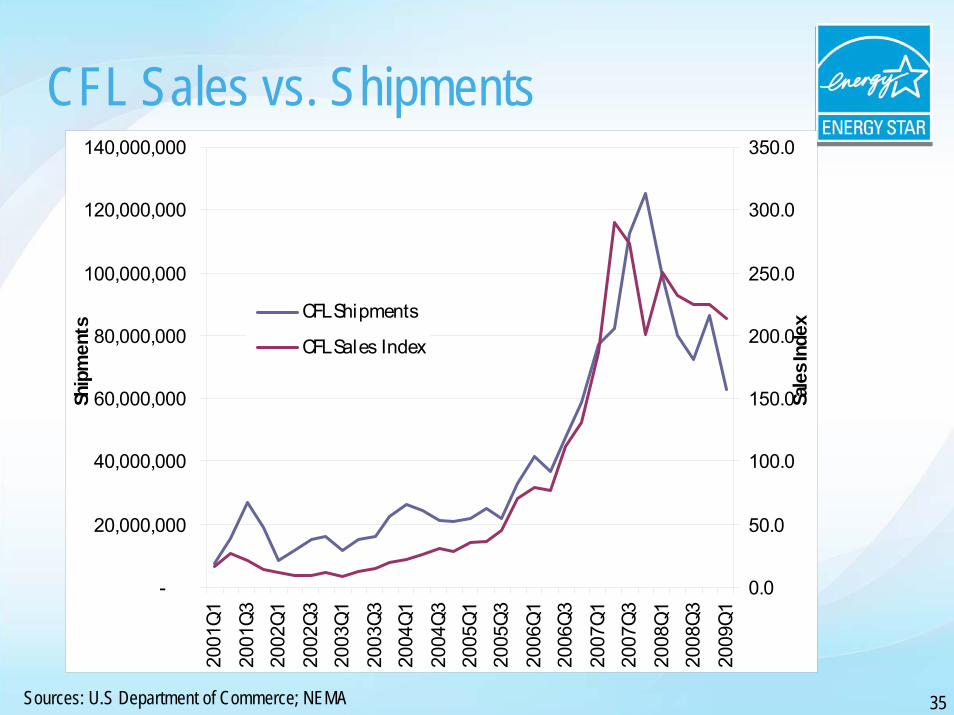
CFL shipments and sales have fallen farfrom their peak
• Shipments down 49% from 2007 peak
• Sales down 25% [NEMA]
• Retail sales down only 10% for all products.
• CFL market share ~25% [NEMA; (shipment data says 11%)]
Sources:Department of Commerce; "U.S. Lighting Market Characterization, Volume 1: National Lighting Inventory and Energy
Consumption Estimate," 2002, Navigant Consulting; U.S. Census Bureau; NEMA
3 of 4 bulbs purchased todayare incandescent

Misconception
EISA will complete the market transformation and deliver the energy
savings potential.
22

CFL Sales Growth 10
%CFL Market Share in 2014
35%CFL Saturation in 2015
43%
Relying on EISA creates enormous lost energy savings and possible supply shortages
Supply Shortage?
23
EISA Impacts Sales

Accelerating sales and saturation delivers big savings and avoids problems
CFL Sales Growth 40
%CFL Market Share in 2015
75% CFL Saturation in 2015
55%
24
EISA Impacts Sales
Saves88 TWh, 1.3% totalresidential electric
consumption
Proposed target
• Increase saturation from 20% in 2008 to 55% by 2015
• Increase sales by 40% per year through 2014
25

Benefits of accelerated sales and saturation By 2015:
• $10 billion energy bill savings for consumers– Nearly $160 in total savings per home
• 88 million MWh energy saved– 7.9% savings in household lighting consumption– 1.3% savings in total household electricity consumption
• 13 million MMT cumulative reduction in carbon emissions
• Minimal bulb shortages, no backlash, no repeal or delay in EISA implementation
26

The Cavs didn’t bench LeBron James.
Instead they added another Superstar: Shaquille O’Neil
The efficiency community needs to do the equivalent.
QuickTime™ and aTIFF (Uncompressed) decompressor
are needed to see this picture.
28
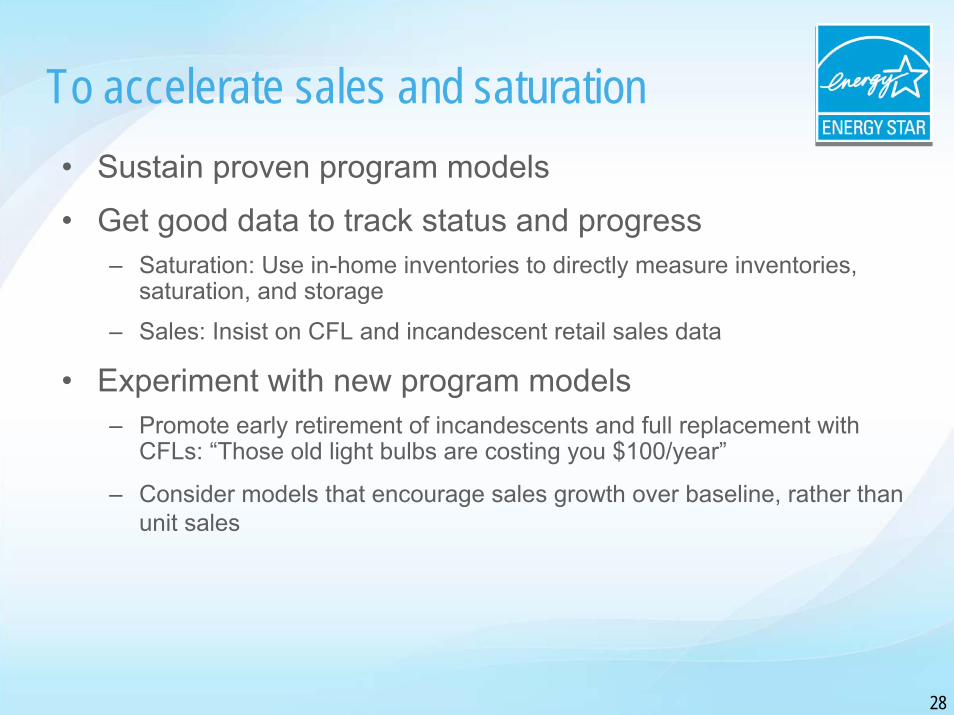
To accelerate sales and saturation• Sustain proven program models
• Get good data to track status and progress – Saturation: Use in-home inventories to directly measure inventories,
saturation, and storage
– Sales: Insist on CFL and incandescent retail sales data
• Experiment with new program models– Promote early retirement of incandescents and full replacement with
CFLs: “Those old light bulbs are costing you $100/year”
– Consider models that encourage sales growth over baseline, rather than unit sales

Use on-site inventories because self-reported data is not reliable
ENERGY STAR Market Share Refrigerators Clothes Washers
Residential Energy Consumption Survey 2005 57% 59%
Shipment and Market Share Data 28% 26%
29
• Comparing appliances from 2002 to 2005 using:
• Even for big ticket, single unit/household items, self- reports are highly unreliable.
• Is self- reported data for CFL purchases and saturation likely to be better?
Maximum possible saturation levels
Self-Reported Survey Data

Recap• CFLs have delivered and still offer tremendous energy and carbon
savings.
• 70% of CFL savings potential is unrealized, even in mature market, and specialty sockets are less than 50% of remaining potential. LED replacement lamps are not yet competitive substitutes.
• The market is not transformed. 3 of 4 bulbs sold are incandescent and CFL sales have fallen much more than retail sales.
• Promotion of both general service and specialty CFLs needs to be increased rather than reduced using both mass market and targeted tactics.
• Rapid growth in sales and saturation will yield enormous energy and carbon savings and avoid potential shortages, backlash, and other bad outcomes during the EISA phase-in.
• To accurately assess progress, we need good on-site saturation and sales data. Direct calculations using on-site and hours of use data might yield more accurate measurement of savings and cost-effectiveness.
30

DOE intends to help
• Foster dialogue between partners on this issue• Gather robust, accurate data on market and successful
methods • Disseminate this data to partners• Inform decision makers and outside parties about the state
of the market
31

Resources• ENERGY STAR CFL Market Profile (March 2009)
– www.energystar.gov/ia/products/downloads/CFL_Market_Profile.pdf
– New edition March 2010
• ENERGY STAR Lighting Partner Meeting (March 2010)• Monthly CFL Market Forum Call (Schedule TBD)• ENERGY STAR Lighting Pages
– CFLs – www.energystar.gov/cfls
– LEDs – www.energy.gov/led
• Marketing and communication materials leveraging the ENERGY STAR platform
32
Contact Information
Richard KarneyU.S. Department of [email protected](202) 586-9449
Stephen BickelD&R International, Inc.
33
[email protected](301) 628-2040
Toby SwopeD&R International, [email protected](301) 628-2048

Back-up Slides
34
35
CFL Sales vs. Shipments
Sources: U.S Department of Commerce; NEMA
-
20,000,000
40,000,000
60,000,000
80,000,000
100,000,000
120,000,000
140,000,000
2001
Q1
2001
Q3
2002
Q1
2002
Q3
2003
Q1
2003
Q3
2004
Q1
2004
Q3
2005
Q1
2005
Q3
2006
Q1
2006
Q3
2007
Q1
2007
Q3
2008
Q1
2008
Q3
2009
Q1
Ship
men
ts
0.0
50.0
100.0
150.0
200.0
250.0
300.0
350.0
Sale
s Ind
ex
CFL Shipments
CFL Sales Index

Consider new methodologies to determine cost effectiveness
• Direct energy savings calculation
Savings = ∑(∑ [# of new CFLs * wattage savings * usage]room) )home(n)
Cost per kWhSaved = Total ExpendituresEnergy Savings
36