matthew mccrea tong kai tan hui-hsuan ting xiaoli zuofranke.uchicago.edu/bigproblems/team6.pdf · 1...
TRANSCRIPT

1
Matthew McCrea Tong Kai Tan
Hui-Hsuan Ting Xiaoli Zuo
A Cost-Benefit Analysis of Different Waste-to-Energy Technologies for the
Management of Municipal Solid Waste in Singapore
Economics 26800
Professor George Tolley
Professor Stephen Berry

2
1. Introduction 1.1 Waste management in Singapore
Singapore is a small but densely populated city state with a population of 4.6 million and a land area of 730 square kilometers [1]. The country is confronted with the twin trends of large population and land scarcity, which present a distinct set of challenges for waste management policy in Singapore. A large population is associated with a high rate of waste generation. However, there is limited land to accommodate this growing volume of waste. The total amount of municipal solid waste (MSW) generated in year 2007 was 5.60 million tons [2], which translates to per capita MSW generation of 1.22 tons per year. This is comparable to the 1.3 tons of MSW generated per capita each year in the United States [3]. Yet, there is currently only one landfill operating in Singapore, which started in 1999 and is expected to last for 30 to 40 years [4]. This landfill covers 350 hectares and has a capacity of 63 million cubic meters. It is located on the offshore island of Pulau Semakau because the last remaining landfill on Singapore’s mainland had already been exhausted.
As a response to the large population and limited land for landfilling, Singapore’s
policy is to incinerate all combustible waste that is not reused or recycled. Of the 5.60 million tons of MSW generated in 2007, 2.38 million tons (43%) were incinerated, 3.03 million tons (54%) were recycled and the remaining 0.19 (3%) million tons were directly landfilled [2]. There are currently four government-owned and operated incineration plants in Singapore, namely Senoko, Ulu Pandan, Tuas and Tuas South. Given the current unsustainable rate of waste generation, Singapore will require a new incineration plant every 7 years and a new offshore landfill the size of Pualu Semakau every 35 years [5]. In fact, the construction of a fifth incineration plant has already started in 2006.
Singapore’s waste management policy is shaped by the National Environmental
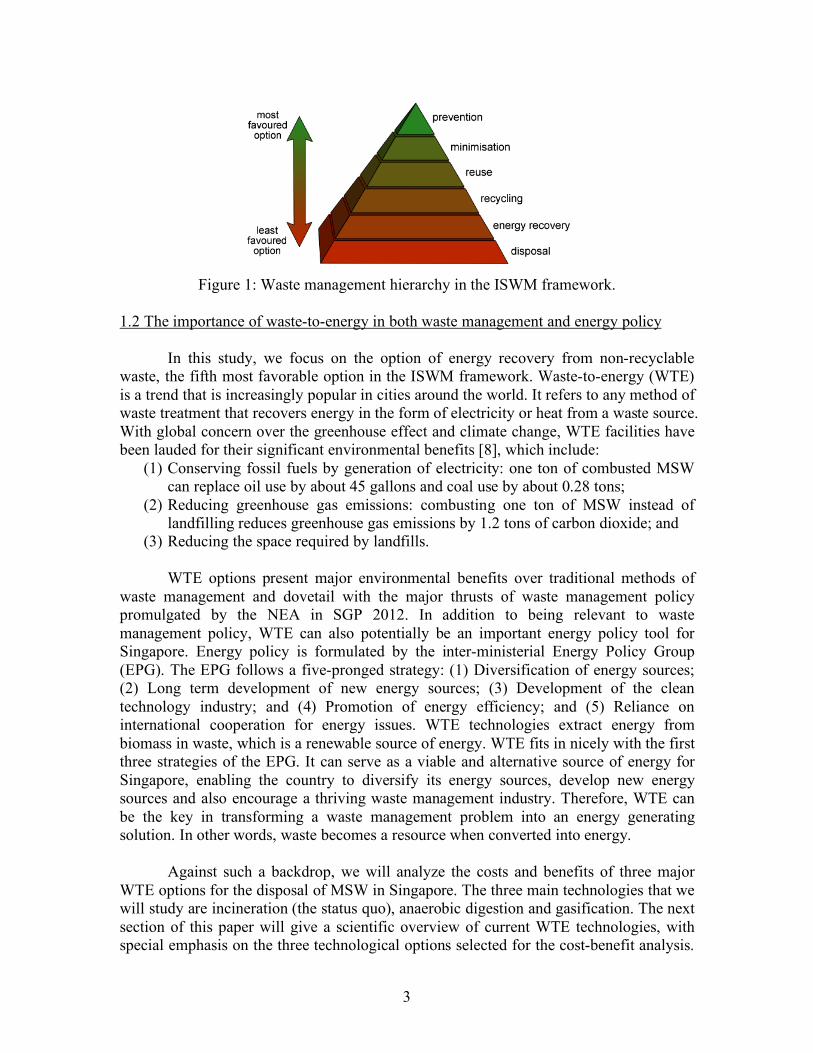
Agency (NEA) and is guided by three major thrusts, namely: (1) waste minimization at source; (2) recycling to reduce waste disposed of at incineration plants and landfill; and (3) volume reduction of waste disposed through incineration. The NEA has outlined three main targets for waste management in the Singapore Green Plan (SGP) 2012, premised on the three major thrusts. The targets are: (1) to increase the overall waste recycling rate to 60% by 2012; (2) to extend the lifespan of Semakau Landfill to 50 years and striving towards zero landfill; and (3) to reduce the need for new incineration plants, from the current one every 5-7 years to one every 10-15 years [5]. Singapore’s waste management policy is similar to the Integrated Solid Waste Management (ISWM) framework proposed by the Environmental Protection Agency (EPA) in the US. ISWM outlines a waste management hierarchy that ranks waste management options in order of sustainability, from the most favored to least favored option [6]. Please refer to Figure 1 for a diagram that ranks the various waste management options in the ISWM framework.
3
Figure 1: Waste management hierarchy in the ISWM framework.
1.2 The importance of waste-to-energy in both waste management and energy policy
In this study, we focus on the option of energy recovery from non-recyclable
waste, the fifth most favorable option in the ISWM framework. Waste-to-energy (WTE) is a trend that is increasingly popular in cities around the world. It refers to any method of waste treatment that recovers energy in the form of electricity or heat from a waste source. With global concern over the greenhouse effect and climate change, WTE facilities have been lauded for their significant environmental benefits [8], which include:
(1) Conserving fossil fuels by generation of electricity: one ton of combusted MSW can replace oil use by about 45 gallons and coal use by about 0.28 tons;
(2) Reducing greenhouse gas emissions: combusting one ton of MSW instead of landfilling reduces greenhouse gas emissions by 1.2 tons of carbon dioxide; and
(3) Reducing the space required by landfills.
WTE options present major environmental benefits over traditional methods of waste management and dovetail with the major thrusts of waste management policy promulgated by the NEA in SGP 2012. In addition to being relevant to waste management policy, WTE can also potentially be an important energy policy tool for Singapore. Energy policy is formulated by the inter-ministerial Energy Policy Group (EPG). The EPG follows a five-pronged strategy: (1) Diversification of energy sources; (2) Long term development of new energy sources; (3) Development of the clean technology industry; and (4) Promotion of energy efficiency; and (5) Reliance on international cooperation for energy issues. WTE technologies extract energy from biomass in waste, which is a renewable source of energy. WTE fits in nicely with the first three strategies of the EPG. It can serve as a viable and alternative source of energy for Singapore, enabling the country to diversify its energy sources, develop new energy sources and also encourage a thriving waste management industry. Therefore, WTE can be the key in transforming a waste management problem into an energy generating solution. In other words, waste becomes a resource when converted into energy.
Against such a backdrop, we will analyze the costs and benefits of three major
WTE options for the disposal of MSW in Singapore. The three main technologies that we will study are incineration (the status quo), anaerobic digestion and gasification. The next section of this paper will give a scientific overview of current WTE technologies, with special emphasis on the three technological options selected for the cost-benefit analysis.

4
The third section will detail the methods, data and results of the cost benefit analysis. Finally, we conclude with the policy implications and recommendations in the last section.

5
2. A technological survey of major waste-to-energy options 2.1 Municipal Solid Waste (MSW) composition in Singapore Before launching into a discussion of the different WTE options, it would be useful to first understand the composition of MSW in Singapore. MSW is the waste generated in a community with the exception of industrial and agricultural waste. It includes residential (e.g. households), commercial (e.g. stores, markets, hotels, etc.) and institutional waste (e.g. schools, hospitals, etc.) [8]. In Singapore, MSW is classified into various categories, namely food waste, paper/cardboard, plastics, construction debris, wood/timber, horticultural waste, ferrous metal, non-ferrous metals, used slag, sludge, glass, textile/leather, scrap tires and others (stones, ceramics and rubber). Please refer to Table 1 below for detailed waste statistics under each category for 2007. Among the different waste streams, four of them are primarily made up of biomass and are hence biodegradable. They are as follows: food, paper/cardboard, wood/timber and horticultural waste. In total, these four waste streams accounted for approximately 52% of the total waste in 2007. This is comparable to the biodegradable fraction of MSW in the USA, which stands at approximately 53% [9]. The biomass portion of MSW is relevant for this study since WTE technologies rely on converting biomass to energy. The energy content of MSW depends on two main factors, namely the concentration of combustible organic materials and the moisture content. In Singapore, the moisture content of MSW is between 40 to 65% of weight. On average, the net calorific value of each ton of MSW in Singapore is between 4000 to 6000 kJ/kg [27]. Waste Streams Total Waste
Disposed (ton) Total Waste Recycled (ton)
Total Waste Output (ton)
Recycling Rate (%)
Food waste 507,700 51,200 558,900 9 Paper/Cardboard 583,900 619,000 1,202,900 51 Plastics 584,800 75,000 659,800 11 Construction Debris
19,000 759,300 778,300 98
Wood/Timber* 118,400 127,800 246,200 52 Horticultural* Waste
133,500 91,100 224,600 41
Ferrous Metal 68,500 668,000 736,500 91 Non-ferrous Metals 16,700 75,600 92,300 82 Used Slag 7,200 520,000 527,200 99 Sludge 124,600 0 124,600 0 Glass 59,500 5,800 65,300 9 Textile/Leather 104,100 6,000 110,100 5 Scrap Tires 3,500 22,000 25,500 86 Others (stones, ceramics & rubber)
234,600 14,000 248,600 6
Total: 2,566,000 3,034,800 5,600,800 54 Table 1: Singapore’s waste statistics for 2007 [2]

6
2.2 WTE status quo – Incineration Currently, incineration is the WTE technology used to manage MSW in
Singapore. Through incineration, the waste volume can be reduced by 90% and electricity can be generated at the same time. The combustion of each ton of MSW can generate as much electricity as 0.28 tons of coal or 25 gallons of oil [6]. In the combustion process, heat generated from the oxidation of the waste feedstock boils water into steam for driving the steam turbines that generate electricity [10]. Excess flue gases pass through multiple stages of filtering before exiting the system. To increase efficiency, the heat from steam can be collected and reused for heating and generating power, through Combined Heat and Power (CHP) or co-generation. Figure 2 illustrates the typical processes in an incineration plant. In Singapore, there are currently four incineration plants with a combined capacity of 198MW, the turbine capacity associated with each plant is shown in Table 2. Average energy efficiency of the incineration plants is 39% [11]
Figure 2: WTE plant diagram of a typical incineration plant [12].
Waste-To-Energy Plants Turbine Capacity (MW) Ulu Pandan Incineration Plant 16 Tuas Incineration Plant 46 Senoko Incineration Plant 56 Tuas South Incineration Plant 80
Table 2: Turbine capacity of incineration plants in Singapore [11].
7
2.3 WTE alternatives- Anaerobic digestion and gasification
Anaerobic digestion and gasification are alternative WTE technologies with great potential to complement the status quo. This section provides a broad scientific overview of each technology and also contains information on the gasification and anaerobic plants used as case studies in the cost-benefit analysis in Section 3. Anaerobic Digestion
Anaerobic digestion of biomass proceeds in the absence of oxygen and the presence of anaerobic microorganisms. It is facilitated by a series of metabolic interactions among various groups of microorganisms. Waste digestion occurs through three main processes, namely hydrolysis, acidogenesis and methanogenesis. In hydrolysis, the first group of microorganisms secretes enzymes which reduce polymeric materials to monomers such as glucose and amino acids. Thereafter, in acidogenesis, the second group of microorganisms converts the monomers to volatile fatty acids, hydrogen and acetic acid. Finally, the third group of bacteria works in methanogenesis to convert hydrogen, carbon dioxide and acetate to methane gas. All three processes of anaerobic digestion take place in large digesters that are maintained at temperatures ranging from 30oC to 65oC [13].
The management of waste at an anaerobic digestion plant involves four stages,
namely pretreatment, waste digestion, gas recovery and residue treatment. In the pretreatment stage, non-digestible components such as glass, metals and stones are separated from the biodegradable waste. Thereafter, the digestible waste is shredded before it is fed into the digester for a designated retention time. A heat exchanger is usually required to regulate the temperature in the digesting vessel. The output of the anaerobic digestion process is biogas, which consists of methane (50~70%), carbon dioxide (30-45%) and hydrogen sulfide (200-4000ppm) [13]. Finally, the residue from the digester is dewatered and treated to obtain compost. As of 1996, there were more than 90 anaerobic digestion plants worldwide, 90% of which are located in Europe [13]. For the cost-benefit analysis, we study two such anaerobic digestion plants, namely the Tilburg plant and the Brecht plant.
The Tilburg plant uses the Valorga process and has been operating since 1994 in
the Netherlands. It has an annual waste management capacity of 52,000 tons of garden and vegetable waste per year. The plant consists of two digesters, each of 3300m3 capacity and produces 2.8 million m3 of methane per year. The waste is shredded to less than 10 cm particles before being fed into the digestion unit. The retention time in this plant is 20 days at a mesophilic temperature of 380C. For each ton of waste processed, approximately 106m3 of biogas is produced. It is piped to an upgrading plant, where it is refined and then supplied to the municipal network.
On the other hand, the Brecht plant uses the DRANCO process. It has been in
operation since 1992 in Belgium and processes 12,000 tons of food, yard trimmings and
8
non-recyclable paper wastes each year. The process operates at 50-580C and has a retention time of 20 days. Waste is continuously loaded into the digester. It is subsequently removed and cured for two weeks to produce compost. The biogas generated is used in a 290 kW generator to produce electricity which is then sold to the local power grid [13]. Gasification
Gasification is a thermochemical process that produces a gaseous, fuel rich
product through two main stages. In the first stage, the volatile content of biomass is vaporized and removed through pyrolysis at temperatures around 6000C, leaving behind carbon and ash. Thereafter, the remaining carbon content is reacted with either steam or hydrogen to produce synthetic gas, comprising hydrogen and carbon dioxide. Synthetic gas is a gaseous fuel that can be fed to different power generating equipments such as steam boilers, reciprocating engines, combined cycle turbines and fuel cells [17].
The feedstock is an important determinant of the design of gasification reactors as
the degree of homogeneity of the feedstock affects the efficiency of reactions. Raw MSW is typically first processed into refuse-derived fuel (RDF), a homogenous feedstock before being fed into the gasifier. RDF is processed from raw waste through mechanical separation and removal of non-combustible and recyclable materials. The cost of processing RDF makes up a significant part of the total costs of a gasification system. It may account for up to 50% of the total plant capital costs [17].
In the cost-benefit analysis, two specific gasification plants are studied in detail.
They are the TPS Termiska plant and the Battelle-Columbus plant. The TPS Termiska plant in Italy has an annual waste management capacity of 642,400 tons of MSW [17]. The plant uses a starved-air gasification process in a fluidized bed reactor operating at 8500C. Air is used as the gasification agent. The flue gas exiting the boiler is cleaned in a three-stage dry scrubber before being let out through the exhaust. As for the Battelle-Colombus plant, it has an annual capacity of 341,275 tons of MSW [17]. It uses a technology that prevents the presence of nitrogen in the reactor through indirect heating, resulting in higher energy content synthetic gas. 2.4 Other WTE technologies
We explored other WTE technologies, but as these technologies have not reached the stage of commercial viability, we do not include them in the cost-benefit analysis in the next section. The alternatives to anaerobic digestion and gasification are pyrolysis, the production of methanol and ethanol. Pyrolysis
Biomass can be converted into charcoal, bio-oil, tar and gases in the absence of
oxygen through pyrolysis, a thermochemical process. The energy content of the main product bio-oil (17-20 GJ/ton) is less than fuel oil (40 GJ/ton) [14], and there may be

9
additional costs due to the need for expensive materials to withstand the corrosive and acidic nature of bio-oil The main challenge towards using pyrolysis as a WTE technology is its high capital and operating costs [15], hindering mass implementation of the technology.
Production of Ethanol
Biomass can be converted into ethanol via two reactions: hydrolysis and
fermentation. Hydrolysis is the process of converting polysaccharides in raw feedstock into simple sugars, and the fermentation process converts sugars to ethanol. It is possible to bypass the hydrolysis step if starch and sugar based feedstock like corn is used, instead of cellulosic biomass. However, cellulosic biomass exists more abundantly in MSW compared to sugar based feedstock. The main fuel sources used today are corn, grains, or agricultural waste, and the heating value ranges from 56,800 to 64,250 Btu/gallon [10]. Table 3 gives the theoretical ethanol yield for some typical feedstock, which are present in MSW.
Feedstock Theoretical Ethanol Yield
(gal/dry ton of feedstock) Corn Grain 124.4
Corn Stover 113.0
Rice Straw 109.9
Cotton Gin Trash 56.8
Hardwood Sawdust 100.8
Mixed Paper 116.2
Table 3: Theoretical Ethanol Yield for Selected Feedstock [16]. Production of methanol
Methanol is a byproduct from the distillation of wood, and is also commonly
referred to as wood alcohol. Methanol can also be synthesized through direct combination of hydrogen and carbon monoxide gases, heated under pressure in the presence of a catalyst [10]. Coal, natural gas, and other woody biomass are all suitable feed stock for yielding methanol. The energy content of methanol is half that of gasoline, the LHV= 56800Btu/gallon and HHV = 64250Btu/gallon [10]. The downside of methanol is that it is not compatible with all engines. Compared to using conventional fuel, burning methanol is associated with a reduction in hydrocarbons, carbon monoxide (in small amounts) and NOx. However, burning methanol produces high amount of formaldehyde in emissions, which is detrimental to human health [10].

10
3. Cost-Benefit Analysis
In this section, we outline the methods, data and results of the cost-benefit analysis of the three WTE options, namely (1) incineration (the status quo), (2) anaerobic digestion and (3) gasification. Singapore is divided into nine sectors for the collection of MSW (Figure 3). There are four public waste collectors, which either collect the waste directly or indirectly from households. Direct collection involves the waste collectors going to the individual households while indirect collection usually takes place at the centralized refused chute located in each block of apartments. The waste collected is then brought to the incinerators for sorting and combustion; and ultimately to the landfill for disposal. In the cost-benefit analysis, we will concentrate on the post waste collection process and measure the net costs of managing one ton of MSW and the associated energy production (Figure 4). We assume the net costs of waste collection to be the same for all three WTE options and hence do not include these figures in our computations.
Figure 3: Waste collection zone boundaries in Singapore
Figure 4: Cost-benefit analysis focused on post waste collection process.

11
For each of the three options, we will calculate the net social costs. To compute the net social costs, we deduct the total private and external benefits from the total private and external costs. Private costs in each option comprise the annualized capital costs and the yearly operating costs associated with the management of one ton of MSW. External costs arise from the emissions released under each option. As for the private benefits of each option, they are the avoided production costs of electricity generated from the management of each ton of MSW. The external benefits are the avoided costs to the environment that would otherwise have resulted from emissions associated with electricity production in other power plants.
This paper will utilize a 7% discount rate to calculate the present value of any
costs and benefits. All dollar values quoted will be in 2007 US dollars. Any other data that was originally in Singapore Dollars or Euros will be converted at the exchange rate of SGD $1= USD $0.67 and EUR €1= USD $1.30. 3.1 Option one: Incineration (status quo) Costs of incineration
Incineration is the current modus operandi that Singapore adopts to recover energy from its MSW. The private production costs associated with this option are the production costs of incineration and subsequent landfilling of flyash, the waste residual from the incineration process. Private costs of incineration comprise two major components, namely the capital and operating costs. Due to the paucity of information regarding cost structures of incineration plants in Singapore, the per ton tipping fee charged at incineration plants is used as a proxy for private production costs [18]. The government owns and operates all four incineration plants, and hence regularly adjusts the disposal fee to reflect the total private production cost of refuse disposal. The disposal fee varies from $52 to $54.70 per ton of MSW at the various incineration plants [19]. Therefore, we take the weighted cost of incineration over all four incineration plants, i.e. $53.30 per ton of MSW. This figure is assumed to include both the annualized capital and yearly operating costs associated with the management of one ton of MSW.
Apart from the private costs associated with the incineration process, we also take into account the private costs associated with landfilling the flyash from landfills. Using a similar line of argument as before, the per ton tipping fee of $52 is assumed to cover both the annualized capital and yearly operating costs associated with the management of one ton of MSW. Since the volume of each ton of MSW is reduced by approximately 90% after incineration, so for every 1 ton of pre-incinerated MSW, it costs $5.20 to dispose off the flyash at the landfill.
As for the external costs of incineration, they arise from the air emissions from
the incineration process. The two main emissions are carbon dioxide and nitrogen oxides. We derive data from Miranda and Hale’s (2005) study [18] on environmental costs of multiple incineration facilities in the US because of the lack of literature concerning the environmental impact of incineration plants in Singapore. The estimated environmental
12
costs of incineration range from $6.05 to $18.93 per ton of MSW. The environmental costs (EC) were estimated by taking the product of the emissions of specific pollutants (EM) from the incinerations plants and the marginal damage cost function (MDC) for that pollutant. The MDC gives an approximate value of the impact due to one unit of a pollutant released into the environment.
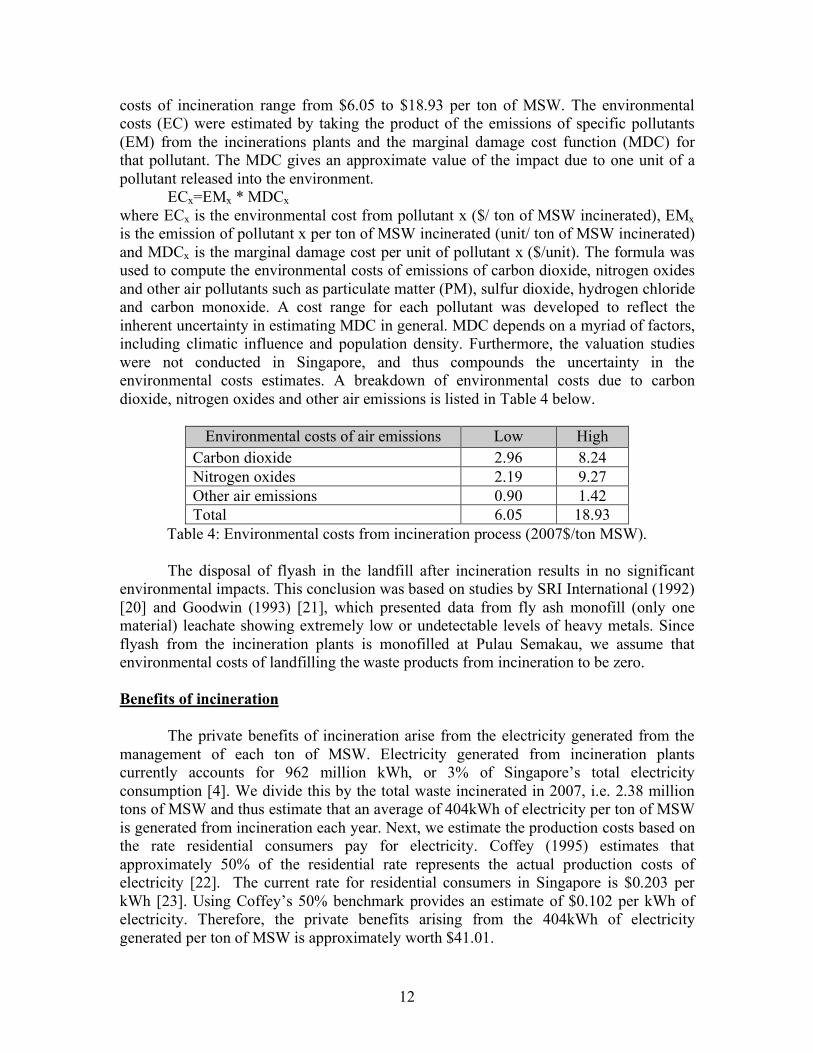
ECx=EMx * MDCx where ECx is the environmental cost from pollutant x ($/ ton of MSW incinerated), EMx is the emission of pollutant x per ton of MSW incinerated (unit/ ton of MSW incinerated) and MDCx is the marginal damage cost per unit of pollutant x ($/unit). The formula was used to compute the environmental costs of emissions of carbon dioxide, nitrogen oxides and other air pollutants such as particulate matter (PM), sulfur dioxide, hydrogen chloride and carbon monoxide. A cost range for each pollutant was developed to reflect the inherent uncertainty in estimating MDC in general. MDC depends on a myriad of factors, including climatic influence and population density. Furthermore, the valuation studies were not conducted in Singapore, and thus compounds the uncertainty in the environmental costs estimates. A breakdown of environmental costs due to carbon dioxide, nitrogen oxides and other air emissions is listed in Table 4 below.
Environmental costs of air emissions Low High Carbon dioxide 2.96 8.24 Nitrogen oxides 2.19 9.27 Other air emissions 0.90 1.42 Total 6.05 18.93
Table 4: Environmental costs from incineration process (2007$/ton MSW).
The disposal of flyash in the landfill after incineration results in no significant environmental impacts. This conclusion was based on studies by SRI International (1992) [20] and Goodwin (1993) [21], which presented data from fly ash monofill (only one material) leachate showing extremely low or undetectable levels of heavy metals. Since flyash from the incineration plants is monofilled at Pulau Semakau, we assume that environmental costs of landfilling the waste products from incineration to be zero.
Benefits of incineration
The private benefits of incineration arise from the electricity generated from the
management of each ton of MSW. Electricity generated from incineration plants currently accounts for 962 million kWh, or 3% of Singapore’s total electricity consumption [4]. We divide this by the total waste incinerated in 2007, i.e. 2.38 million tons of MSW and thus estimate that an average of 404kWh of electricity per ton of MSW is generated from incineration each year. Next, we estimate the production costs based on the rate residential consumers pay for electricity. Coffey (1995) estimates that approximately 50% of the residential rate represents the actual production costs of electricity [22]. The current rate for residential consumers in Singapore is $0.203 per kWh [23]. Using Coffey’s 50% benchmark provides an estimate of $0.102 per kWh of electricity. Therefore, the private benefits arising from the 404kWh of electricity generated per ton of MSW is approximately worth $41.01.
13
While the generation of electricity through the incineration process yields private
benefits to the incineration plants, external benefits also arise in the form of avoided costs to the environment that would otherwise have resulted from electricity production in power plants elsewhere. Currently, electricity is generated at power plants in Singapore using either natural gas or oil. Natural gas-fired power plants account for 80% of electricity production while oil-fired power plants make up the rest. We use estimates of the external costs arising from the generation of electricity in different types of power plants from a study by Crapanzano et al. (1997) in Italy. Crapanzano et al. used the methodology of the ExternE project, which is recognized within the European Union as one of the most comprehensive method to estimate the external costs of energy supply [24]. The study concludes that the external costs of supplying 1kWh of electricity using natural gas and oil are $0.04768 and $0.09782 respectively. We weight these values using the 80-20 composition of natural gas and oil-fired power plants in Singapore and conclude that $0.0577 is the environmental cost associated with supplying 1kWh of electricity. Since each ton of MSW generates 404kWh of electricity via incineration, we estimate the avoided environmental costs to be $23.31 per ton of MSW.
Net social costs of incineration
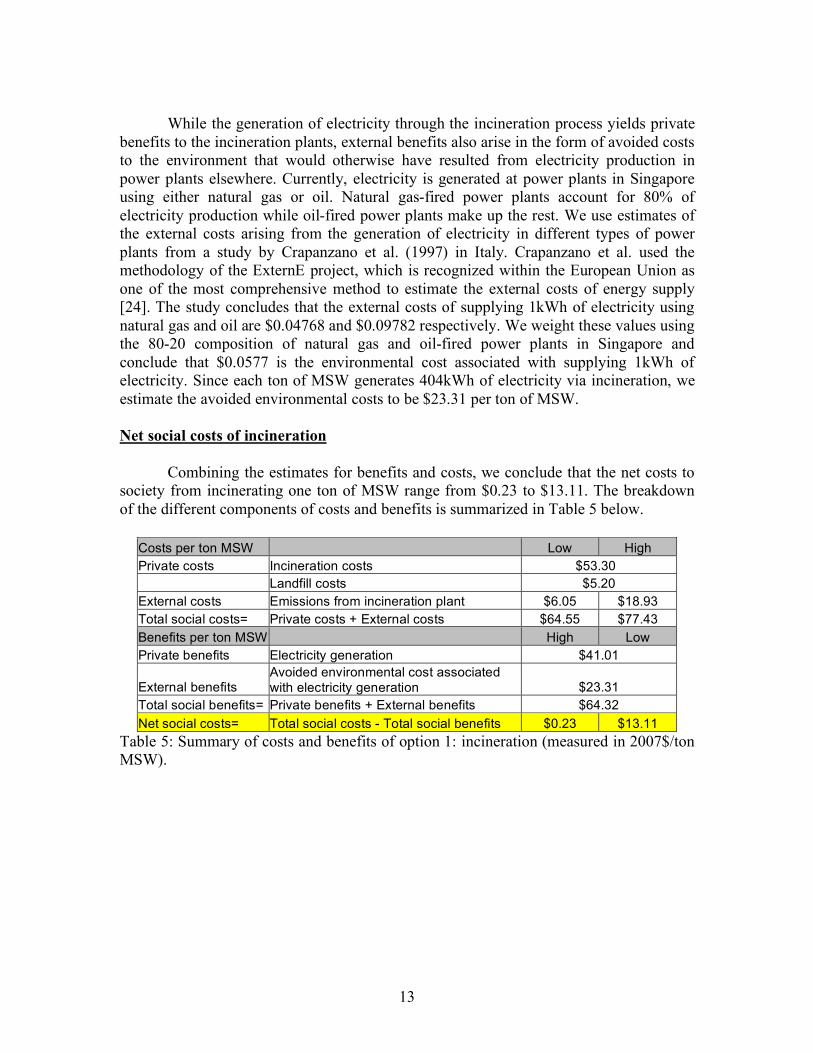
Combining the estimates for benefits and costs, we conclude that the net costs to society from incinerating one ton of MSW range from $0.23 to $13.11. The breakdown of the different components of costs and benefits is summarized in Table 5 below.
Costs per ton MSW Low High Private costs Incineration costs $53.30 Landfill costs $5.20 External costs Emissions from incineration plant $6.05 $18.93 Total social costs= Private costs + External costs $64.55 $77.43 Benefits per ton MSW High Low Private benefits Electricity generation $41.01
External benefits Avoided environmental cost associated with electricity generation $23.31
Total social benefits= Private benefits + External benefits $64.32 Net social costs= Total social costs - Total social benefits $0.23 $13.11
Table 5: Summary of costs and benefits of option 1: incineration (measured in 2007$/ton MSW).

14
3.2 Option two: Anaerobic digestion
Anaerobic digestion is the second option for the cost-benefit analysis. We chose it as an option for analysis because it operates using a completely different technology. As opposed to incineration and gasification, which are both thermal WTE technologies, anaerobic digestion is a biological means of obtaining energy from waste. Among the competing anaerobic digestion technologies in the market, we chose two of the more common and widely used technologies for the cost-benefit study, namely the Valorga and DRANCO processes. We analyzed the costs and benefits of the Valorga plant at Tilburg in Netherlands and the DRANCO plant at Brecht in Belgium.
Costs of anaerobic digestion The cost schedules for both plants differ from each other since they use different processes and have different waste management capacities. The Valorga plant can handle up to 52,000 tons of MSW each year while the DRANCO annual plant’s capacity is 12,000 tons of MSW. The capital cost for the Valorga plant is $24.15 million while the yearly operating cost is $2.21 million. As for the DRANCO plant, it required a capital cost of $8.42 million and a yearly operating cost of $0.66 million [13]. The yearly operating costs comprise wages, administrative costs, depreciation of capital, material costs and waste disposal costs of residuals from the anaerobic process.
Next, we annualize the capital costs using the formula: Annualized capital cost = capital cost * amortization factor (R) where and r = 0.07. For an assumed 20-year life of the Valorga plant, R=0.0882. Hence, the annualized capital costs for the Valorga plant is $2.13 million. Finally, we divide the sum of the annualized capital costs and the yearly operating costs by the waste management capacity of the Valorga plant and arrive at the estimate of $83.43 for each ton of MSW. In order to reflect the uncertainty of our estimates, we adjust the annualized capital and yearly operating costs by ± 10% [18]. This is because costs can fluctuate when labor costs change or when research and development results in the refinement of the technological processes used in anaerobic digestion. For the Valorga plant, the total private cost per ton of MSW is between $75.08 and $91.48. A similar analysis is repeated for the DRANCO plant and the private cost per ton of MSW is found to be between $105.37 and $128.79. (Please refer to Table 6 for a detailed breakdown of the total private costs per ton MSW for each plant.)
( )!=
""#
$%%&
'
+
=10
0 1
1
1
t
t
r
R

15
Capital Costs Valorga plant DRANCO plant
Total capital costs $24,150,000 $8,418,000 Annualized capital costs $2,130,465 $742,619 Annualized capital costs per ton MSW $40.97 $61.88 Range of annualized capital costs per ton MSW $36.87 to $45.07 $55.69 to $68.07
Yearly operating costs Labor, admin $1,104,000 $331,200 Other operating costs (maintenance, supplies, materials and waste disposal) $1,104,000 $331,200 Yearly operating costs per ton MSW $42.46 $55.20 Range of yearly operating costs per ton MSW $38.21 to $46.71 $49.68 to $60.72 Range of total private costs per ton MSW $75.08 to $91.78 $105.37 to $128.79
Table 6: Breakdown of total private costs per ton MSW under the Valorga and DRANCO processes.
Although we have specific data for the private production costs pertaining to both
the Valorga and DRANCO plants, we do not have separate data pertaining to their respective emissions. Therefore we assume the same external costs of emissions from both plants for each ton of MSW processed. The external costs arise primarily due to the carbon emissions from the biogas, the main by-product of anaerobic digestion. 0.13 tons of biogas is produced for every ton of MSW processed at the DRANCO plant. Since carbon dioxide typically takes up 30-45% of the volume of biogas [13], we know that 0.039 to 0.0585 tons of carbon dioxide is released per ton of MSW. This translates to approximately 0.0106 to 0.0160 tons of carbon emissions per ton of MSW. The environmental cost can then be quantified using the volume of carbon emissions and the price of carbon permits traded in the European Climate Exchange (ECX). Carbon prices in 2007 fluctuated between $15.93 and $32.86 on the European Market [25]. The price of carbon permits can be used as a suitable proxy because it reflects the value placed on the abatement of each ton of carbon in the atmosphere. The environmental cost due to carbon emissions from the anaerobic digestion process is calculated to range from $0.17 to $0.53 per ton MSW. Benefits of anaerobic digestion The private benefits of anaerobic digestion accrue from the generation of electricity using methane as a source of power and the sale of compost, another waste product from the anaerobic digestion process. Again, as no specific data pertaining to the electrical output of both plants is available, we assume that both plants generate the same amount of electricity for every ton of MSW processed. In a typical ton of MSW, the energy content of methane is 46.39 to 103.61 kWh [13]. As before, we use Coffey’s 50% benchmark and the current residential electricity rate of $0.203 to compute the private

16
benefits accruing from electrical generation. The private benefits associated with electricity generation are between $4.71 and $10.52 per ton of MSW.
In addition to the generation of electricity, the waste product of anaerobic digestion can be sold as compost. 28,000 tons of compost can be harvested from the Valorga plant, which implies 0.538 tons of compost per ton of MSW. Assuming the value of compost to be worth $13 a ton, the compost derived from each ton of MSW is worth $7. As for the DRANCO plant, 0.3 tons of compost can be derived from each ton of MSW and this is worth approximately $5.70. The value of compost adds to the private benefits from electricity generation.
In the previous cost-benefit analysis of option 1: incineration, we concluded that
$0.0577 is the environmental cost associated with supplying 1kWh of electricity. Since each ton of MSW generates 46.39 to 103.61 kWh of electricity through anaerobic digestion, we estimate the avoided environmental costs to be between $2.68 and $5.98 per ton of MSW.
Net social costs of anaerobic digestion
Combining the estimates for benefits and costs, we conclude that the net costs to society from managing one ton of MSW using anaerobic process range from $58.18 to $49.07 in the Valorga plant and from $83.34 to $116.23 in the DRANCO plant. The breakdown of the different components of costs and benefits is summarized in Tables 7 and 8.
Costs per ton MSW Low High Private costs Annualized capital costs $36.87 $45.07 Yearly operating costs $38.21 $46.71
External costs Carbon emissions from anaerobic digestion process $0.17 $0.53
Total social costs= Private costs + External costs $75.25 $92.31 Benefits per ton MSW High Low Private benefits Electricity generation $10.52 $4.71 Sale of compost $9.68
External benefits Avoided environmental cost associated with electricity generation $5.98 $2.68
Total social benefits= Private benefits + External benefits $26.18 $17.07 Net social costs= Total social costs - Total social benefits $49.07 $58.18
Table 7: Summary of costs and benefits of option 2a: anaerobic digestion (Valorga plant) (measured in 2007$/ton MSW).
17
Costs per ton MSW Low High Private costs Annualized capital costs $55.69 $68.07 Yearly operating costs $49.68 $60.72
External costs Carbon emissions from anaerobic digestion process $0.17 $0.53
Total social costs= Private costs + External costs $105.54 $129.32 Benefits per ton MSW High Low Private benefits Electricity generation $10.52 $4.71 Sale of compost $5.70
External benefits Avoided environmental cost associated with electricity generation $5.98 $2.68
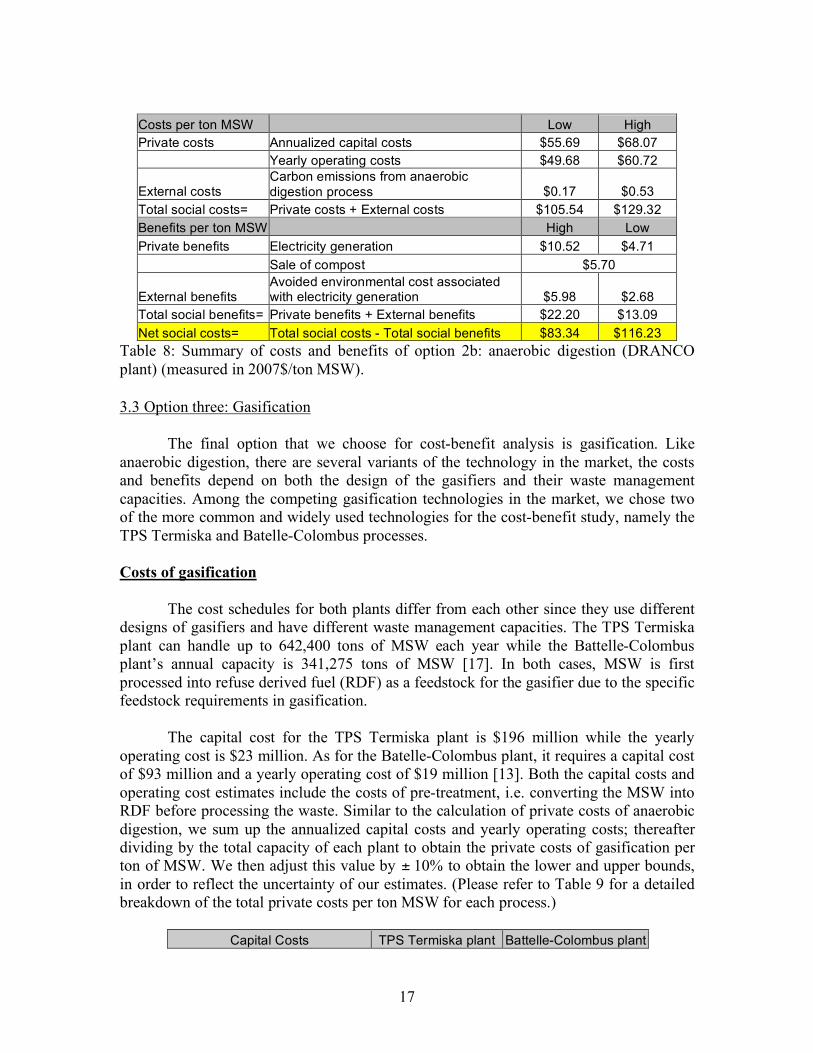
Total social benefits= Private benefits + External benefits $22.20 $13.09 Net social costs= Total social costs - Total social benefits $83.34 $116.23
Table 8: Summary of costs and benefits of option 2b: anaerobic digestion (DRANCO plant) (measured in 2007$/ton MSW). 3.3 Option three: Gasification
The final option that we choose for cost-benefit analysis is gasification. Like anaerobic digestion, there are several variants of the technology in the market, the costs and benefits depend on both the design of the gasifiers and their waste management capacities. Among the competing gasification technologies in the market, we chose two of the more common and widely used technologies for the cost-benefit study, namely the TPS Termiska and Batelle-Colombus processes.
Costs of gasification The cost schedules for both plants differ from each other since they use different designs of gasifiers and have different waste management capacities. The TPS Termiska plant can handle up to 642,400 tons of MSW each year while the Battelle-Colombus plant’s annual capacity is 341,275 tons of MSW [17]. In both cases, MSW is first processed into refuse derived fuel (RDF) as a feedstock for the gasifier due to the specific feedstock requirements in gasification.
The capital cost for the TPS Termiska plant is $196 million while the yearly operating cost is $23 million. As for the Batelle-Colombus plant, it requires a capital cost of $93 million and a yearly operating cost of $19 million [13]. Both the capital costs and operating cost estimates include the costs of pre-treatment, i.e. converting the MSW into RDF before processing the waste. Similar to the calculation of private costs of anaerobic digestion, we sum up the annualized capital costs and yearly operating costs; thereafter dividing by the total capacity of each plant to obtain the private costs of gasification per ton of MSW. We then adjust this value by ± 10% to obtain the lower and upper bounds, in order to reflect the uncertainty of our estimates. (Please refer to Table 9 for a detailed breakdown of the total private costs per ton MSW for each process.)
Capital Costs TPS Termiska plant Battelle-Colombus plant

18
Pretreatment/ Shredding Costs $72,220,000 $42,550,000 Gasifier, Gas Treatment and Engineering Costs $65,406,250 $14,411,800 Power Generating Equipment $58,650,000 $35,650,000 Total capital costs $196,276,250 $92,611,800 Annualized capital costs $17,315,098 $8,170,028 Annualized capital costs per ton MSW $26.95 $23.94 Range of annualized capital costs per ton MSW $24.23 to $29.65 $21.55 to $26.33
Yearly operating costs Labor, admin, maintenance $11,820,160 $6,671,926 RDF process $5,910,080 $3,532,196 Waste disposal cost $8,865,120 $8,634,258 Total yearly operating costs $23,126,400 $18,838,380 Yearly operating costs per ton MSW $18.40 $55.20 Range of yearly operating costs per ton MSW $16.56 to $20.24 $49.68 to $60.72 Range of total private costs per ton MSW $40.79 to $49.89 $71.23 to $87.05
Table 9: Breakdown of total private costs per ton MSW under the TPS Termiska and Battelle-Colombus processes.
Next, we consider the external costs associated with the gasification of each ton of
MSW. Due to in-built gas treatment, only a small amount of emissions is released into the atmosphere. Most of the emissions is in the form of carbon dioxide present in the ash from the gasification process. Approximately 0.164 ton of carbon [17] is released per ton of MSW processed. Using current prices of carbon permits in the ECX as a guide, the cost of carbon emissions is found to be between $2.61 and $5.39 for each ton of MSW in gasification. As we do not have access to specific information pertaining to the emissions from each of the two gasification processes, we assume the external costs of both processes to be within this range.
Benefits of gasification
The private benefits of gasification accrue from the generation of electricity. TPS Termiska and Battelle-Colombus generate 781 kWh and 703 kWh per ton of MSW processed respectively. Nevertheless, both facilities require power for the RDF conversion and gasification processes. Ultimately, TPS Termiska has an excess of 636 kWh while Battelle-Colombus has 612 kWh in excess per ton of MSW treated [17]. Table 10 shows the power output and requirements of both processes.

19
Power input/output TPS Termiska plant Battelle-Colombus plant
Annual gross power production 781 703 Power requirements for RDF process 130 70 Power requirements for gasification process 15 21 Excess power for sale 636 612
Table 10 Power output and requirements of both TPS Termiska and Battelle-Colombus plants.
As before, we use Coffey’s 50% benchmark and the current residential electricity
rate of $0.203 to compute the private benefits accruing from electrical generation. The private benefits associated with electricity generation are $64.55 and $62.12 per ton of MSW for the TPS Termiska and Battelle-Colombus plants respectively.
Correspondingly, we calculate the reduction in external costs on the environment associated with electricity generation. Earlier, we concluded that $0.0577 is the environmental cost associated with supplying 1kWh of electricity. Therefore, the avoided environmental costs are $36.70 and $35.31 per ton of MSW for the TPS Termiska and Battelle-Colombus plants respectively.
Net social costs of gasification
Combining the estimates for benefits and costs, we conclude that the net costs to society from managing one ton of MSW via gasification range from -$57.85 to $45.97 in the TPS Termiska plant and from -$23.59 to -$4.99 in the Battelle-Colombus plant. Note that for both plants, the net social costs are negative, implying that the total benefits to society exceed the total costs of managing 1 ton of MSW using gasification techniques. The breakdown of the different components of costs and benefits is summarized in Tables 11 and 12.
Costs per ton MSW Low High Private costs Annualized capital costs $24.23 $29.65 Yearly operating costs $16.56 $20.24
External costs Carbon emissions from gasification process $2.61 $5.39
Total social costs= Private costs + External costs $43.40 $55.28 Benefits per ton MSW High Low Private benefits Electricity generation $64.55
External benefits Avoided environmental cost associated with electricity generation $36.70
Total social benefits= Private benefits + External benefits $101.25 Net social costs= Total social costs - Total social benefits -$57.85 -$45.97
Table 11: Summary of costs and benefits of option 3a: gasification (TPS Termiska plant) (measured in 2007$/ton MSW).

20
Costs per ton MSW Low High Private costs Annualized capital costs $21.55 $26.33 Yearly operating costs $49.68 $60.72
External costs Carbon emissions from gasification process $2.61 $5.39
Total social costs= Private costs + External costs $73.84 $92.44 Benefits per ton MSW High Low Private benefits Electricity generation $62.12
External benefits Avoided environmental cost associated with electricity generation $35.31
Total social benefits= Private benefits + External benefits $97.43 Net social costs= Total social costs - Total social benefits -$23.59 -$4.99
Table 12: Summary of costs and benefits of option 3b: gasification (Battelle-Colombus plant) (measured in 2007$/ton MSW). 3.4 Caveats of the Cost-Benefit Analysis
There are two main caveats that need to be considered when using the results of
the cost-benefit analysis. The first caveat pertains to the existence of uncertainties in quantifying the costs and benefits of each WTE technology. Uncertainties can arise in three main areas, namely (1) in estimating the environmental costs of emissions, (2) in quantifying capital and operation costs; and (3) in estimating the overall electricity generation when specific types of waste streams are used.
Firstly, inherent uncertainty is present in estimating the marginal damage cost
(MDC) function of pollutants, which is critical in quantifying the environmental costs of emissions from incineration. It is difficult to place exact dollar values on human and ecological health and there has been considerable scientific debate about the level of impact from different pollutants. In general, the MDCs were estimated outside Singapore, in areas with temperate climates and a wide range of population densities (spanning rural to urban areas) [18]. The high level of annual precipitation in Singapore would mean higher levels of wet deposition of air pollutants due to faster washout rates. In addition, Singapore is located in the tropics and experiences warm and humid summer temperatures throughout the year (approximately 74ºF to 86ºF). This would mean a much faster rate of chemical reactions. There is also a high population density in Singapore since it is a city-state. All these factors lead to greater environmental impacts in Sinapore than might be predicted by the MDCs used in this study. As a result, the figures may underestimate the actual impacts of the various facilities. As far as possible, we have chosen to develop a range of values for the MDCs to reflect the inherent uncertainties.
Secondly, uncertainties also arise in the estimation of the capital and operation
costs for the various WTE facilities, especially for the anaerobic digestion plants and the gasification plants. Most of these plants were built in the last decade. Since the 1990s, there may have been a further decrease in the production costs due to research and development. Moreover, costs depend very much on the scale of production. Due to the presence of high fixed costs (in building the plants), there are economies of scale to be

21
reaped from expanding production. For example, the anaerobic digestion plants studied in this analysis all have annual waste management capacities of under 100,000 tons of MSW respectively. The capacities of these plants are much smaller than the IUT Global plant, the only anaerobic digestion plant in Singapore, which started operation in 2007 and has a capacity of 292,000 tons per year [26]. As such, the capital and operating costs for the anaerobic digestion plants and gasification plants in this paper may have been overestimated.
A final source of uncertainty arises in estimating the total electricity generated
when specific types of waste streams are used. In this study, we have chosen to use 1 ton of MSW as the common denominator to facilitate comparisons of the costs and benefits across the 3 options. Nevertheless, it is possible to sort the MSW into specific waste streams before feeding them into the digesters or gasifiers. Since the calorific contents of different waste streams vary, this will affect the estimates of the overall electricity generation. Using the earlier example of the IUT Global plant once again, the plant specializes in the management of food waste and horticultural waste, which are sorted out from the other waste streams before the anaerobic digestion process. Consequently, the amount of electricity generated is as much as 180kWh for each ton of food and horticultural waste processed [26], exceeding the range of 46.39 to 103.61kWh for each ton of generic MSW processed, as calculated in Option 2. Clearly, the use of specific combinations of waste streams tailored to suit the processes may lead to larger electrical generation capacity and thus cause the benefits to be underestimated in this paper.
The second caveat pertains to the presence of unquantifiable costs and benefits
associated with the 3 options studied. On the cost side, there may be significant odors associated with the WTE plants. The presence of such plants may also be unpleasant aesthetically to the surrounding residents, and has the potential of causing a decrease in real estate value in the surrounding areas. On the other hand, there are unquantifiable benefits arising from the development of the WTE industry in Singapore. The industry has potential for growth and is currently in its nascent stage in Asia. If Singapore is able to secure a first mover advantage in this industry, it can become a sustainable source of economic growth and employment. Another concomitant benefit that is difficult to quantify is the diversification of energy sources and consequent improvement in energy security with the development of new WTE technologies. Perhaps, the government can undertake a contingent valuation study in Singapore to estimate these unquantifiable costs and benefits.
22
4. Policy implications and conclusion
One of the most salient implications arising from this study is the need to review the current status quo of incineration. The results of the cost-benefit analysis of the two commercially viable gasification technologies indicate that gasification can be an environmentally superior and more cost competitive option than incineration. The net social costs of managing 1 ton of MSW using incineration are in the range of $0.23 to $13.11. However, if gasification were used instead, there is an accrual of net social benefits of between $4.99 and $57.85. This resonates with the idea that waste can become a resource, hence allowing a waste management problem to become an energy generating solution. There are currently no gasification plants in Singapore. Therefore, we recommend the government to look beyond incineration and examine the possibility of incorporating gasification into the WTE framework in Singapore.
Gasification presents several advantages over incineration. It takes place in a low
oxygen environment that limits the formation of dioxins, SOx and NOx. Also, gasification generates syngas that can be integrated with combined cycle turbines, reciprocating engines and potentially fuel cells that produce electricity more than twice as efficiently as conventional steam boilers [17]. Nevertheless, there have been concerns about gasification on a large scale, which may lead to the formation of tars (heavy organic compounds). These tars can cause significant fouling in downstream gas cleaning processes and energy conversion devices [17]. If gasification is to be implemented on a large scale in Singapore, the government should look into procuring catalysts and system designs that more thoroughly eliminate tars in the product gas. This will ensure the reliability and longer operational capability of the gasifiers and turbines. It will also improve the chemical to electricity efficiencies, resulting in the increased generation of electrical energy from waste.
As for anaerobic digestion, the cost-benefit study has shown that its net social
costs per ton MSW are between $49.07 and $116.23, which are significantly higher than waste management under both incineration and gasification. Nevertheless, it does not imply that we should completely dismiss the use of such WTE technology in Singapore. As discussed in the previous section, the production costs of the anerobic digestion plants have been overestimated since both the Valorga and DRANCO plants are small in scale (annual waste management capacity of less than 100,000 tons of MSW). In comparison, IUT Global, the one and only anaerobic digestion plant in Singapore is likely to be more cost-effective since it has a capacity of almost 300,000 tons of MSW and can exploit economies of scale. In addition, it uses only specific waste streams in the process by sorting the MSW and only feeding food and horticultural waste into the digesters. This leads to a higher amount of electrical energy generated for each ton of MSW.
The WTE alternatives proposed in this study are not meant to overtake the
position of incineration as the main WTE technology in Singapore, since the incineration plants and infrastructure have already been established. Nevertheless, the government can consider the construction of gasification plants or even anaerobic digestion plants, instead of new incineration plants in their future plans to expand the waste management capacity
23
of Singapore. The government can also consider further deregulating the waste management industries to allow the entry of private sector players with access to alternative WTE technologies, such as the IUT Global anaerobic digestion plant established in 2007 in Singapore. Nevertheless, the government would need to continue regulating the emissions from these WTE plants and their locations, since they are associated with negative externalities such as unpleasant odors and aesthetics.
With an increasingly developed WTE industry sector, Singapore can also
capitalize on its first mover advantage in WTE technology in Southeast Asia. There is a potential for Singapore to become a center for WTE research and become an exporter of WTE technologies to surrounding countries. The demand for WTE technologies is rising in recent years due to increased awareness of the detriments of direct landfilling, which is widely practiced in surrounding countries such as Indonesia and Malaysia. These landfills are the source of large emissions of methane to the atmosphere and methane gas has a global warming potential that is over 20 times that of carbon dioxide. With the creation of the market for greenhouse gas reduction credits under the Clean Development Mechanism (CDM), WTE plants will become an attractive means of earning greenhouse gas reduction credits [13]. Against such a backdrop, there are much opportunities arising from WTE for industry development and the creation of employment.
As a conclusion, the conversion of MSW to energy has significant environmental
advantages and even has the potential to yield net social benefits to society, as seen in the case of gasification. Among the three WTE technologies studied in this paper, gasification is the most cost competitive and has superior environmental performance. It is recommended that the government looks beyond incineration and consider other alternative WTE technologies such as gasification and anaerobic digestion, in order to establish a comprehensive WTE framework in Singapore. WTE can serve as an alternative source of energy, contributing to the diversification of energy sources and improving Singapore’s energy security. Finally, it should be noted that WTE is not in competition with recycling, but rather its complement in an integrated waste management plan [17]. Even where there is aggressive source reduction and recycling, there is a significant amount that ends up as unrecyclable waste. Recycling helps to sort out the recyclables from the other waste, which could then be effectively converted into energy generating resources through the various WTE technologies.

24
Bibliography
[1] Department of Statistics (2008). Key annual indicators. Retrieved on Nov 18, 2008, from http://www.singstat.gov.sg/stats/ keyind.html [2] National Environment Agency (2008). Waste statistics and recycling rate for 2007. Retrieved on Nov 14, 2008, from http://app.nea.gov.sg/cms/htdocs/article.asp?pid=2706 [3] Columbia University (2004). Waste Map. Retrieved on Nov 14, 2008, from http://www.seas.columbia.edu/earth/recycle/ [4] Ministry of Environment and Water Resources (2006). Singapore Green Plan. Retrieved on Nov 2, 2008, from http://www.mewr.gov.sg/sgp2012/ [5] National Environment Agency (2002). Guidebook on waste minimization for industries. Retrieved on Nov 4, 2008, from http://www.nea.gov.sg/cms/rcd/guidebook/Guidebook.pdf [6] Weinstein, P. (2006). Waste-to-energy as a key component of integrated solid waste management for Santiago, Chile: A cost-benefit analysis. Fu Foundation School of Engineering and Applied Science, Columbia University. [7] Earth Institute Newsletter for Cross-Cutting Research (2005). Making energy from waste. Retrieved on Nov 4, 2008, from http://www.seas.columbia.edu/earth/wtert/sofos/Making%20Energy%20from%20Waste%20Summer%202005.pdf [8] Tchobanoglous, G., Theisen, H., and Vigil, S. (1993). Integrated Solid Waste Management, chapter 9, McGraw-Hill, New York. [9] Kayhanian, M. (1995). Biodegradability of the organic fraction of municipal solid waste in a high solids anaerobic digester, Waste Management & Research 13, 123-136 [10] Ting, H., Coyne, K., and Kong, H. (2006). Sustainable design for lumber company power generation. Smith College. [11] National Climate Change Committee (2007). Biomass: waste to energy plants. Retrieved on Nov 4, 2008, from http://www.nccc.gov.sg/renewables/biomass.shtm [12] Combs, S. (2008). The Energy Report. Retrieved on Nov 8, 2008, from http://www.window.state.tx.us/specialrpt/energy/renewable/images/exhibit18-1.png [13] Verma, S. (2002). Anaerobic digestion of biodegradable organics in municipal solid wastes. Fu Foundation School of Engineering and Applied Science, Columbia University.
25
[14] Pyne IEA Bioenergy (2008). The biomass pyrolysis network. Retrieved on Nov 8, 2008, from http://www.pyne.co.uk [15] European Biomass Industry Association (2008). Pyrolysis. Retrieved on Nov 8, 2008, from http://www.eubia.org/211.0.html [16] U.S Department of Energy (2008). Ethanol feedstocks. Retrieved on Nov 9, 2008, http://www.afdc.energy.gov/afdc/ethanol/feedstocks.html [17] Klein, A. (2002). Gasification: an alternative process for energy recovery and disposal of municipal solid wastes. Fu Foundation School of Engineering and Applied Science, Columbia University. [18] Miranda, M.L., Hale, B. (2005). Paradise recovered: energy production and waste management in island environments. Energy Policy, 33, 1691-1702. [19] National Environment Agency (2002). Revision of refuse disposal and collection fees. Retrieved on Nov 1, 2008, from http://app.nea.gov.sg/cms/htdocs/article.asp?pid=1999 [20] SRI International (1992). Data summary of MSW management alternatives, volume I: report text. National Renewable Energy Laboratory. [21] Goodwin, R. (1993). Combustion ash/ residue management: an engineering perspective. Noyes, Park Ridge, NJ. [22] Coffey, J.M. (1995). Electricity prices and costs in the UK. Atomwirtschaft, Atomtechnik 40, 89. [23] Energy Market Authority (2008). Electricity tariffs. Retrieved on Oct 10, 2008, from http://www.ema.gov.sg/Electricity/introduction_to_sg.php?cat=industry [24] Holmgren, K., Amiri, S. (2007). Internalizing external costs of electricity and heat production in a municipal energy system. Energy Policy, 35, 5242-5253. [25] Point Carbon (2008). Carbon 2008. Industry report. [26] IUT Global (2007). Innovative waste technologies and solutions. Retrieved on Dec 2, 2008, from http://www.iutglobal.com [27] Koe, L., Wang, J.Y., Ding H.B. (2003). Waste management and waste-to-energy status in Singapore. Retrieved on Dec 1, 2008, from http://www.seas.columbia.edu/earth/wtert/globalwte_SA.html