material technology and testing (mnf 222)eng.modern-academy.edu.eg/e-learning/mech/mnf222... ·...
TRANSCRIPT

Material Technology and Testing
(MNF 222)
CHAPTER 5
The Iron Carbon System
1Material Technology and Testing Dr. Gamal Abdou
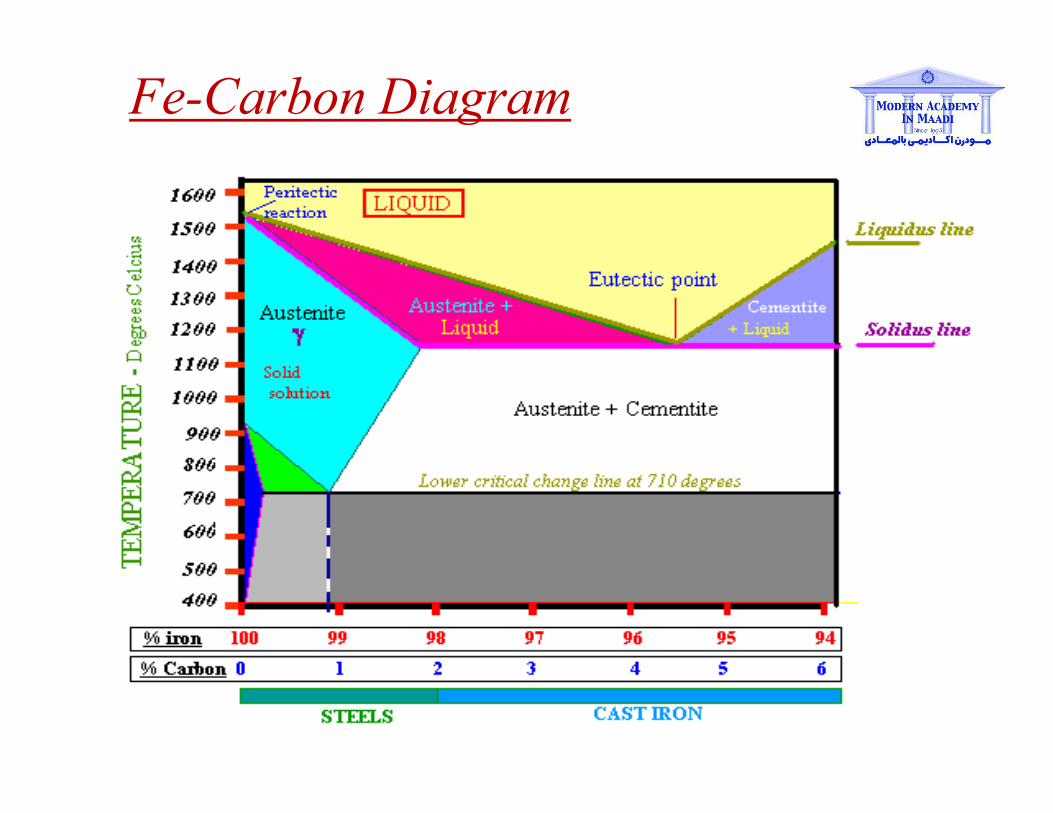
Fe-Carbon Diagram

Cooling curve for pure iron

Definition of structures
Various phases that appear on the
Iron-Carbon equilibrium phase diagram
are as under:
•Austenite
•Ferrite
•Pearlite
•Cementite
•Martensite*
•Ledeburite
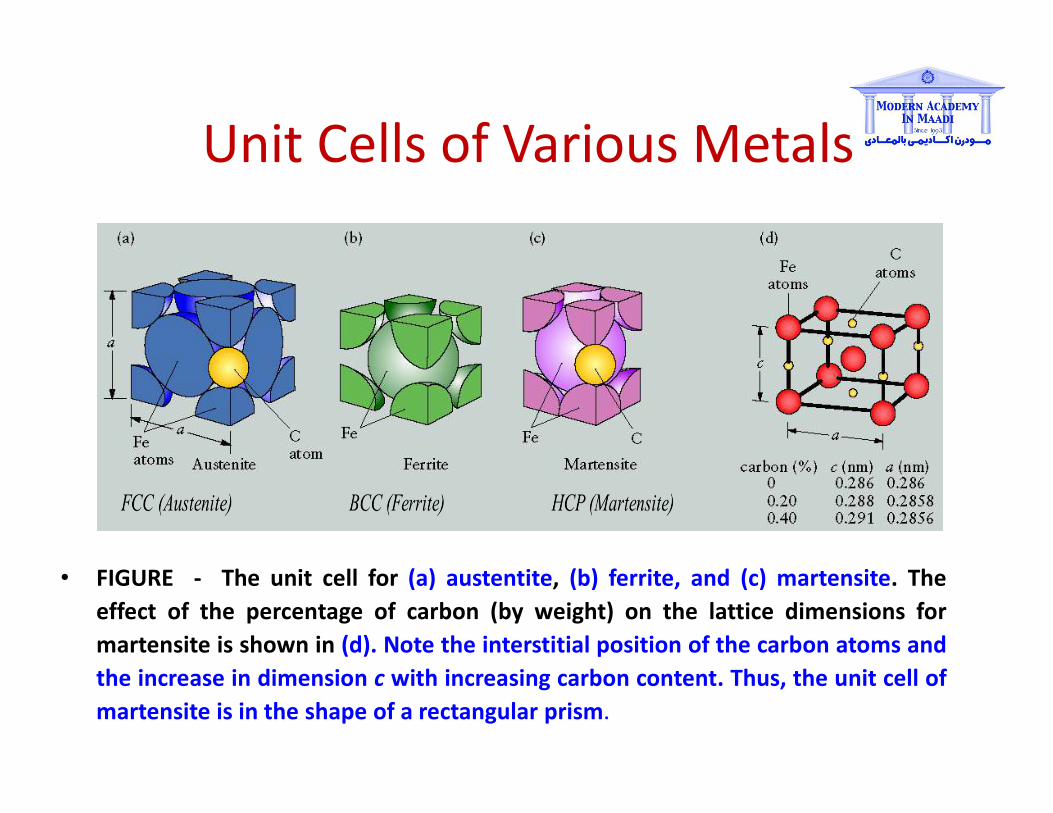
Unit Cells of Various Metals
• FIGURE - The unit cell for (a) austentite, (b) ferrite, and (c) martensite. The
effect of the percentage of carbon (by weight) on the lattice dimensions for
martensite is shown in (d). Note the interstitial position of the carbon atoms and
the increase in dimension c with increasing carbon content. Thus, the unit cell of
martensite is in the shape of a rectangular prism.
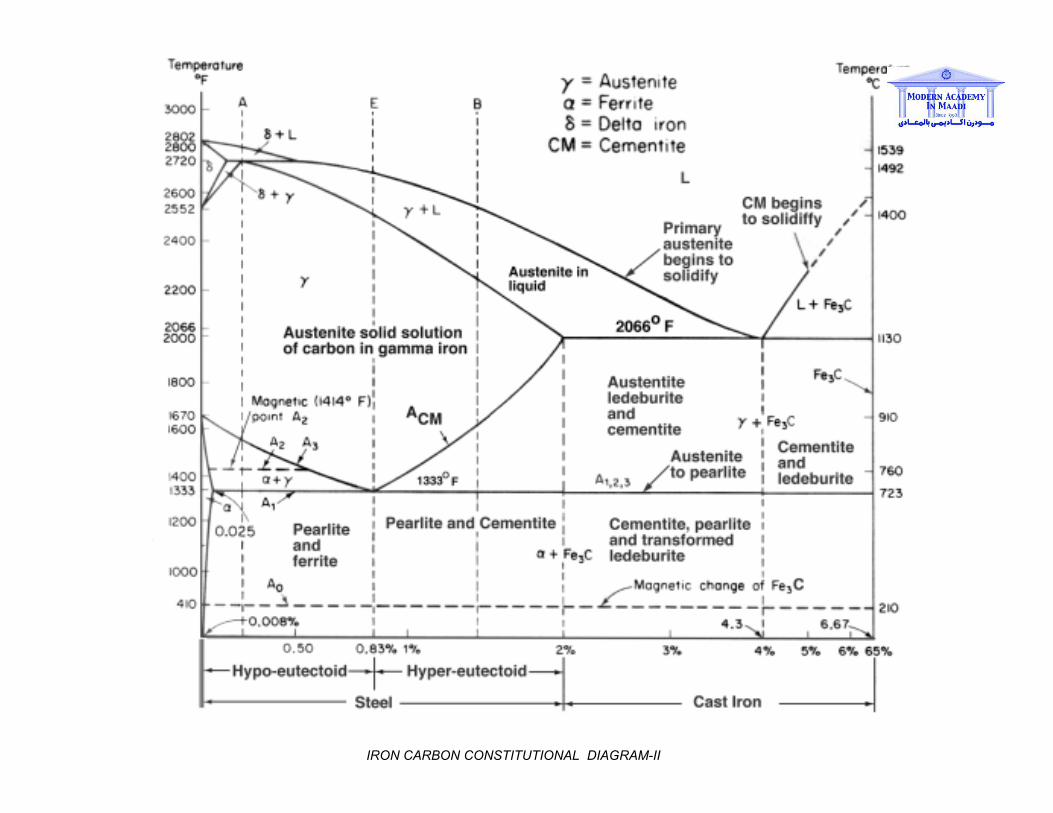
IRON CARBON CONSTITUTIONAL DIAGRAM-II

phases in the transformation, occurring with iron-carbon alloys:
L - Liquid solution of carbon in iron;
δ-ferrite – Solid solution of carbon in iron. Maximum
concentration of carbon in δ-ferrite is 0.09% at 2719 ºF (1493ºC)
– temperature of the peritectic transformation. The crystal
structure of δ-ferrite is BCC (cubic body centered).
Austenite – interstitial solid solution of carbon in γ-iron.
Austenite has FCC (cubic face centered) crystal structure,
permitting high solubility of carbon – up to 2.06% at 2097 ºF
(1147 ºC). Austenite does not exist below 1333 ºF (723ºC) and
maximum carbon concentration at this temperature is 0.83%.
α-ferrite – solid solution of carbon in α-iron. α-ferrite has BCC
crystal structure and low solubility of carbon – up to 0.25% at
1333 ºF (723ºC). α-ferrite exists at room temperature.
Cementite – iron carbide, intermetallic compound, having fixed
composition Fe3C.
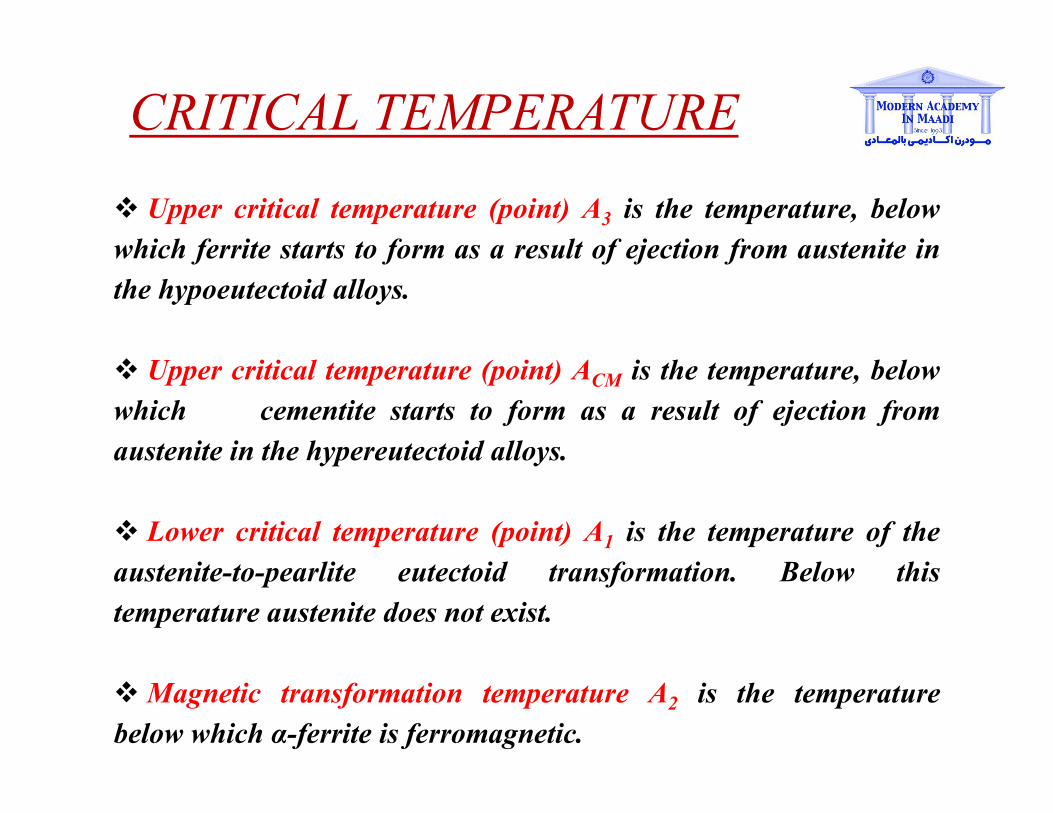
Upper critical temperature (point) A3 is the temperature, below
which ferrite starts to form as a result of ejection from austenite in
the hypoeutectoid alloys.
Upper critical temperature (point) ACM is the temperature, below
which cementite starts to form as a result of ejection from
austenite in the hypereutectoid alloys.
Lower critical temperature (point) A1 is the temperature of the
austenite-to-pearlite eutectoid transformation. Below this
temperature austenite does not exist.
Magnetic transformation temperature A2 is the temperature
below which α-ferrite is ferromagnetic.
CRITICAL TEMPERATURE

Various Features of Fe-C diagram
Peritectic L + d = g
Eutectic L = g + Fe3C
Eutectoid g = a + Fe3C
Phases present
L
Reactions
dBCC structure
Paramagnetic
g austenite
FCC structure
Non-magnetic
ductile
a ferrite
BCC structure
Ferromagnetic
Fairly ductile
Fe3C cementite
Orthorhombic
Hard
brittle
Max. solubility of C in ferrite=0.022%
Max. solubility of C in austenite=2.11%
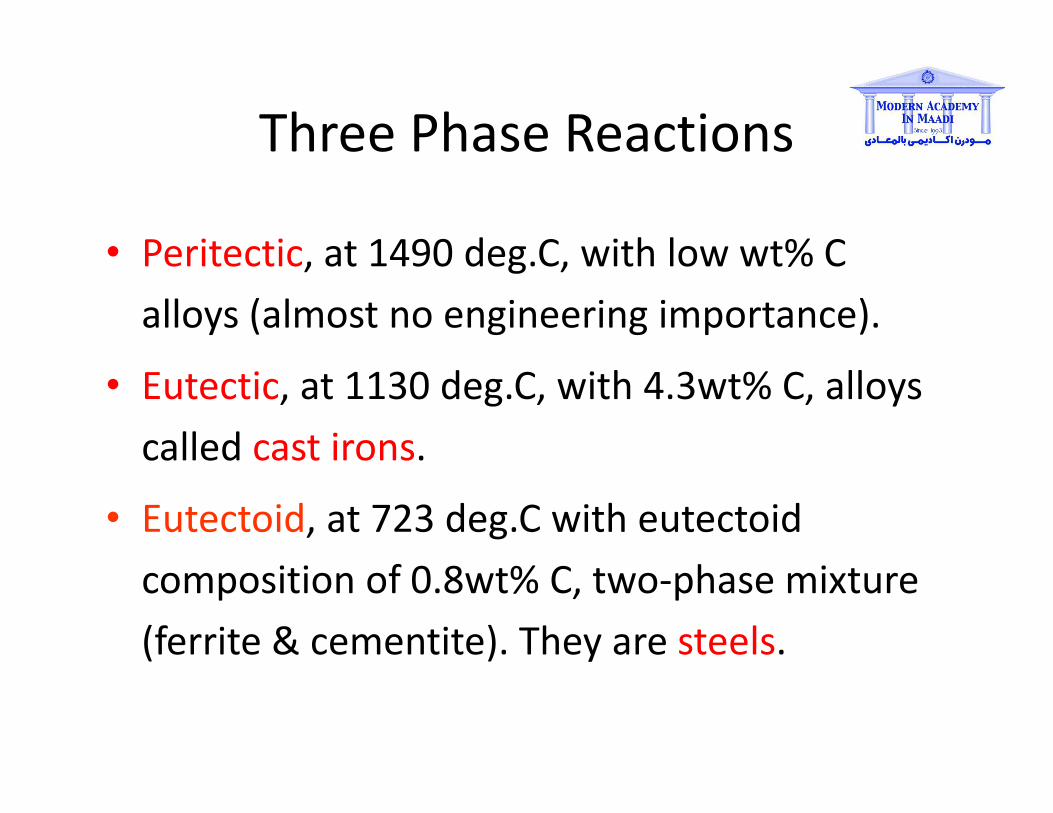
Three Phase Reactions
• Peritectic, at 1490 deg.C, with low wt% C
alloys (almost no engineering importance).
• Eutectic, at 1130 deg.C, with 4.3wt% C, alloys
called cast irons.
• Eutectoid, at 723 deg.C with eutectoid
composition of 0.8wt% C, two-phase mixture
(ferrite & cementite). They are steels.
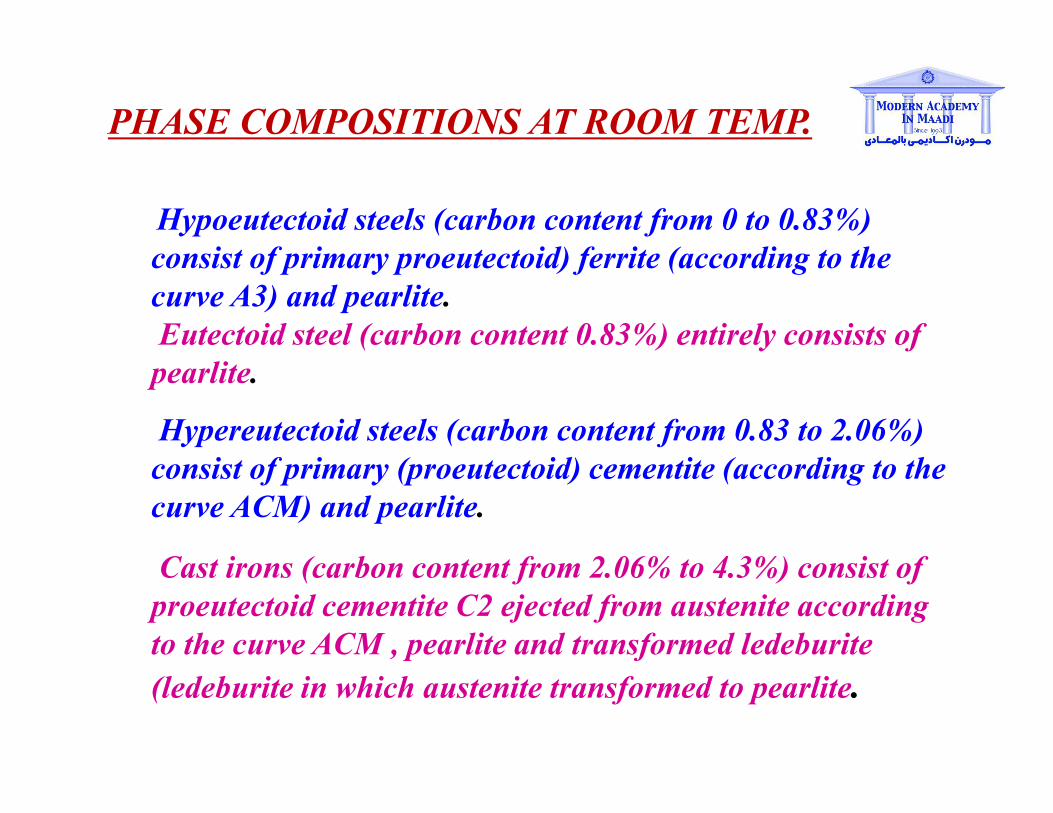
Hypoeutectoid steels (carbon content from 0 to 0.83%)
consist of primary proeutectoid) ferrite (according to the
curve A3) and pearlite.
Eutectoid steel (carbon content 0.83%) entirely consists of
pearlite.
Hypereutectoid steels (carbon content from 0.83 to 2.06%)
consist of primary (proeutectoid) cementite (according to the
curve ACM) and pearlite.
Cast irons (carbon content from 2.06% to 4.3%) consist of
proeutectoid cementite C2 ejected from austenite according
to the curve ACM , pearlite and transformed ledeburite
(ledeburite in which austenite transformed to pearlite.
PHASE COMPOSITIONS AT ROOM TEMP.
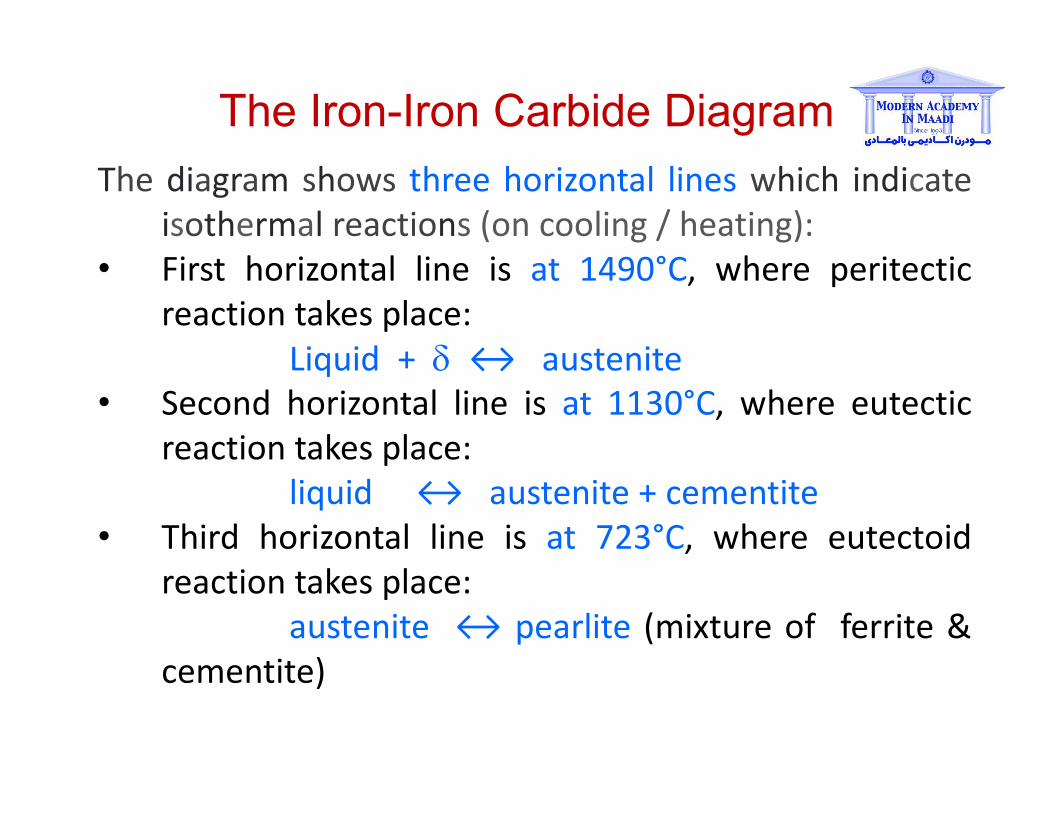
The Iron-Iron Carbide Diagram
The diagram shows three horizontal lines which indicate
isothermal reactions (on cooling / heating):
• First horizontal line is at 1490°C, where peritectic
reaction takes place:
Liquid + d ↔ austenite
• Second horizontal line is at 1130°C, where eutectic
reaction takes place:
liquid ↔ austenite + cementite
• Third horizontal line is at 723°C, where eutectoid
reaction takes place:
austenite ↔ pearlite (mixture of ferrite &
cementite)
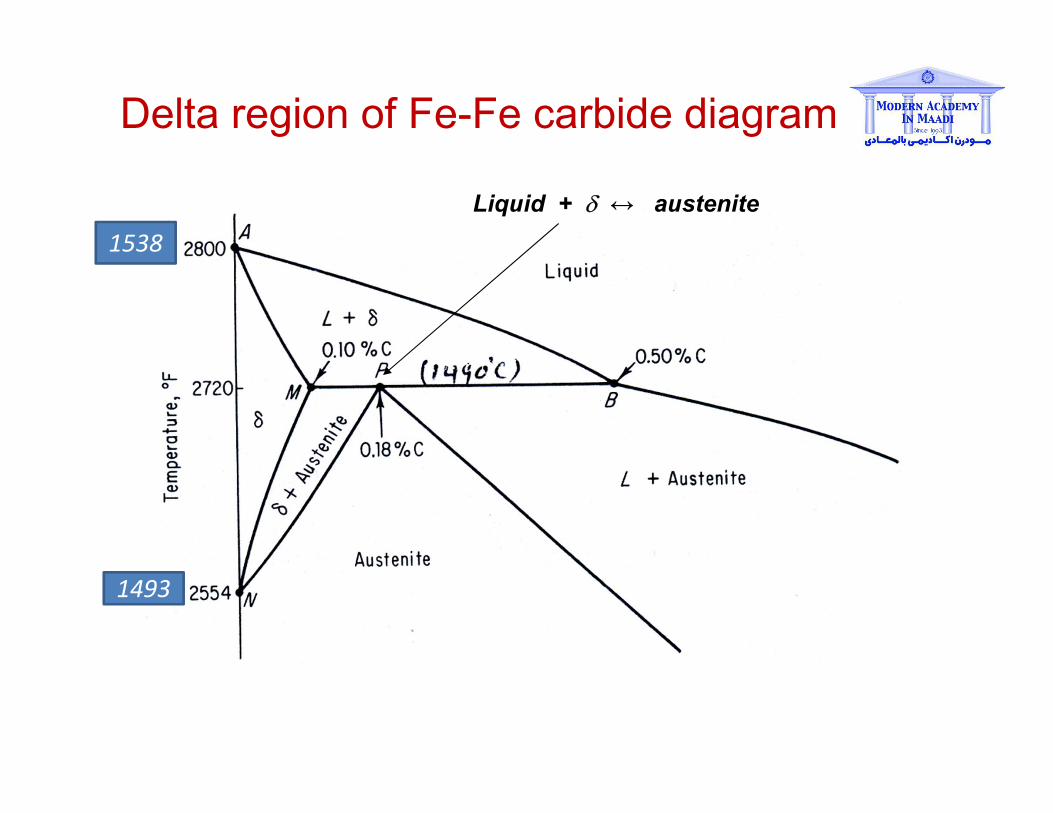
Delta region of Fe-Fe carbide diagram
Liquid + d ↔ austenite
1538
1493

Ferrite region of
Fe-Fe Carbide
diagram

Simplified Iron-Carbon phase diagram
austenite ↔ pearlite (mixture of ferrite & cementite)

The Austenite to ferrite / cementite transformation in relation to Fe-C diagram
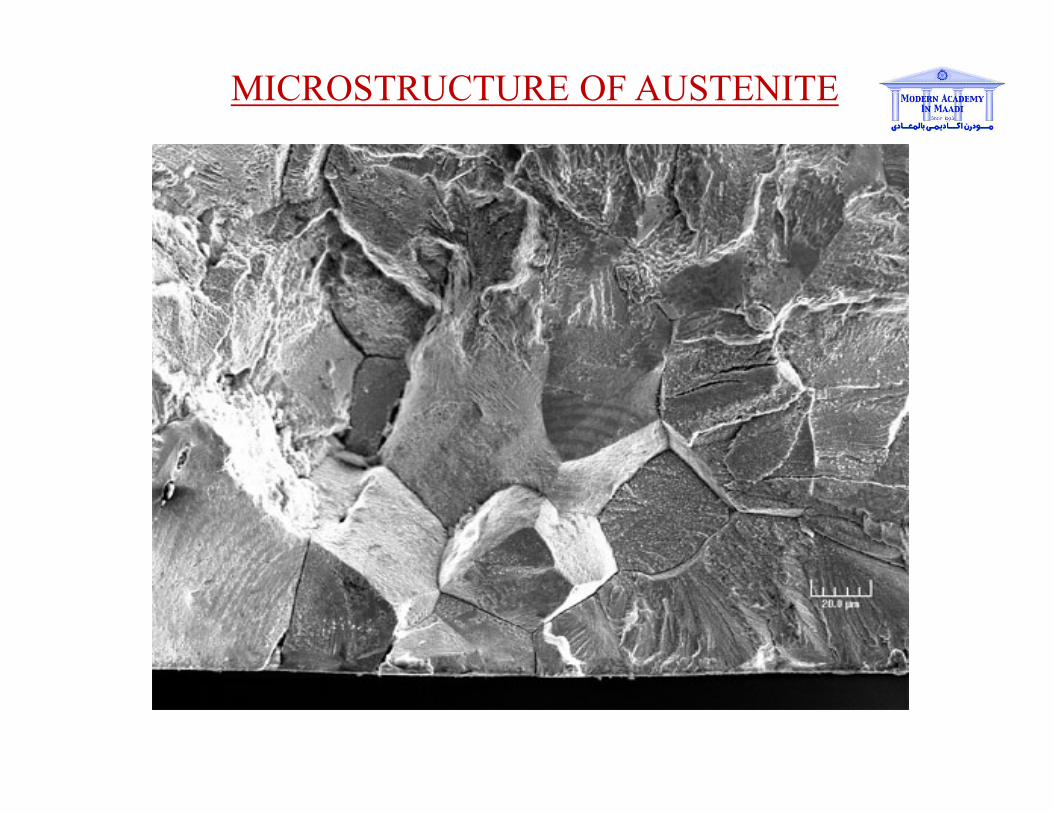
MICROSTRUCTURE OF AUSTENITE
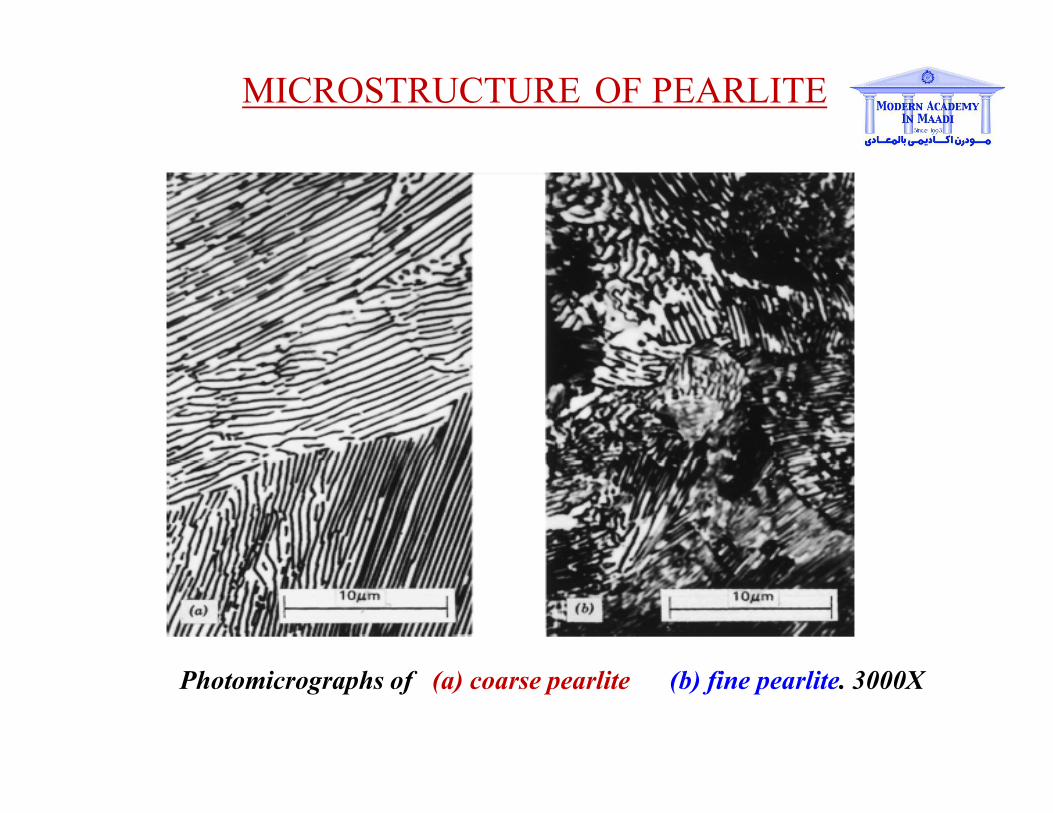
MICROSTRUCTURE OF PEARLITE
Photomicrographs of (a) coarse pearlite (b) fine pearlite. 3000X
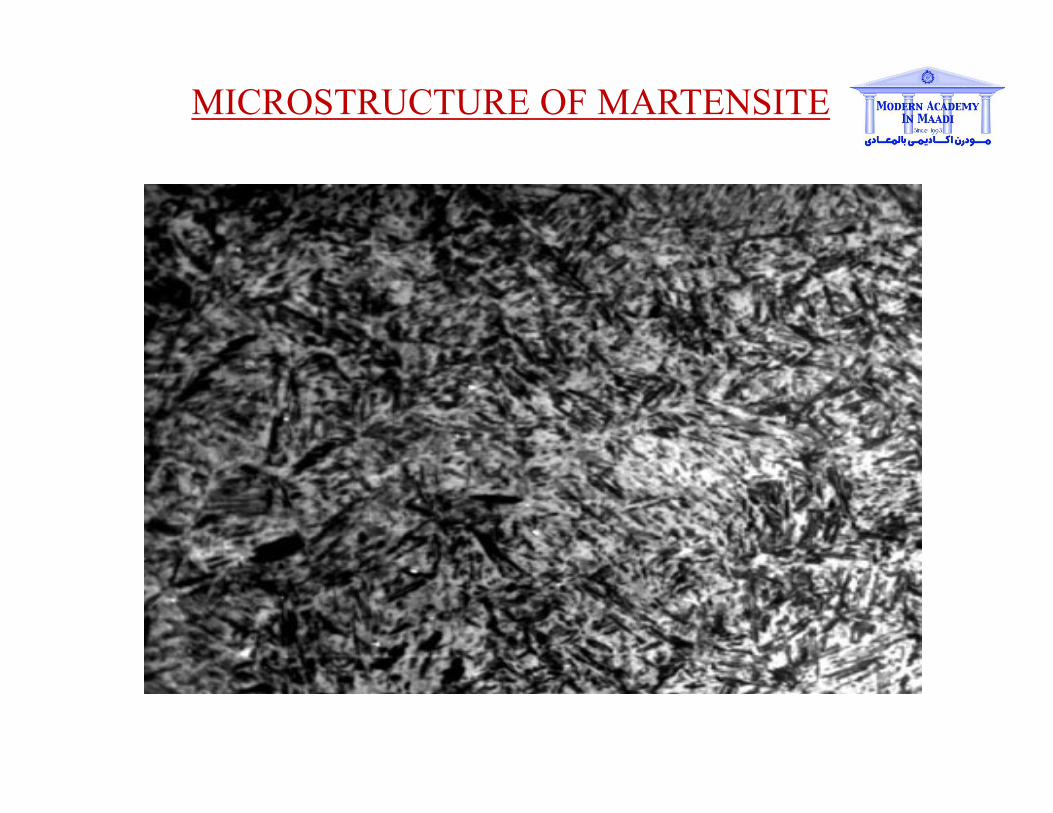
MICROSTRUCTURE OF MARTENSITE

20
IRON-CARBON (Fe-C) PHASE DIAGRAM
(EXAMPLE 1)• 2 important
points
- Eutectoid (B):g a +Fe3C
- Eutectic (A):L g +Fe3C
Adapted from Fig. 9.24,
Callister & Rethwisch 8e.
Fe
3C
(ce
me
ntite
)
1600
1400
1200
1000
800
600
4000 1 2 3 4 5 6 6.7
L
g
(austenite)
g+L
g+Fe3C
a+Fe3C
d
(Fe) C, wt% C
1148ºC
T(ºC)
a727ºC = Teutectoid
4.30
Result: Pearlite = alternating layers of a and Fe3C phases
120 mm
(Adapted from Fig. 9.27,
Callister & Rethwisch 8e.)
0.76
B
g g
gg
A L+Fe3C
Fe3C (cementite-hard)
a (ferrite-soft)
21
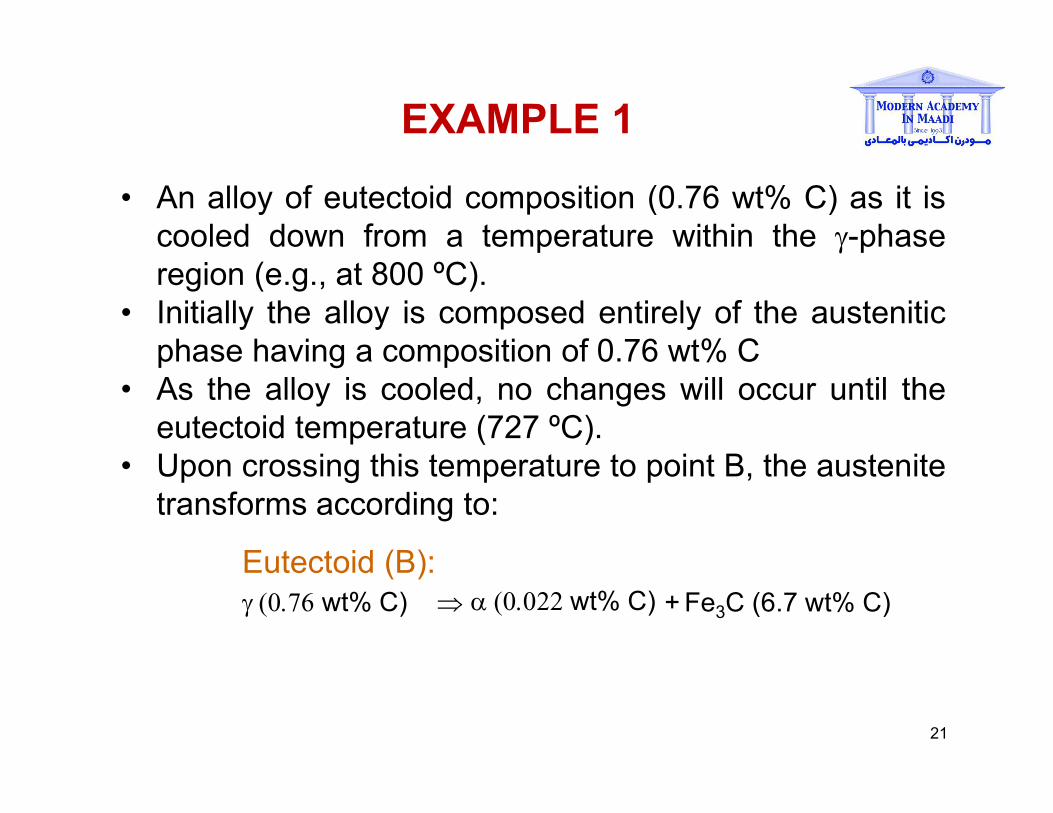
EXAMPLE 1
• An alloy of eutectoid composition (0.76 wt% C) as it is
cooled down from a temperature within the g-phase
region (e.g., at 800 ºC).
• Initially the alloy is composed entirely of the austenitic
phase having a composition of 0.76 wt% C
• As the alloy is cooled, no changes will occur until the
eutectoid temperature (727 ºC).
• Upon crossing this temperature to point B, the austenite
transforms according to:
Eutectoid (B):
g (0.76 wt% C) a (0.022 wt% C) + Fe3C (6.7 wt% C)
22
EXAMPLE 1 (cont.)
• The microstructure for this eutectoid steel is slowly
cooled through the eutectoid temperature consists of
alternating layers or lamellae of the two phases (a andFe3C) that form simultaneously during the
transformation.
• Point B is called pearlite.
• Mechanically, pearlite has properties intermediate
between the soft, ductile ferrite and the hard, brittle
cementite.

23
EXAMPLE 1 (cont.)
• The alternating a and Fe3C layers in pearlite form as
such for the same reason that the eutectic structure
forms because the composition of austenite (0.76 %wt
C) is different from either of ferrite (0.022 wt% C) and
cementite (6.70 wt% C), and the phase transformation
requires that there be a redistribution of the carbon by
diffusion.
• Subsequent cooling of the pearlite from point B will
produce relatively insignificant microstructural changes.

24
Fe
3C
(ce
me
ntite
)
1600
1400
1200
1000
800
600
4000 1 2 3 4 5 6 6.7
L
g
(austenite)
g+L
g + Fe3C
a+ Fe3C
L+Fe3C
d
(Fe) C, wt% C
1148ºC
T(ºC)
a727ºC
(Fe-C
System)
C0
0.7
6
Hypoeutectoid Steel (EXAMPLE 2)
Adapted from Figs. 9.24
and 9.29,Callister &
Rethwisch 8e.
(Fig. 9.24 adapted from
Binary Alloy Phase
Diagrams, 2nd ed., Vol.
1, T.B. Massalski (Ed.-in-
Chief), ASM International,
Materials Park, OH,
1990.)
Adapted from Fig. 9.30, Callister & Rethwisch 8e.
proeutectoid ferritepearlite
100 mmHypoeutectoid
steel
a
pearlite
g
g g
ga
aa
ggg g
g g
gg

25
EXAMPLE 2 (cont.)
• Within the a + g region, most of the a particles will form
along the original g grain boundaries.
• The particles will grow larger just above the eutectoidline. As the temperature is lowered below T
e, all the g
phase will transform to pearlite according to:
• There will be virtually no change in the a phase thatexisted just above the T
e.
• This a that is formed above Te
is called proeutectoid
(pro=pre=before eutectoid) ferrite.
g a +Fe3C

26
EXAMPLE 2 (cont.)
• The ferrite that is present in the pearlite is called
eutectoid ferrite.
• As a result, two microconstituents are present in thelast micrograph (the one below T
e): proeutectoid ferrite
and pearlite

27
Fe
3C
(ce
me
ntite
)
1600
1400
1200
1000
800
600
4000 1 2 3 4 5 6 6.7
L
g
(austenite)
g+L
g + Fe3C
a+ Fe3C
L+Fe3C
d
(Fe) C, wt% C
1148ºC
T(ºC)
a727ºC
(Fe-C
System)
C0
0.7
6
EXAMPLE 2
g
g g
ga
aa
srWa = s/(r +s)
Wg =(1 - Wa)R S
a
pearlite
Wpearlite = Wg
Wa’ = S/(R +S)
W =(1 – Wa’)Fe3C
Adapted from Figs. 9.24
and 9.29,Callister &
Rethwisch 8e.
(Fig. 9.24 adapted from
Binary Alloy Phase
Diagrams, 2nd ed., Vol.
1, T.B. Massalski (Ed.-in-
Chief), ASM International,
Materials Park, OH,
1990.)
Adapted from Fig. 9.30, Callister & Rethwisch 8e.
proeutectoid ferritepearlite
100 mmHypoeutectoid
steel

28
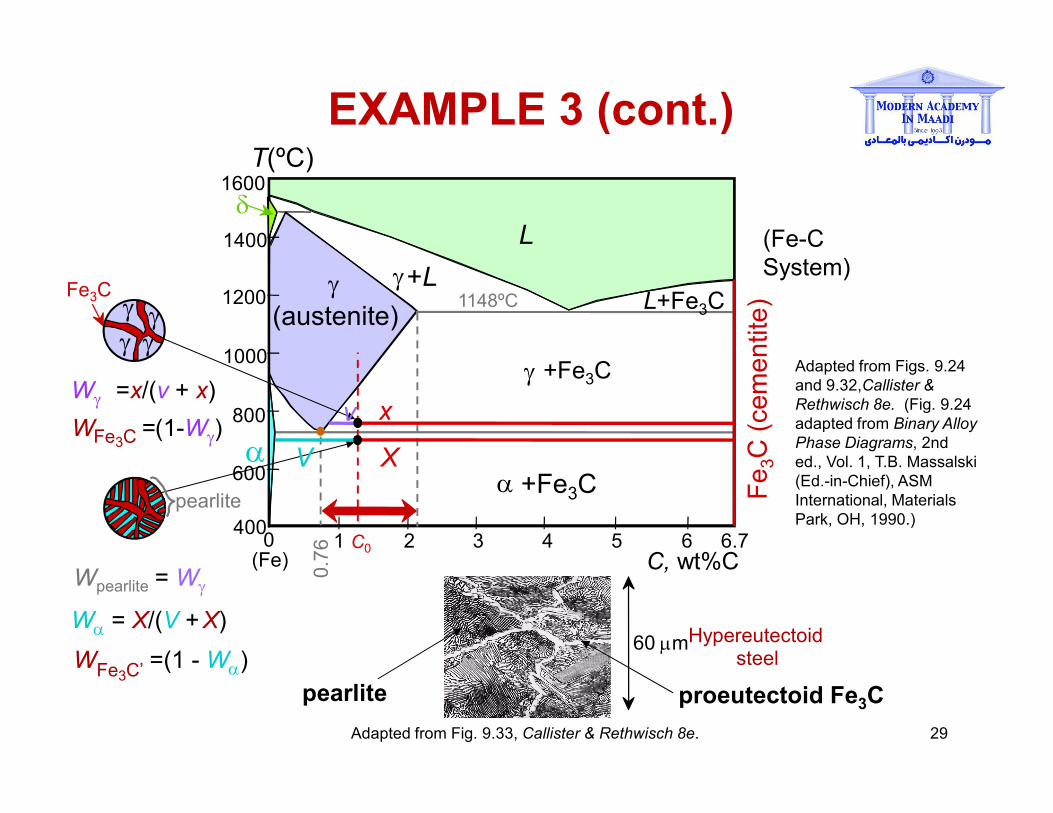
HYPEREUTECTOID STEEL (EXAMPLE 3)
Fe
3C
(ce
me
ntite
)
1600
1400
1200
1000
800
600
4000 1 2 3 4 5 6 6.7
L
g
(austenite)
g+L
g +Fe3C
a +Fe3C
L+Fe3C
d
(Fe) C, wt%C
1148ºC
T(ºC)
a
Adapted from Figs. 9.24
and 9.32,Callister &
Rethwisch 8e. (Fig. 9.24
adapted from Binary Alloy
Phase Diagrams, 2nd
ed., Vol. 1, T.B. Massalski
(Ed.-in-Chief), ASM
International, Materials
Park, OH, 1990.)
(Fe-C
System)
0.7
6 C0
Fe3C
gg
g g
ggg g
ggg g
Adapted from Fig. 9.33, Callister & Rethwisch 8e.
proeutectoid Fe3C
60 mmHypereutectoid steel
pearlite
pearlite
29
Fe
3C
(ce
me
ntite
)
1600
1400
1200
1000
800
600
4000 1 2 3 4 5 6 6.7
L
g
(austenite)
g+L
g +Fe3C
a +Fe3C
L+Fe3C
d
(Fe) C, wt%C
1148ºC
T(ºC)
a
EXAMPLE 3 (cont.)
(Fe-C
System)
0.7
6 C0
pearlite
Fe3C
gg
g g
xv
V X
Wpearlite = Wg
Wa = X/(V +X)
W =(1 - Wa)Fe3C’
W =(1-Wg)
Wg =x/(v + x)
Fe3C
Adapted from Fig. 9.33, Callister & Rethwisch 8e.
proeutectoid Fe3C
60 mmHypereutectoid steel
pearlite
Adapted from Figs. 9.24
and 9.32,Callister &
Rethwisch 8e. (Fig. 9.24
adapted from Binary Alloy
Phase Diagrams, 2nd
ed., Vol. 1, T.B. Massalski
(Ed.-in-Chief), ASM
International, Materials
Park, OH, 1990.)
30
PROBLEM
For a 99.6 wt% Fe-0.40 wt% C steel at a temperature just
below the eutectoid, determine the following:
a) The compositions of Fe3C and ferrite (a).
b) The amount of cementite (in grams) that forms in 100 g
of steel.
c) The amounts of pearlite and proeutectoid ferrite (a) in
the 100 gr.

31
SOLUTION TO PROBLEM
WFe3C R
R + S
C0 Ca
CFe3C Ca
0.40 0.022
6.70 0.022 0.057
b) Using the lever rule with
the tie line shown
a) Using the RS tie line just below the eutectoid
Ca = 0.022 wt% C
CFe3C = 6.70 wt% C
Fe
3C
(ce
me
ntite
)
1600
1400
1200
1000
800
600
4000 1 2 3 4 5 6 6.7
L
g (austenite)
g+L
g + Fe3C
a + Fe3C
L+Fe3C
d
C, wt% C
1148ºC
T(ºC)
727ºC
C0
R S
CFe C3Ca
Amount of Fe3C in 100 g
= (100 g)WFe3C
= (100 g)(0.057) = 5.7 g
32
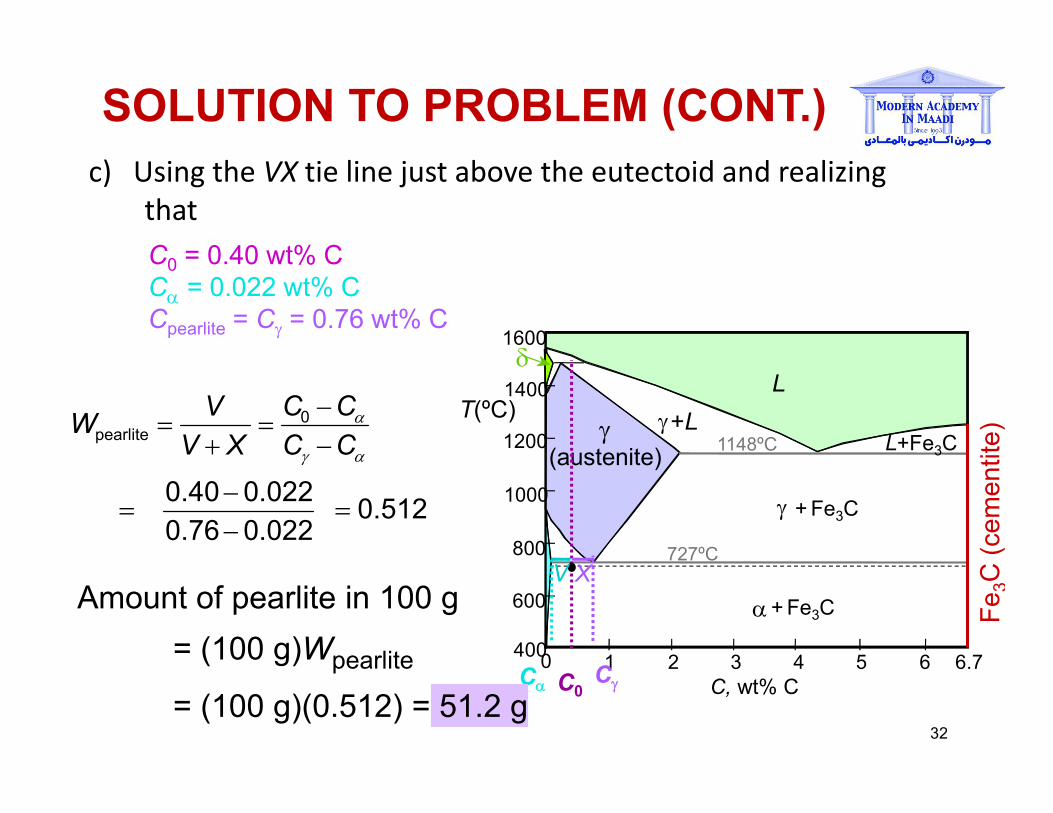
c) Using the VX tie line just above the eutectoid and realizing
that
C0 = 0.40 wt% C
Ca = 0.022 wt% C
Cpearlite = Cg = 0.76 wt% C
Fe
3C
(ce
me
ntite
)
1600
1400
1200
1000
800
600
4000 1 2 3 4 5 6 6.7
L
g (austenite)
g+L
g + Fe3C
a + Fe3C
L+Fe3C
d
C, wt% C
1148ºC
T(ºC)
727ºC
C0
V X
CgCa
Wpearlite V
V + X
C0 Ca
Cg Ca
0.40 0.022
0.76 0.022 0.512
Amount of pearlite in 100 g
= (100 g)Wpearlite
= (100 g)(0.512) = 51.2 g
SOLUTION TO PROBLEM (CONT.)
33
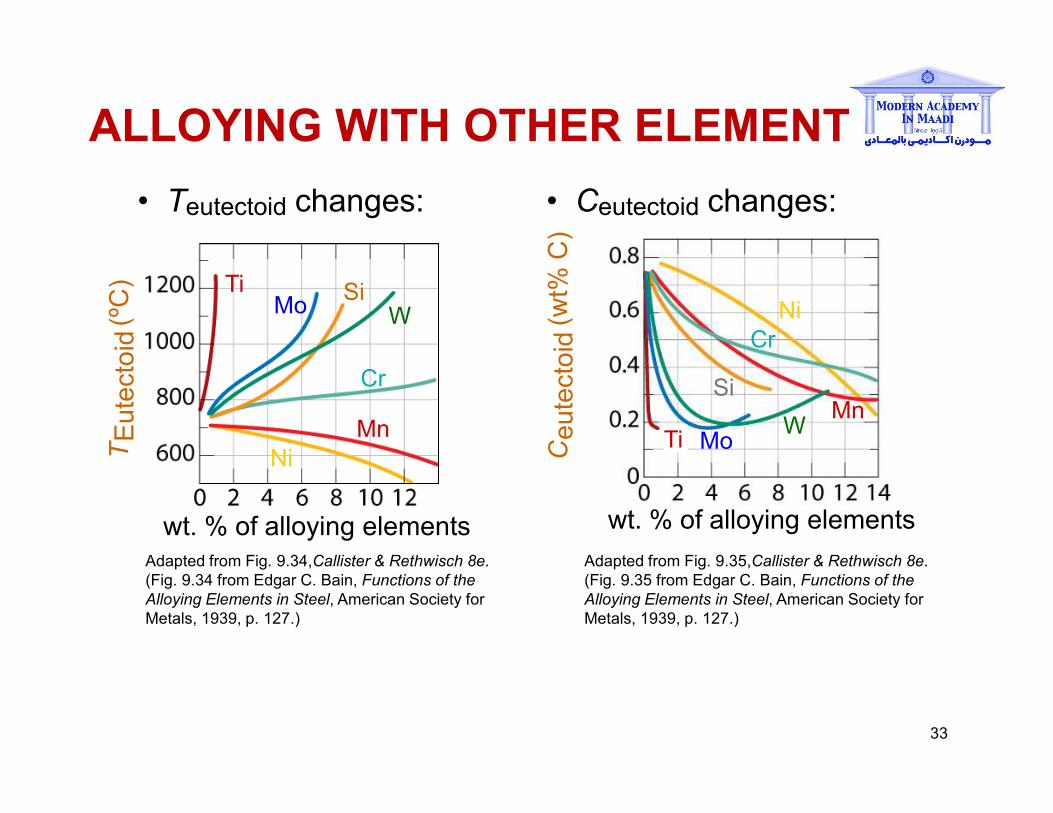
ALLOYING WITH OTHER ELEMENTS
• Teutectoid changes:
Adapted from Fig. 9.34,Callister & Rethwisch 8e.
(Fig. 9.34 from Edgar C. Bain, Functions of the
Alloying Elements in Steel, American Society for
Metals, 1939, p. 127.)
TE
ute
cto
id(º
C)
wt. % of alloying elements
Ti
Ni
MoSi
W
Cr
Mn
• Ceutectoid changes:
Adapted from Fig. 9.35,Callister & Rethwisch 8e.
(Fig. 9.35 from Edgar C. Bain, Functions of the
Alloying Elements in Steel, American Society for
Metals, 1939, p. 127.)
wt. % of alloying elements
Ce
ute
cto
id(w
t% C
)
Ni
Ti
Cr
SiMn
WMo